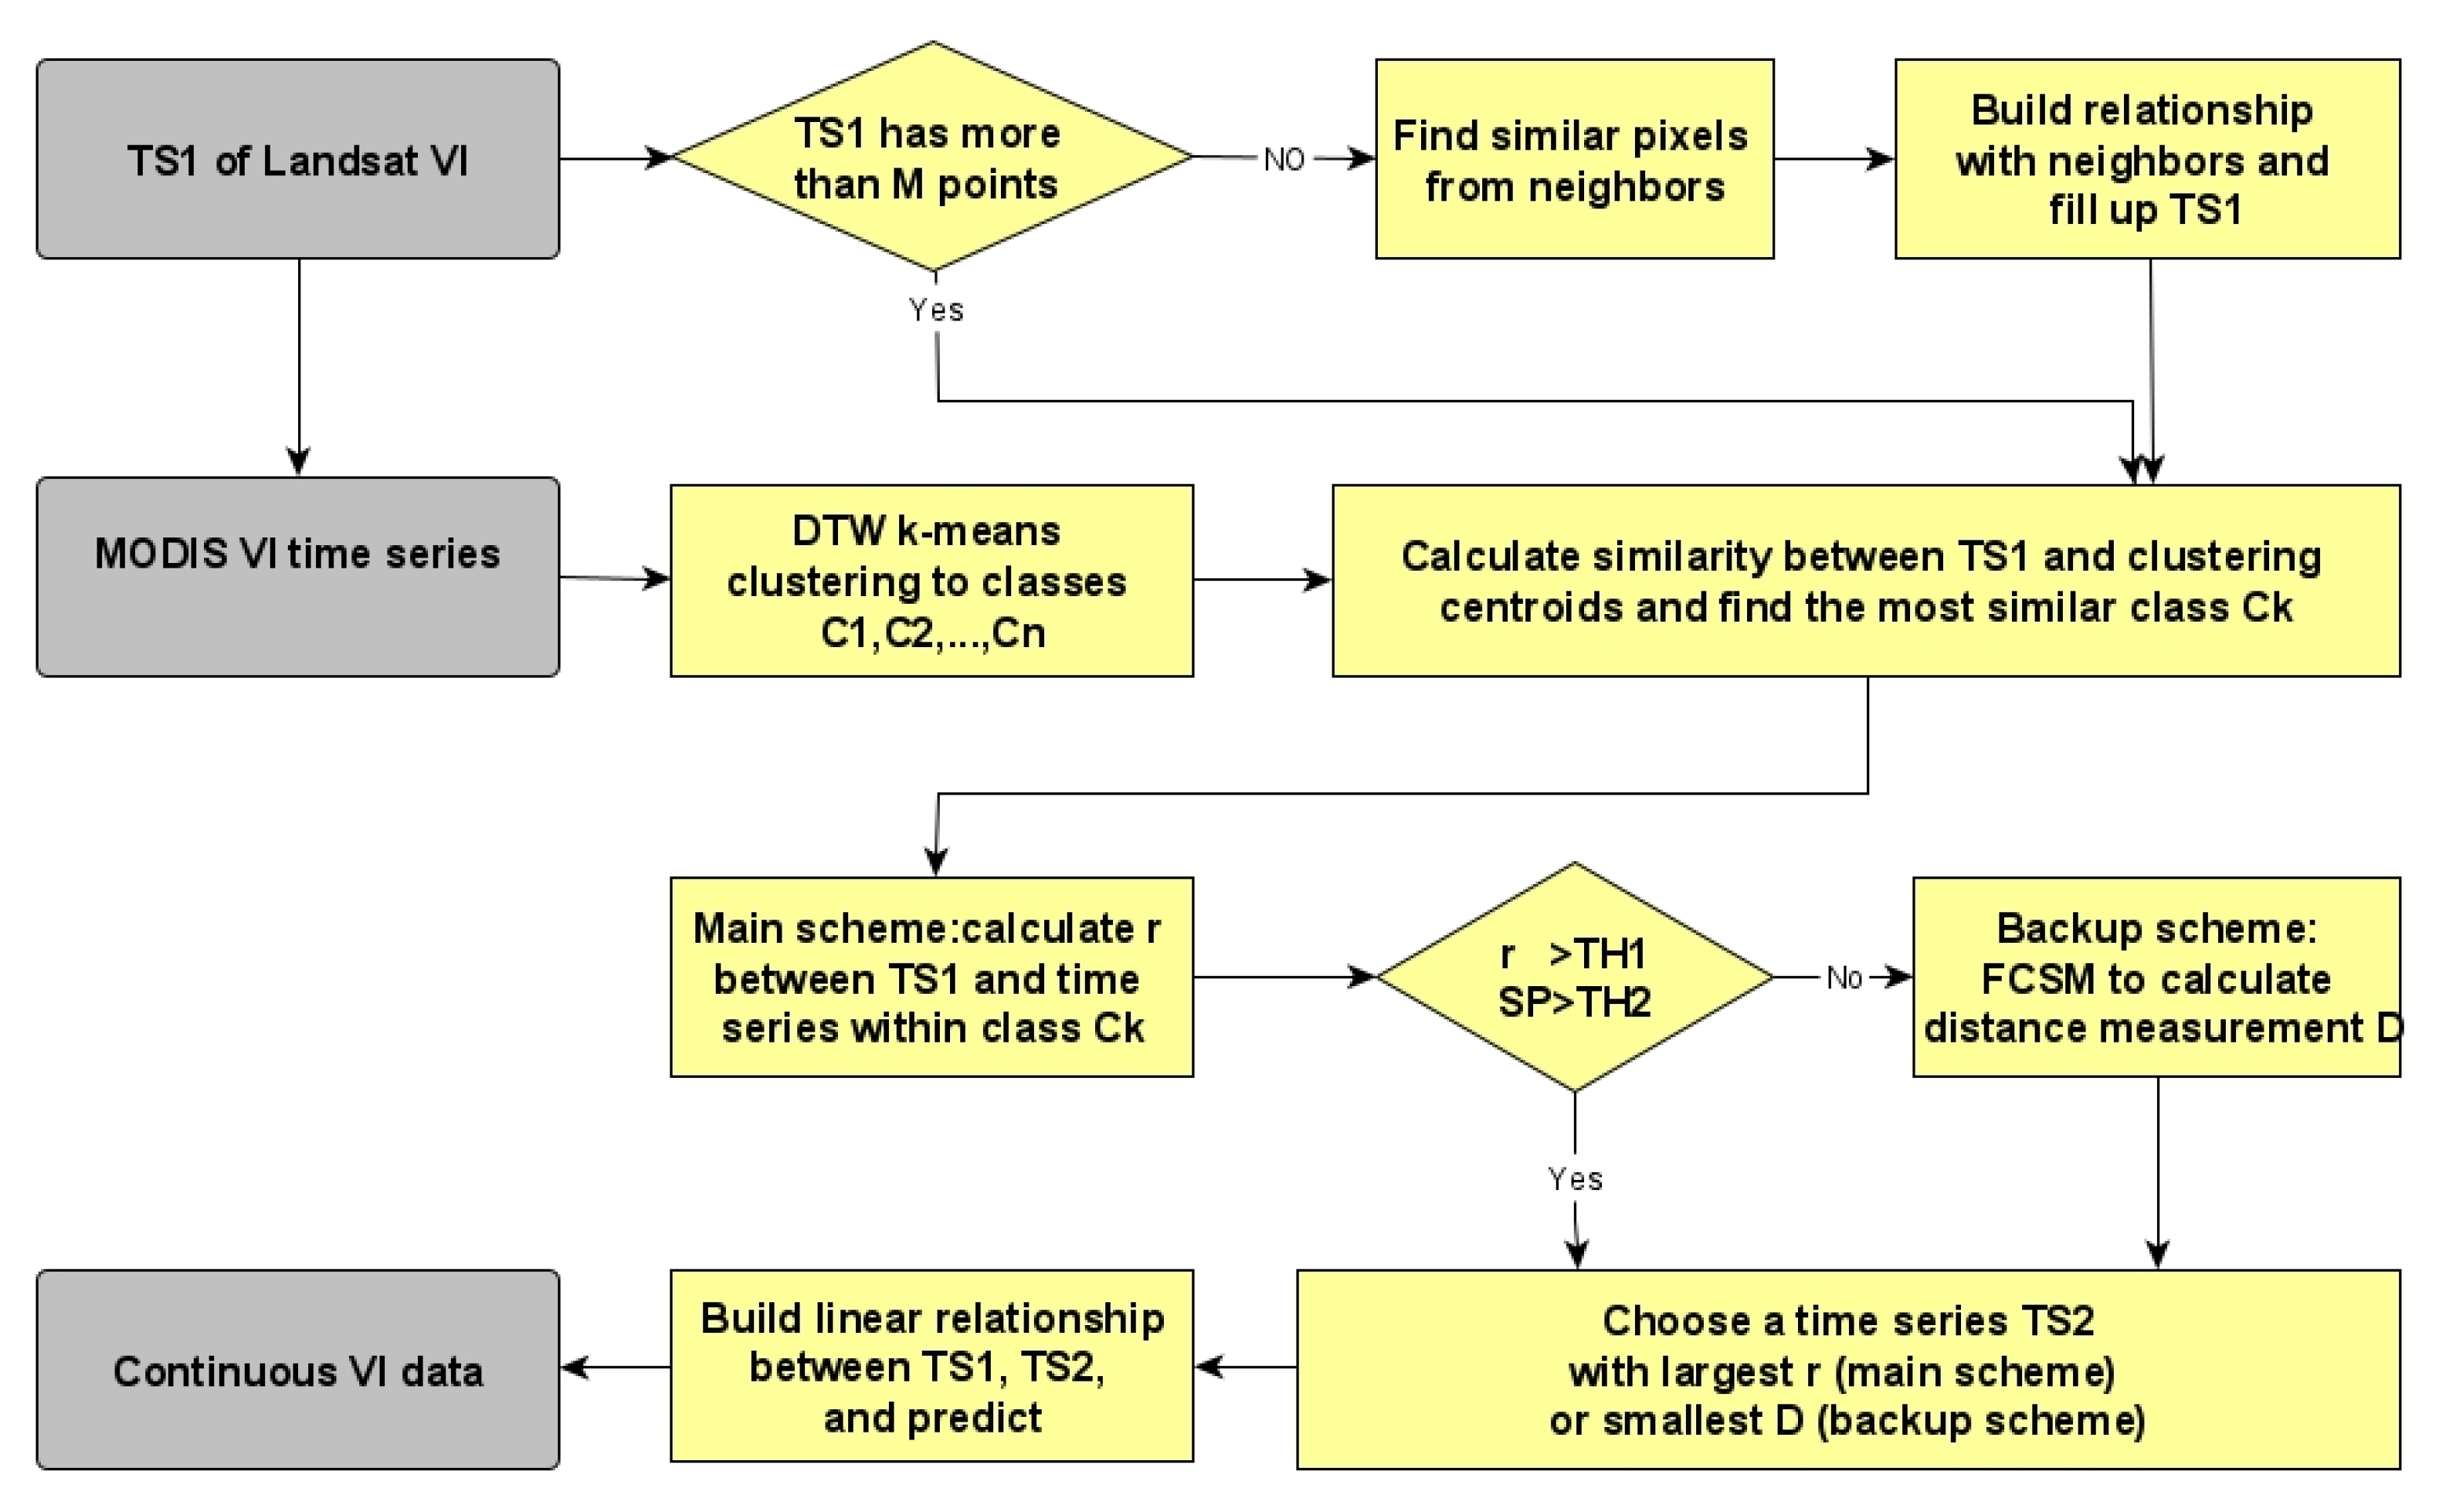
Figure 1.
The flowchart of the similarity matching (SIM) process.
Figure 1.
The flowchart of the similarity matching (SIM) process.
Figure 2.
Land cover types for the three study areas. (a) Central South Dakota (CSD); (b) northeast of Rocky Mountains (NRM); (c) central China (CCN).
Figure 2.
Land cover types for the three study areas. (a) Central South Dakota (CSD); (b) northeast of Rocky Mountains (NRM); (c) central China (CCN).
Figure 3.
Normalized difference vegetation index (NDVI) visual results of SIM (the upper image of each pair is the input and the lower is the output) at the CSD area for all input days. The blanks and gaps at the upper images in each pair result from the removal of clouds, cloud shadows, and scan line corrector failure.
Figure 4.
Bar graph of NDVI predictions statistics (mean average error (MAE), root-mean-square error (RMSE), and r) at the CSD area.
Figure 4.
Bar graph of NDVI predictions statistics (mean average error (MAE), root-mean-square error (RMSE), and r) at the CSD area.
Figure 5.
Leaf area index (LAI) visual results of SIM (the upper image of each pair is the input and the lower is the output) at the CSD area for all input days. The blanks and gaps in the upper images in each pair result from the removal of clouds, cloud shadows, and scan line corrector failure.
Figure 5.
Leaf area index (LAI) visual results of SIM (the upper image of each pair is the input and the lower is the output) at the CSD area for all input days. The blanks and gaps in the upper images in each pair result from the removal of clouds, cloud shadows, and scan line corrector failure.
Figure 6.
Bar graph of LAI predictions statistics (MAE, RMSE, and r) at the CSD area.
Figure 6.
Bar graph of LAI predictions statistics (MAE, RMSE, and r) at the CSD area.
Figure 7.
Actual and predicted NDVI images using different methods at date of year (DOY) 191. A zoomed-in area of all images is shown in Panel B.
Figure 7.
Actual and predicted NDVI images using different methods at date of year (DOY) 191. A zoomed-in area of all images is shown in Panel B.
Figure 8.
Actual and predicted LAI images using different methods at the CSD area from DOY 191. A zoomed-in area of all images is shown in Panel B.
Figure 8.
Actual and predicted LAI images using different methods at the CSD area from DOY 191. A zoomed-in area of all images is shown in Panel B.
Figure 9.
NDVI visual results of SIM (the upper image of each pair is the input and the lower image is the output) at the NRM area for all input days. The blanks and gaps in the upper images in each pair result from the removal of clouds, cloud shadows, and scan line corrector failure.
Figure 9.
NDVI visual results of SIM (the upper image of each pair is the input and the lower image is the output) at the NRM area for all input days. The blanks and gaps in the upper images in each pair result from the removal of clouds, cloud shadows, and scan line corrector failure.
Figure 10.
Bar graph of NDVI predictions statistics (MAE, RMSE, and r) at the NRM area.
Figure 10.
Bar graph of NDVI predictions statistics (MAE, RMSE, and r) at the NRM area.
Figure 11.
Actual and predicted NDVI images using different methods at the NRM area from DOY 171 and DOY 307.
Figure 11.
Actual and predicted NDVI images using different methods at the NRM area from DOY 171 and DOY 307.
Figure 12.
The LAI visual results of SIM (the upper image in each pair is the input and the lower is the output) at the CCN area for all input days. The blanks and gaps in the upper images in each set result from the removal of clouds, cloud shadows, and scan line corrector failure.
Figure 12.
The LAI visual results of SIM (the upper image in each pair is the input and the lower is the output) at the CCN area for all input days. The blanks and gaps in the upper images in each set result from the removal of clouds, cloud shadows, and scan line corrector failure.
Figure 13.
Bar graph of LAI predictions statistics (MAE, RMSE, and r) at the CCN area.
Figure 13.
Bar graph of LAI predictions statistics (MAE, RMSE, and r) at the CCN area.
Figure 14.
Actual and predicted LAI images using different methods at the CCN area from DOY 104 and DOY 200.
Figure 14.
Actual and predicted LAI images using different methods at the CCN area from DOY 104 and DOY 200.
Figure 15.
Temporal evolution of NDVI and LAI in one Moderate-resolution Imaging Spectroradiometer (MODIS)/Landsat pixel at three study areas.
Figure 15.
Temporal evolution of NDVI and LAI in one Moderate-resolution Imaging Spectroradiometer (MODIS)/Landsat pixel at three study areas.
Table 1.
Structural similarity measure (SSIM) between input and output NDVI images for the CSD area.
Table 1.
Structural similarity measure (SSIM) between input and output NDVI images for the CSD area.
| DOY | 143 | 175 | 183 | 191 | 199 | 207 | 215 | 223 | 231 | 239 | 255 | 263 | 271 |
| SSIM(%) | 93.4 | 99.0 | 99.2 | 98.1 | 98.5 | 98.7 | 99.5 | 99.0 | 99.4 | 99.4 | 98.4 | 98.7 | 97.1 |
Table 2.
Quantitative validation of NDVI for all input days at the CSD area.
Table 2.
Quantitative validation of NDVI for all input days at the CSD area.
| DOY | 143 | 175 | 183 | 191 | 199 | 207 | 215 | 223 | 231 | 239 | 255 | 263 | 271 |
| MAE | 0.07 | 0.08 | 0.06 | 0.06 | 0.06 | 0.05 | 0.05 | 0.05 | 0.04 | 0.04 | 0.04 | 0.05 | 0.07 |
| RMSE | 0.09 | 0.10 | 0.07 | 0.08 | 0.08 | 0.07 | 0.06 | 0.07 | 0.05 | 0.06 | 0.06 | 0.06 | 0.09 |
| R | 0.54 | 0.90 | 0.97 | 0.91 | 0.95 | 0.97 | 0.98 | 0.97 | 0.98 | 0.98 | 0.95 | 0.97 | 0.90 |
Table 3.
Structural similarity measure (SSIM) between input and output LAI images for the CSD area.
Table 3.
Structural similarity measure (SSIM) between input and output LAI images for the CSD area.
| DOY | 143 | 175 | 191 | 207 | 223 | 239 | 255 | 271 |
| SSIM(%) | 79.5 | 99.2 | 98.8 | 99.5 | 99.7 | 99.6 | 99.2 | 95.9 |
Table 4.
Quantitative validation of LAI for all input days at the CSD area.
Table 4.
Quantitative validation of LAI for all input days at the CSD area.
| DOY | 143 | 175 | 191 | 207 | 223 | 239 | 255 | 271 |
| MAE | 0.73 | 0.87 | 0.81 | 1.01 | 0.77 | 0.73 | 0.42 | 0.50 |
| RMSE | 1.02 | 1.15 | 1.06 | 1.44 | 1.06 | 1.02 | 0.67 | 0.69 |
| r | 0.78 | 0.71 | 0.54 | 0.84 | 0.812 | 0.78 | 0.82 | 0.68 |
Table 5.
Accuracies of different methods for NDVI and LAI prediction at the CSD area from DOY 191.
Table 5.
Accuracies of different methods for NDVI and LAI prediction at the CSD area from DOY 191.
| | NDVI | LAI |
|---|
| Methods | MAE | RMSE | r | MAE | RMSE | r |
|---|
| SIM | 0.06 | 0.08 | 0.91 | 0.71 | 1.00 | 0.64 |
| STARFM | 0.11 | 0.145 | 0.67 | 0.80 | 1.00 | 0.64 |
| ESTARFM | 0.12 | 0.17 | 0.60 | 0.88 | 1.17 | 0.56 |
| FSDAF | 0.10 | 0.13 | 0.72 | 0.90 | 1.15 | 0.59 |
Table 6.
Structural similarity measure (SSIM) between input and output NDVI images for the NRM area.
Table 6.
Structural similarity measure (SSIM) between input and output NDVI images for the NRM area.
| DOY | 43 | 59 | 75 | 83 | 91 | 107 | 115 | 123 | 131 |
| SSIM(%) | 86.0 | nan | 94.01 | 97.2 | 98.9 | 98.8 | 96.9 | 97.5 | 96.2 |
| DOY | 139 | 171 | 179 | 187 | 195 | 203 | 211 | 219 | 227 |
| SSIM(%) | 94.6 | 91.6 | 97.8 | 97.9 | 98.0 | 98.4 | 98.9 | 98.7 | 98.8 |
| DOY | 235 | 243 | 251 | 259 | 275 | 283 | 307 | 315 | 323 |
| SSIM(%) | 97.4 | 98.6 | 97.4 | 93.1 | 94.0 | 94.7 | 98.8 | 84.2 | 97.1 |
Table 7.
Quantitative validation of NDVI for all input days at the NRM area.
Table 7.
Quantitative validation of NDVI for all input days at the NRM area.
| DOY | 83 | 91 | 107 | 123 | 131 | 139 | 171 | 179 |
| MAE | 0.17 | 0.09 | 0.09 | 0.12 | 0.09 | 0.10 | 0.05 | 0.04 |
| RMSE | 0.24 | 0.15 | 0.12 | 0.18 | 0.12 | 0.15 | 0.06 | 0.05 |
| r | 0.68 | 0.73 | 0.83 | 0.74 | 0.78 | 0.62 | 0.93 | 0.98 |
| DOY | 187 | 195 | 203 | 211 | 219 | 227 | 235 | 243 |
| MAE | 0.06 | 0.04 | 0.03 | 0.02 | 0.04 | 0.02 | 0.06 | 0.05 |
| RMSE | 0.05 | 0.05 | 0.04 | 0.03 | 0.06 | 0.03 | 0.07 | 0.06 |
| r | 0.97 | 0.98 | 0.97 | 0.98 | 0.97 | 0.97 | 0.97 | 0.97 |
| DOY | 251 | 259 | 275 | 283 | 307 | 323 | | |
| MAE | 0.04 | 0.04 | 0.05 | 0.05 | 0.15 | 0.07 | | |
| RMSE | 0.04 | 0.05 | 0.06 | 0.056 | 0.21 | 0.09 | | |
| r | 0.96 | 0.97 | 0.96 | 0.95 | 0.62 | 0.789 | | |
Table 8.
Accuracies of different methods for NDVI prediction at the NRM area from DOY 171 and DOY 307.
Table 8.
Accuracies of different methods for NDVI prediction at the NRM area from DOY 171 and DOY 307.
| | DOY 171 | DOY 307 |
|---|
| Methods | MAE | RMSE | r | MAE | RMSE | r |
|---|
| SIM | 0.09 | 0.12 | 0.83 | 0.21 | 0.27 | 0.62 |
| STARFM | 0.11 | 0.13 | 0.83 | 0.16 | 0.21 | 0.78 |
| ESTARFM | / | / | / | 0.15 | 0.21 | 0.79 |
| FSDAF | 0.11 | 0.14 | 0.82 | 0.17 | 0.22 | 0.79 |
Table 9.
Structural similarity measure (SSIM) between input and output LAI images for the CCN area.
Table 9.
Structural similarity measure (SSIM) between input and output LAI images for the CCN area.
| DOY | 40 | 72 | 104 | 120 | 191 | 200 | 207 | 239 | 248 | 287 | 351 | 360 |
| SSIM(%) | 94.2 | 90.5 | 96.0 | 95.9 | 92.5 | 90.2 | 92.5 | 84.3 | 89.9 | 94.3 | 96.7 | 96.5 |
Table 10.
Quantitative validation of LAI for all input days at the CCN area.
Table 10.
Quantitative validation of LAI for all input days at the CCN area.
| DOY | 40 | 72 | 104 | 120 | 191 | 200 | 207 | 239 | 248 | 287 | 351 | 361 |
| MAE | 0.58 | 0.47 | 0.43 | 0.57 | 0.44 | 0.46 | 0.48 | 0.69 | 0.46 | 0.49 | 0.26 | 0.25 |
| RMSE | 0.78 | 0.59 | 0.55 | 0.72 | 0.59 | 0.63 | 0.53 | 1.14 | 0.62 | 0.63 | 0.34 | 0.34 |
| r | 0.59 | 0.77 | 0.79 | 0.81 | 0.76 | 0.70 | 0.67 | 0.63 | 0.73 | 0.70 | 0.90 | 0.89 |
Table 11.
Accuracies of different methods for LAI prediction at the CCN area from DOY 104 and DOY 200.
Table 11.
Accuracies of different methods for LAI prediction at the CCN area from DOY 104 and DOY 200.
| | DOY 104 | DOY 200 |
|---|
| Methods | MAE | RMSE | r | MAE | RMSE | r |
|---|
| SIM | 0.43 | 0.55 | 0.79 | 0.46 | 0.63 | 0.70 |
| STARFM | 1.06 | 1.21 | 0.40 | 0.87 | 1.13 | 0.41 |
| ESTARFM | 0.48 | 0.65 | 0.71 | 0.78 | 0.99 | 0.49 |
| FSDAF | 0.80 | 0.96 | 0.81 | 0.74 | 0.97 | 0.53 |


