Abstract
For water quality monitoring using satellite data, it is often required to optimize the low radiance signal through the application of radiometric gains. This work describes a procedure for the retrieval of radiometric gains to be applied to OLI/L8 and MSI/S2A data over coastal waters. The gains are defined by the ratio of the top of atmosphere (TOA) reflectance simulated using the Second Simulation of a Satellite Signal in the Solar Spectrum—vector (6SV) radiative transfer model, REF, and the TOA reflectance acquired by the sensor, MEAS, over AERONET-OC stations. The REF is simulated considering quasi-synchronous atmospheric and aquatic AERONET-OC products and the image acquisition geometry. Both for OLI/L8 and MSI/S2A the measured TOA reflectance was higher than the modeled signal in almost all bands resulting in radiometric gains less than 1. The use of retrieved gains showed an improvement of reflectance remote sensing, Rrs, when with ACOLITE atmospheric correction software. When the gains are applied an accuracy improvement of the Rrs in the 400–700 nm domain was observed except for the first blue band of both sensors. Furthermore, the developed procedure is quick, user-friendly, and easily transferable to other optical sensors.
1. Introduction
The management and monitoring of the coastal environment benefit from satellite products providing systematic measurements suitable for mapping whole ecosystems at different scales [1]. The high quality of the information is ensured by reducing the uncertainties of the remotely sensed data with the calibration and validation components of a satellite mission [2]. The approaches for calibration and validation purposes are mostly based on the unsupervised in situ measurements acquired by ground-based automated radiometers [3,4] and on modeling the atmospheric–water radiative transfer [5,6]. The unsupervised measurements come mainly from well-known networks such as BOUSSOLE [7], MOBY [8], and the widely used AERONET-OC [9]. Usually, the radiative transfer in the atmosphere–water system is modeled by reliable codes such as Second Simulation of a Satellite Signal in the Solar Spectrum (6SV) [10,11,12,13,14] and the MODerate resolution atmospheric TRANsmission (MODTRAN) [15], with inputs to describe the system (i.e., aerosol properties, water vapor columnar content, chlorophyll-a, salinity, and wind speed) and the imaging geometry of acquisition (i.e., zenith and azimuth of solar and viewing angles).
Concerning the in situ measurements of the current satellite missions, the accurate satellite products supplying drove the European Space Agency (ESA) to fund Fiducial Reference Measurements (FRM) projects to provide independent unsupervised measurements for vicarious calibration system (VCS) in addition to the validation component such as the latest FRM4SOC project [16]. Furthermore, new European infrastructures will be built to enlarge the unsupervised measurements [17,18] available for calibration and validation purposes [19] as required by the European system for monitoring the Earth (Copernicus) [20]. Generally, the VCS in coastal environment are used for medium resolution missions, such as Ocean and Land Color Instrument (OLCI) of the Sentinel 3 mission [21] and Moderate Resolution Imaging Spectroradiometer (MODIS) onboard Terra and Aqua satellites [22], but the high resolution missions, such as Multispectral Instrument (MSI) onboard Sentinel 2A and 2B [23] and Operational Land Imager (OLI) onboard Landsat-8 [24], are also being investigated for vicarious calibration [5,6,25,26]. The integrated use of products of multiple satellite missions with similar resolution leads to an increase of the data available for the management and monitoring of coastal water when all the data are harmonized. The Belharmony project [27] aims to define appropriate radiometric gains through vicarious calibration in order to harmonize data of high-resolution missions in high, medium, and low radiance conditions.
This work presents a procedure for determining calibration gains (Belharmony low radiance gains) to be applied to the top of atmosphere (TOA) reflectance in the case of low radiance (water). The gains are the ratios between simulated (REF) and measured (MEAS) data over the AERONET-OC stations. The REF is obtained by the 6SV radiative transfer model and the aquatic and atmospheric AERONET-OC products concurrent (within an interval of 30 min) to the sensor acquisition while MEAS is the low radiance acquired by the sensor. The AERONET-OC products were screened using strict criteria to reduce errors during the gain retrieval (low aerosol optical thickness, low wind speed, and low chlorophyll-a).
This paper starts with presenting the data and the developed procedure for gain retrieval in low radiance condition (Section 2). Next, the gains are retrieved for the OLI/L8 and MSI/S2A sensors (Section 3). In Section 4, the retrieved gains are validated showing good performance of the remote sensing reflectance (Rrs) obtained with ACOLITE software, with respect to the concurrent in situ measurements provided by AERONET-OC.
2. Materials and Methods
The developed procedure for the gains searching is based on the simulation of the reference (REF) top of atmosphere (TOA) reflectance of MSI/S2A and OLI/L8 sensors by modeling the radiative transfer with the Second Simulation of a Satellite Signal in the Solar Spectrum vector (6SV) code [10,11,12,13,14] using as primary input the water-leaving radiance measured at ground during the sensor acquisition. The reliability of this REF signal strongly depends on the accuracy of the parameters describing the atmosphere–water system during the satellite acquisition. These parameters are provided by AERONET-OC, the international network of atmospheric, and aquatic remote sensing products [9].
2.1. AEONET-OC Data
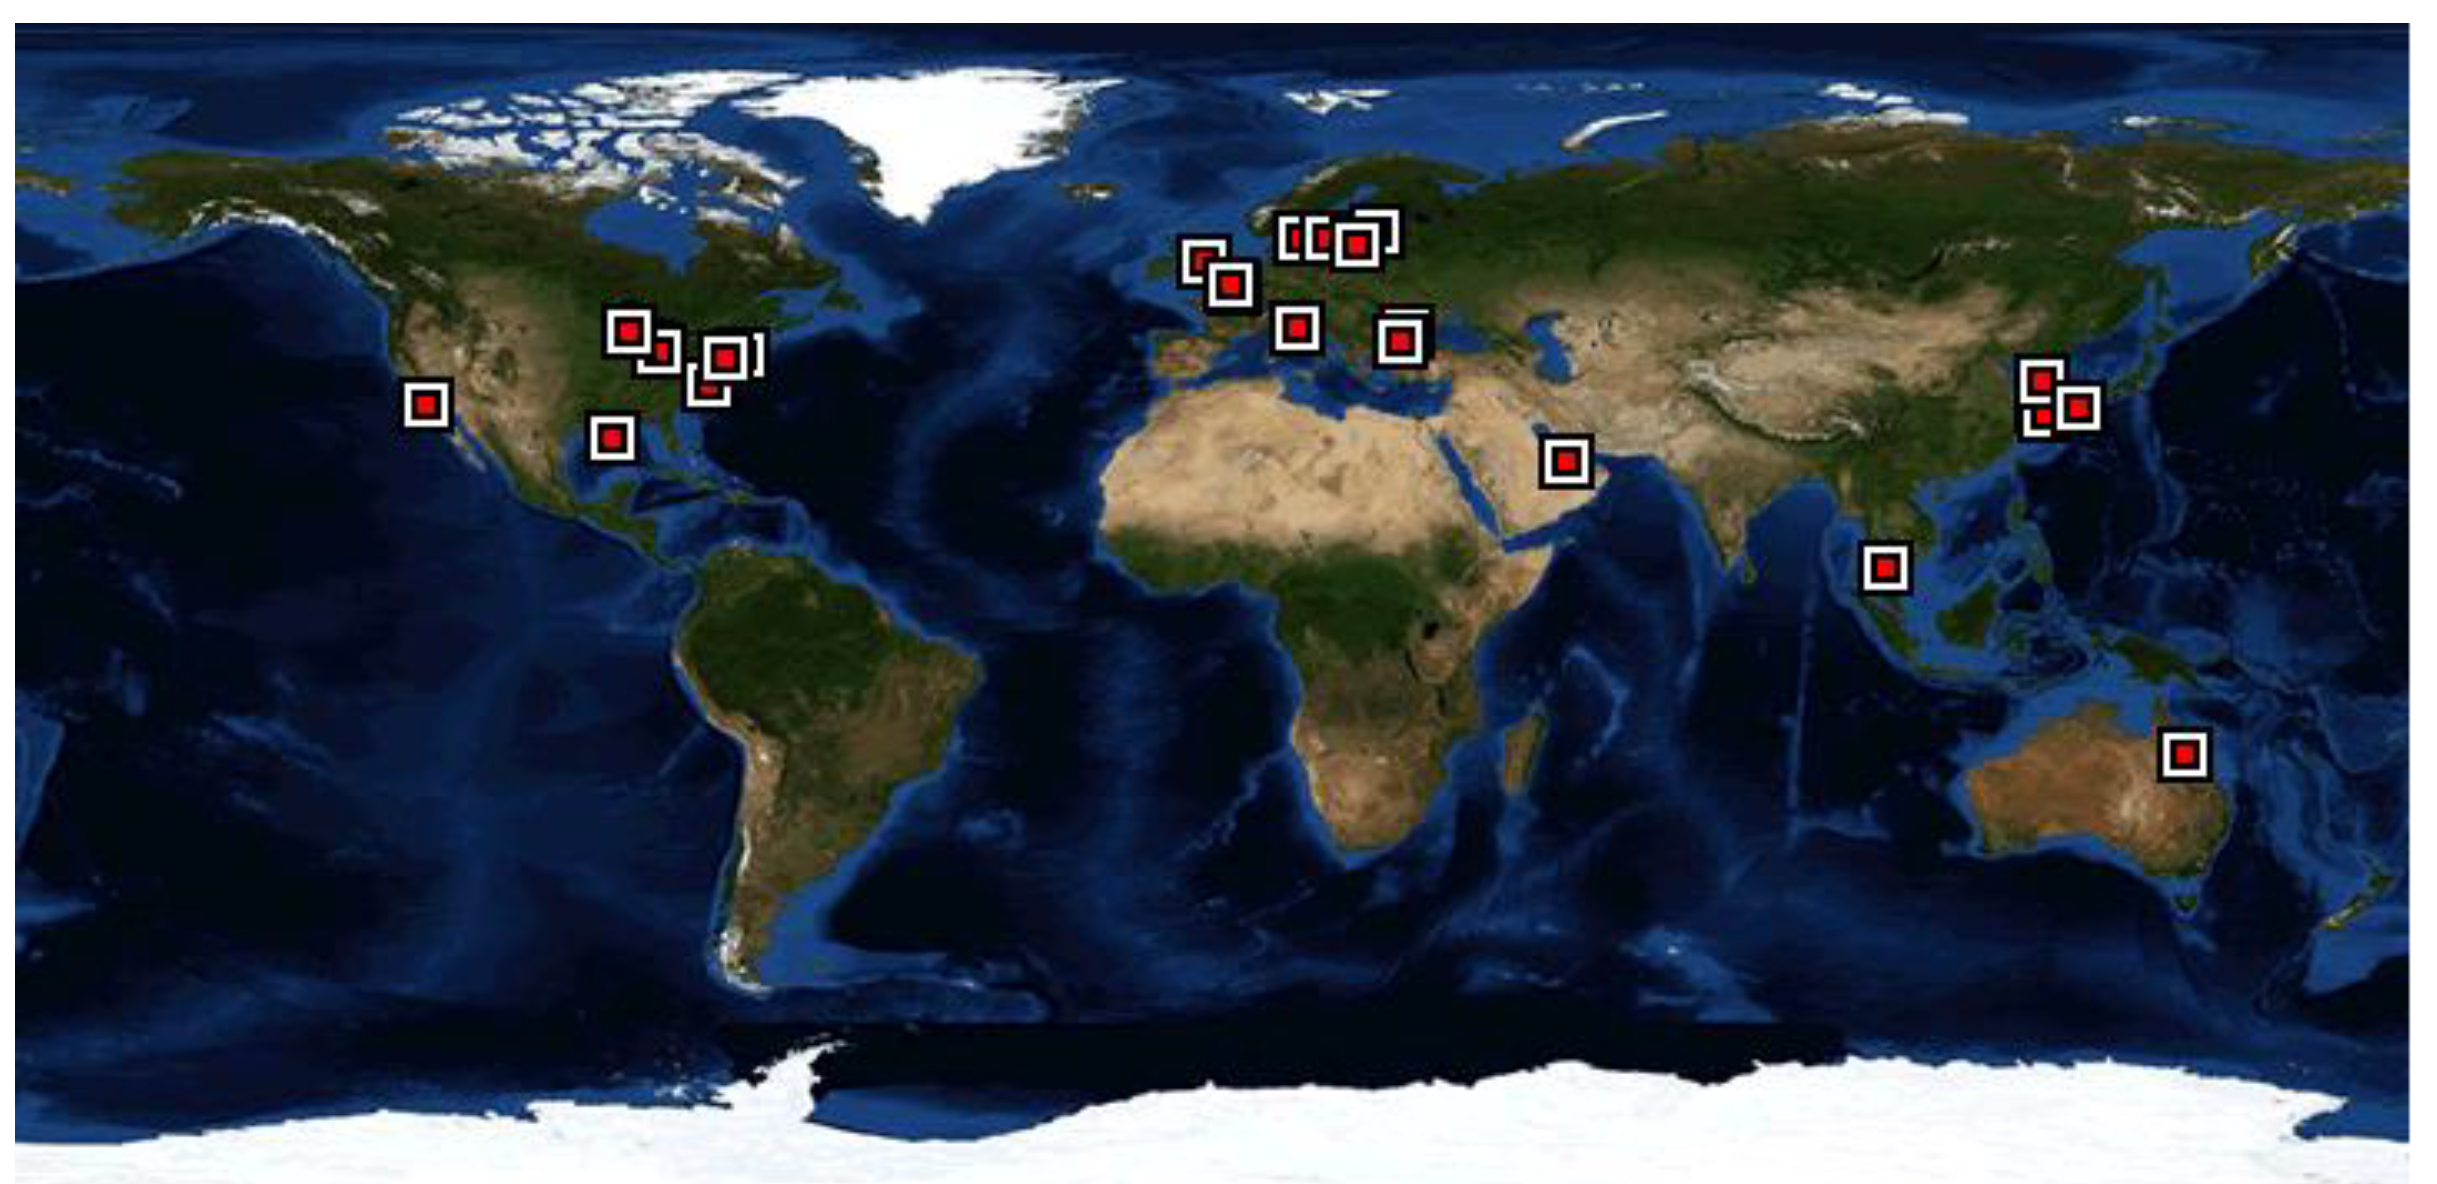
Figure 1 shows the globally distributed location of all the 27 stations (red squares) of the AERONET-OC network. At each AERONET-OC station, a CIMEL-SeaPrism photometer with eight bands (nominal center wavelengths: 411 nm, 441 nm, 491, 530 nm, 555 nm, 668 nm, 870 nm, and 1020 nm) is installed on fixed platform in coastal regions for the automated acquisition of sun, sky, and water radiance to provide aquatic [9] as well as atmospheric products [28]. The AERONET-OC products are made publicly available in a standardized format at three levels: level 1.0, level 1.5, and level 2. In our study, only the quality-assured (Level 2.0) products are used in order to ensure high accuracy of the atmospheric and aquatic parameters. A drawback, however, is that level 2 data products are only made accessible after a period of 6 to 12 months since the acquisition [4], which reduces the amount of products available for the gain retrieval.
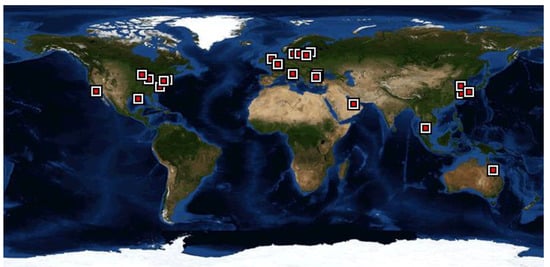
Figure 1.
Global AERONET-OC network. The red square are all the stations with Version 3 Direct Sun Algorithm for processing radiative data and products available at Level 2.0 (Figure from website: https://aeronet.gsfc.nasa.gov/cgi-bin/draw_map_display_seaprism_v3 accessed on 22 January 2021).
With respect to the aquatic AERONET-OC products, the normalized water-leaving radiance (corrected for f/Q factor), Lwn_f/Q, is the main variable to be considered when performing calibration/validation activities of remotely sensed data over water surfaces [5,29].
The concentration of chlorophyll-a (chl-a) is also given in the aquatic AERONET-OC products. Chl-a is a biological eutrophication indicator directly influencing the inherent optical properties of the water and consequently this product influences the spectral shape of the remote sensing data in the visible spectral domain especially in the red and near-infrared regions [30,31]. High values of chl-a occur in optically complex waters. In order to minimize the influence of the aquatic component on the simulated TOA reflectance, only AERONET-OC observations with Chl-a less than 5.0 mg/m3 were considered to be suitable for the gains retrieval.
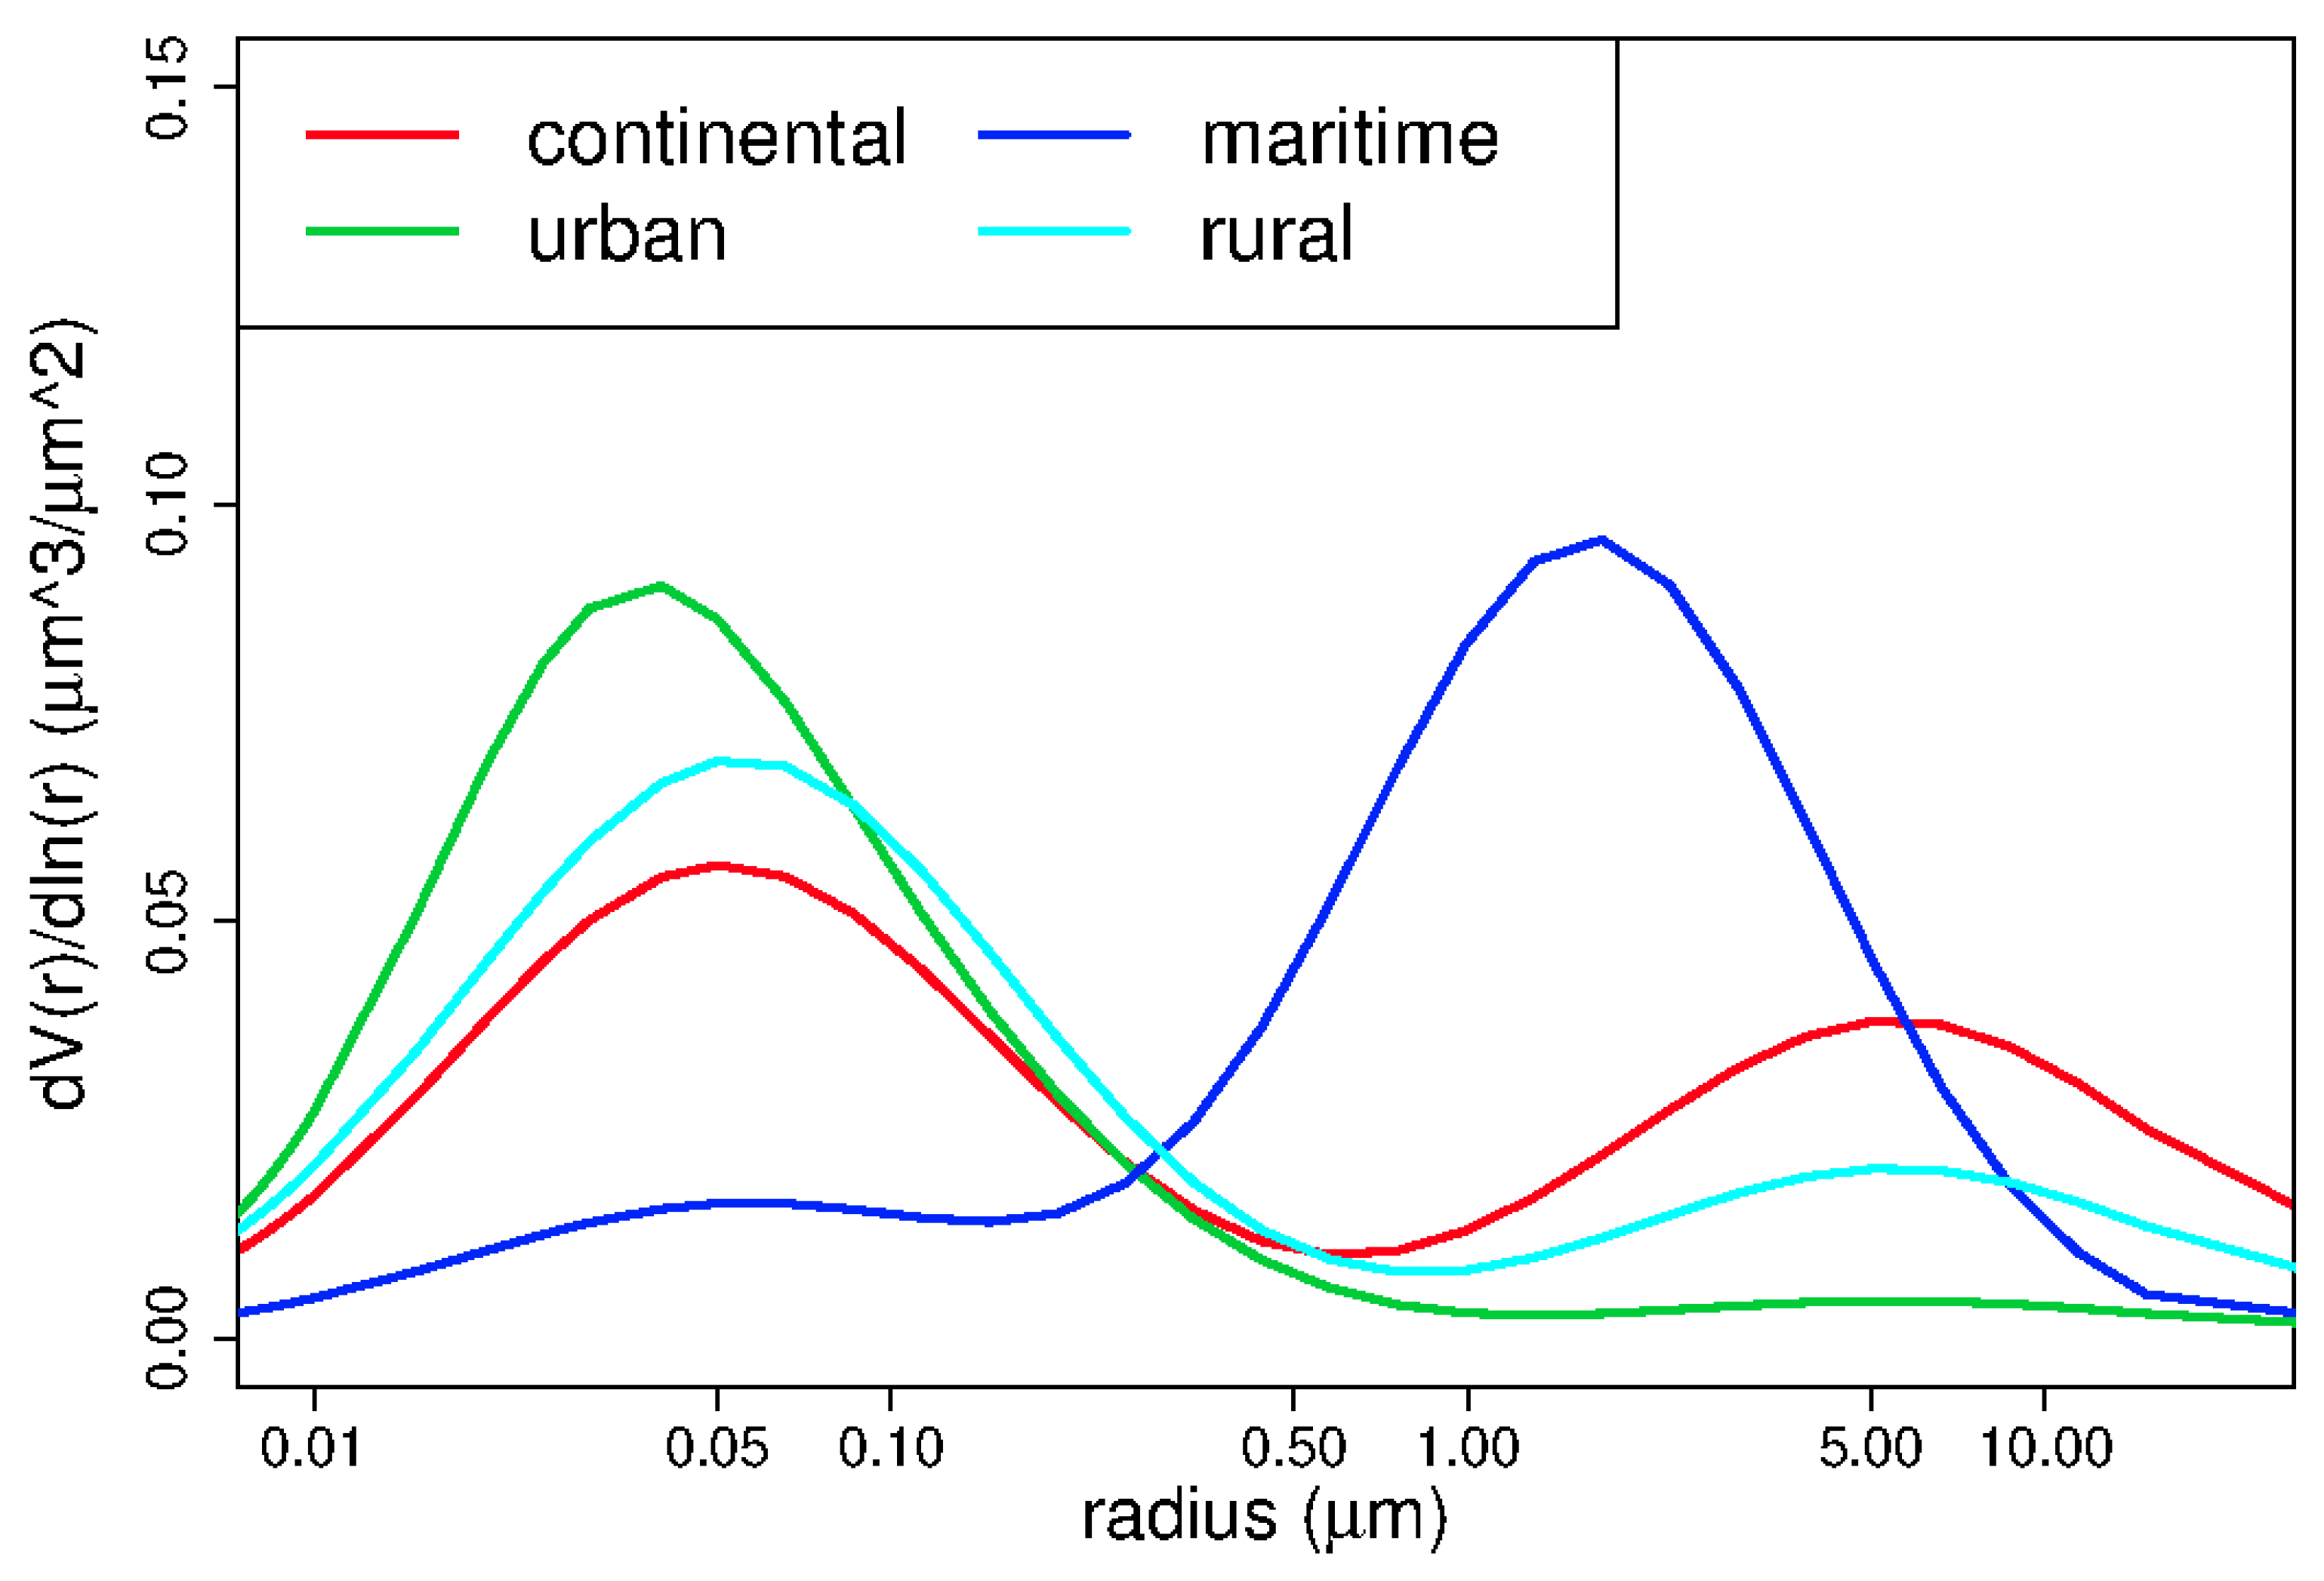
The atmospheric properties are represented by the direct and inverse AERONET-OC products. For the purpose of radiative transfer modeling, the most relevant direct atmospheric products are the columnar contents of water vapor and ozone, and the aerosol optical thickness (AOT) at λ = 550 nm. With respect to the inverse atmospheric products, the most relevant properties are the micro-physical properties of the aerosol model, i.e., size distribution and real and imaginary parts of the refractive index. However, these inverse products are not always available, greatly reducing the number of match-up data suitable for gain retrieval. To overcome this limitation, we assumed that the aerosol model can be represented by a bimodal size distribution dominated by fine or coarse mode and be characterized by the Ångström exponent that is inversely related to the average size of the aerosol. Consequently, in this study, the Ångström exponent, represented by the direct AERONET AngExp440870 product, is the parameter used to describe the local aerosol type. The assumption can be considered valid for radiative simulation under low aerosol optical thickness in coastal environment as reported in [32]. In addition, a low AOT attempts also to minimize the errors due to the assumption of bimodal size distribution of which the uncertainty increases with the increasing of the aerosol optical [33]. Therefore, only AERONET-OC Level-2 data with an AOT value at 550 nm less than 0.20 were considered. In Figure 2, the size distribution of the principal aerosol models is plotted. The maritime is a coarse-mode dominated aerosol model, the rural and urban are fine-mode dominated model, and the continental does not present a clear domination of one of the two modes (fine or coarse). Considering that the urban aerosol is not an usual aerosol model in coastal environment, only the maritime and rural aerosol models were considered representative of the local aerosol model at the AERONET-OC sites. In particular, the AERONET AngExp440870 decreases with increasing aerosol particle size [34]; this allows to derive a classification of the aerosol models on the basis of the AngExp440870 as suggested in [35]: maritime (coarse-dominated model) with AngExp440870 < 1.0 and rural (fine-dominated model) with AngExp440870 > 1.0.
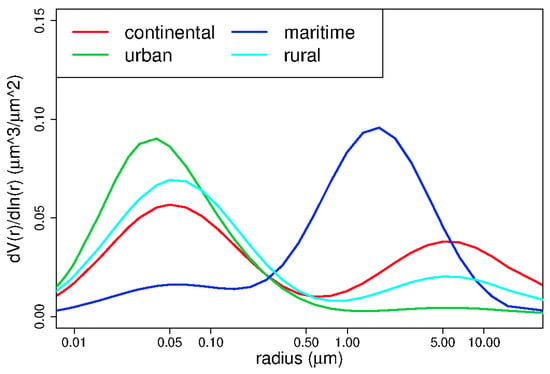
Figure 2.
Size distribution of the four principal aerosol models: maritime (blue line), continental (red line), rural (cyan line), and urban (green line).
Furthermore, an accurate simulation of the TOA reflectance requires that the impact of white-caps (foam reflectance) on the water-leaving radiance measured by the CIMEL-SeaPrism and the satellite sensors is negligible. To avoid the presence of white-caps over the water surface, only AERONET-OC observations for which the wind speed (as provided in the AERONET-OC output) was less than 5 m/s [36] were used. This wind speed threshold also allows minimizing the anisotropic effect. The anisotropic effect depends on, among others, the wind direction, a parameter that is not provided in the AERONET-OC products.
2.2. MSI/S2A and OLI/L8 Data
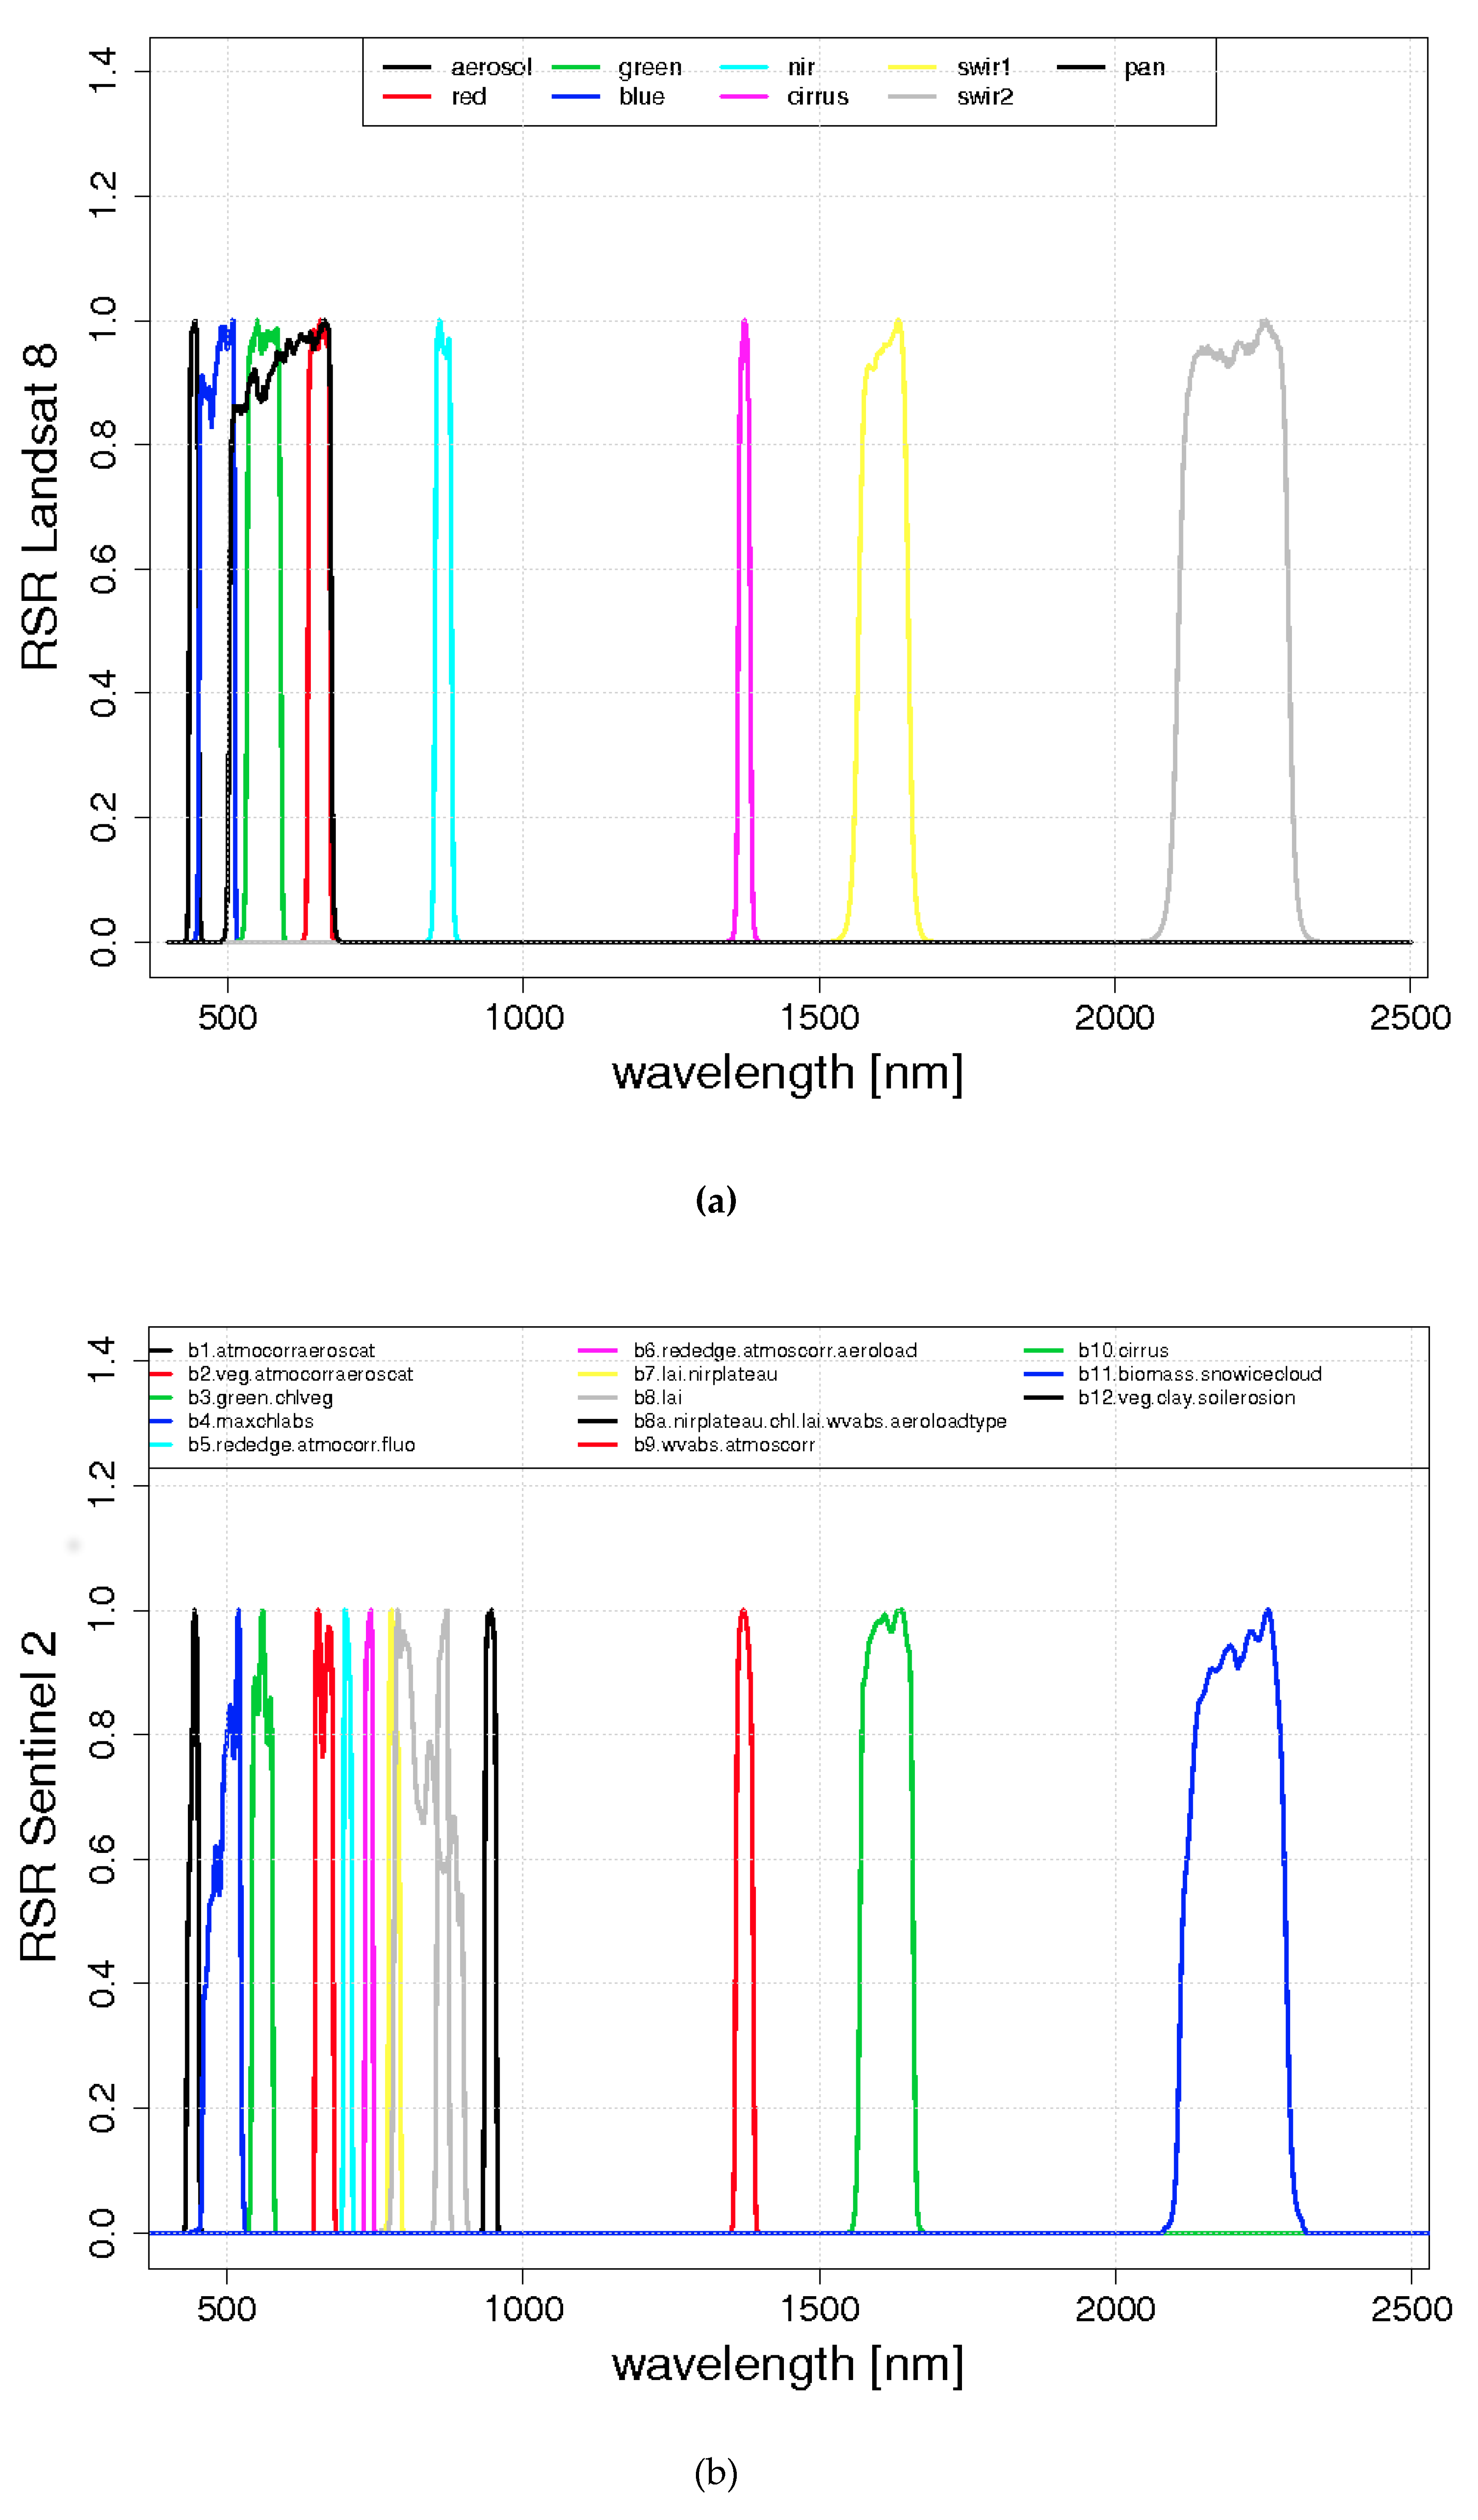
The Multispectral Instrument onboard the Sentinel-2 (MSI/S2A) and the Operational Land Imager onboard Landsat 8 (OLI/L8) are satellite sensors with the spatial resolution less than 60 m and the spectral bands belong to the visible, near, and shortwave-infrared spectral domains. Figure 3 shows the Relative Spectral Responses (RSR) of OLI/L8 (a) and MSI/S2A (b) bands, respectively.
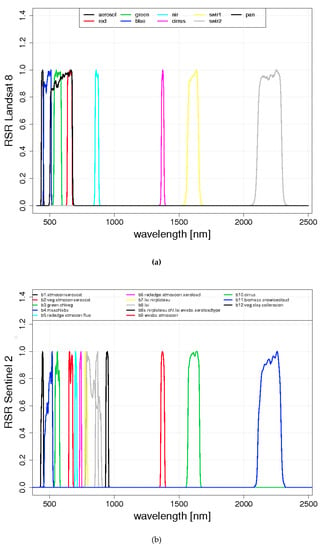
Figure 3.
The relative spectral response (RSR) of OLI/L8 (a) and MSI/S2A (b) bands.
The MSI/S2A and OLI/L8-AERONET-OC match-up dataset useful for gain retrieval was built by checking the availability of remote sensing data over all the 27 AERONET-OC stations in order to deal with the limited quality-assured (Level 2.0) products concurrent to the satellites data, i.e., within 30 min. The following criteria were considered for the match-ups: AOT < 0.2; Chl − a < 5.0 mg/m3; WS.OC < 5 m/s; time difference < 30 min as well as clear-sky condition to avoid that clouds or their shadows affect the simulation of the remotely sensed data.
The TOA reflectance is the basic remotely sensed product for the gain retrieval. The MSI/S2A provides directly this product while for the OLI/L8 sensor, the TOA reflectance image is obtained by using radiometric rescaling coefficients provided in the metadata file (.xml file) as explained in USGS website for OLI/L8 rescaling coefficients (https://www.usgs.gov/core-science-systems/nli/landsat/using-usgs-landsat-level-1-data-product accessed on 22 January 2021).
The MEAS was calculated as the median of the TOA reflectance of the pixels within the region of interest (ROI) selected for each AERONET-OC station. The ROIs were carefully selected to avoid water pixels contaminated by the shadow of the platform. These effects depend on the illumination and acquisition directions with respect to the location of the instrument (southern or northern hemisphere). The data meeting the selection criteria were all from platforms located in the Northern Hemisphere; therefore, the ROIs were selected all in the south direction to prevent any shadow on the selected pixels for the gain retrieval. The condition of minimum variability of the TOA reflectance into the selected ROIs was ensured by using the standard deviation of all the pixels belonging to the ROI. The spectral homogeneity of the ROIs was verified by checking that the ratio between the standard deviation and MEAS was less than 1%.
Finally, Table 1 shows the OLI/L8 with N = 31 and Table 2 the MSI/S2A with N = 22 match-up dataset used for the gains retrievals. The selected data satisfy the previous conditions of AERONET-OC products (AOT < 0.2; Chl − a < 5.0 mg/m3; WS.OC < 5 m/s), and they are quasi-synchronous with the CIMEL-SeaPrism measurements (time difference < 30 min).

Table 1.
Dataset of the OLI/L8 images acquired over the AERONET-OC stations with quasi-synchronous AERONET-OC products.

Table 2.
Dataset of the MSI/S2A images acquired over the AERONET-OC stations with quasi-synchronous AERONET-OC products.
2.3. Procedure for Belharmony Low Radiance Gains Retrieval
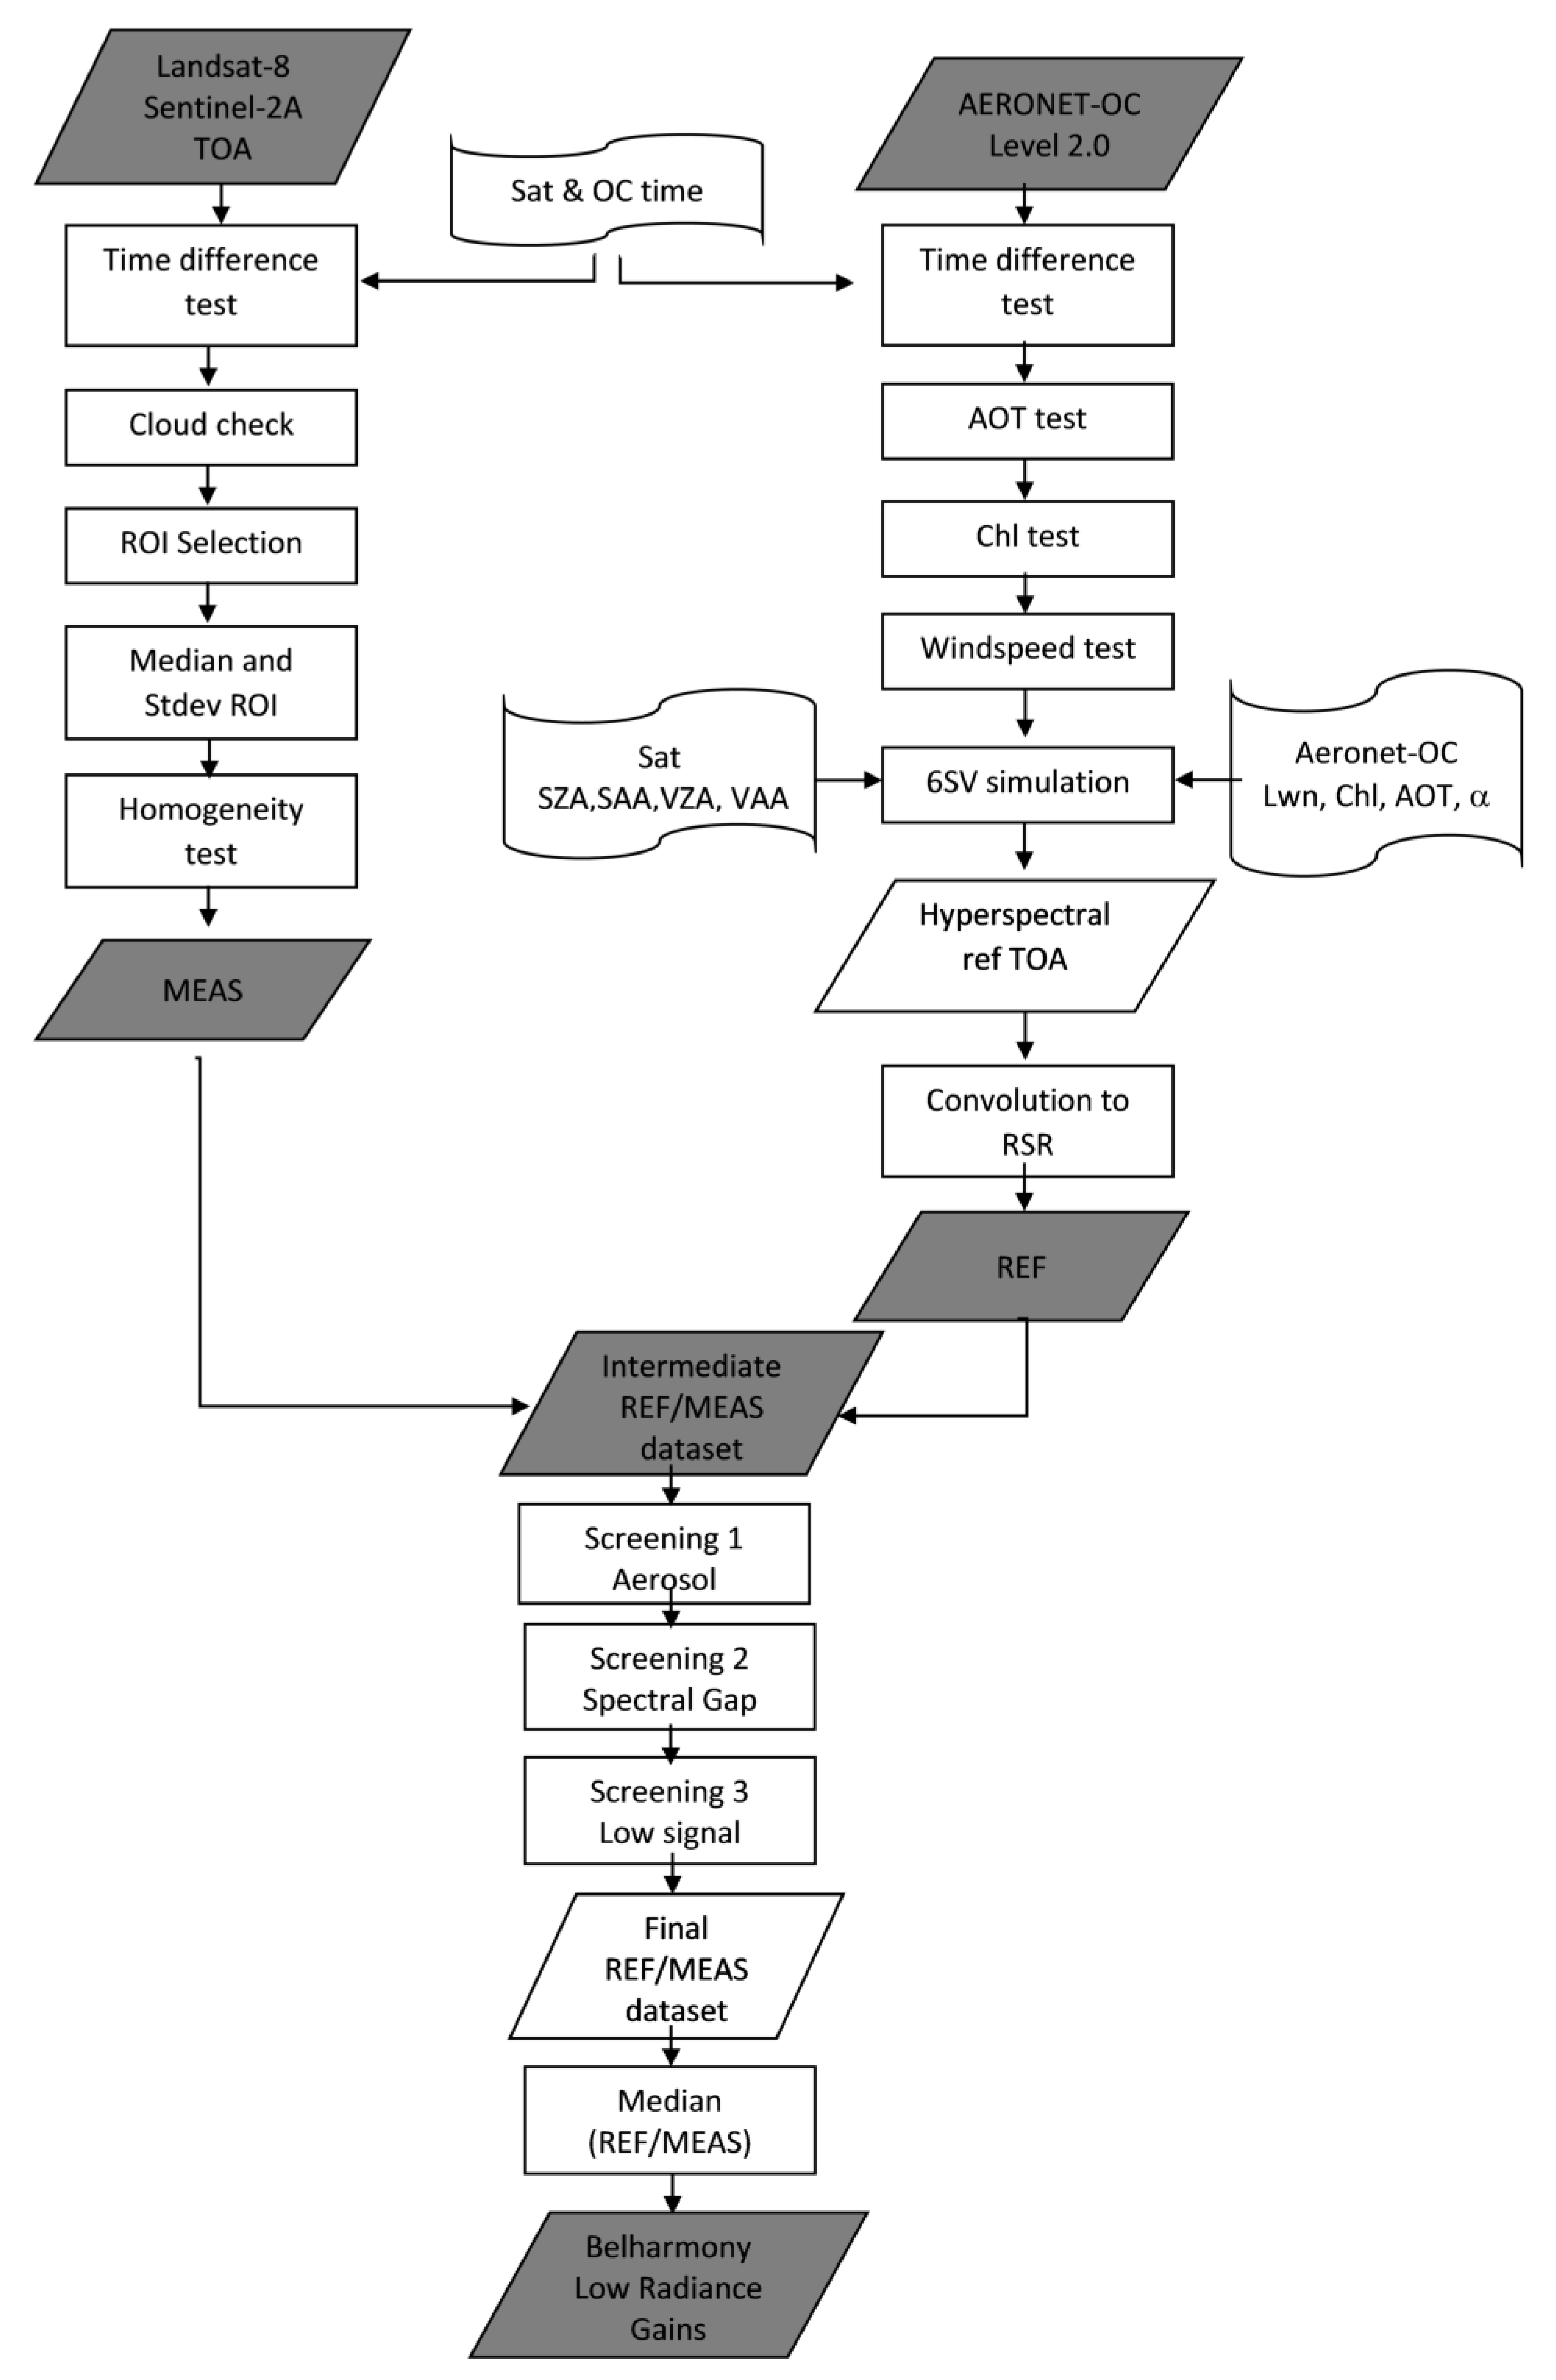
Figure 4 shows the flowchart of the developed procedure for the retrieval of the Belharmony low radiance gains on the basis of the atmospheric and aquatic AERONET-OC products acquired almost coincident with the image data. The different steps are described in detail in the previous and next paragraphs. First, the steps and actions (white boxes above) to select the remotely sensing data (MEAS) and to simulate the reference signal (REF) are reported. After that, screenings (white boxes below) are applied to select the REF/MEAS more suitable for the gains retrieval. The final output (bottom gray box) are the Belharmony low radiance gains given as the REF/MEAS ratios.
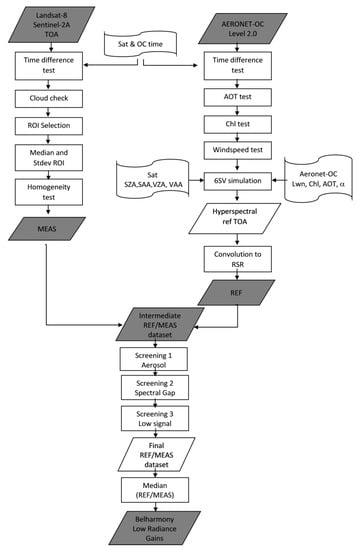
Figure 4.
Flow chart of the procedure developed for gains retrieval when low radiance water is acquired by a satellite sensor.
2.3.1. Hyperspectral TOA Simulated Reflectance, REFhyp
The 6SV radiative transfer model generates hyperspectral TOA simulated reflectance over the entire visible and near-infrared spectral domain sampled every 2.5 nm. The 6SV inputs are the parameters of the atmosphere–water system represented by the AERONET-OC atmospheric and aquatic products (Level 2.0) available concurrently to each satellite acquisition reported in Table 1. Besides, the 6SV requires the configuration of the acquisition composed by the actual illumination and observation geometry. This geometry is defined by solar zenith and azimuth angles (SZA and SAA), and the viewing zenith and azimuth angles (VZA and VAA), reported in Figure 4. For the MSI/S2A sensor, the four parameters are directly provided as metadata image. For OLI/L8, the four angles are generated by a tool available from the website USGS website for OLI/L8 angles (https://landsat.usgs.gov/sites/default/files/documents/L8_ANGLES_2_7_0.tgz accessed on 22 January 2021)
Specifically, the ocean BRDF is simulated by 6SV until 700 nm by considering the chl-a and wind speed as given in the AERONET-OC products. In 6SV, the atmospheric multiple scattering is calculated by the successive order of scattering (SOS) method, and the coupling of BRDF ocean with the atmosphere is also addressed by considering the contribution of the direct and diffuse components reflected directly from the target to the sensor and the direct component diffusely reflected by the target to the sensor. In 6SV, the sunglint is also considered. The direct component of the solar radiation reflected by the water surface is computed exactly with the Snell–Fresnel laws. The wind speed AERONET-OC product helps to discriminate the roughness of the sea surface. When the roughness is not negligible, the reflection is conditioned by the wind and the model surface is computed numerically in accordance with the work in [37]. In general, the crucial limitation of the 6SV is related to the simulation of the downward diffuse component reflected diffusely towards the sensor [38]. In the case of the water target, this component can be considered by the water-leaving radiance of the AERONET-OC stations. Thus, the final REFhyp is expressed by adding up the diffuse component of Lwn_f/Q AERONET-OC product to the 6SV outputs:
REFhyp(λ) = toar(λ) + tdiffu(λ) ∗ tgu(λ) ∗ (10.0 ∗ lwnfq(λ)/(F0(λ) ∗ tdiffd(λ) ∗ tgd(λ)))
2.3.2. Simulated MSI/S2A and OLI/L8 TOA Reflectance, REF
To account for the instruments’ actual spectral response, the 6SV TOA modeled reflectance spectra (REFhyp) were convolved into the relative spectral response (RSR) of all the bands of the MSI/S2A and OLI/L8 sensors shown in Figure 3.
The simulated TOA reflectance of the i band, REF_i, was retrieved by convolving the hyperspectral TOA REFhyp(λ_j) into the RSR(λ_j) by applying the equation [29,40]
where the spectral domain is λ_j ∈ (400:2500) nm with a sampling of 1.0 nm leads to a geometric series composed by n = 2101 terms for each sensor.
2.3.3. Belharmony Low-Radiance Gains
The gains of each band of both the sensors (hereinafter the Belharmony gains) were defined by REF/MEAS ratios where the REF is the simulated TOA reflectance by 6SV model with the input reported in Figure 4 (AERONET-OC products and the angles to define the acquisition geometry), and MEAS the concurrent TOA reflectance obtained from the corresponding sensor acquisition.
A normal distribution around the true value of the gain expressed by REF/MEAS is expected, consequently the density (i.e., distribution of data sample) should be represented by a bell-shaped curve close to the normal distribution described by the median (to take into consideration the entire dynamic range of the ratios) and the standard deviation. The reliability and the validity of the outcome depend on the confidence interval of the density distribution curve. To this aim, a 90% confidence interval of the data sample was chosen as reasonable limit for discarding outliers. This confidence interval is achievable by specific data screening.
The set composed by the REF/MEAS ratios retrieved for the data reported in the Table 1 is screened, discarding the outliers by removing 5% at the tails of the distribution of the ratios. The screenings are applied to OLI/L8 and MSI/S2 bands close to AERONET-OC channels relevant in case of water pixel.
- Screening 1 (C1): Aerosol model assumption. The first screening is applied to the sensor band where there is the highest contribution of the aerosol atmospheric scattering that is the first two Cimel bands (nominal center wavelengths, 412 nm and 442 nm). In this spectral domain, the aerosol properties influence the REF signal, especially in the case of dark surface (water target) as explained in [41]. Thus, a small error in atmospheric characterization may lead to large error in the REF simulation resulting in a REF/MEAS ratio which could be far from the expected value. Thus, a REF/MEAS ratio was removed from the dataset if REF/MEAS of the sensor band close to 442 nm is an outlier and belongs to the distribution tails (5%).
- Screening 2 (C2): Spectral gap of AERONET-OC water products. The spectral information of water target between fifth (551 nm, nominal center wavelength) and sixth band (668 nm, nominal center wavelength) of the CIMEL-SeaPrism sunphotometer would be relevant for accurate simulation of signal over coastal water but the aquatic AERONET-OC products are lacking. Consequently, the simulated REF could not correspond to the real value of the water target in this spectral gap. Thus, the REF/MEAS ratios of the sensor band around 560 nm were removed if they result outliers and are in the distribution tails (5%)
- Screening 3 (C3): Very low at-sensor signal. The AERONET-OC normalized water-leaving radiance is very close to zero and occasionally less than zero in the last two Cimel-SeaPrism channels (870 nm and 1020 nm), and the simulated REF may not be suitable to represent the effective measurements of the sensor. Thus, the corresponding ratios calculated at the sensor band close to the 870 nm Cimel-SeaPrism channel could be far from the expected value, and the third screening achieved an accuracy of 90% through the removal of the REF/MEAS ratios belonging to the tails of distribution (5%).
3. Results
The Belharmony gains were retrieved by the screened REF/MEAS ratios for each band of MSI/S2A and OLI/L8 sensors utilizing the two datasets reported in Table 1 and Table 2 and following the procedure described in Section 2.3.
3.1. OLI/L8 Belharmony Gains
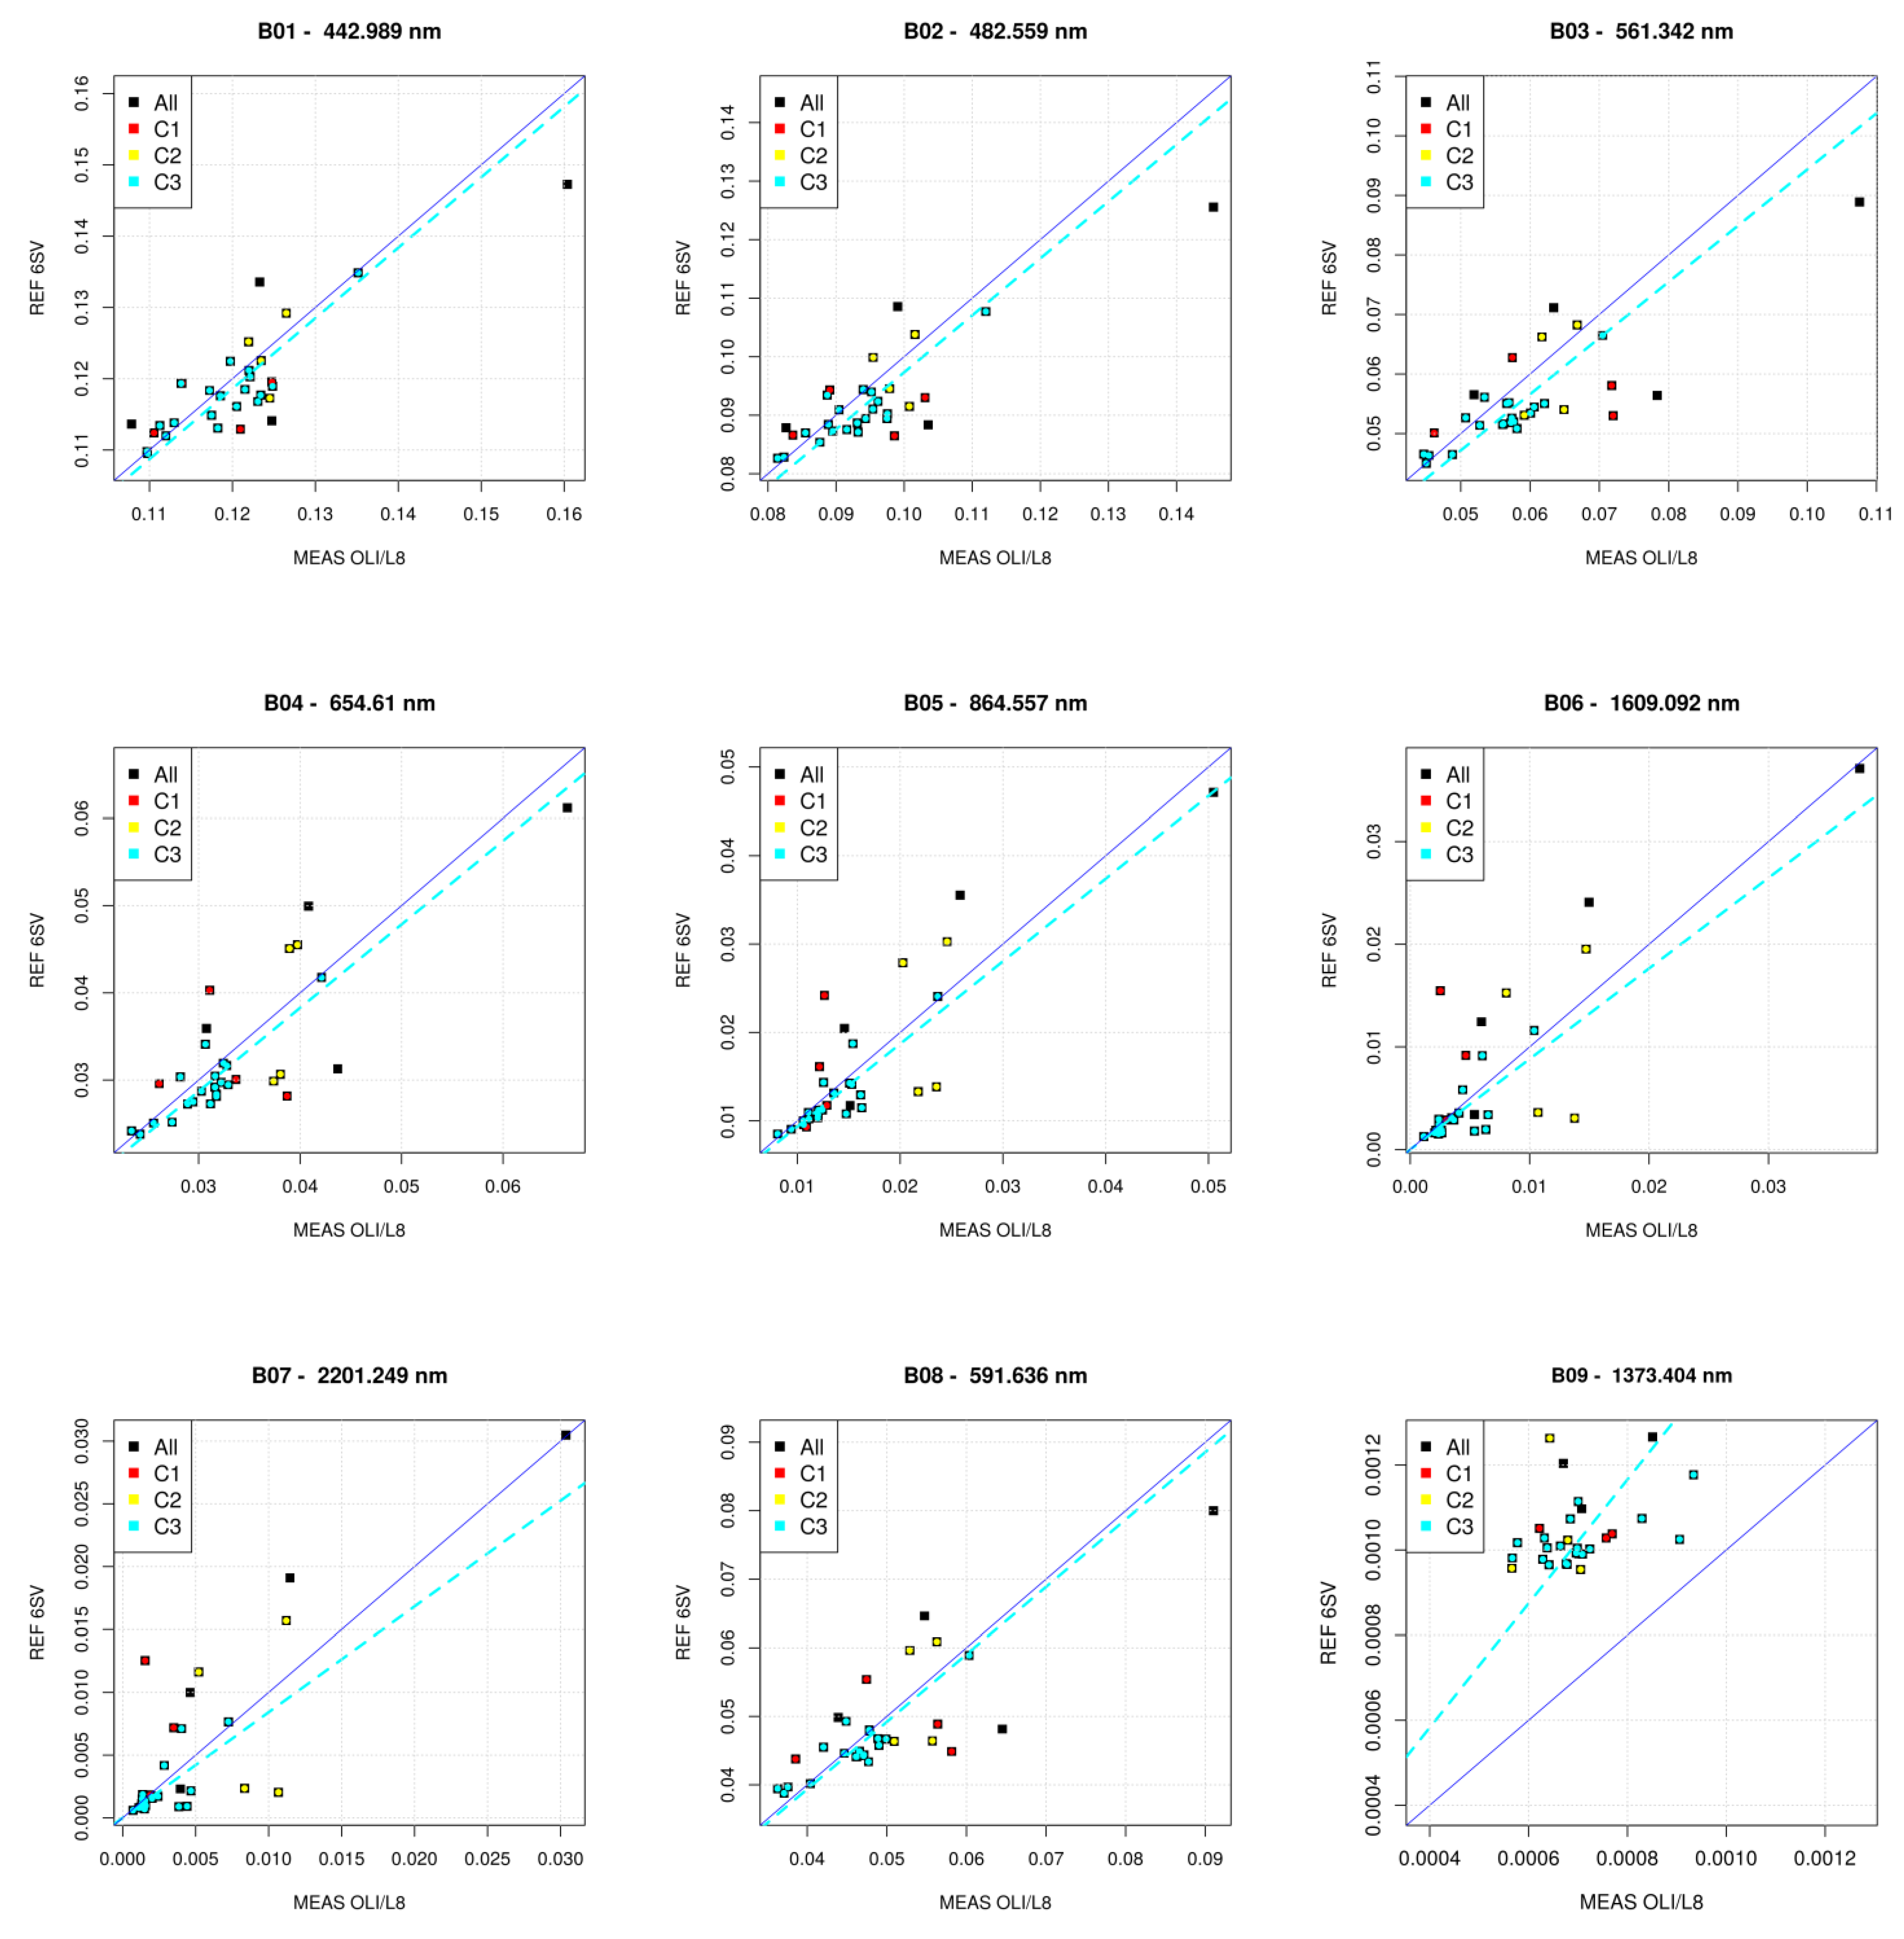
Figure 5 shows, band by band, all the pairs of the REF simulated by 6SV model vs. the median of ROIs pixels, MEAS, for the OLI/L8 images available in quasi-synchronous condition to the AERONET-OC products reported in Table 1. All the 31 initial pairs are plotted with different colors depending on the screening (C1, C2, C3) which they have passed. In black are the data that were removed in screening 1 applied to the first OLI/L8 band (B01), in red (C1) are the data that were removed in screening 2 applied to B03, and in yellow (C2) are the data that were removed in screening 3 applied to B05. The remaining points (C3) are then given in cyan.
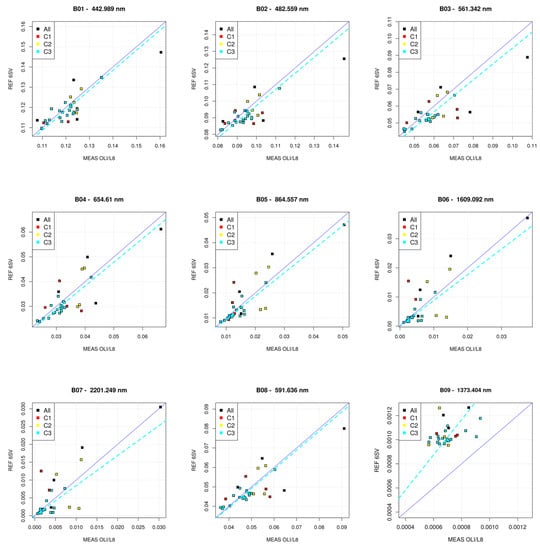
Figure 5.
The TOA reflectance simulated by 6SV vs. the measured OLI/L8 TOA reflectance for each OLI/L8 band (31 total points). The red points (C1) are the data removed by the first screening, the yellow points (C2) are the data removed by the second screening, and the cyan points (C3) represent the final value used for Belharmony gains retrieval (19 points).
The C3 points (19 REF/MEAS ratios) were used for the Belharmony gains retrieval with the maximum accuracy achievable by the available dataset. The gains of each band of the OLI/L8 sensor were retrieved by the median, as suggested in [5], of the final 19 REF/MEAS ratios resulting from the previous screenings (Section 2.3.3).
The median and the standard deviation of the final dataset are reported in Table 3, except for the band 9, and are useful for cirrus detection, but are not used in the optimization of the sensor signal. Table 3 reports the Belharmony gains as the median of the 19 ratios (MD) with its standard deviation (SD) for each OLI/L8 band (wvl is the central wavelength retrieved by applying the Equation (2)). The SD increases with the wavelength as expected for the very low radiance in this spectral domain where the errors could be reduced with a larger images sample respect to the actual size. The lower SD is expected until 700 nm which corresponds to the limit of the 6SV water modeling explained in Section 2.3.1.

Table 3.
Belharmony gains as median (MD) with standard deviation (SD) for the OLI/L8 bands (wvl is their central wavelength calculated by the Equation (2)).
3.2. MSI/S2A Belharmony Gains
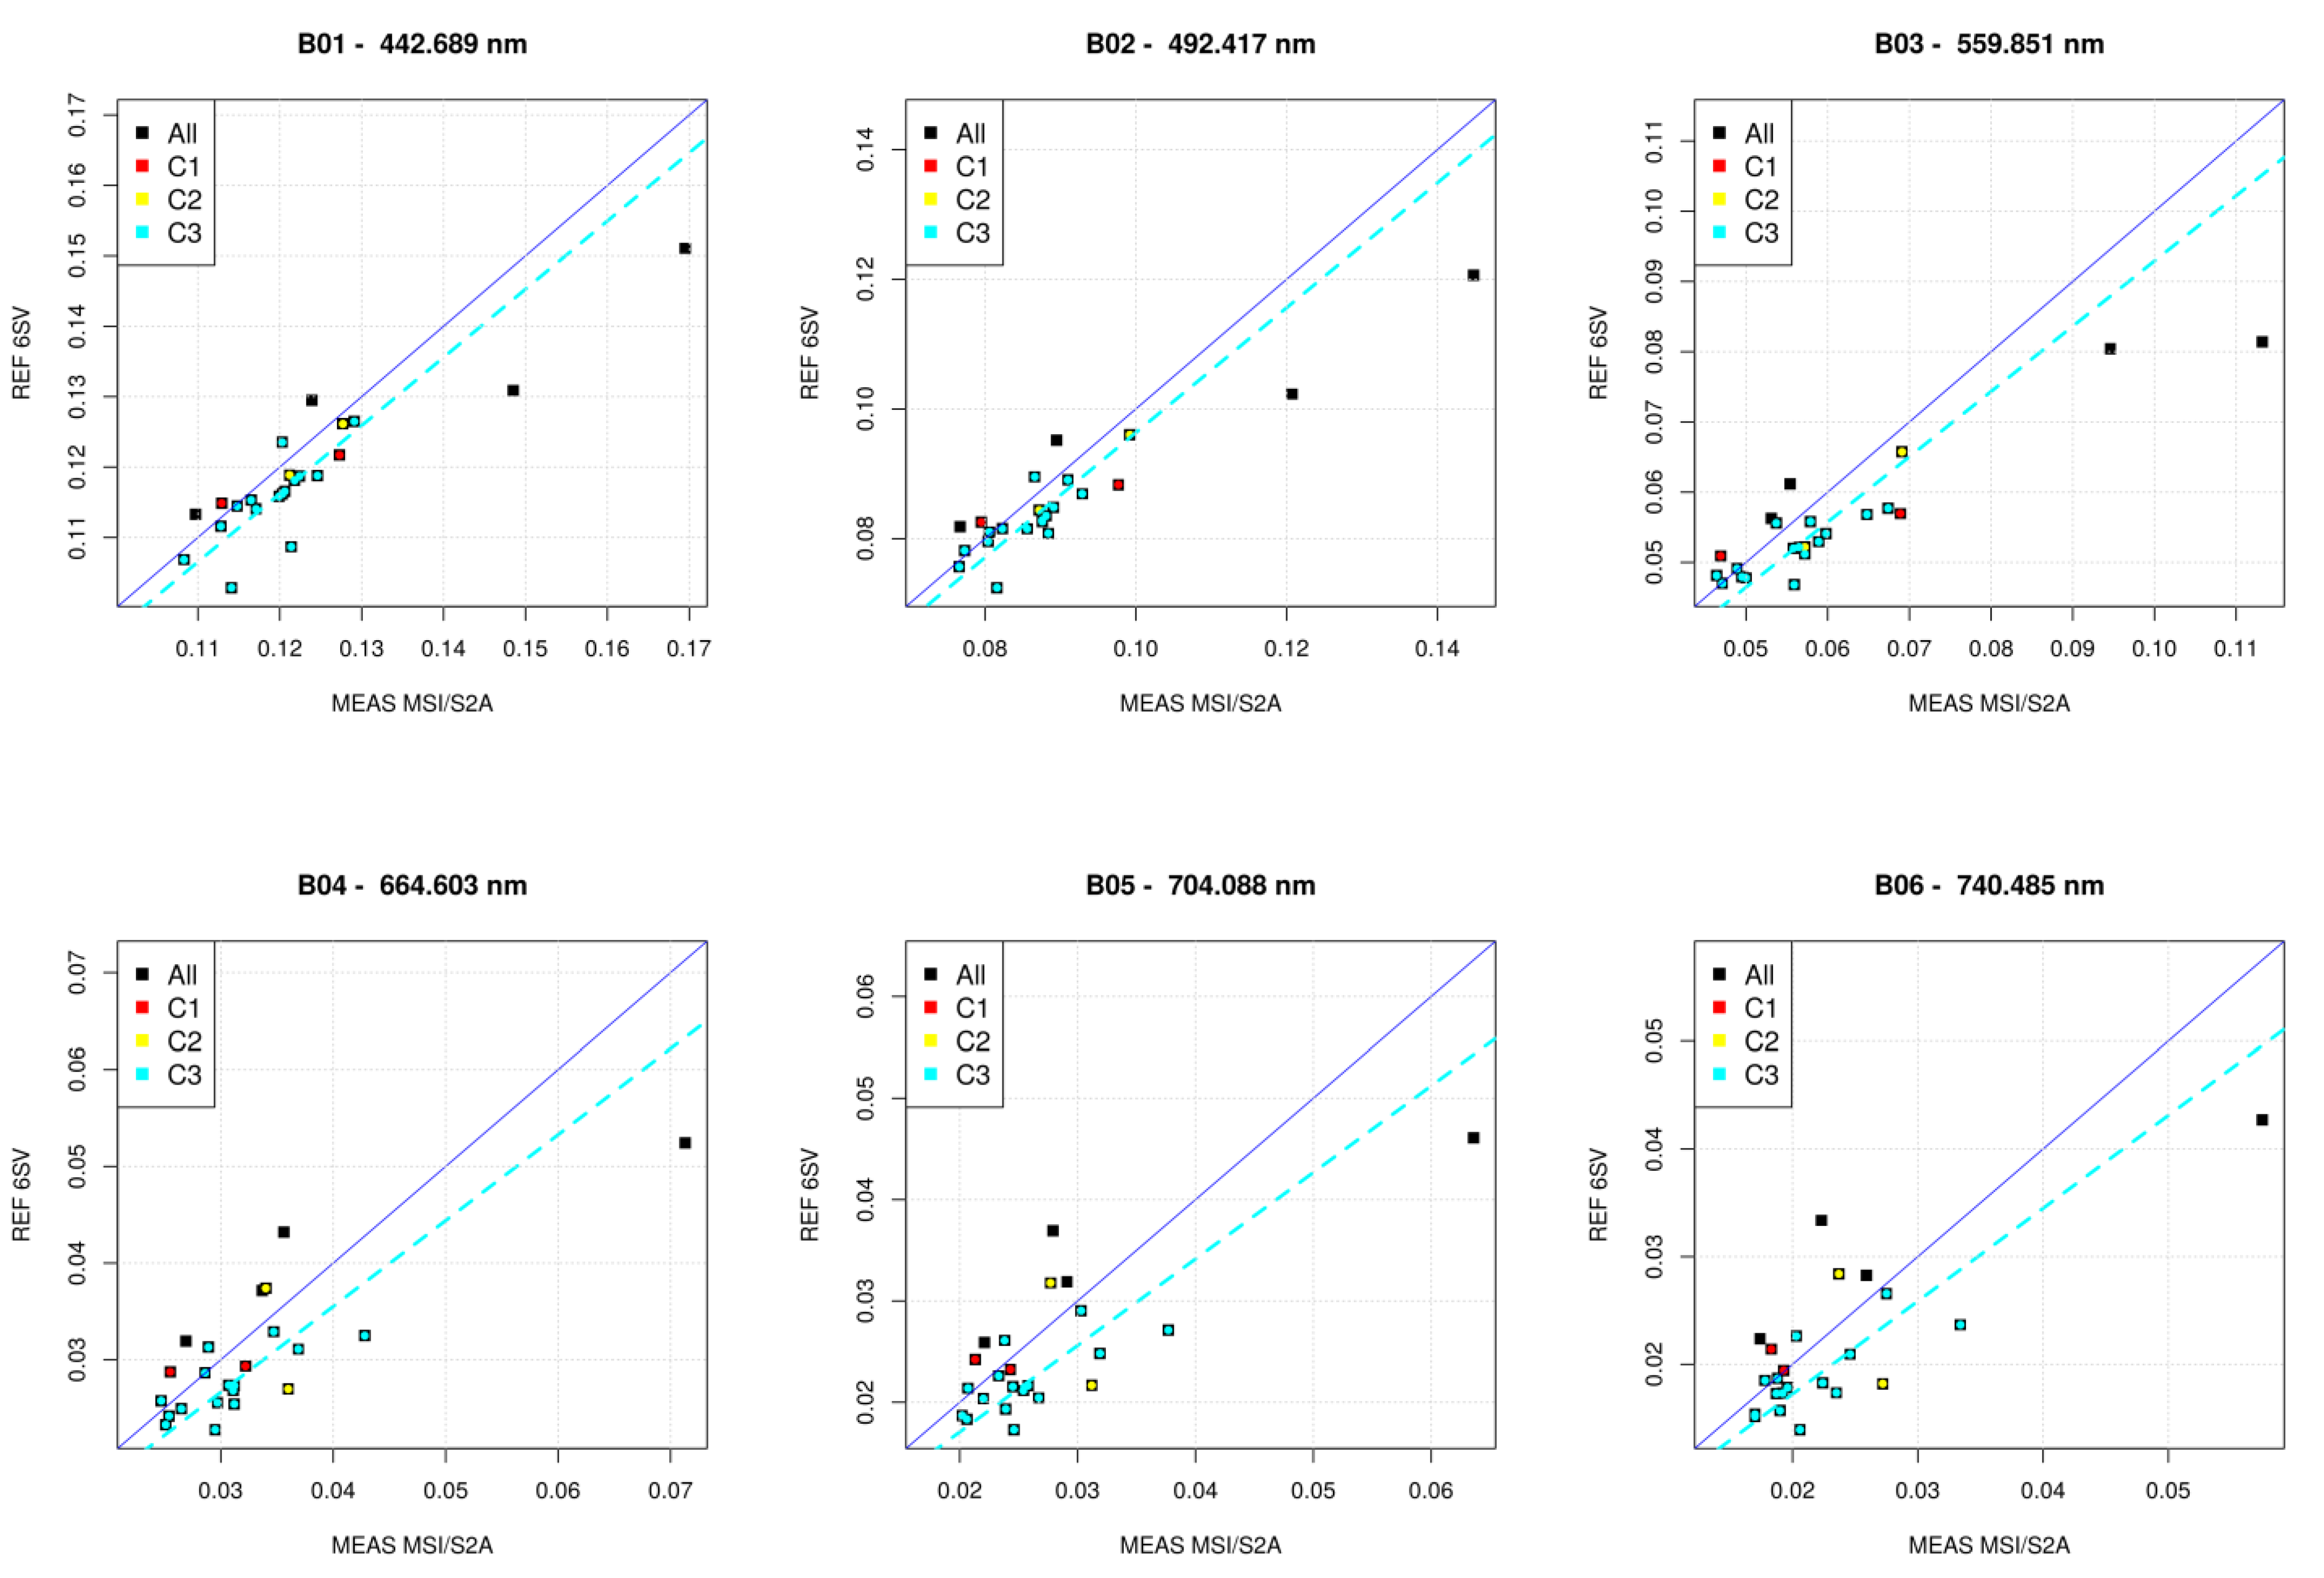
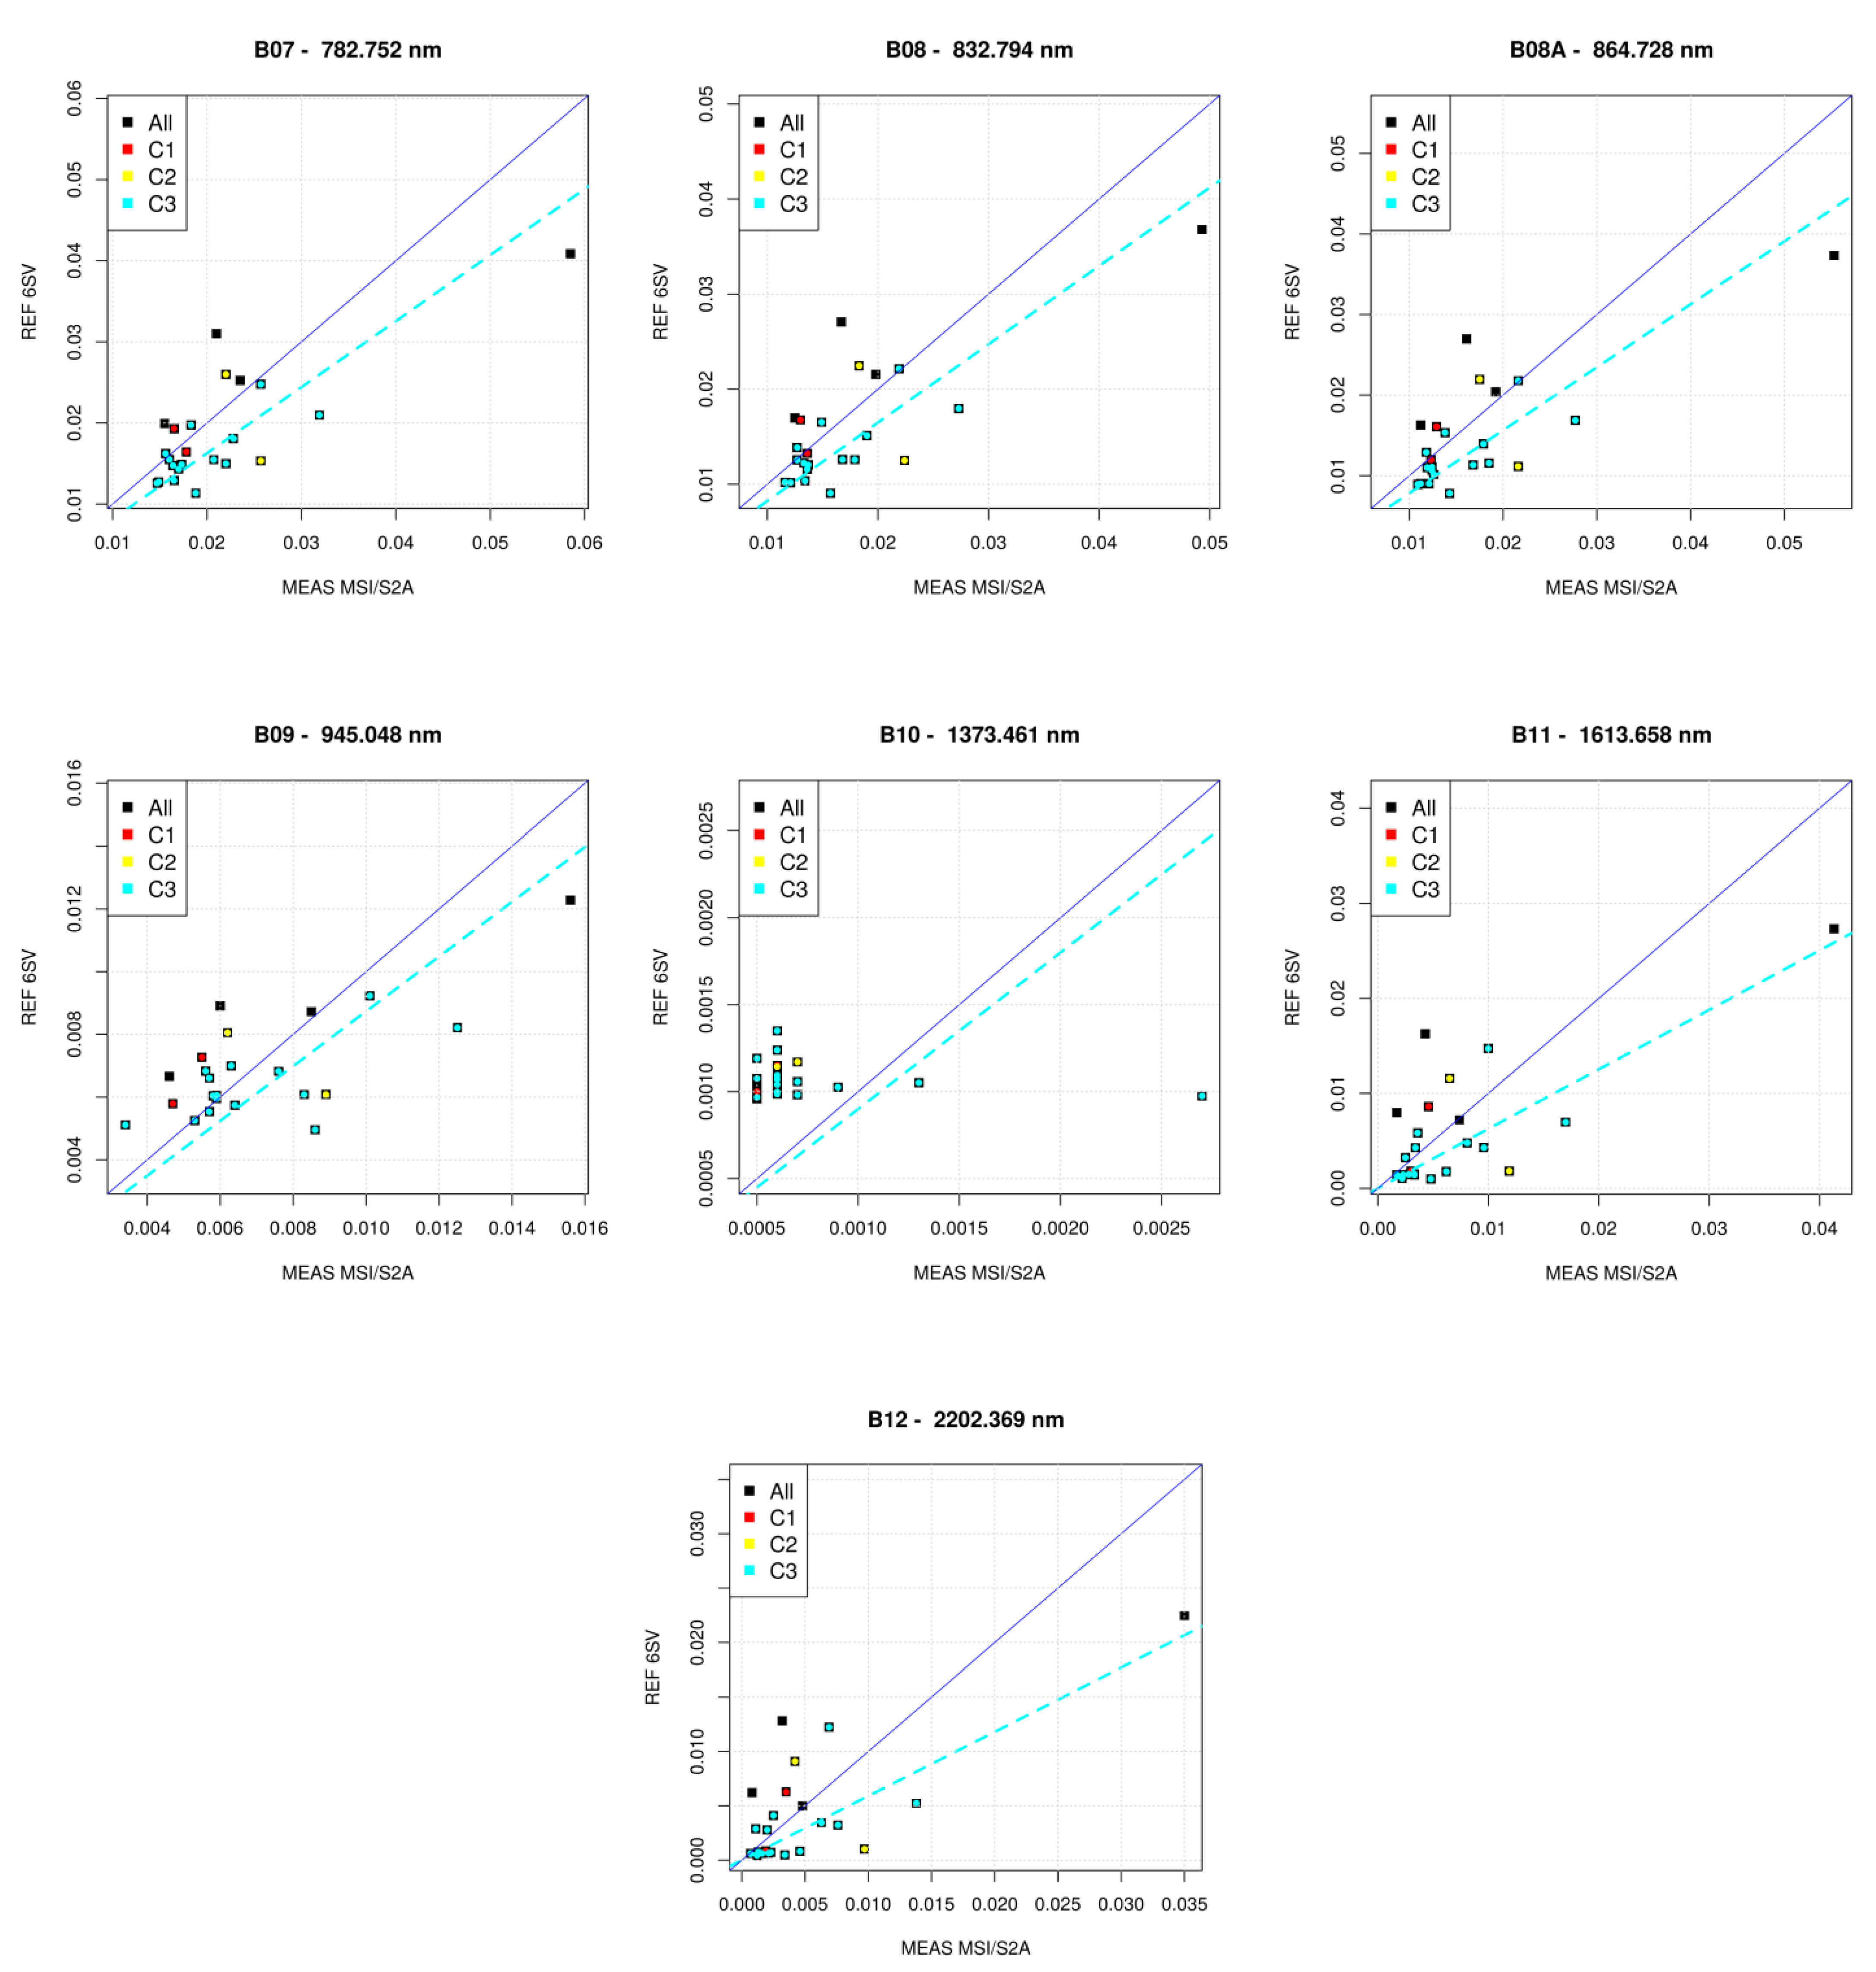
The results for MIS/S2A are presented with the same organization of the OLI/L8 results in the previous section. Figure 6 shows all the pairs (22) of the TOA reflectance for MSI/S2A as simulated by 6SV, REF, vs. the median of ROIs pixels, MEAS, for the MSI/S2A images available in quasi-synchronous condition to the AERONET-OC products reported in the Table 1. In the case of MSI/S2A, the C1 red points are the data removed during the first screening applied to the first MSI/S2A band (B01); the C2 yellow points during the second screening applied to the B03 and the C3 cyan points are the data after the third screening applied to the B09 band.
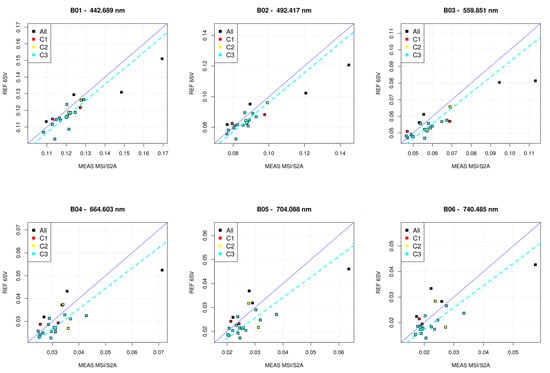
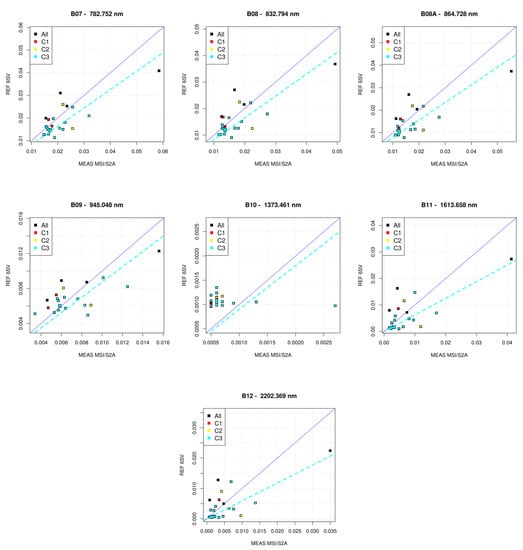
Figure 6.
The TOA reflectance simulated by 6SV vs. the measured TOA reflectance for each MSI/S2A band. The red points (C1) are the data removed by the first screening, the yellow points (C2)) are the data removed by the second screening, and the cyan points (C3) are the 15 final values used for gains retrieval.
The MSI/S2A Belharmony gains were retrieved by using the REF/MEAS ratios sample composed by 15 elements resulting from the last screening, the C3 points of Figure 6, where the initial ratios suitable for gains searching were 22.
Table 4 reported the Belharmony gains as median of the 9 ratios (MD) for each MSI/S2A band with its standard deviation (SD); the band 10 is omitted because of its specific cirrus detection and not involved in the monitoring of the water by satellite data. The wvl is the wavelength of each band calculated by Equation (2). As for the OLI/L8, the standard deviation increases with the wavelength and a decreasing of the precision of the retrieved gains is expected in these bands that are beyond the spectral limit (700 nm) of the 6SV water modeling.

Table 4.
Belharmony gains as median (MD) and the standard deviation (SD) for MSI/S2A bands. The wavelength of each band (wvl) is calculated by Equation (2).
4. Validation of the Gains
The atmospheric correction of the OLI/L8 and MSI/S2A images removed during the screening procedure, and consequently not included for the final Belharmony gains calculations, was performed to evaluate if a better accuracy of the resulting reflectance of remote sensing (Rrs) was achieved when the Belharmony gains are used. The partial dataset was composed of 11 elements for OLI/L8 and seven elements for MSI/S2A sensor. The Rrs was obtained by applying the ACOLITE atmospheric correction software [42,43,44,45] without gains, with the application of the well-known Pahlevan gains [5,6,29] and with the Belharmony gains. The ACOLITE is able to estimate the Rrs over complex coastal waters for both OLI/L8 [42,45] and MSI/S2A [42,43]. As reported in [42], the ACOLITE was designed to be open access and user-friendly to encourage the user community to provide helpful suggestions for improvements of the accuracy of the atmospheric correction results over aquatic targets.
For both OLI/L8 and MSI/S2A, the considered Rrs was the median of the Rrs of the pixels within the ROIs of the AERONET-OC stations (explained in the Section 2.2). These Rrs medians were matched-up to the concurrent AERONET-OC Rrs in order to test and validate the performance when the Pahlevan and the Belharmony gains are used. To this aim, the hyperspectral water-leaving reflectance, obtained by the interpolation reported in the Section 2.3.1 of the AERONET-OC product, were convolved to the sensors RSR by the Equation (2).
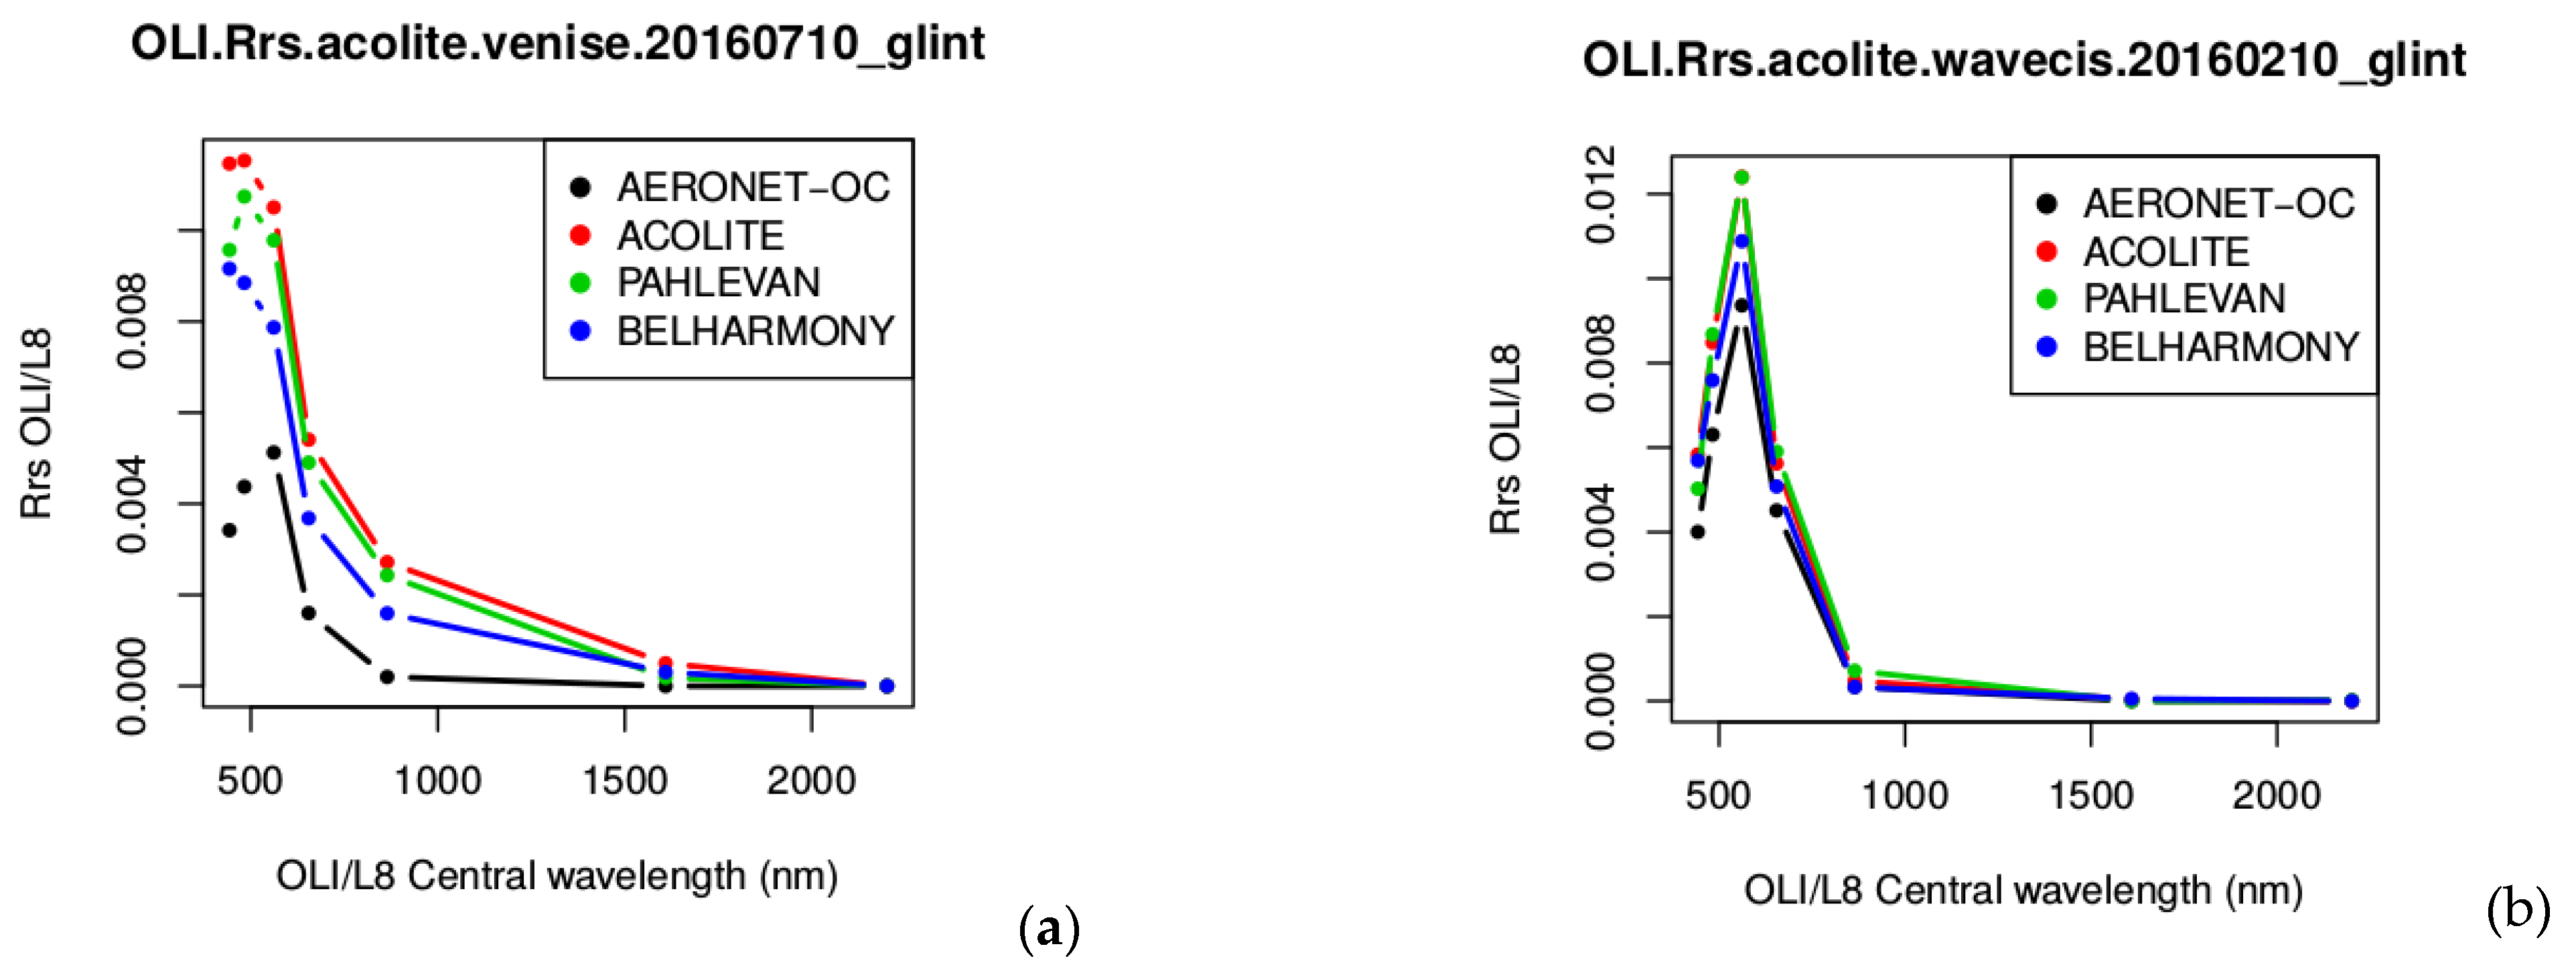
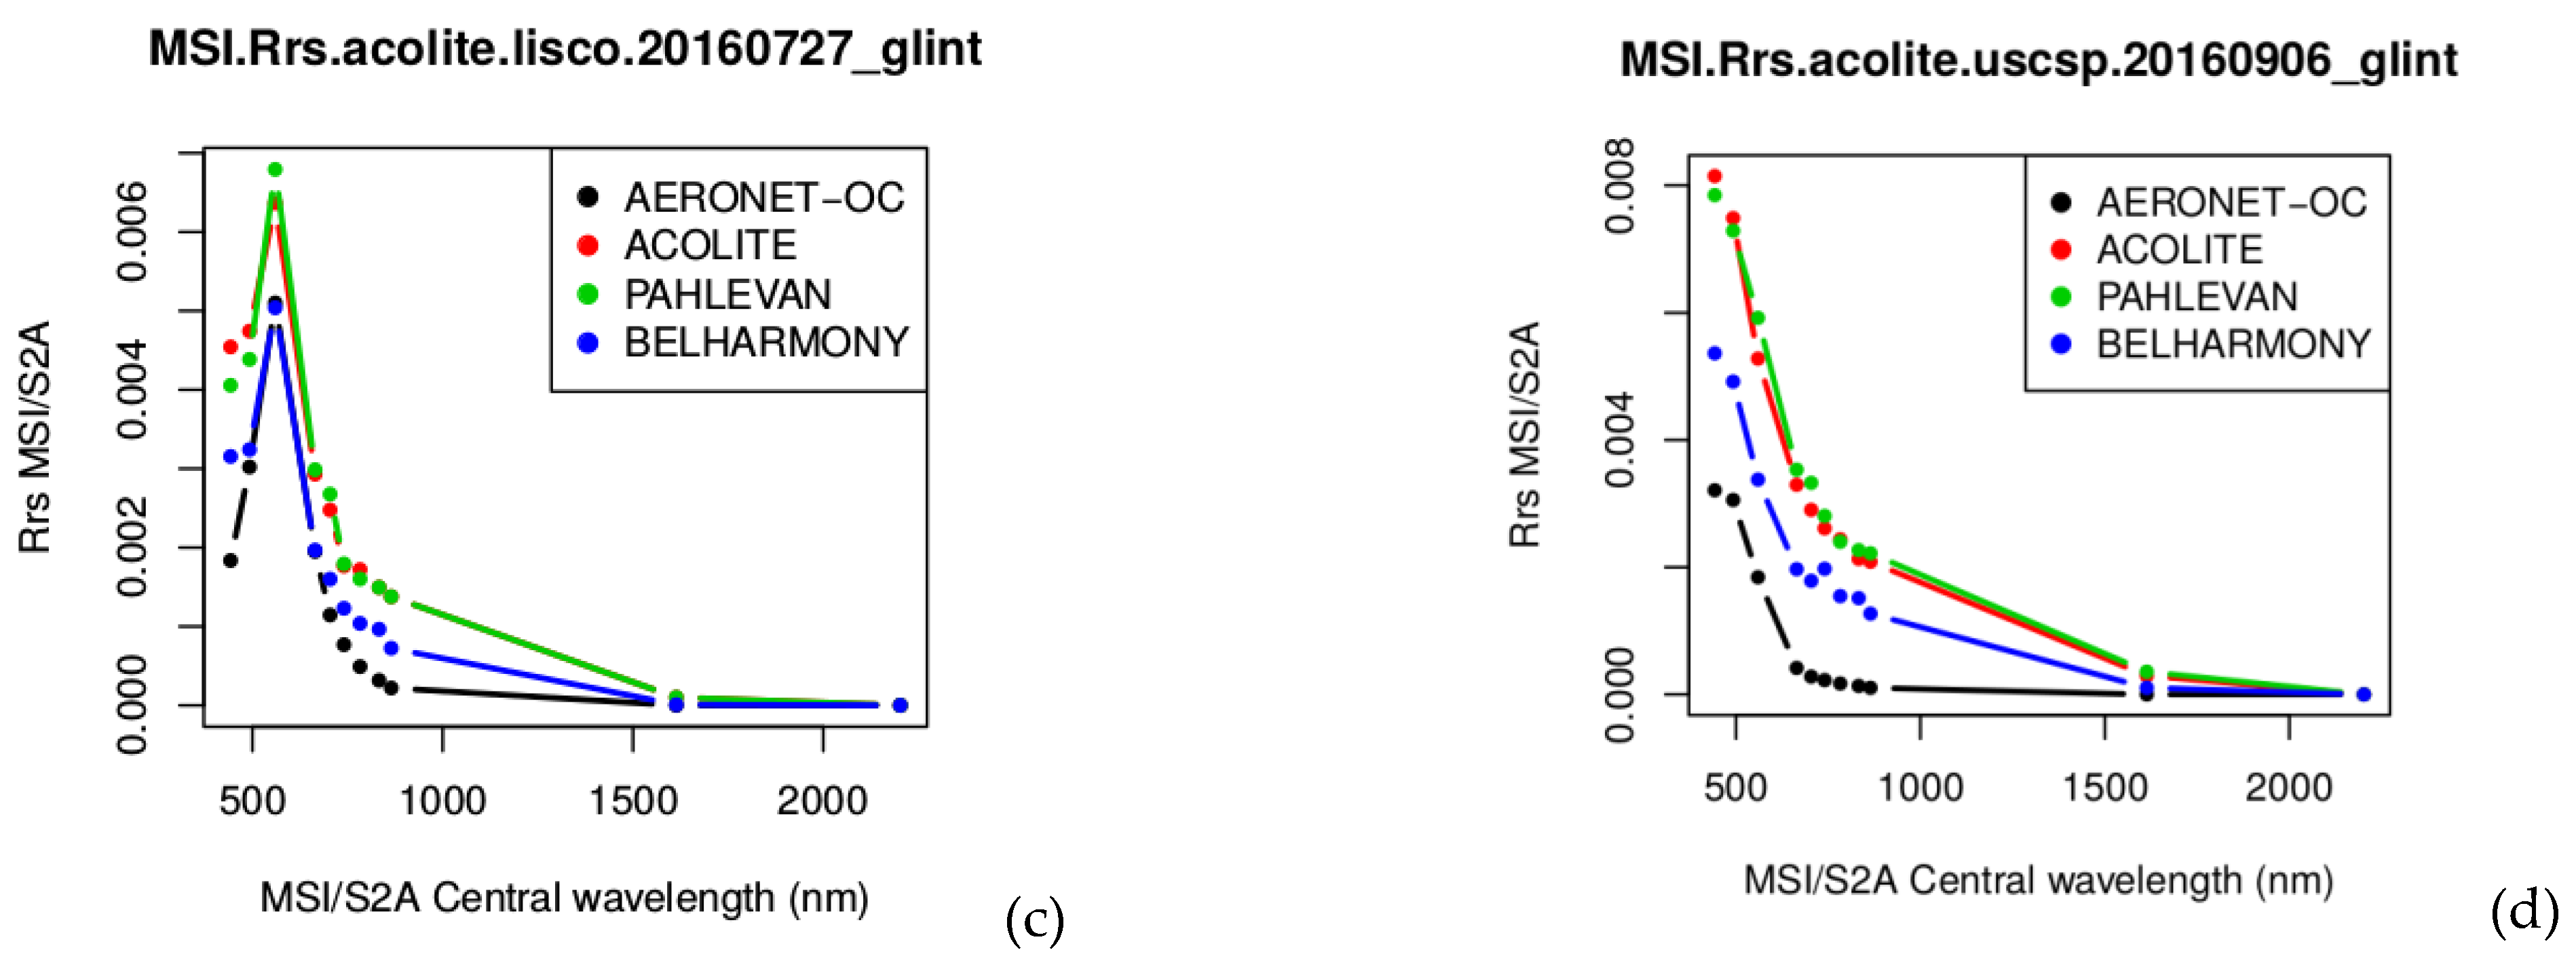
Figure 7 shows examples of the Rrs obtained by ACOLITE without gains (red) and with Pahlevan (green) and Belharmony (blue) gains and the corresponding AERONET-OC product (black) for images removed during the screenings. The examples are reported above for OLI/L8 and below for MSI/S2A sensors, respectively. In all the examples for both the sensors, the Rrs seems better defined by using the Belharmony gains than the Pahlevan ones, except for the first bands where there is not a clear improvement of the OLI/L8 and MSI/S2A Rrs with the Belharmony gains.
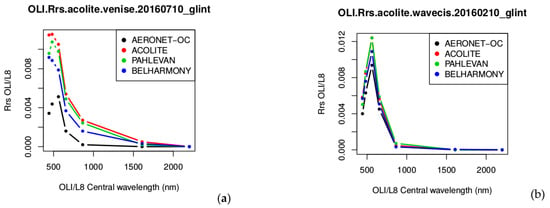
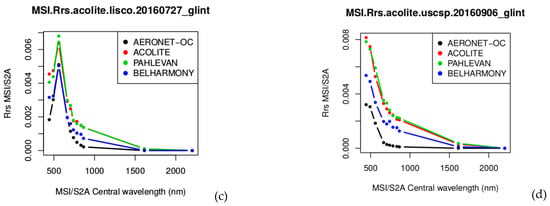
Figure 7.
Examples of the output of ACOLITE (Rrs) obtained without gains (red) and with Pahlevan (green) and Belharmony (blue) gains. The AERONET-OC products (black) are also reported. The Rrs are obtained from OLI/L8 (bottom, (a,b)) and MSI/S2A (below, (c,d)) images not used for final Belharmony gains calculations.
Performance Metrics
In order to evaluate the Rrs obtained by ACOLITE with the Belharmony gains, the performance metrics are applied to the OLI/L8 and MSI/S2A images not used for the Belharmony gains retrieval, which means to the partial dataset composed by only the images removed by the screenings (C1 and C2 removed data). The analysis of the performance applied to the partial dataset ensures the validity and reliability of the Rrs obtained by ACOLITE with the Belharmony gains.
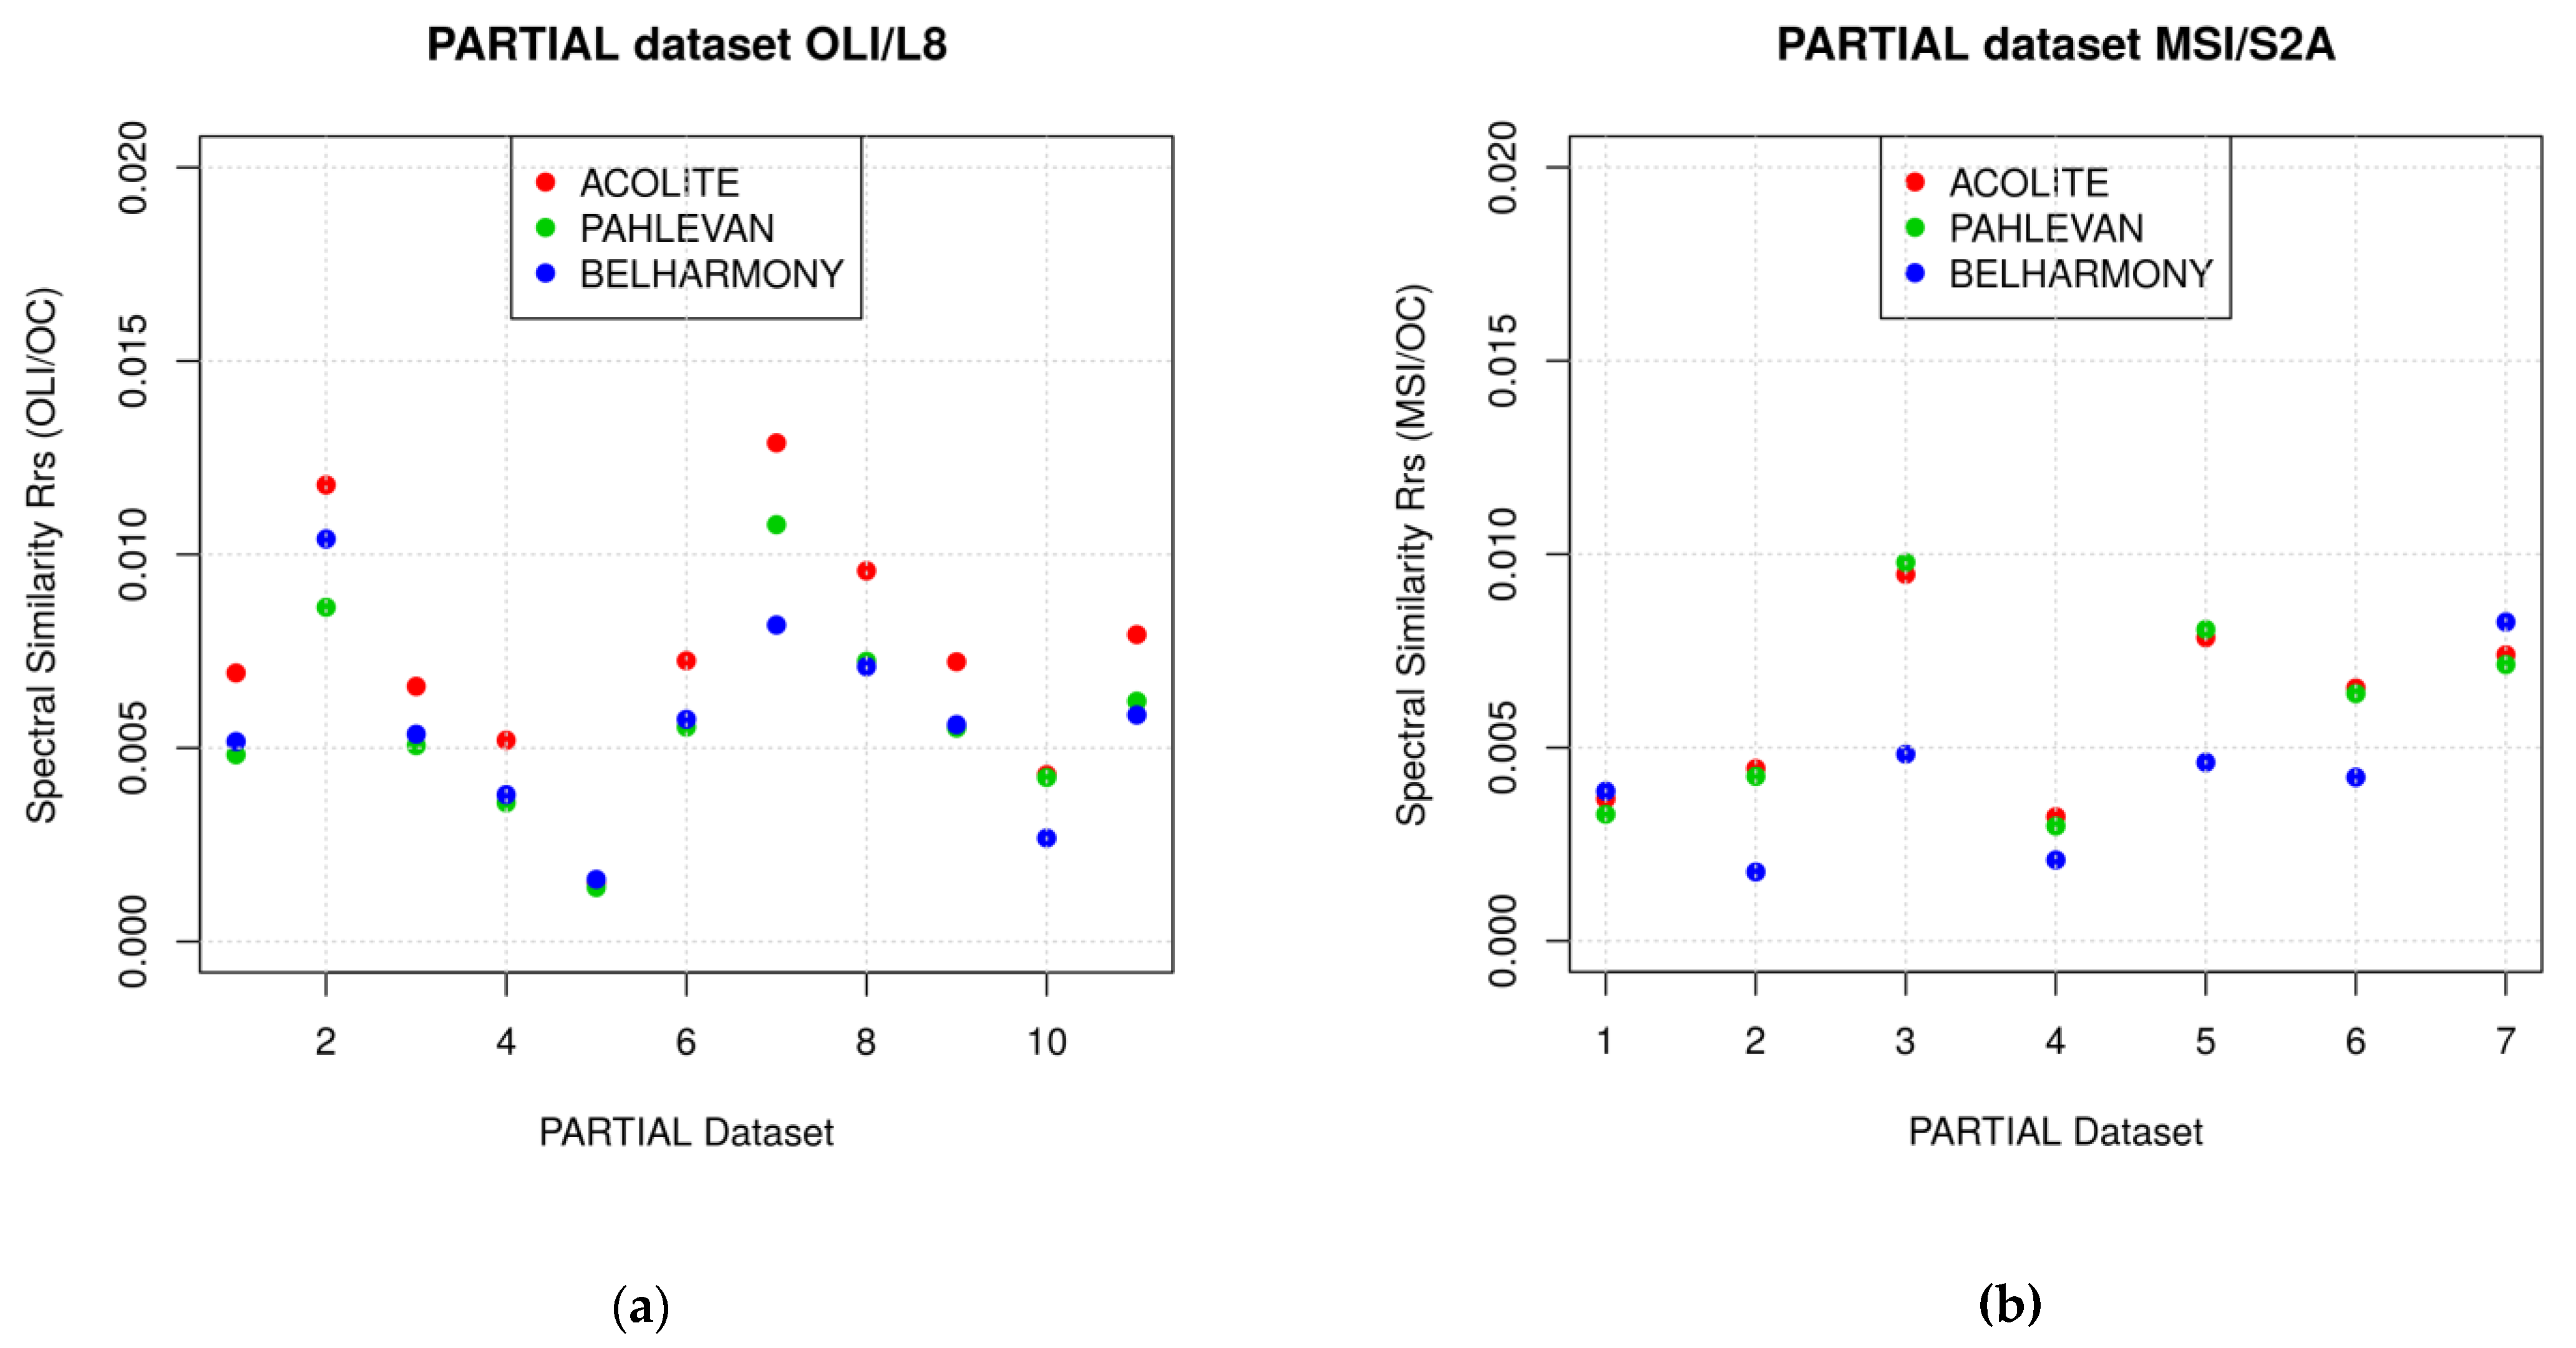
The spectral similarity (Figure 8) highlights if the spectral behavior of the retrieved Rrs is similar to the AERONET-OC Rrs by computing the Euclidean distance of all the bands of the Rrs retrieved by ACOLITE and provided by AERONET-OC site
where xi is the Rrs of the i sensor band and yi is the corresponding AERONET-OC product. Generally, the spectral behavior of Rrs appears similar to the AERONET-OC products when the Pahlevan and Belharmony gains are applied to the OLI/L8 images, with respect to the Rrs obtained without gains, whereas a more similar Rrs is obtained with Belharmony gains in the case of the MSI/S2A images.
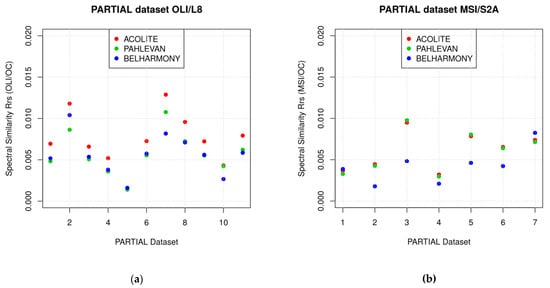
Figure 8.
Spectral similarity of the Rrs provided by AERONET-OC and obtained by ACOLITE with Pahlevan and Belharmony gains and without gains for (a) OLI/L8 and (b) MSI/S2A.
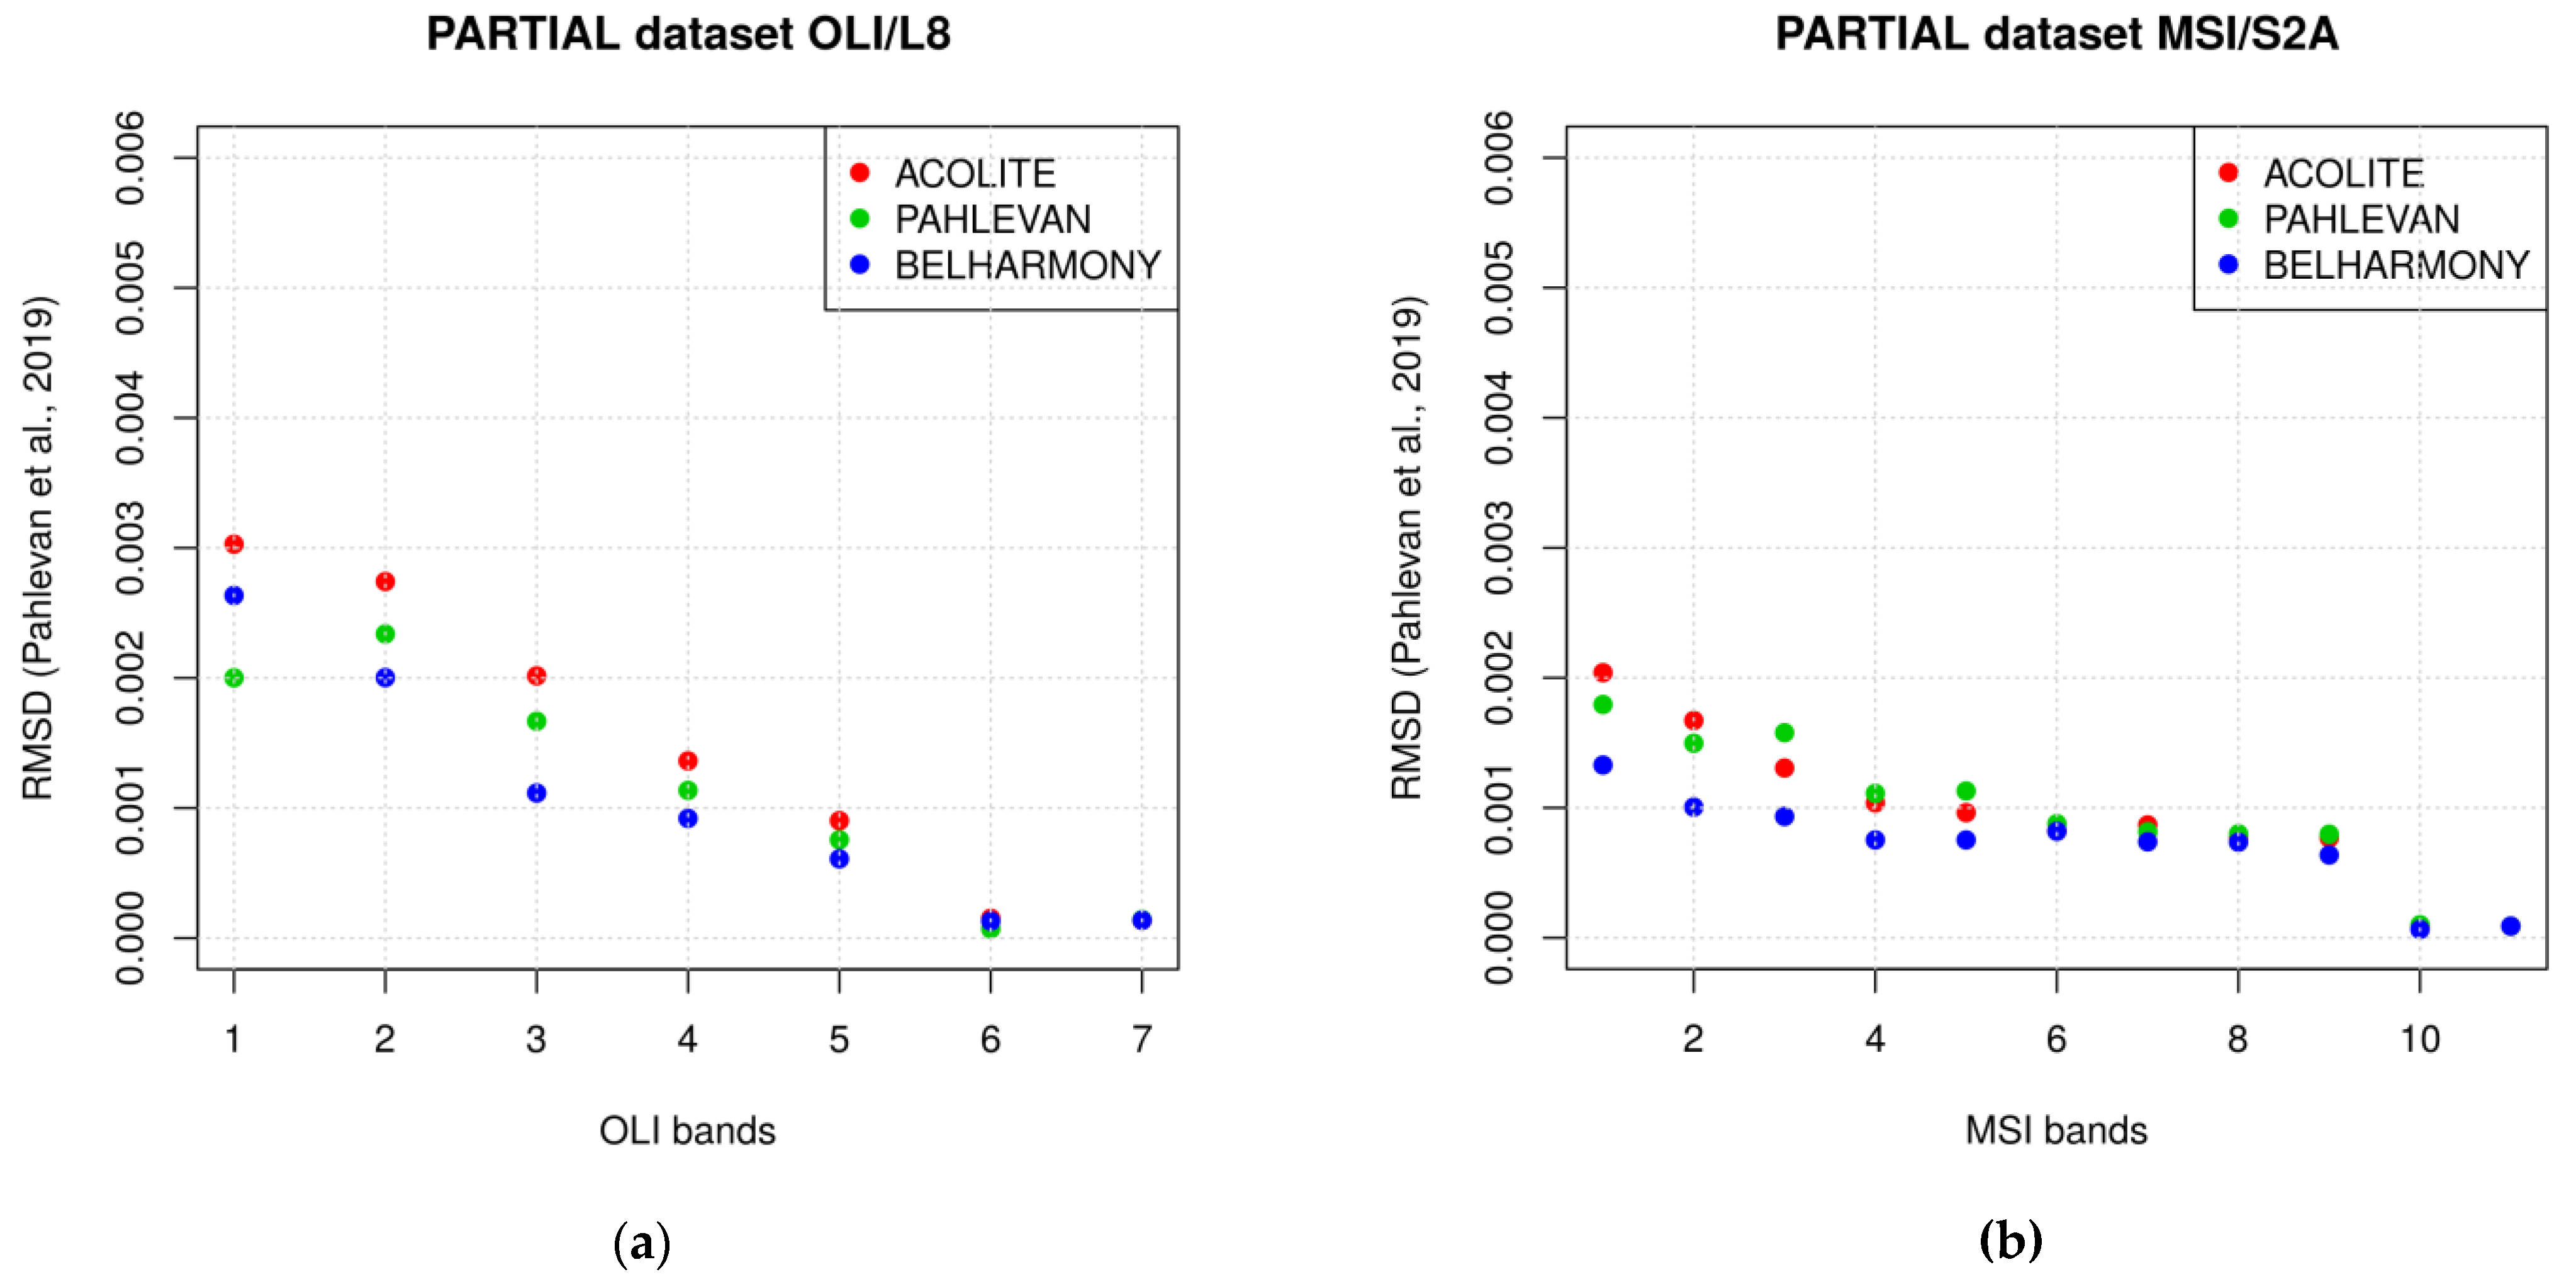
Figure 9 shows the root mean square deviation (RMSD) [25] calculated between the AERONET-OC Rrs and the image retrieved Rrs. The RMSD shows a clear improvement of the ACOLITE Rrs in all the visible bands of both the sensors when the Belharmony gains are applied, expect for the first band of the OLI/L8 sensor (first points of the plot (a) of the Figure 9). In the last bands belonging to the SWIR spectral domain (B07 for OLI/L8 and B12 for MSI/S2A), the performance is unchanged.
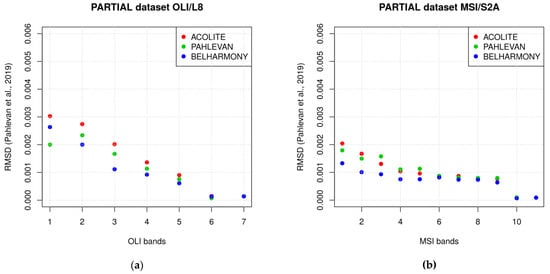
Figure 9.
Root mean square deviation (RMSD) of Rrs provided by AERONET-OC and obtained by ACOLITE with Pahlevan and Belharmony gains and without gains for (a) OLI/L8 and (b) MSI/S2A not included in the Belharmony calculation.
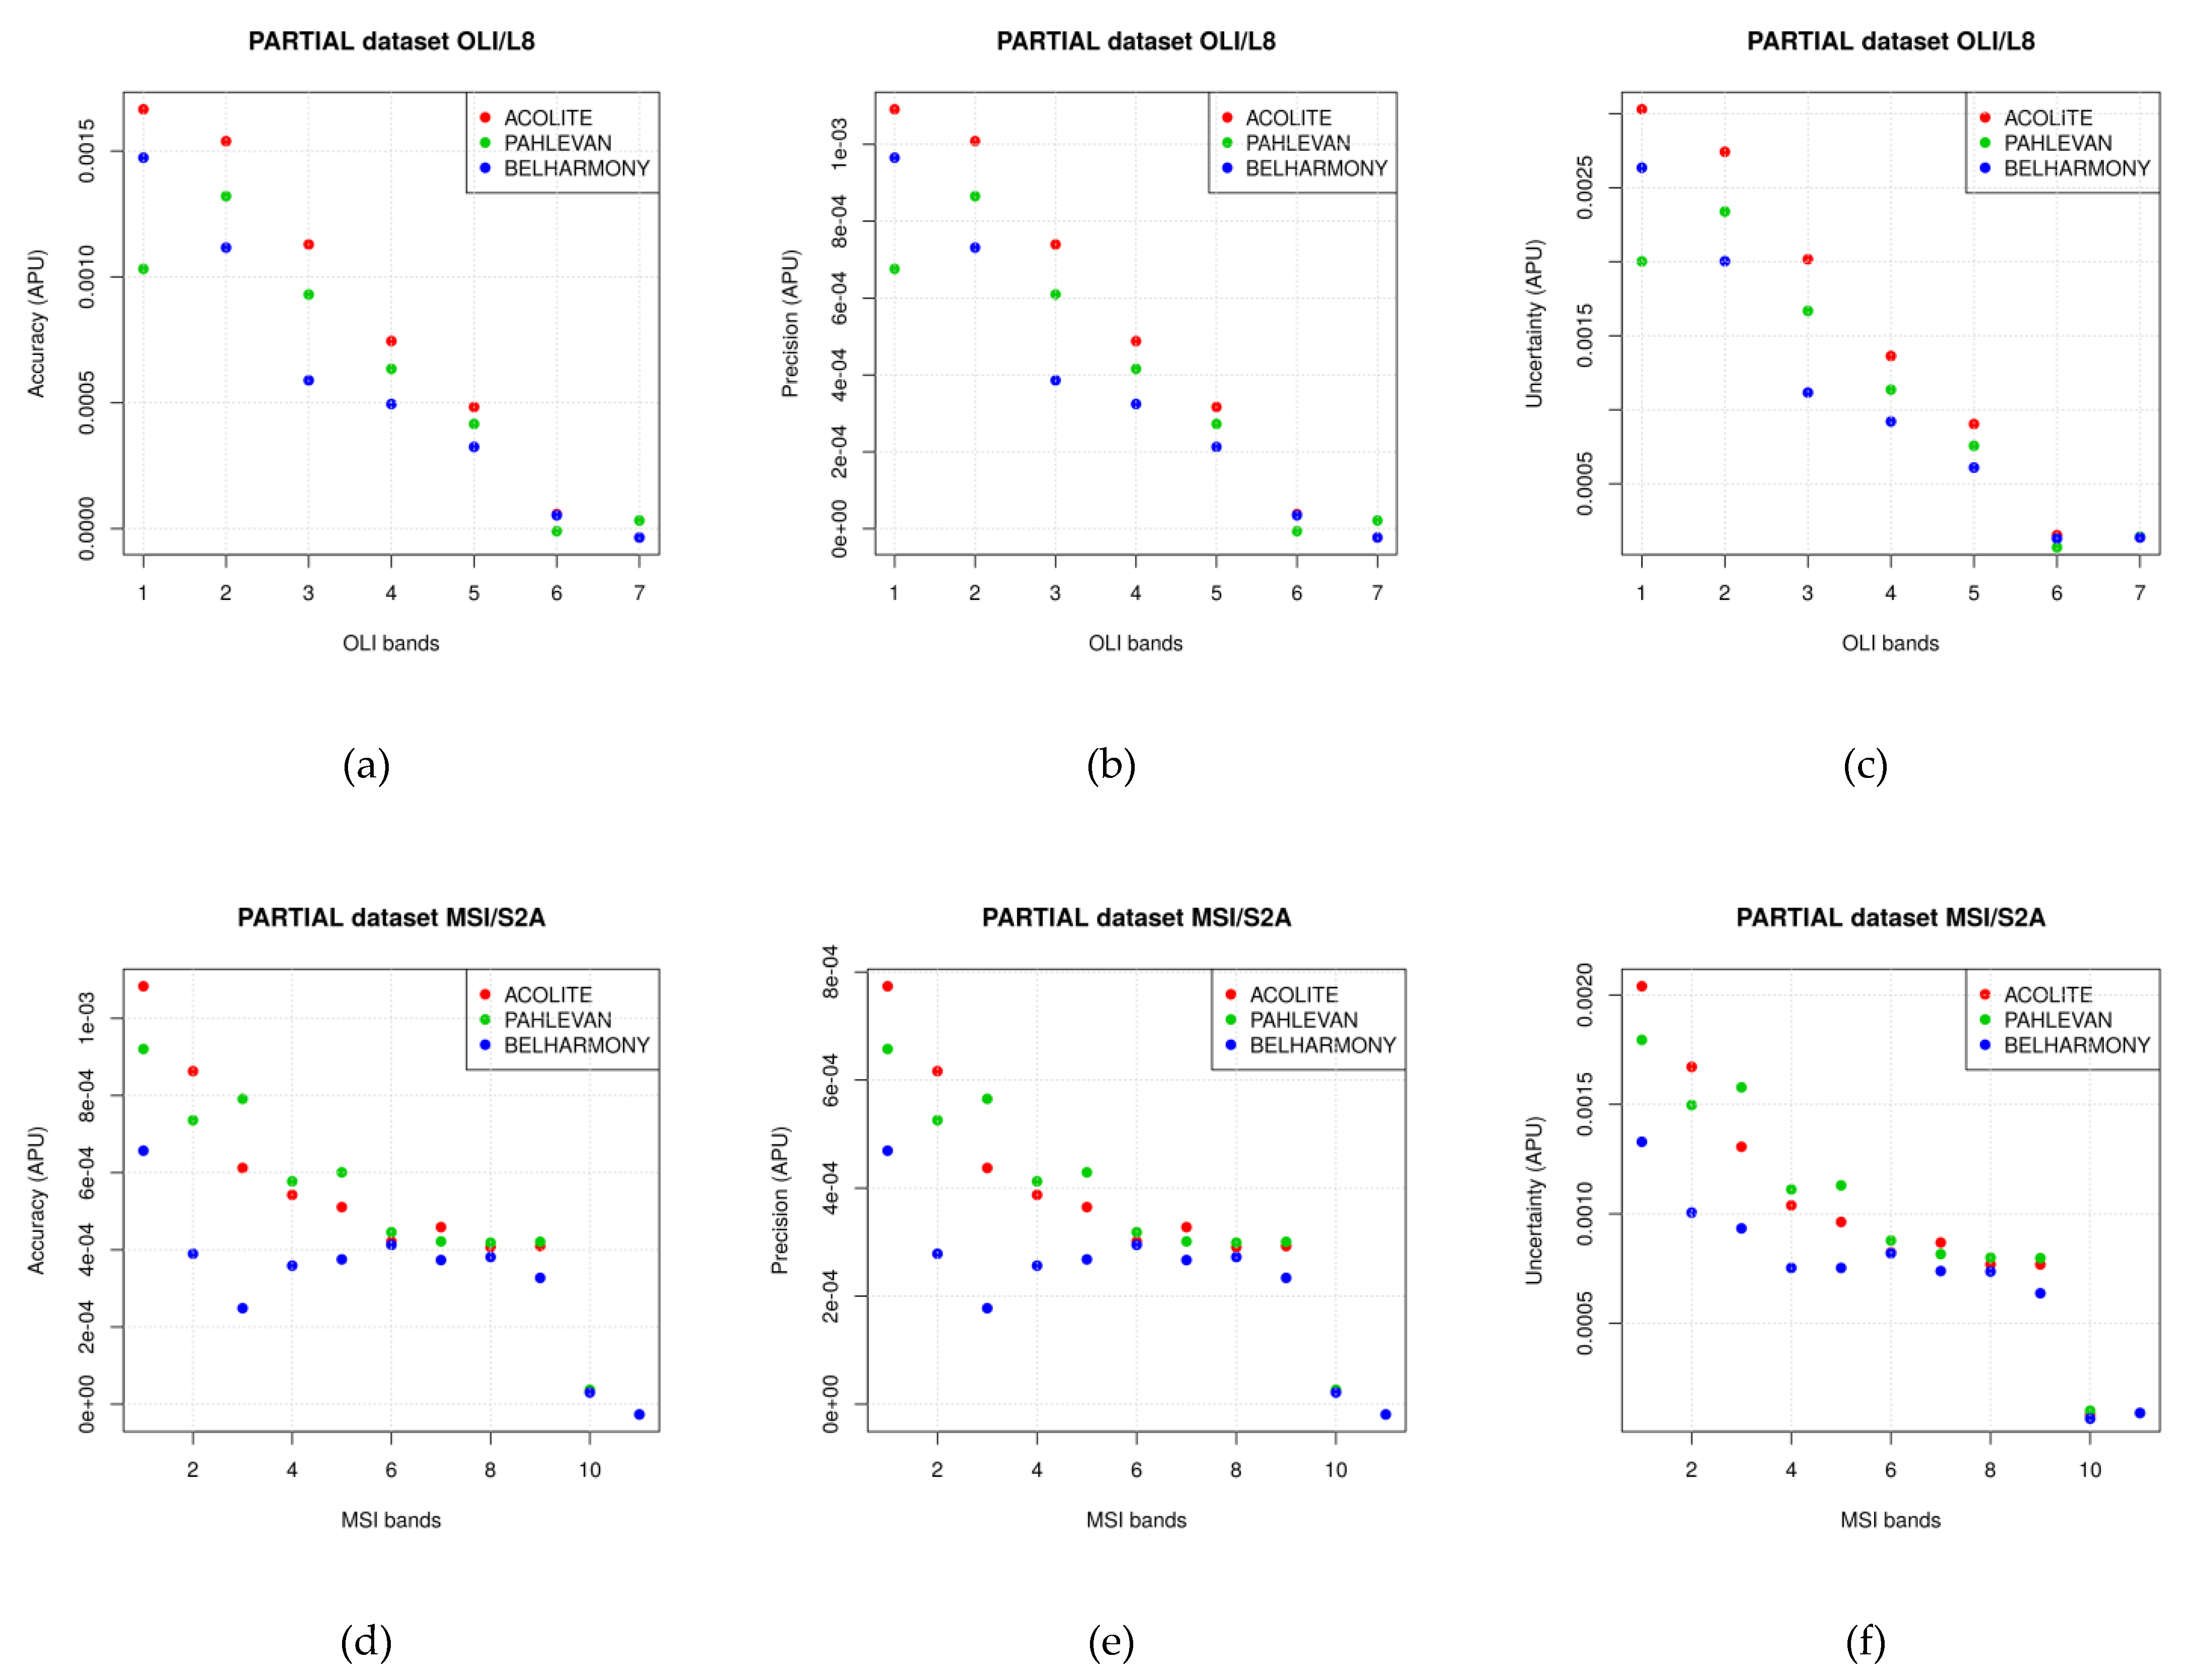
The performance evaluation of the Belharmony gains is completed by computing the accuracy, precision, and uncertainty (APU) as reported in [46]. The APU are shown in Figure 10 for the Rrs of each band of OLI/L8 and MSI/S2A in case of no gains and Pahlevan and Belharmony gains, using the AERONET-OC Rrs as reference. The APU highlight the improvement of the Rrs obtained with Belharmony gains with respect to the other Rrs, expect for the first OLI/L8 band. From the accuracy, a lower mean bias between Rrs with Belharmony gains and the AERONET-OC product is shown for both the sensors (above and below plots on the left). The precision reveals the enhancement of the repeatability when the Belharmony gains are considered (above and below plots on the center), and the uncertainty highlights the higher deviation of the Rrs of ACOLITE from the AERONET-OC product when the atmospheric correction is performed considering the Pahlevan gains respect on the Belharmony gains (above and below plots on the right).
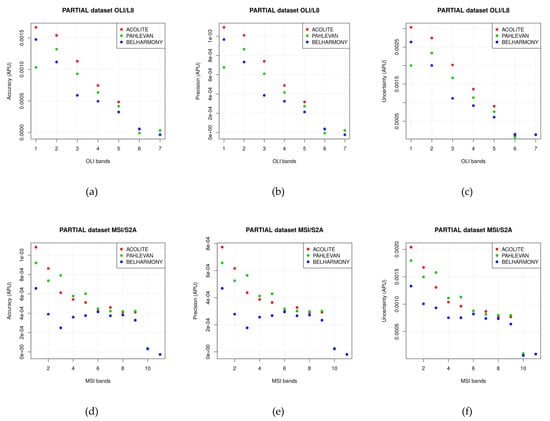
Figure 10.
Accuracy (a,d), precision (b,e), and uncertainty (c,f) (APU) of the ACOLITE Rrs with Pahlevan and Belharmony gains and without gains for all the bands of OLI/L8 (above) and MSI/S2A (below).
In general, the performance of the Rrs obtained by ACOLITE with Belharmony gains is substantially better than the other Rrs especially in the visible spectral domain as expected for the limitation of the 6SV water modeling until 700 nm. Therefore, the Belharmony gains improve the Rrs in the 400–700 nm spectral domain expect for the first OLI/L8 band where the Pahlevan gain works properly.
5. Discussion
The results show the validity of the Belharmony low-radiance gains derived in this study in terms of the Rrs obtained by the atmospheric correction of OLI/L8 and MSI/S2A data.
The accurate determination of the low-radiance gains is principally addressed in this paper by the model employed to generate the simulated signal (REF), which is accurate for coastal water simulation [13], and also by the introduction of the downward diffuse component reflected diffusely towards the sensor, not considered in the model as reported in [38]. Furthermore, particular attention was paid to the sources of errors during the simulation assuming a detailed depiction of atmosphere and water by the quality assured AERONET atmospheric and aquatic products [9].
The median and the standard deviation reported in Table 3 and Table 4 are compliant with the accuracy of the gains over waterbodies. Indeed, the second band of both the sensors has an error of 4%, which is less than the limit (5%) desired for the blue bands over oceanic waters [13].
The gains in the other bands contain a larger uncertainty as expected for the spectral limit (700 nm) of the 6SV water modeling explained in Section 2.3.1.
As a result, the ACOLITE atmospheric correction algorithm showed good performance metrics of the Belharmony Rrs especially in the visible spectral domain, until 700 nm.
From the Figure 8 and Figure 9, the Rrs obtained with Belharmony low radiance gains show a consistently lower deviation from the AERONET-OC reference measurements than the Pahlevan gains, except for the first band of OLI/L8.
In this respect, note that the gains are more consistent in the case of MSI/S2A compared to OLI/L8 as attested by the APU analysis shown in Figure 10.
In conclusion, the statistic performance reveals a slight overestimation of the AERONET-OC product.
The present procedure is suitable for retrieval of reliable calibration gains even if searching suitable remotely data with synchronous AERONET-OC atmospheric and aquatic products can be hard and not always data are available.
6. Conclusions
This work presents a procedure for the retrieval of radiometric gains to be applied to the at-sensor signal prior to the atmospheric correction in order to optimize the Rrs for the analysis and monitoring of water quality parameters in coastal environment. In particular, gains were retrieved for Multispectral Instrument on-board the Sentinel-2 (MSI/S2A) and the Operational Land Imager on-board Landsat 8 (OLI/L8).
The approach is based on the simulation of the radiative field in the water–atmosphere system. To this aim, the method takes into account the AERONET-OC aquatic and atmospheric products as characteristics of the system for modeling the radiative transfer by the second simulation of a satellite signal in the solar spectrum-vector (6SV) code. In this context, the procedure retrieves the gain factors (Belharmony gains) as the ratio between the simulated (REF) and the measured (MEAS) top of atmosphere (TOA) reflectance, starting from the atmospheric and water properties and from the geometrical configuration of acquisition of each image of the sensors. The REF/MEAS ratios are the at-sensor gains required to improve the accuracy of the Rrs obtained from the atmospheric correction of satellite images acquired over water which means in low radiance condition.
The procedure is applied to OLI/L8 and MSI/S2A images acquired over AERONET-OC sites when concurrent aquatic and atmospheric products at Level 2.0 are available. The Belharmony gains show an improvement of the Rrs retrieved by ACOLITE atmospheric correction software for both OLI/L8 and MSI/S2A sensors with respect to the previous gains retrieved in [5,6,29], except for the first OLI/L8 band where the Pahlevan gains seem to work properly. These results are corroborated by the good performance metrics when the ACOLITE atmospheric correction software is applied. Thus, the Belharmony gains could lead to a more accurate detection and monitoring of the water quality by using OLI/L8 or MSI/S2A data separately or harmonized for retrieval of Landsat-Sentinel-2 products are reported in [25].
The described procedure could be applied to other sensors with bands close to the CIMEL-SeaPrism photometer bands to provide or update gains for water quality analysis by using remote sensing data, even if they can be originally planned for land applications.
Author Contributions
Conceptualization, C.B. and S.S.; methodology, C.B.; validation, C.B.; investigation, C.B.; resources, C.B.; data curation, C.B.; writing—original draft preparation, C.B.; writing—review and editing, C.B. and S.S.; supervision, S.S.; project administration, S.S.; funding acquisition, S.S. All authors have read and agreed to the published version of the manuscript.
Funding
This research was funded by the Belgian Science Policy Office (Belspo) through the Stereo program (Belharmony project) (Contract number: NR SR/00/356).
Acknowledgments
The authors thank the principal investigators (Pls) of AERONET-OC sites and their staff for establishing and maintaining these sites and distributing the products through the portal.
Conflicts of Interest
The authors declare no conflict of interest.
References
- Platt, T.; Hoepffner, N.; Stuart, V.; Brown, C. (Eds.) Why Ocean Colour? The Societal Benefits of Ocean-Colour Technology, Reports of the International Ocean-Colour Coordinating Group, No. 7; IOCCG: Dartmouth, NS, Canada, 2008; Available online: https://ioccg.org/wp-content/uploads/2015/10/ioccg-report-07.pdf (accessed on 22 January 2021).
- CEOS Virtual Constellations: Ocean Colour Radiometry. Available online: http://ceos.org/ourwork/virtual-constellations/ocr/ (accessed on 22 January 2021).
- Bailey, S.W.; Hooker, S.B.; Antoine, D.; Franz, B.A.; Werdell, P.J. Sources and assumptions for the vicarious calibration of ocean color satellite observations. Appl. Opt. 2008, 47, 2035–2045. [Google Scholar] [CrossRef]
- Zibordi, G.; Mélin, F.; Voss, K.J.; Johnson, B.C.; Franz, B.A.; Kwiatkowska, E.; Huot, J.P.; Wang, M.; Antoine, D. System vicarious calibration for ocean color climate change applications: Requirements for in situ data. Remote Sens. Environ. 2015, 159, 361–369. [Google Scholar] [CrossRef]
- Pahlevan, N.; Lee, Z.; Wei, J.; Schaaf, C.B.; Schott, J.R.; Berk, A. On-orbit radiometric characterization of OLI (Landsat-8) for applications in aquatic remote sensing. Remote Sens. Environ. 2014, 154, 272–284. [Google Scholar] [CrossRef]
- Pahlevan, N.; Sarkar, S.; Franz, B.A.; Balasubramanian, S.V.; He, J. Sentinel-2 MultiSpectral Instrument (MSI) data processing for aquatic science applications: Demonstrations and validations. Remote Sens. Environ. 2017, 201, 47–56. [Google Scholar] [CrossRef]
- Antoine, D.A.; Guevel, P.; Deste, J.-F.; Becu, G.; Louis, F.; Scott, A.J.; Bardey, P. The “BOUSSOLE” Buoy-A New Transparent to Swell Taut Mooring Dedicated to Marine Optics: Design, Tests, and Performance at Sea. J. Atmos. Ocean. Technol. 2008, 25, 968–989. [Google Scholar] [CrossRef]
- Clark, D.K.; Yarbrough, M.A.; Feinholz, M.; Flora, S.; Broenkow, W.; Kim, Y.S.; Johnson, B.C.; Brown, S.W.; Yuen, M.; Mueller, J. MOBY, A Radiometric Buoy for Performance Monitoring and Vicarious Calibration of Satellite Ocean Color Sensors: Measurement and Data Analysis Protocols. In Ocean Optics Protocols for Satellite Ocean Color Sensor Validation, Revision 4; Mueller, J.L., Fargion, G.S., McClain, C.R., Eds.; NASA Goddard Space Flight Center: Greenbelt, MD, USA, 2003; Volume 6, pp. 3–34. [Google Scholar]
- Zibordi, G.; Mélin, F.; Berthon, J.F.; Holben, B.; Slutsker, I.; Giles, D.; D’Alimonte, D.; Mélin, F.; Berthon, J.-F.; Vandemark, D.; et al. AERONET-OC: A Network for the Validation of Ocean Color Primary Products. J. Atmos. Ocean. Technol. 2009, 26, 1634–1651. [Google Scholar] [CrossRef]
- Vermote, E.; Tanré, D.; Deuzé, J.L.; Herman, M.; Morcette, J.J.; Kotchenova, S.Y. Second Simulation of the Satellite Signal in the Solar Spectrum-Vector (6SV). 6S User Guide Version 3. 2006. Available online: https://salsa.umd.edu/6spage.html (accessed on 22 January 2021).
- Kotchenova, S.Y.; Vermote, E.F.; Levy, R.; Lyapustin, A. Radiative transfer codes for atmospheric correction and aerosol retrieval: Intercomparison study. Appl. Opt. 2008, 47, 2215–2226. [Google Scholar] [CrossRef]
- Kotchenova, S.Y.; Vermote, E.F. Validation of a vector version of the 6S radiative transfer code for atmospheric correction of satellite data. Part II. Homogeneous Lambertian and anisotropic surface. Appl. Opt. 2007, 46, 4455–4464. [Google Scholar] [CrossRef] [PubMed]
- Kotchenova, S.Y.; Vermote, E.F.; Matarrese, R.; Frank, J.; Klemm, J. Validation of a vector version of the 6S radiative transfer code for atmospheric correction of satellite data. Part I: Path radiance. Appl. Opt. 2006, 45, 6762–6774. [Google Scholar] [CrossRef]
- Vermote, E.F.; Tanré, D.; Deuzé, J.L.; Herman, M.; Morcrette, J.J. Second simulation of the satellite signal in the solar spectrum, 6S: An overview. IEEE Trans. Geosci. Remote Sens. 1997, 35, 675–686. [Google Scholar] [CrossRef]
- Berk, A.; Conforti, P.; Kennett, R.; Perkins, T.; Hawes, F.; van den Bosch, J. MODTRAN6: A major upgrade of the MODTRAN radiative transfer code. In Proceedings of the 6th Workshop on Hyperspectral Image and Signal Processing Evolution in Remote Sensing, Lausanne, Switzerland, 24–27 June 2014. Algorithms and Technologies for Multispectral, Hyperspectral, and Ultraspectral Imagery XX, 90880H. [Google Scholar] [CrossRef]
- Banks, A.C.; Vendt, R.; Alikas, K.; Bialek, A.; Kuusk, J.; Lerebourg, C.; Ruddick, K.; Tilstone, G.; Vabson, V.; Donlon, C.; et al. Fiducial Reference Measurements for Satellite Ocean Colour (FRM4SOC). Remote Sens. 2020, 12, 1322. [Google Scholar] [CrossRef]
- Antoine, D.; Vellucci, V.; Banks, A.C.; Bardey, P.; Bretagnon, M.; Bruniquel, V.; Deru, A.; d’Andon, O.H.F.; Lerebourg, C.; Mangin, A.; et al. ROSACE: A Proposed European Design for the Copernicus Ocean Colour System Vicarious Calibration Infrastructure. Remote Sens. 2020, 12, 1535. [Google Scholar] [CrossRef]
- Liberti, G.L.; D’Alimonte, D.; di Sarra, A.; Mazeran, C.; Voss, K.; Yarbrough, M.; Bozzano, R.; Cavaleri, L.; Colella, S.; Cesarini, C.; et al. European Radiometry Buoy and Infrastructure (EURYBIA): A Contribution to the Design of the European Copernicus Infrastructure for Ocean Colour System Vicarious Calibration. Remote Sens. 2020, 12, 1178. [Google Scholar] [CrossRef]
- Ruddick, K.G.; Voss, K.; Boss, E.; Castagna, A.; Frouin, R.; Gilerson, A.; Hieronymi, M.; Johnson, B.C.; Kuusk, J.; Lee, Z.; et al. A Review of Protocols for Fiducial Reference Measurements of Water-Leaving Radiance for Validation of Satellite Remote-Sensing Data over Water. Remote Sens. 2019, 11, 2198. [Google Scholar] [CrossRef]
- Copernicus. Europe’s Eyes on Earth. Available online: http://www.copernicus.eu (accessed on 22 January 2021).
- Donlon, C.; Berruti, B.; Buongiorno, A.; Ferreira, M.H.; Féménias, P.; Frerick, J.; Goryl, P.; Klein, U.; Laur, H.; Mavrocordatos, C.; et al. The Global Monitoring for Environment and Security (GMES) Sentinel-3 mission. Remote Sens. Environ. 2012, 120, 37–57. [Google Scholar] [CrossRef]
- Esaias, W.E.; Abbott, M.R.; Barton, I.; Brown, O.B.; Campbell, J.W.; Carder, K.L.; Clark, D.K.; Evans, R.L.; Hodge, F.E.; Gordon, H.R.; et al. An overview of MODIS capabilities for ocean science observations. IEEE Trans. Geosci. Remote Sens. 1998, 36, 1250–1265. [Google Scholar] [CrossRef]
- Drusch, M.; Del Bello, U.; Carlier, S.; Colin, O.; Fernandez, V.; Gascon, F.; Hoersch, B.; Isola, C.; Laberinti, P.; Martimort, P. Sentinel-2: ESA’s optical high-resolution mission for GMES operational services. Remote Sens. Environ. 2012, 120, 25–36. [Google Scholar] [CrossRef]
- Roy, D.P.; Wulder, M.A.; Loveland, T.R.; Woodcock, C.E.; Allen, R.G.; Anderson, M.C.; Helder, D.; Irons, J.R.; Johnson, D.M.; Kennedy, R.; et al. Landsat-8: Science and product vision for terrestrial global change research. Remote Sens. Environ. 2014, 145, 154–172. [Google Scholar] [CrossRef]
- Pahlevan, N.; Chittimalli, S.K.; Balasubramanian, S.V.; Vellucci, V. Sentinel-2/Landsat-8 product consistency and implications for monitoring aquatic systems. Remote Sens. Environ. 2019, 220, 19–29. [Google Scholar] [CrossRef]
- Pahlevan, N.; Schott, J.R.; Franz, B.A.; Zibordi, G.; Markham, B.; Bailey, S.; Schaaf, C.B.; Ondrusek, M.; Greb, S.; Strait, C.M. Landsat 8 remote sensing reflectance (Rrs) products: Evaluations, intercomparisons, and enhancements. Remote Sens. Environ. 2017, 190, 289–301. [Google Scholar] [CrossRef]
- Belharmony. Harmonization of Multi-Mission High Resolution Time Series: Application to Belair. Available online: https://belharmony.vito.be/ (accessed on 22 January 2021).
- Dubovik, O.; Smirnov, A.; Holben, B.N.; King, M.D.; Kaufman, Y.J.; Eck, T.F.; Slutsker, I. Accuracy assessments of aerosol optical properties retrieved from Aerosol Robotic Network (AERONET) Sun and sky radiance measurements. J. Geophys. Res. Atmos. 2000, 105, 9791–9806. [Google Scholar] [CrossRef]
- Pahlevan, N.; Smith, B.; Binding, C.; O’Donnell, D.M. Spectral band adjustments for remote sensing reflectance spectra in coastal/inland waters. Opt. Express 2017, 25, 28650–28667. [Google Scholar] [CrossRef]
- Moses, W.J.; Saprygin, V.; Gerasyuk, V.; Povazhnyy, V.; Berdnikov, S.; Gitelson, A.A. OLCI-based NIR-red models for estimating chlorophyll-a concentration in productive coastal waters—A preliminary evaluation. Environmental Research Communications. Environ. Res. Commun. 2019, 1, 011002. [Google Scholar] [CrossRef]
- Moses, W.J.; Gitelson, A.A.; Berdnikov, S.; Saprygin, V.; Povazhnyi, V. Operational MERIS-based NIR-red algorithms for estimating chlorophyll-a concentrations in coastal waters—The Azov Sea case study. Remote Sens. Environ. 2012, 121, 118–124. [Google Scholar] [CrossRef]
- Bassani, C.; Manzo, C.; Braga, F.; Bresciani, M.; Giardino, C.; Alberotanza, L. The impact of the microphysical properties of aerosol on the atmospheric correction of hyperspectral data in coastal waters. Atmos. Meas. Tech. 2015, 8, 1593–1604. [Google Scholar] [CrossRef]
- Torres, B.; Dubovik, O.; Fuertes, D.; Schuster, G.; Cachorro, V.E.; Lapyonok, T.; Goloub, P.; Blarel, L.; Barreto, A.; Mallet, M.; et al. Advanced characterisation of aerosol size properties from measurements of spectral optical depth using the GRASP algorithm. Atmos. Meas. Tech. 2017, 10, 3743–3781. [Google Scholar] [CrossRef]
- Schuster, G.L.; Dubovik, O.; Holben, B.N. Angstrom exponent and bimodal aerosol size distributions. J. Geophys. Res. Atmos. 2006, 111. [Google Scholar] [CrossRef]
- Pace, G.; di Sarra, A.; Meloni, D.; Piacentino, S.; Chamard, P. Aerosol optical properties at Lampedusa (Central Mediterranean). 1. Influence of transport and identification of different aerosol types. Atmos. Chem. Phys. 2006, 6, 697–713. [Google Scholar] [CrossRef]
- Moore, K.D.; Voss, K.J.; Gordon, H.R. Spectral reflectance of whitecaps: Their contribution to water-leaving radiance. J. Geophys. Res. Ocean 2000, 105, 6493–6499. [Google Scholar] [CrossRef]
- Charles, C.; Walter, M. Measurement of the Roughness of the Sea Surface from Photographs of the Sun’s Glitter. J. Opt. Soc. Am. 1954, 44, 838–850. [Google Scholar] [CrossRef]
- Lu, Z.; Li, J.; Shen, Q.; Zhang, B.; Zhang, H.; Zhang, F.; Wang, S. Modification of 6SV to remove skylight reflected at the air-water interface: Application to atmospheric correction of Landsat 8 OLI imagery in inland waters. PLoS ONE 2018, 13, e0202883. [Google Scholar] [CrossRef]
- Press, W.H.; Teukolsky, S.A.; Vetterling, W.T.; Flannery, B.P. Numerical Recipes in FORTRAN; The Art of Scientific Computing, 2nd ed.; Cambridge University Press: New York, NY, USA, 1993. [Google Scholar]
- Bassani, C.; Cavalli, R.M.; Pignatti, S. Aerosol optical retrieval and surface reflectance from airborne remote sensing data over land. Sensors 2010, 10, 6421. [Google Scholar] [CrossRef]
- Bassani, C.; Cavalli, R.M.; Antonelli, P. Influence of aerosol and surface reflectance variability on hyperspectral observed radiance. Atmos. Meas. Tech. 2012, 5, 1139–1203. [Google Scholar] [CrossRef]
- Vanhellemont, Q. Adaptation of the dark spectrum fitting atmospheric correction for aquatic applications of the Landsat and Sentinel-2 archives. Remote Sens. Environ. 2019, 225, 175–192. [Google Scholar] [CrossRef]
- Vanhellemont, Q.; Ruddick, K. Acolite for Sentinel-2: Aquatic applications of MSI imagery. In Proceedings of the 2016 ESA Living Planet Symposium; Prague, Czech Republic, 9–13 May 2016, ESA Special Publication: Paris, France, 2016; Volume 740, pp. 9–13. [Google Scholar]
- Vanhellemont, Q.; Ruddick, K. Advantages of high quality {SWIR} bands for ocean colour processing: Examples from Landsat-8. Remote Sens. Environ. 2015, 161, 89–106. [Google Scholar] [CrossRef]
- Vanhellemont, Q.; Ruddick, K. Turbid wakes associated with offshore wind turbines observed with Landsat 8. Remote Sens. Environ. 2014, 145, 105–115. [Google Scholar] [CrossRef]
- Vermote, E.; Justice, C.; Claverie, M.; Franch, B. Preliminary analysis of the performance of the Landsat 8/OLI land surface reflectance product. Landsat 8 Science Results. Remote Sens. Environ. 2016, 185, 46–56. [Google Scholar] [CrossRef]
Publisher’s Note: MDPI stays neutral with regard to jurisdictional claims in published maps and institutional affiliations. |
© 2021 by the authors. Licensee MDPI, Basel, Switzerland. This article is an open access article distributed under the terms and conditions of the Creative Commons Attribution (CC BY) license (http://creativecommons.org/licenses/by/4.0/).

