Article

Application of Sentinel-1 and-2 Images in Measuring the Deformation of Kuh-e-Namak (Dashti) Namakier, Iran

1
College of Geo-Exploration Science and Technology, Jilin University, Changchun 130026, China
2
College of Earth Sciences, Jilin University, Changchun 130061, China
3
School of Geodesy and Geomatics, Wuhan University, Wuhan 430079, China
*
Author to whom correspondence should be addressed.
Remote Sens. 2021, 13(4), 785; https://doi.org/10.3390/rs13040785
Submission received: 3 February 2021 / Revised: 17 February 2021 / Accepted: 18 February 2021 / Published: 20 February 2021
(This article belongs to the Section Remote Sensing in Geology, Geomorphology and Hydrology)

Abstract

:
Kuh-e-Namak (Dashti) namakier is one of the most active salt diapirs along the Zagros fold–thrust belt in Iran. Its surface deformation should be measured to estimate its long-term kinematics. Ten Sentinel-2 optical images acquired between October 2016 and December 2019 were processed by using Co-Registration of Optically Sensed Images and Correlation (COSI-Corr) method. Forty-seven Sentinel-1 ascending Synthetic Aperture Radar (SAR) images acquired between April 2017 and December 2019 were processed by using Small Baseline Subset Synthetic Aperture Radar Interferometry (SBAS-InSAR) method. The deformation of Kuh-e-Namak (Dashti) namakier was measured using both methods. Then, meteorological data were utilized to explore the relationship between the kinematics of the namakier and weather conditions and differences in macrodeformation behavior of various rock salt types. The advantages and disadvantages of COSI-Corr and SBAS-InSAR methods in measuring the deformation of the namakier were compared. The results show that: (1) The flank subsides in the dry season and uplifts in the rainy season, whereas the dome subsides in the rainy season and uplifts in the dry season. Under extreme rainfall conditions, the namakier experiences permanent plastic deformation. (2) The “dirty” rock salt of the namakier is more prone to flow than the “clean” rock salt in terms of macrodeformation behavior. (3) In the exploration of the kinematics of the namakier via the two methods, COSI-Corr is superior to SBAS-InSAR on a spatial scale, but the latter is superior to the former on a time scale.

1. Introduction

Rock salt is one of the few rocks that can flow. As a conventional element of the oil and gas system, rock salt is vital to the evolution of trap structures and the formation of oil and gas migration paths [1,2]. In addition, storage caverns can be excavated in salt diapirs to store energy or hazardous chemical and nuclear waste materials because rock salt has the characteristics of creep, good sealing, and self-deformation recovery [3]. As such, rock salt deformation on surfaces of salt diapirs should be studied to estimate the long-term kinematics of salt diapirs. The oil and gas system related to salt diapirs and the construction of storage caverns in salt diapirs should also be explored.
Exposed salts diapirs in the Zagros fold–thrust belt and central Iran between Alborz Mountains and Great Kavir provide a natural laboratory for studying surface rock salt deformation [4,5,6,7,8]. Kuh-e-Namak (Dashti) namakier is the most representative salt diapir in the Zagros fold–thrust belt in Iran and has been widely explored [9,10,11,12]. Talbot et al. used traditional measurement techniques to measure the seasonal movements of Kuh-e-Namak (Dashti) namakier [10]. However, they only measured the seasonal deformation behavior of the flank of the namakier. In terms of the namakier rock salt microstructure, Závada et al. sampled and analyzed different rock salts of the namakier. They revealed further details on the differences in the microstructure of various rock salt types. However, studies have yet to prove whether the macroscopic deformation behavior is consistent with the difference in microstructure [12].
Since the last century, traditional measurement techniques have been applied to characterize the deformation of surface rock salt [10,13]. With the development of Interferometric Synthetic Aperture Radar (InSAR) technology, Differential Interferometry Synthetic Aperture Radar (D-InSAR) technology has been widely applied to explore salt diapir deformation [14,15] because of its advantages in obtaining small surface deformations on a large scale [16,17]. Baikpour et al. and Aftabi et al. utilized D-InSAR technology to measure the deformation of the Garmsar salt nappe in the southern Alberta Mountains and the Syahoo salt diapir in the Zagros Mountains, respectively, and detected different deformation patterns of salt diapirs during the dry and rainy seasons [14,15]. Advanced multi-temporal InSAR techniques can obtain more detailed, precise configuration of surface deformation than the D-InSAR technology [18,19,20,21]. Therefore, multi-temporal InSAR techniques were applied to rapidly measure the deformation of salt diapirs [22,23,24,25]. Abolmaleki et al. and Roosta et al. utilized SBAS-InSAR technology to measure the de-formation of the Qum Kuh diapir and the buried Nasr Abad salt diapir, respectively, and described a more detailed seasonal flow pattern of salt diapirs [23,25]. Displacement measurements by SBAS-InSAR technology may achieve high accuracies, but they require that the coherence between different images is not lost due to deformation of the salt diapir. Furthermore, the COSI-Corr method is a new means of monitoring surface deformation through the subpixel-level co-registration of two different optical images [26]. It has been widely used in research on glacier flow [27,28], landslides [29,30], sand dune migration [31,32], and seismic displacement [33,34]. However, COSI-Corr method is rarely applied to diapir deformation research.
To explore the feasibility of COSI-Corr method in measuring deformation of salt diapirs, we utilized COSI-Corr and SBAS-InSAR methods to measure the deformation of Kuh-e-Namak (Dashti) namakier on the basis of Sentinel-1 and-2 images. Moreover, we compensated for the deficiency of the research on the overall deformation behavior of Kuh-e-Namak (Dashti), while studying the relationship between macrodeformation behavior of different rock salt and their microstructure. Finally, COSI-Corr and SBAS-InSAR methods were compared in terms of their advantages and disadvantages in describing the namakier kinematics.

2. Background

2.1. Geologic Setting

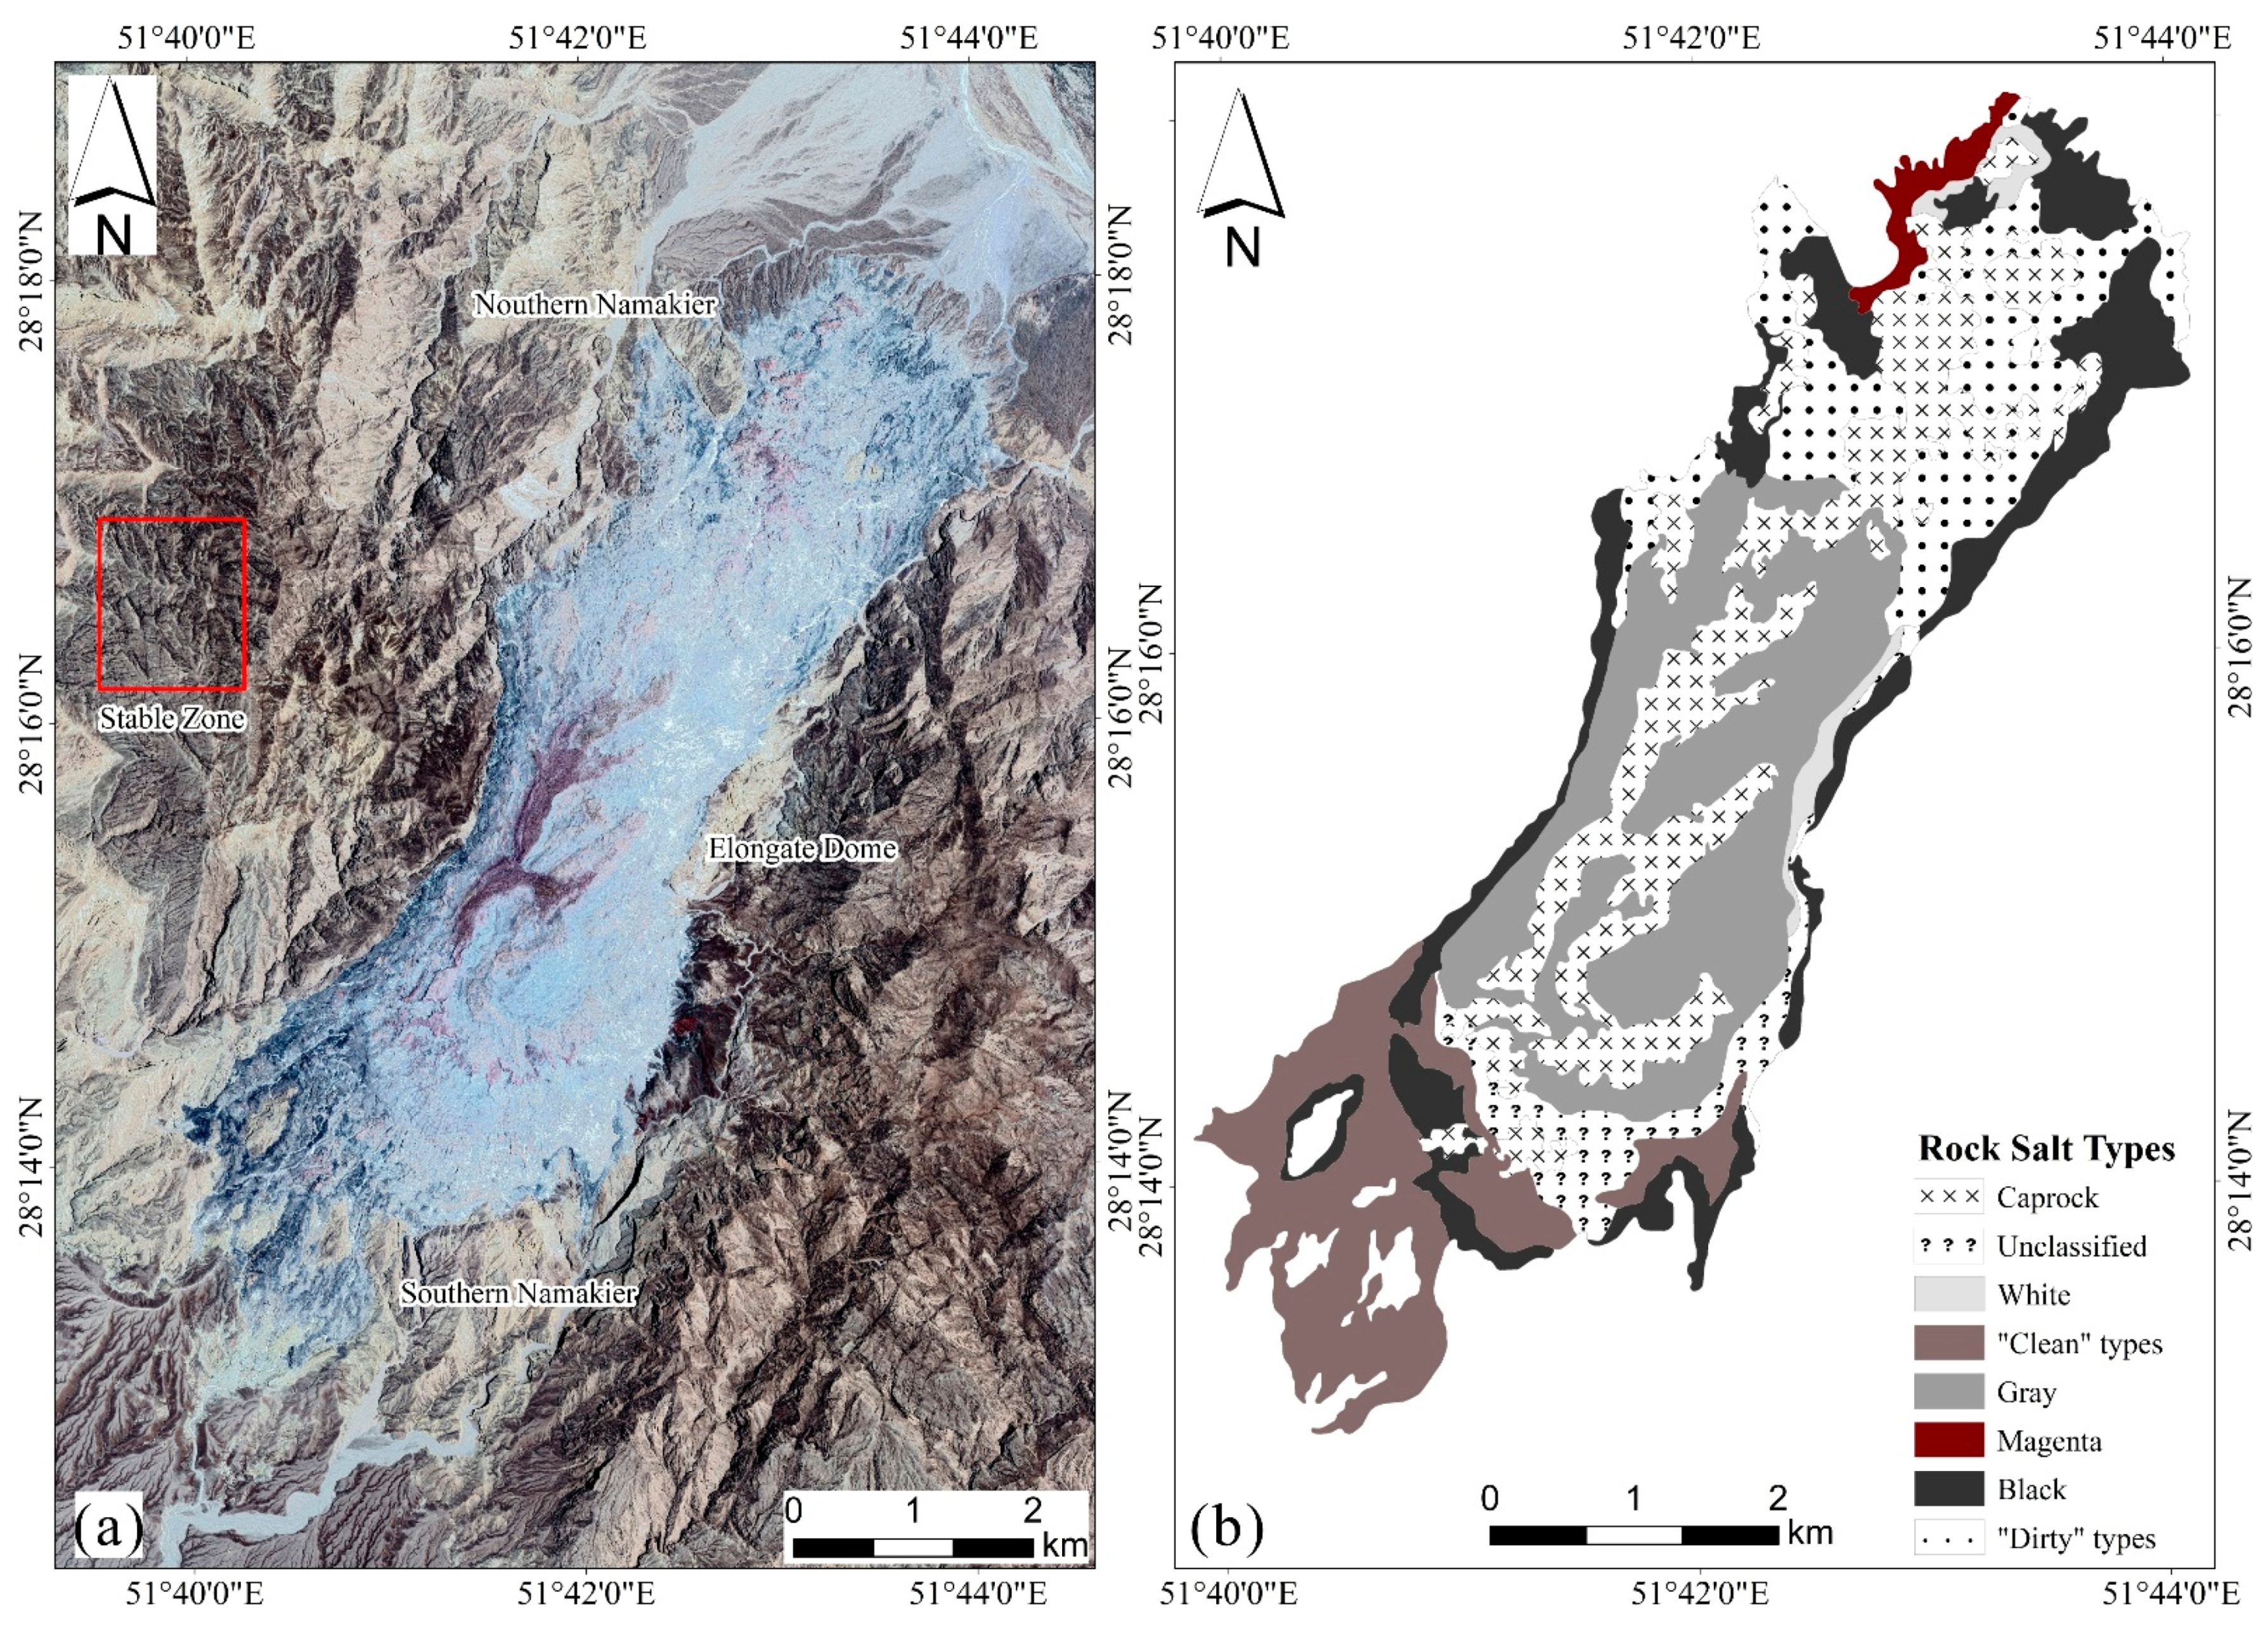
Kuh-e-Namak (Dashti) namakier is located between Dashti and Dayyer counties in Bushehr Province in Iran (Figure 1a). The namakier is composed of the Hormuz Formation rock salt, which consists of Infra-Cambrian and Cambrian evaporites with an original thickness of about 1–2.5 km [35]. In the Late Cretaceous, under the influence of compression activities related to the closure of the New Tethys Ocean, the diapir pierced the overlying Mesozoic limestone outcropping on the surface (Figure 1b). Around the Miocene, as the Arabian and Central Iranian plates continued to expand and squeeze along the main Zagros fault, rock salt continued to rise and spread around to form the namakier [36].
The namakier comprises a dome extending in the NNE–SSW direction and two flanks in the north and south (Figure 2a). The rock salt types of the namakier are defined as “dirty” rock salt containing water-insoluble residuum between 4.8 wt.% and 17 wt.% and “clean” rock salt with insoluble residuum less than 1.37 wt.%. The “dirty” rock salt originates from the Hormuz debris that is continuously comminuted and dispersed in the surrounding salt masses, resulting in different rock salt colors, such as gray, magenta, green, and black. Other “clean” rock salt without Hormuz debris appears pink, brown, orange, red, and white. “Clean” rock salt is mainly distributed in the south of the namakier, and “dirty” rock salt is mainly distributed in the dome and northern part of the namakier (Figure 2b).

2.2. Salt Diapirs Deformation

Salt diapirs deformation is related to weather conditions. Talbot et al. described the salt diapirs deformation under different weather conditions [15,38]. In terms of temperature, salt diapirs have two completely different rheological mechanisms during the dry season because of the impact of the elastic carapace with a thickness of about 5–10 m on the flow of rock salt [39]. One is the dry inflation model wherein the carapace inhibits the lateral flow of the rock salt, causing the dome to uplift and the flank to subside [38]. The other is the dry deflation model wherein the carapace hinders the uplifting of the dome but promotes the lateral flow of the rock salt, causing the flank to uplift [15].
In terms of rainfall, rock salt is one of the most soluble rocks. At 25 °C, 1 cm of rain can dissolve 0.1667 cm of salt [40]. During rainfall, as the carapace dissolves or weakens, the energy accumulated by rock salt under the carapace is quickly released, thereby accelerating the lateral flow rate of rock salt. Thus, the overall decline of the salt diapir occurs, while the flank extends outward.

3. Materials and Methods

3.1. Data

3.1.1. Optical Data

The optical data used in this research are Sentinel-2A/B images. The variation in the sun zenith angle during image acquisition results in different mountain shadows because the namakier is located in a mountainous area with a complex terrain. During correlation processing, mountain shadows cause false displacement measurements. Moreover, as Sentinel-2 Level-1C data have been orthorectified [41], orthorectification during correlation processing is unnecessary. Therefore, 10 Sentinel-2 Level-1C images with similar sun zenith angles and low cloud cover from 22 October 2016 to 26 December 2019 were collected. Table 1 shows details of collected Sentinel-2A/B images.

3.1.2. SAR Data

The SAR data used in this research is Sentinel-1A images. In total, 47 Sentinel-1A ascending images were collected from 18 April 2017 to 28 December 2019, with a sampling interval of 12 days in the rainy season and approximately 30 days in the dry season. Moreover, precise orbital ephemeris data and digital elevation Model 1 arc-seconds shuttle radar topography mission (SRTM) data were applied to orbit refinement and terrain phase removal, respectively. Table 2 shows the details of the collected data set.

3.1.3. Meteorological Data

Daily meteorological data from 1 January 2016 to 31 December 2019 were obtained from the BANDAR-E DAYYER weather station in Iran through National Oceanic and Atmospheric Administration (NOAA) to explore the relationship between the deformation of the namakier and the weather conditions. The liner distance between the station and the namakier is 50 km.
The collected daily data were measured in each month, and statistical analysis showed the area where the namakier is located from April to October in each year in the dry season and from October to April in the rainy season (Figure 3). From 2016 to 2019, the maximum precipitation in February 2017 was 284.988 mm.

3.2. Methods

3.2.1. COSI-Corr

COSI-Corr is a software module integrated in ENVI. Through the correlation of input image pairs, it can produce a horizontal displacement image comprising three bands: displacement in the east–west (E/W) and north–south (N/S) directions and the signal–noise ratio (SNR). Positive values in the E/W and N/S bands indicate the pixels move eastward and northward, respectively. SNR range from 0 to 1, and higher values indicate high confidence in measuring displacements. The image correlation accuracy is on the order of 1/20–1/10 of the pixel size [42].
In this study, as suggested by Ali et al. [43], the near-infrared band (B8) of Sentinel-2 images was taken as input, and the frequency correlator was used for correlation. The following parameters were set: initial and final window sizes to 32 × 32, step size to 1, robustness iteration to 2, and mask threshold to 0.9. In this way, eight correlation image pairs were obtained (Table 3). The accuracy of displacement measurements is on the order of 0.5–1 m.
In comparison with the 10 m spatial resolution of the Sentinel-2 image near-infrared band (B8), the DEM at 90 m spatial resolution used for Sentinel-2 Level-1C data orthorectification cannot completely eliminate terrain errors in rugged mountainous areas [44]. Therefore, an exposed area of bedrock near the namakier was selected as the stable area (Figure 2a). The mean E/W and N/S displacement values in the stable area were used to correct the errors in image registration.
After the co-registration error was eliminated, the whole displacement of the namakier was calculated using Euclidean distance (Equation (1)):
Displacement = d E W 2 + d N S 2

3.2.2. SBAS-InSAR

As a multi-temporal InSAR technology, SBAS-InSAR method obtains surface deformation by combining different interferometric pairs within the thresholds of small time–space baselines [45]. SBAS-InSAR method is more appropriate to regions lacking persistent enough scatters [46]. In this study, the SBAS-InSAR method was utilized to process the collected Sentinel-1A images in ENVI Sarscape module. The four steps of the process are presented as follows.
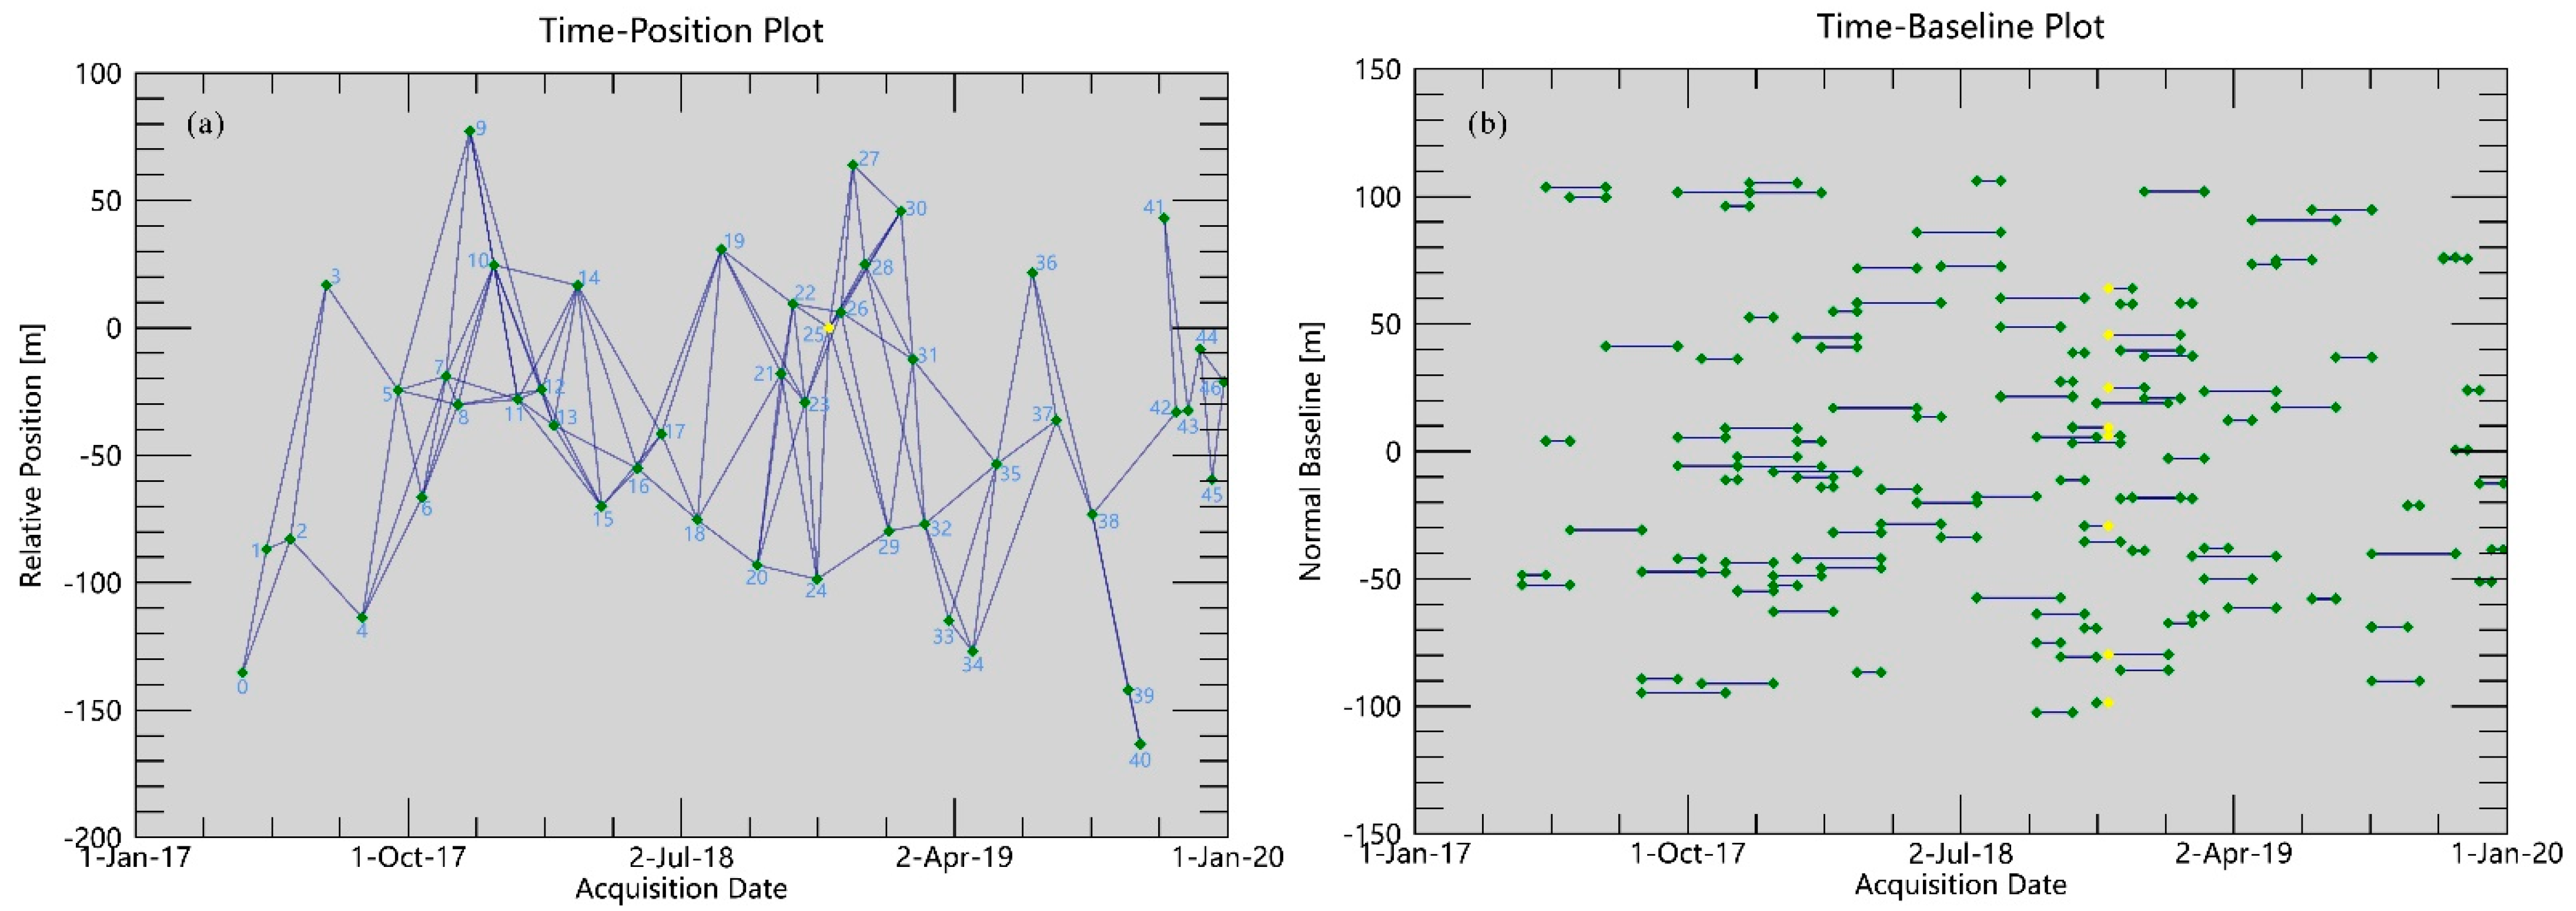
In the first step, interferometric pairs were generated. The maximum normal baseline was set to 2% of the critical baseline, and the maximum temporal baseline was set to 90 days. The image acquired on 27 November 2018 was selected as the super master image (SMI), and 114 interferometric pairs were generated in this step (Figure 4).
In the second step, i.e., interferometric flow, the Goldstein filter method [47] was used for filtering, the minimum cost flow (MCF) method [48] was utilized for unwrapping, and the external DEM was applied to remove the terrain phase. Then, the generated map of coherence and phase unwrapping was checked, and the interferometric pairs with low coherence or unsatisfactory phase unwrapping were eliminated.
In the third step, i.e., refinement and re-flattening, 34 ground control points (GCPS) were used to eliminate the residual phase coefficient and phase ramps from the unwrapped phase stack. The GCPs were selected at the area with the coherence value >0.7 [49].
In the last step, i.e., SBAS inversion, the linear model and the residual phase were used to estimate the surface deformation. The residual atmospheric phase was eliminated with a spatial–temporal filter (time filter window set to 365 days and space filter window set to 1200 m) [50]. Subsequently, the accumulated surface deformation and average deformation velocity along the line of sight (LOS) direction were employed.

4. Results

4.1. Deformation Measurements of COSI-Corr

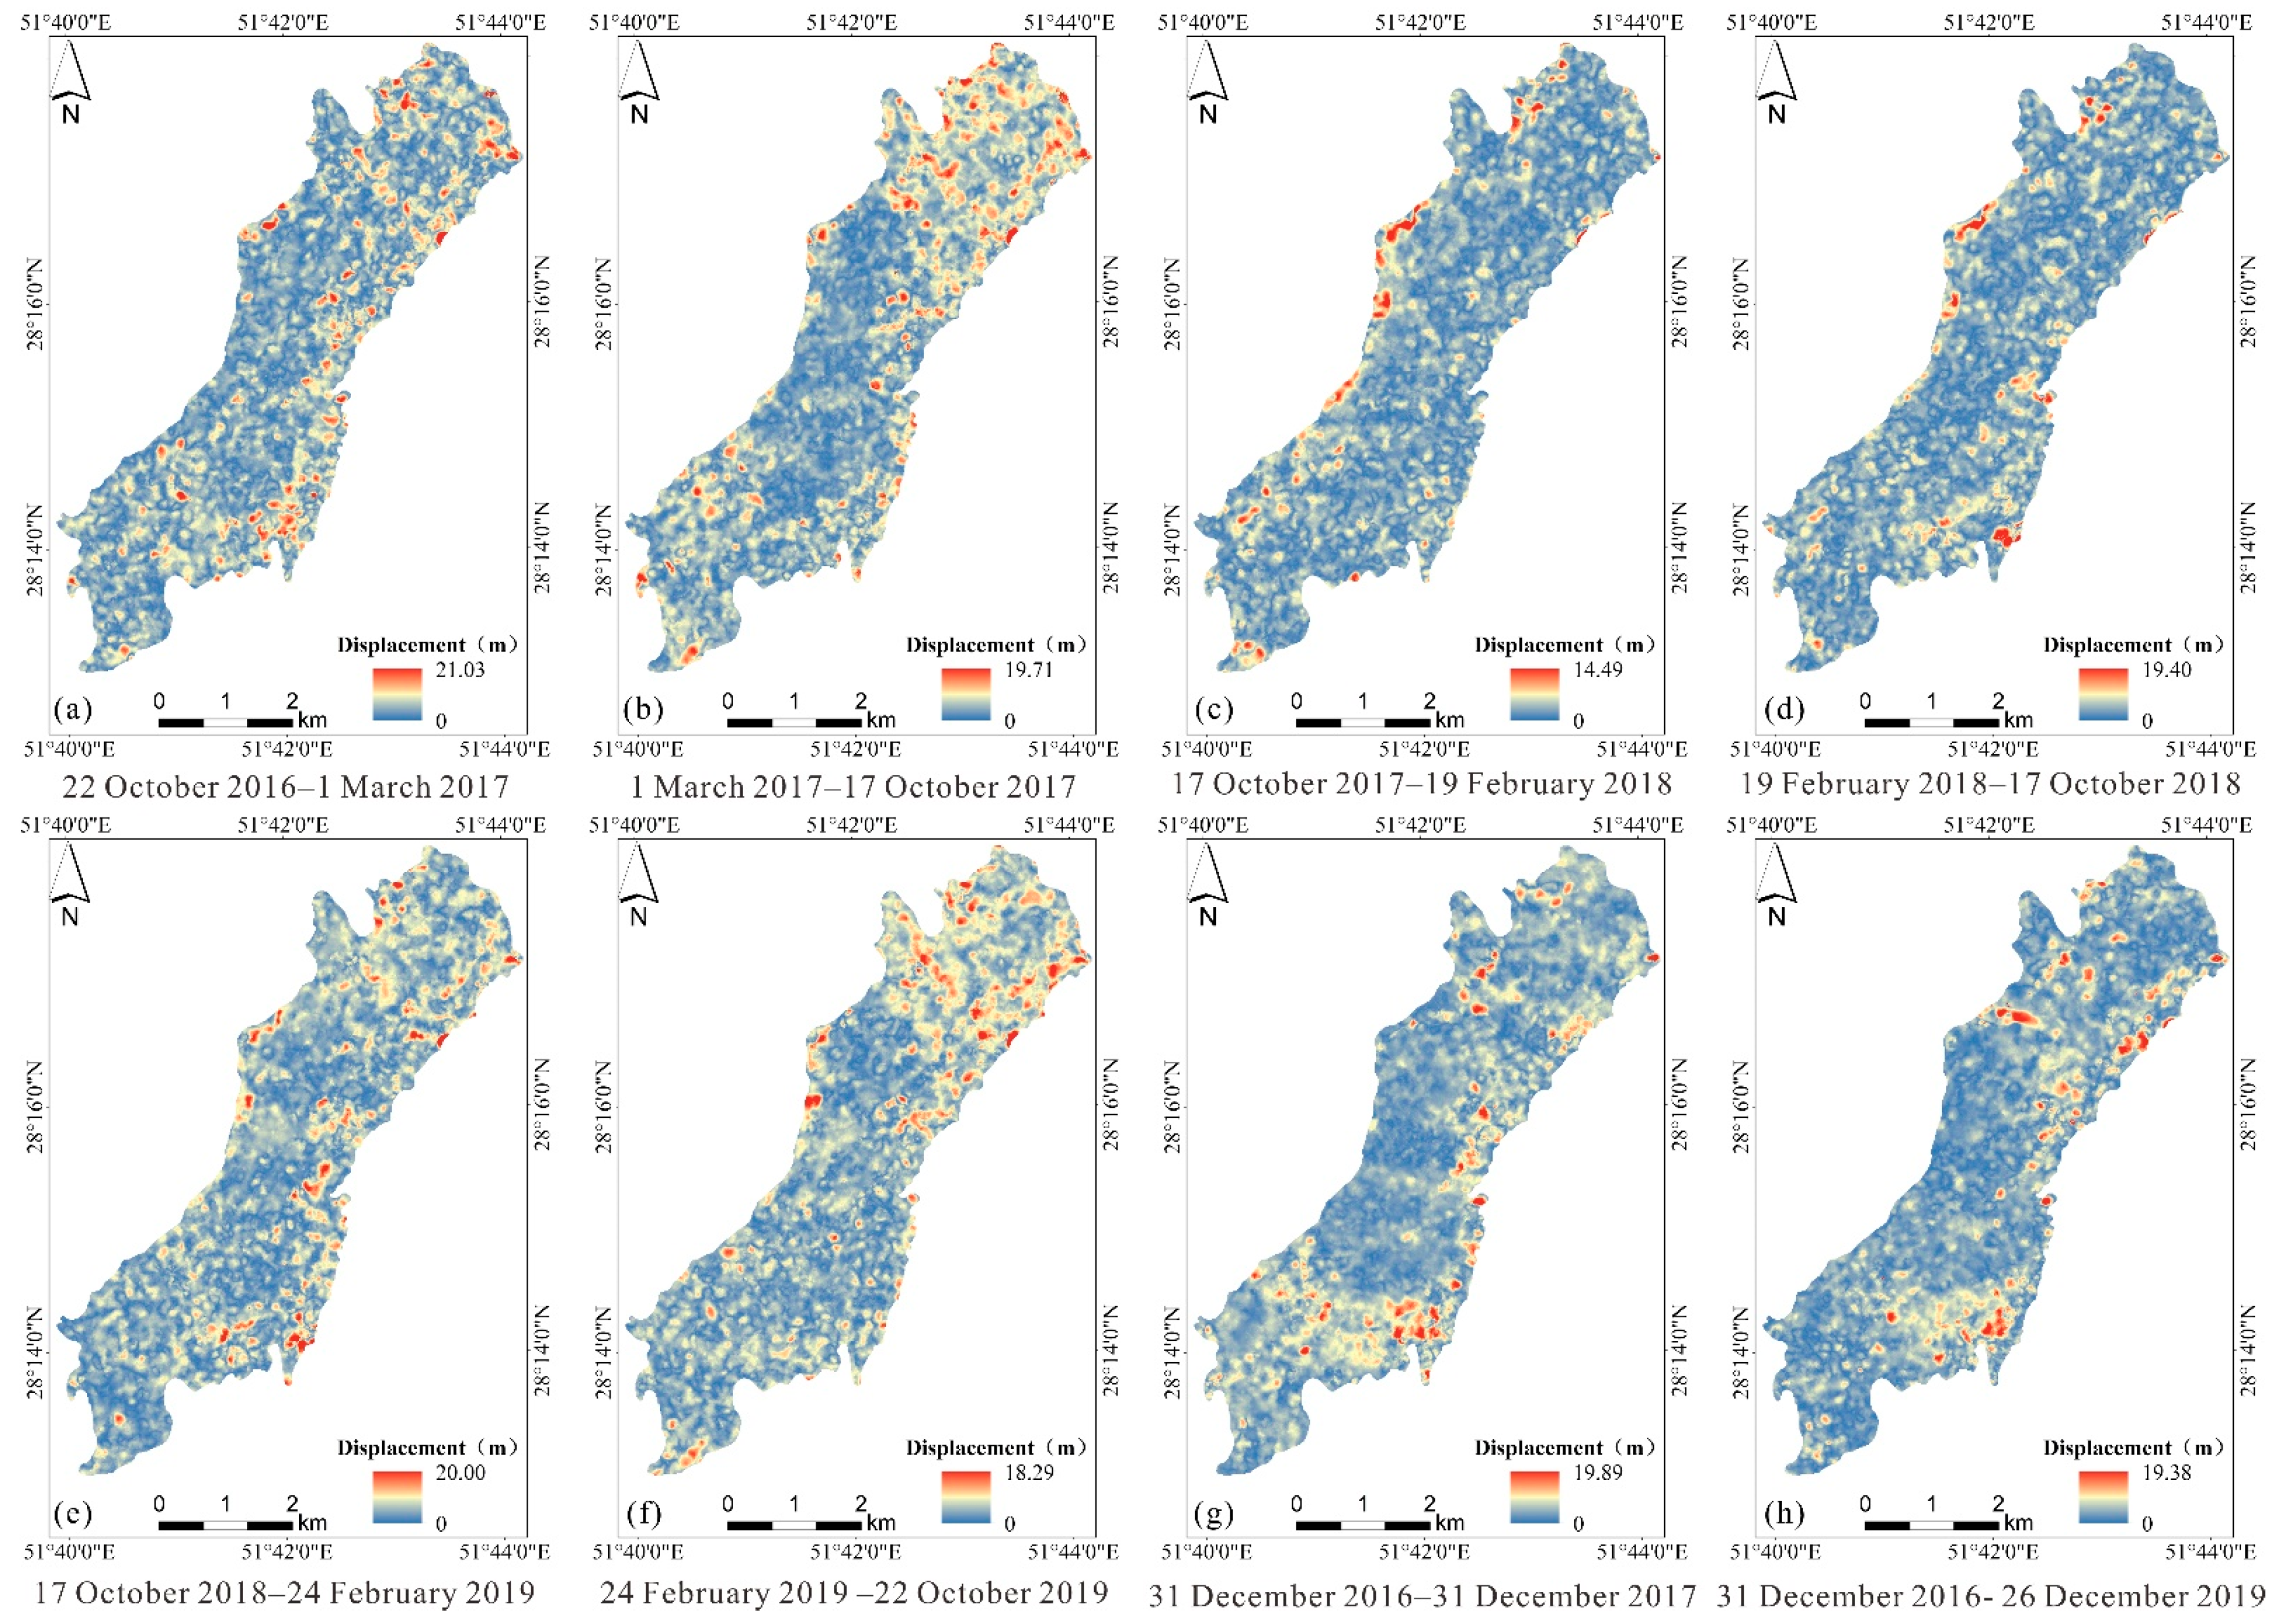
The namakier deformation measurements of COSI-Corr method during the acquisition period of eight image pairs between 22 October 2016 and 26 December 2019 are shown in Figure 5. The maximum displacement of the namakier was 21.03 m, which occurred from 22 October 2016 to 1 March 2017, and the minimum displacement was 14.49 m, which occurred from 17 October 2017 to 19 February 2018. Then, the total displacement was divided by the image pair time interval to calculate the deformation velocity and explore the relationship between the deformation of the namakier and weather conditions. The accumulated precipitation and average temperature in the interval between image pairs were also determined (Table 4).
The results show that the deformation velocity of the namakier in the rainy season was greater than that in the dry season. The amount of accumulated precipitation in the rainy season and the average temperature in the dry season determine the magnitudes of the deformation velocity in the rainy and dry seasons, respectively. Moreover, the amount of precipitation in the rainy season determines the area of the namakier deformation area in the rainy and dry seasons. The deformation measurements of the two year-to-year scale image pairs from 31 December 2016 to 31 December 2017 and from 31 December 2016 to 26 December 2019 revealed that the deformation area and displacement of the namakier were similar. This deformation represented the irreversible plastic deformation of the namakier.
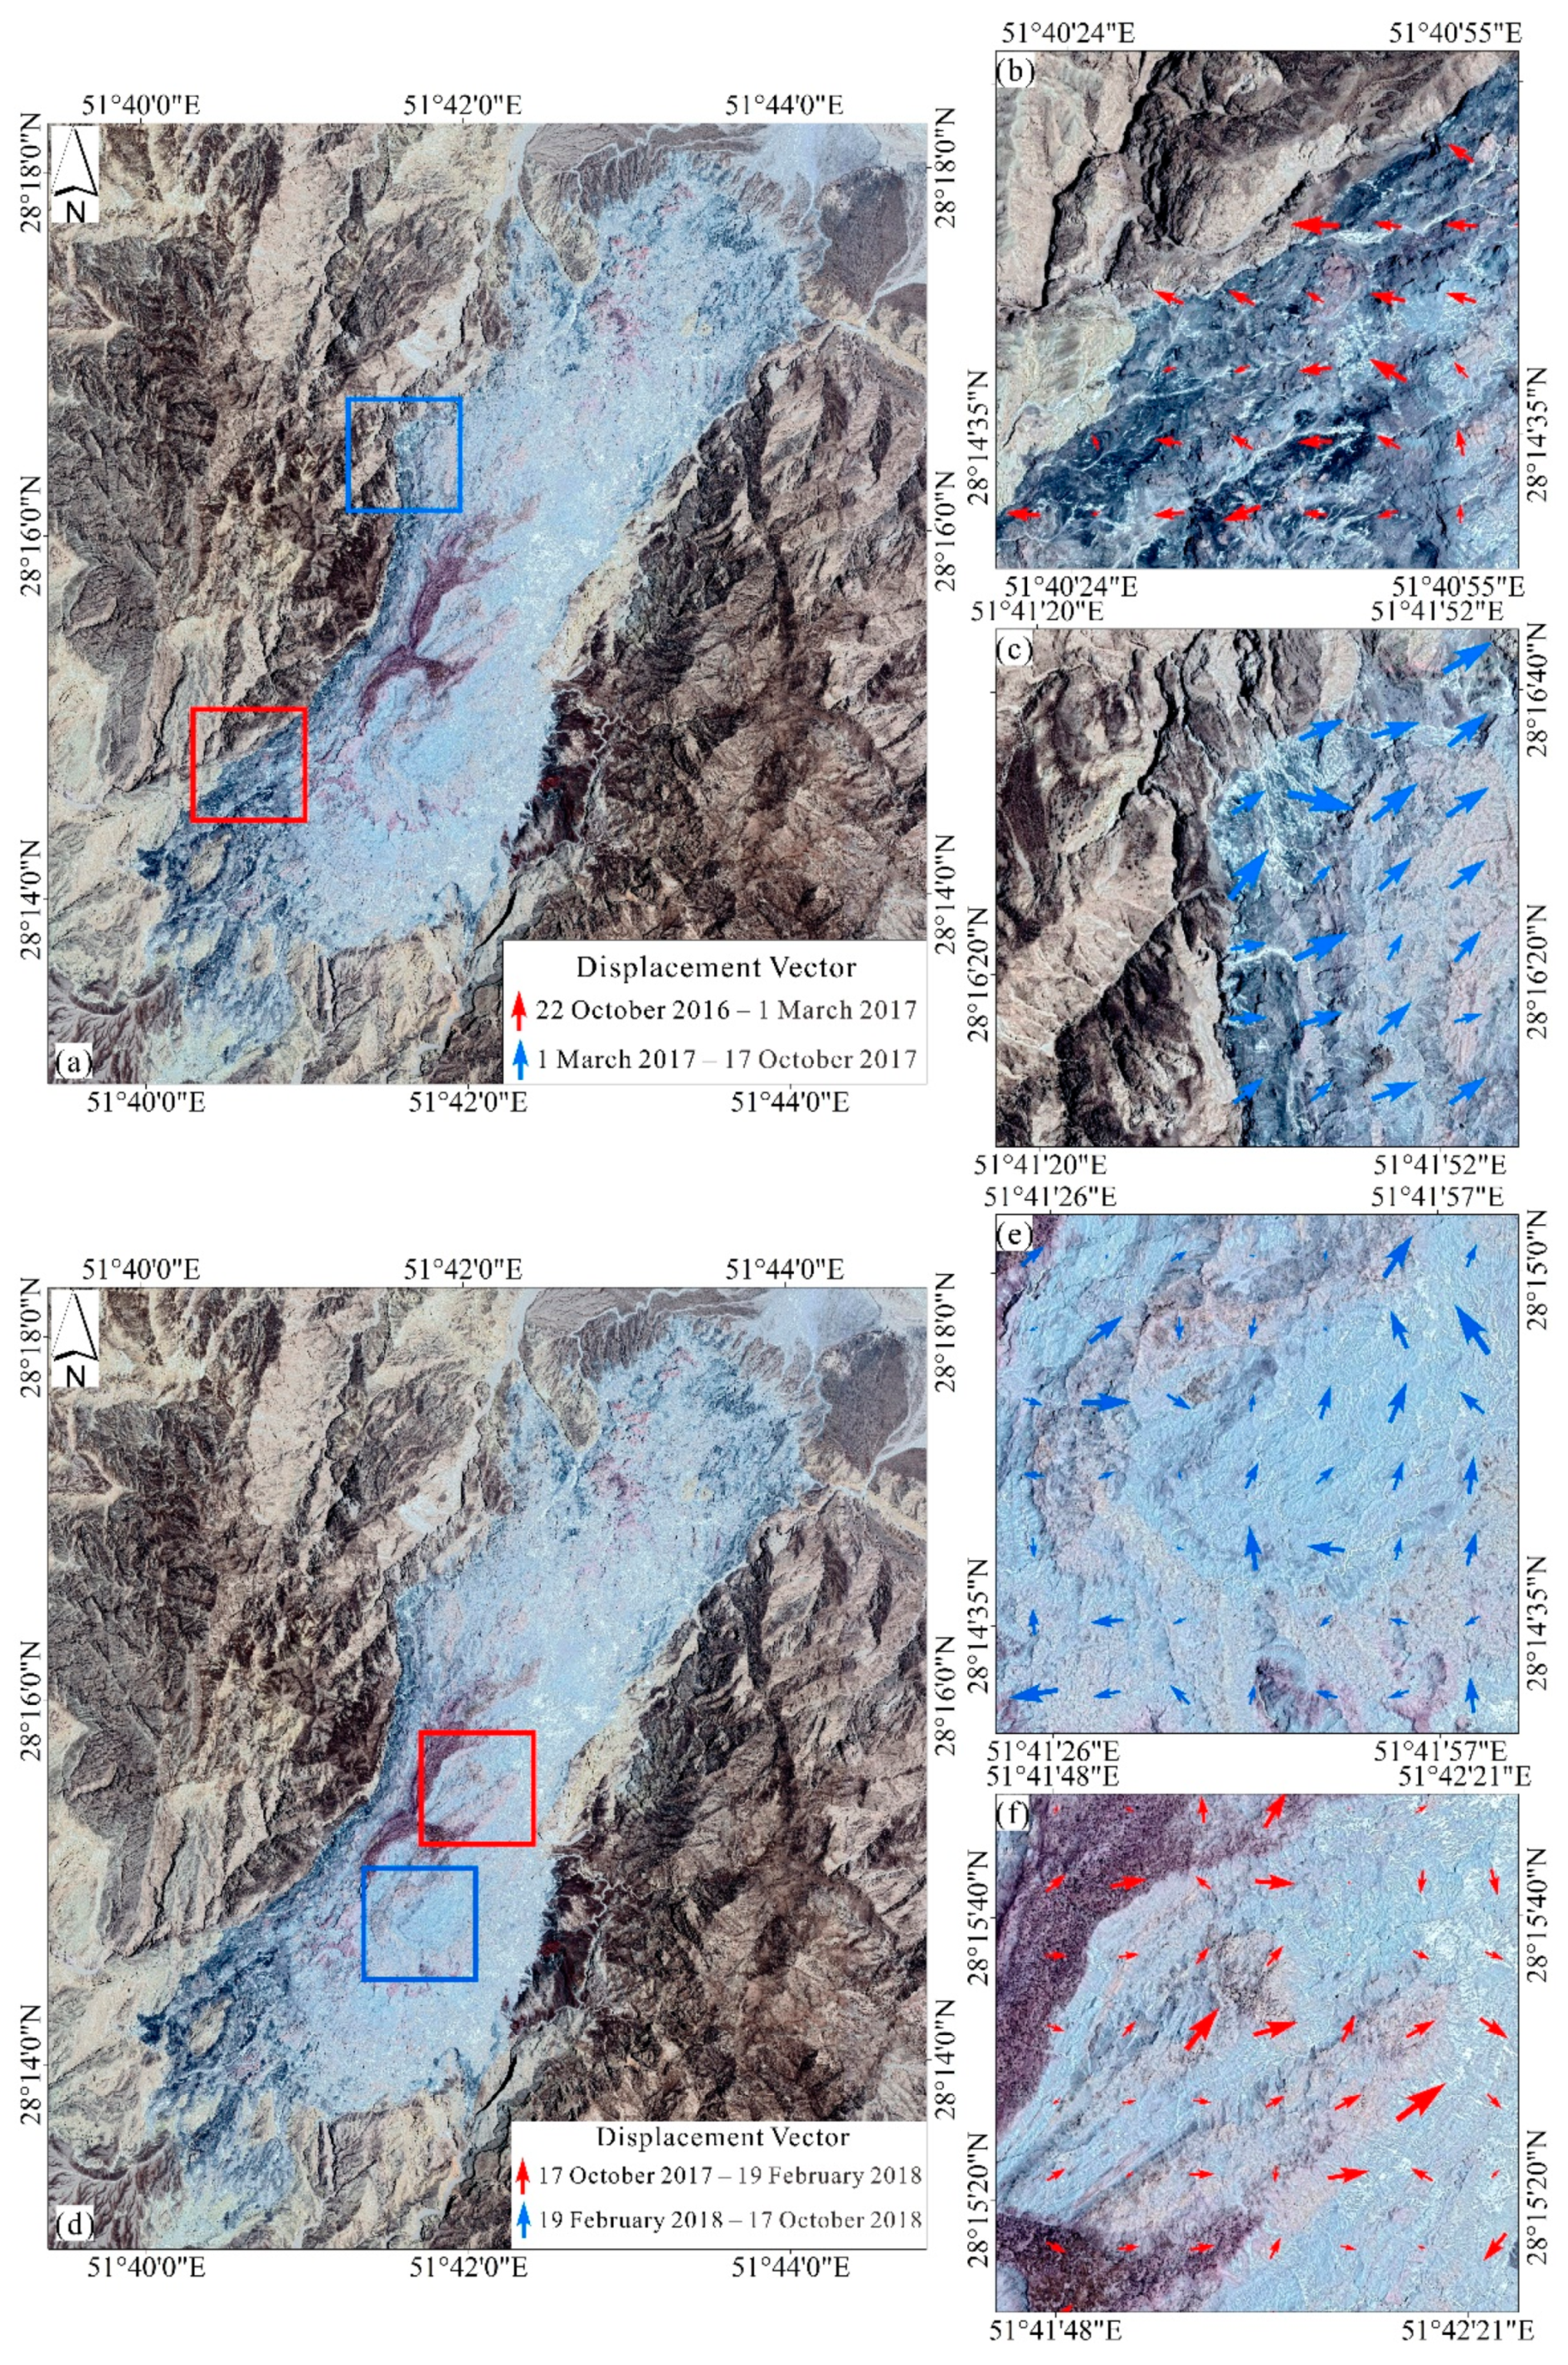
The displacement vector obtained by COSI-Corr method processing of the four image pairs from 22 October 2016 to 17 October 2018 was used to generate the namakier deformation vector field of dome and flank in dry and rainy seasons and describe the deformation of the namakier more vividly and intuitively. The results show that the dome and flank flow outward during the rainy season and inward during the dry season (Figure 6).
Considering different rock salts have different distribution areas and most areas of the namakier displacement are close to 0, the maximum displacement measured with the COSI-Corr method was selected as an index to measure the difference in the macrodeformation behavior of different rock salt of the namakier (Table 5). The results show that the maximum displacement ranges of “clean” rock salts (“clean” rock salt type, white rock salt) and “dirty” rock salts (“dirty” rock salt type, magenta rock salt, black rock salt, and gray rock salt) are 2.54–7.34 and 2.11–21.03, respectively.

4.2. Deformation Measurements of SBAS-InSAR

The namakier deformation measurements of SBAS-InSAR from 18 April 2017 to 28 December 2019 are shown in Figure 7. The minimum of deformation velocity in LOS is −300.52 mm/year on the northeast of the dome, and the maximum of deformation velocity in LOS is 61.78mm/year on the southwest of the dome.
In total, 4000 points on the flank and dome of the namakier were randomly selected to explore the relationship between the deformation of the namakier and weather conditions. Then, because weather condition is one of many factors that affect deformation of namakier, gray relational analysis [51] was utilized to calculate the grey relational degree between the absolute value of the time series displacement of these points, the accumulated precipitation, and the average temperature (Table 6).
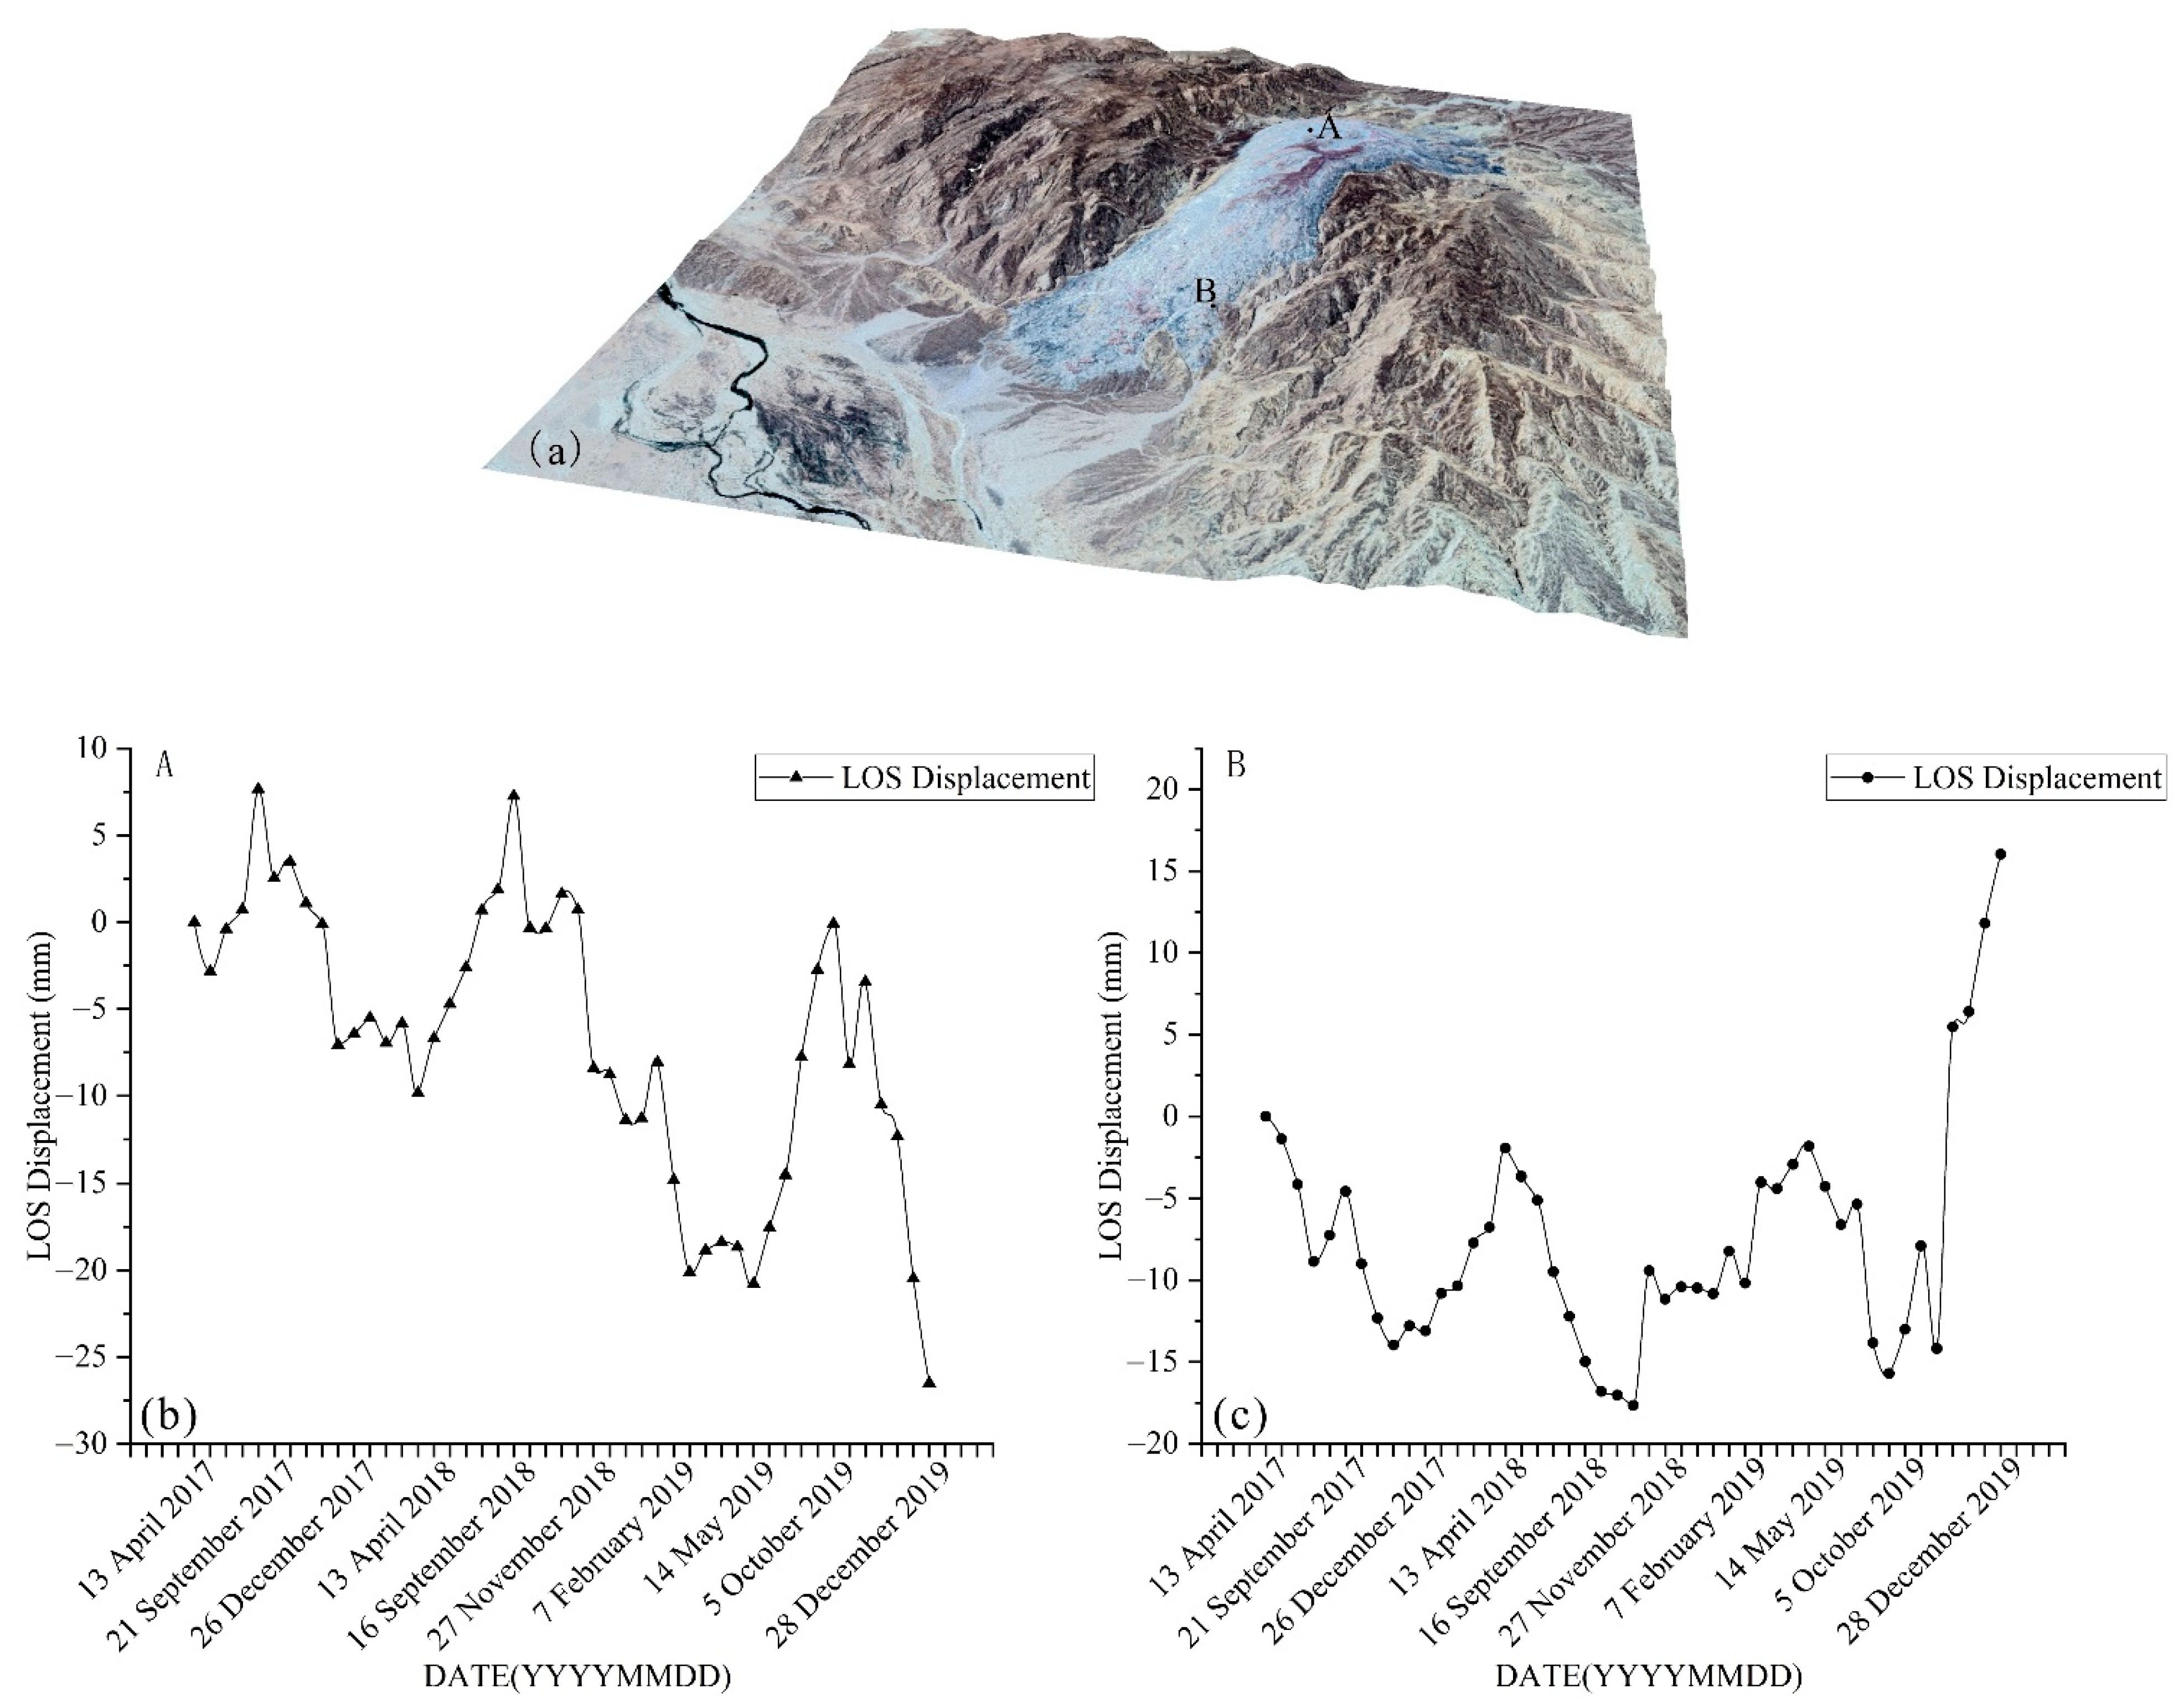
The average grey relational degree between the absolute value of the time series displacement of the points on the dome and the accumulated precipitation is 0.7030. The average grey relational degree of the average temperature is 0.6023. On the contrary, average grey relational degree between the absolute value of the time series displacement of the points on the flank and the accumulated precipitation is 0.6932. The average grey relational degree of the average temperature is 0.6026. Two points are selected from the 4000 points. The distribution of these points is shown in Figure 8a, and the time series displacement of Points A and B are shown in Figure 8b,c.
Then, the average grey relational degree between the absolute value of time series displacement of different rock salt, the accumulated precipitation, and the average temperature during the period was used as an index to measure the difference in the macrodeformation behavior of different rock salt of the namakier and explore the macrodeformation behavior of different rock salt types (Table 7).

4.3. Kinematics of Kuh-e-Namak (Dashti) Namakier

The vector field of the namakier (Figure 6), and time series displacement for Points A and B (Figure 8). These results show that the dome of the namakier subsides during the rainy season and uplifts during the dry season. Contrarily, the flank of the namakier uplifts during the rainy season and subsides during the dry season.
The deformation measurements of two image pairs from 31 December 2016 to 31 December 2017 and from 31 December 2016 to 26 December 2019 indicated that the irreversible plastic displacement was generated from 31 December 2016 to 31 December 2017. In the next two years, the deformation of the namakier was in a dynamic equilibrium.
Table 4 shows that the deformation of the namakier is correlated with temperature and precipitation. However, the deformation measurements of the namakier on a larger time scale cannot reflect a more detailed relationship between the deformation and temperature and precipitation. The grey relational degree between the absolute value of the time series displacement and the accumulated precipitation is greater than the average temperature regardless of the position of a point (i.e., either on the dome or on the flank; Table 6). Therefore, the effect of precipitation on kinematics is greater than that of temperature.
Table 5 shows that the maximum displacement of “clean” rock salt is not greater than 10. However, in the measurement of each image pair, the maximum displacement of “dirty” rock salt is greater than 10. Table 7 shows that the grey relational degree of different rock salt. In terms of precipitation, “clean” rock salt is smaller than gray and “dirty” type rock salts. In terms of temperature, “clean” rock salt is smaller than black, gray, and “dirty” type rock salts. Therefore, “dirty” rock salt of the namakier is more prone to flow than “clean” rock salt.

5. Discussion

5.1. Relationship between Salt Kinematics and Weather Conditions

Two response relationships exist between the kinematics of Kuh-e- Namak (Dashti) namakier and weather conditions. In terms of precipitation, the dome of the namakier subsides with the erosion of rainfall, whereas the flank is uplifted by the continuous supply of rock salt from the dome. In terms of temperature, the namakier is undergoing dry inflation, not dry deflation, that is, the dome uplifts as temperature increases, and the flank subsides because of the reconsolidation of the carapace, which inhibits the lateral flow of rock salt. Talbot et al. measured the markers on the flank of the namakier and showed that they move downstream during the rainy season, as temperature increases, these markers move upstream [10]. Moreover, the grey relational degree shown in Table 6 indicates that the effect of precipitation on salt kinematics is greater than that of temperature. This is because of the elastic carapaces on the rock salt surface are strong during dry season, and the carapaces are weakened by rain during the rainy season [38]. Aftabi et al. and Abdolmaleki et al. measured the deformation of the Sayhoo and the Qum Kuh salt diapirs, respectively, and found that salt diapirs have greater salt flow during the rainy season [15,23]. These measurements also prove that precipitation has a greater effect on the deformation of salt diapirs.
The permanent plastic deformation of the namakier reflected by the deformation measurement of the two image pairs from 31 December 2016 to 31 December 2017 and from 31 December 2016 to 26 December 2019 is caused by the extreme rainfall from 5 February 2017 to 17 February 2017. The BANDAR-E DAYYER weather station recorded 276.606 mm the accumulated precipitation within 12 days. In the original SBAS-InSAR process, the complete decoherence of the namakier on the phase unwrapping result of the interference pair from 5 February 2017 to 17 February 2017 also confirmed this situation. Moreover, this shows result reveals that the deformation of the namakier caused by rainfall is restored in the subsequent dry season in the absence of extreme rainfall, and the namakier deformation is in a dynamic equilibrium.

5.2. Relationship between Salt Kinematics and Rock Salt Types

In terms of macrodeformation behavior, “dirty” rock salt is more prone to flow than “clean” rock salt. Závada et al. showed that “dirty” rock salt rich in solid inclusions is more ductile than “clean” rock salt because the diffusion rate along the solid inclusion-halite contact is higher than that along the halite–halite contact. Hematite inclusions in “clean” rock salt inhibit the dislocation creep, and dissolved Fe slows down the rate of intergranular diffusion [12]. Therefore, the difference in the macrodeformation behavior of different rock salt in the namakier is consistent with the variation in their microstructures.
The plastic deformation of the namakier on the two year-to-year scale of image pair displacement measurement in Figure 5 shows that most of the plastic deformation areas are concentrated in the northern namakier and the dome. In the southern area where extensive “clean” rock salt is present, the displacement is generally close to 0, which indicates that “clean” rock salt is more stable.

5.3. Comparison of COSI-Corr and SBAS-InSAR Methods

COSI-Corr and SBAS-InSAR methods were compared in terms of their application in measuring the namakier deformation. On a spatial scale, COSI-Corr method is not affected by the coherence. It can be used to obtain the complete deformation of the namakier in the horizontal direction with subpixel accuracy. However, SBAS-InSAR method cannot obtain deformation in LOS because of the strong deformation of the rock salt dissolved by rainfall and the large topographical undulations in some areas of the namakier, e.g., in some areas with poor coherence. Particularly, the namakier deforms drastically because of extreme rainfall. Even though the deformation of the namakier obtained by COSI-Corr method is only in the horizontal direction, the construction of the vector field is sufficient to infer the flow of rock salt in the vertical direction. It is also more visual and intuitive than SBAS-InSAR method (Figure 6).
On a time scale, the namakier is located in a mountainous area with complex topography. COSI-Corr method is easily restricted by the sun zenith angle. Therefore, it can only obtain the deformation of the namakier on a large time scale, that is, on a monthly to yearly scale. As a consequence, studying the specific relationship of the kinematics of the namakier with temperature and precipitation becomes impossible. Conversely, SBAS-InSAR method is not limited by the sun zenith angle. It can obtain the deformation of the namakier on a smaller time scale from days to months and finely reflect the specific relationship of the kinematics, temperature, and precipitation.

6. Conclusions

In this study, on the basis of Sentinel-1 and-2 images, the kinematics of Kuh-e-Namak (Dashti) namakier was efficiently measured through COSI-Corr and SBAS-InSAR methods. However, on a spatial scale, COSI-Corr method is not affected by coherence, so it can detect the drastic deformation of the namakier under extreme rainfall. On a time scale, SBAS-InSAR method is not limited by the sun zenith angle, so it can describe the specific relationship between the kinematics, precipitation, and temperature.
The kinematics of Kuh-e-Namak (Dashti) namakier shows that the dome is washed by rainfall, the rock salt of the dome flows and accumulates toward the flank, the dome subsides, and the flank uplifts in the rainy season. In the dry season, the re-consolidation of carapace inhibits the lateral flow of rock salt, the flank subsides without the continuous supply of rock salt, and the dome uplifts. The effect of precipitation on the kinematics of the namakier is greater than that of temperature. The namakier undergoes permanent plastic deformation under extreme rainfall but achieves a dynamic equilibrium in the absence of extreme rainfall. The macrodeformation behavior of different rock salt in the namakier follows the differences in microstructure. In particular, “dirty” rock salt is more prone to flow than “clean” rock salt.

Author Contributions

Conceptualization, S.Z.; methodology, S.Z. and Q.J.; software, X.X. and C.S.; validation, Q.J. and C.S.; formal analysis, S.Z. and X.X.; resources, Y.G. and B.L.; writing—original draft preparation, S.Z.; writing—review and editing, J.X. and W.L.; supervision, Q.J.; and project administration, Q.J. All authors have read and agreed to the published version of the manuscript.

Funding

This research was funded by geological survey project of China Geological Survey (DD20191011).

Institutional Review Board Statement

Not applicable.

Informed Consent Statement

Not applicable.

Data Availability Statement

This study did not report any data.

Acknowledgments

Sentinel-1 and-2 images used in this research were provided by European Space Agency. Meteorological data were provided by National Oceanic and Atmospheric Administration. Global terrain data used in this research were provided by National Aeronautics and Space Administration (NASA). We are very grateful for the above support.

Conflicts of Interest

The authors declare no conflict of interest.

References

  1. Seni, S.; Geology, B.O.E.; Jackson, M.; Bramson, R.; Burks, R.; Conti, R.; Ghazi, S.; Lovell, S.; Richter, B.; Smith, J.; et al. Sedimentary Record of Cretaceous and Tertiary Salt Movement, East. Texas Basin: Times, Rates, and Volumes of Salt Flow and Their Implications for Nuclear Waste Isolation and Petroleum Exploration; The University of Texas, Bureau of Economic Geology: Austin, TX, USA, 1984. [Google Scholar]
  2. Jenyon, M.K. Salt Tectonics; Elsevier Applied Science Publishers: London, UK, 1986; ISBN 1851660151. [Google Scholar]
  3. Thoms, R.L.; Gehle, R.M. A Brief History of Salt Cavern Use; A brief History of Salt Cavern Use (keynote paper). In Proceedings of the 8th World Salt Symposium, The Hague, The Netherlands, 7–11 May 2020; Elsevier: Amsterdam, The Netherlands, 2000. [Google Scholar]
  4. Talbot, C.J.; Alavi, M. The past of a future syntaxis across the Zagros. Geol. Soc. Lond. Spec. Publ. 1996, 100, 89–109. [Google Scholar] [CrossRef]
  5. Alsouki, M.; Riahi, M.A.; Yassaghi, A. Seismic imaging of sub-circular salt-related structures: Evidence for passive diapirism in the Straits of Hormuz, Persian Gulf. Pet. Geosci. 2011, 17, 101–107. [Google Scholar] [CrossRef]
  6. Talbot, C.; Aftabi, P. Geology and models of salt extrusion at Qum Kuh, central Iran. J. Geol. Soc. 2004, 161, 321–334. [Google Scholar] [CrossRef]
  7. Hudec, M.R.; Jackson, M.P.A. Advance of allochthonous salt sheets in passive margins and orogens. AAPG Bull. 2006, 90, 1535–1564. [Google Scholar] [CrossRef]
  8. Jackson, M.; Cornelius, R.R.; Craig, C.H.; Talbot, C.; Gansser, A.; Stöcklin, J. Salt diapirs of the Great Kavir, Central Iran. In GSA Memoirs; Geological Society of America: Boulder, CO, USA, 1990; Volume 177, pp. 1–150. [Google Scholar]
  9. Talbot, C. Fold trains in a glacier of salt in southern Iran. J. Struct. Geol. 1979, 1, 5–18. [Google Scholar] [CrossRef]
  10. Talbot, C.J.; Rogers, E.A. Seasonal movements in a salt glacier in Iran. Science 1980, 208, 395–397. [Google Scholar] [CrossRef] [PubMed]
  11. Talbot, C.J.; Jarvis, R.J. Dynamics, budget and age of an active salt extrusion. Geol. Föreningen Stockh. Förhandlingar 1983, 105, 377–378. [Google Scholar] [CrossRef]
  12. Závada, P.; Desbois, G.; Urai, J.L.; Schullman, K.; Rahmati, M.; Lexa, O.; Wollenberg, U.; Schulmann, K. Impact of solid second phases on deformation mechanisms of naturally deformed salt rocks (Kuh-e-Namak, Dashti, Iran) and rheological stratification of the Hormuz salt formation. J. Struct. Geol. 2015, 74, 117–144. [Google Scholar] [CrossRef]
  13. Talbot, C.J. Salt extrusion at Kuh-e-Jahani, Iran, from June 1994 to November 1997. Geol. Soc. Lond. Spec. Publ. 2000, 174, 93–110. [Google Scholar] [CrossRef]
  14. Baikpour, S.; Zulauf, G.; Dehghani, M.; Bahroudi, A. InSAR maps and time series observations of surface displacements of rock salt extruded near Garmsar, northern Iran. J. Geol. Soc. 2010, 167, 171–181. [Google Scholar] [CrossRef]
  15. Aftabi, P.; Roustaie, M.; Alsop, G.; Talbot, C.J. InSAR mapping and modelling of an active Iranian salt extrusion. J. Geol. Soc. 2010, 167, 155–170. [Google Scholar] [CrossRef]
  16. Zebker, H.A.; Goldstein, R.M. Topographic mapping from interferometric synthetic aperture radar observations. J. Geophys. Res. Solid Earth 1986, 91, 4993–4999. [Google Scholar] [CrossRef]
  17. Gabriel, A.K.; Goldstein, R.M.; Zebker, H.A. Mapping small elevation changes over large areas: Differential radar interferometry. J. Geophys. Res. Space Phys. 1989, 94, 9183–9191. [Google Scholar] [CrossRef]
  18. Ferretti, A.; Prati, C.; Rocca, F. Nonlinear subsidence rate estimation using permanent scatterers in differential SAR interferometry. IEEE Trans. Geosci. Remote Sens. 2000, 38, 2202–2212. [Google Scholar] [CrossRef] [Green Version]
  19. Ferretti, A.; Prati, C.; Rocca, F. Permanent scatterers in SAR interferometry. IEEE Trans. Geosci. Remote Sens. 2001, 39, 8–20. [Google Scholar] [CrossRef]
  20. Berardino, P.; Fornaro, G.; Lanari, R.; Sansosti, E. A new algorithm for surface deformation monitoring based on small baseline differential SAR interferograms. IEEE Trans. Geosci. Remote Sens. 2002, 40, 2375–2383. [Google Scholar] [CrossRef] [Green Version]
  21. Lanari, R.; Mora, O.; Manunta, M.; Mallorquí, J.J.; Berardino, P.; Sansosti, E. A small-baseline approach for investigating de-formations on full-resolution differential SAR interferograms. IEEE Trans. Geosci. Remote Sens. 2004, 42, 1377–1386. [Google Scholar] [CrossRef]
  22. Barnhart, W.D.; Lohman, R.B. Regional trends in active diapirism revealed by mountain range-scale InSAR time series. Geophys. Res. Lett. 2012, 39. [Google Scholar] [CrossRef]
  23. Abdolmaleki, N.; Motagh, M.; Bahroudi, A.; Sharifi, M.A.; Haghighi, M.H. Using Envisat InSAR time-series to investigate the surface kinematics of an active salt extrusion near Qum, Iran. J. Geodyn. 2014, 81, 56–66. [Google Scholar] [CrossRef]
  24. Colón, C.; Webb, A.A.G.; Lasserre, C.; Doin, M.-P.; Renard, F.; Lohman, R.; Li, J.; Baudoin, P.F. The variety of subaerial active salt deformations in the Kuqa fold-thrust belt (China) constrained by InSAR. Earth Planet. Sci. Lett. 2016, 450, 83–95. [Google Scholar] [CrossRef] [Green Version]
  25. Roosta, H.; Jalalifar, H.; Nasab, S.K.; Ranjbar, M. Surface deformation over the buried Nasr Abad salt diapir, Central Iran using interferometric synthetic aperture radar data. Int. J. Remote Sens. 2019, 40, 8322–8341. [Google Scholar] [CrossRef]
  26. Leprince, S.; Barbot, S.; Ayoub, F.; Avouac, J.-P. Automatic and precise orthorectification, coregistration, and subpixel correlation of satellite images, application to ground deformation measurements. IEEE Trans. Geosci. Remote Sens. 2007, 45, 1529–1558. [Google Scholar] [CrossRef] [Green Version]
  27. Heid, T.; Kääb, A. Evaluation of existing image matching methods for deriving glacier surface displacements globally from optical satellite imagery. Remote Sens. Environ. 2012, 118, 339–355. [Google Scholar] [CrossRef]
  28. Singh, K.K.; Singh, D.K.; Negi, H.S.; Kulkarni, A.V.; Gusain, H.S.; Ganju, A.; Raj, K.B.G. Temporal change and flow velocity estimation of Patseo Glacier, Western Himalaya, India. Curr. Sci. 2018, 114, 776–784. [Google Scholar] [CrossRef]
  29. Stumpf, A.; Malet, J.-P.; Allemand, P.; Ulrich, P. Surface reconstruction and landslide displacement measurements with Pléiades satellite images. ISPRS J. Photogramm. Remote Sens. 2014, 95, 1–12. [Google Scholar] [CrossRef]
  30. Turner, D.; Lucieer, A.; De Jong, S.M. Time series analysis of landslide dynamics using an unmanned aerial vehicle (UAV). Remote Sens. 2015, 7, 1736–1757. [Google Scholar] [CrossRef] [Green Version]
  31. Vermeesch, P.; Drake, N. Remotely sensed dune celerity and sand flux measurements of the world’s fastest barchans (Bodélé, Chad). Geophys. Res. Lett. 2008, 35, L24404. [Google Scholar] [CrossRef] [Green Version]
  32. Baird, T.; Bristow, C.S.; Vermeesch, P. Measuring sand dune migration rates with COSI-Corr and Landsat: Opportunities and challenges. Remote Sens. 2019, 11, 2423. [Google Scholar] [CrossRef] [Green Version]
  33. Barisin, I.; Leprince, S.; Parsons, B.; Wright, T. Surface displacements in the September 2005 Afar rifting event from satellite image matching: Asymmetric uplift and faulting. Geophys. Res. Lett. 2009, 36, 420–439. [Google Scholar] [CrossRef] [Green Version]
  34. Milliner, C.W.D.; Dolan, J.F.; Hollingsworth, J.; Leprince, S.; Ayoub, F.; Sammis, C.G. Quantifying near-field and off-fault deformation patterns of the 1992 Mw 7.3 Landers earthquake. Geochem. Geophys. Geosystems 2015, 16, 1577–1598. [Google Scholar] [CrossRef] [Green Version]
  35. Edgell, H.S. Salt tectonism in the Persian Gulf Basin. Geol. Soc. Lond. Spec. Publ. 1996, 100, 129–151. [Google Scholar] [CrossRef]
  36. Kent, P.E. The emergent Hormuz salt plugs of Southern Iran. J. Pet. Geol. 1979, 2, 117–144. [Google Scholar] [CrossRef]
  37. Mohr, M.; Warren, J.K.; Kukla, P.A.; Urai, J.L.; Irmen, A. Subsurface seismic record of salt glaciers in an extensional intracontinental setting (Late Triassic of northwestern Germany). Geology 2007, 35, 963. [Google Scholar] [CrossRef]
  38. Talbot, C.J.; Pohjola, V. Subaerial salt extrusions in Iran as analogues of ice sheets, streams and glaciers. Earth-Sci. Rev. 2009, 97, 155–183. [Google Scholar] [CrossRef]
  39. Talbot, C.J. Extrusions of Hormuz salt in Iran. Geol. Soc. Lond. Spec. Publ. 1998, 143, 315–334. [Google Scholar] [CrossRef]
  40. Ahrens, T.J. Rock Physics & Phase Relations: A Handbook of Physical Constants; AGU Reference Shelf 3; American Geophysical Union: Washington, DC, USA, 1995; ISBN 0875908535. [Google Scholar]
  41. Gascon, F.; Bouzinac, C.; Thépaut, O.; Jung, M.; Francesconi, B.; Louis, J.; Lonjou, V.; Lafrance, B.; Massera, S.; Gaudel-Vacaresse, A.; et al. Copernicus sentinel-2A calibration and products validation status. Remote Sens. 2017, 9, 584. [Google Scholar] [CrossRef] [Green Version]
  42. Scherler, D.; Leprince, S.; Strecker, M. Glacier-surface velocities in alpine terrain from optical satellite imagery—Accuracy improvement and quality assessment. Remote Sens. Environ. 2008, 112, 3806–3819. [Google Scholar] [CrossRef]
  43. Ali, E.; Xu, W.; Ding, X. Improved optical image matching time series inversion approach for monitoring dune migration in North Sinai Sand Sea: Algorithm procedure, application, and validation. ISPRS J. Photogramm. Remote Sens. 2020, 164, 106–124. [Google Scholar] [CrossRef]
  44. Yang, W.; Wang, Y.; Wang, Y.; Ma, C.; Ma, Y. Retrospective deformation of the Baige landslide using optical remote sensing images. Landslides 2019, 17, 659–668. [Google Scholar] [CrossRef]
  45. Zhou, L.; Guo, J.; Hu, J.; Li, J.; Xu, Y.; Pan, Y.; Shi, M. Wuhan surface subsidence analysis in 2015–2016 based on sentinel-1a data by SBAS-inSAR. Remote Sens. 2017, 9, 982. [Google Scholar] [CrossRef] [Green Version]
  46. Hooper, A. A multi-temporal InSAR method incorporating both persistent scatterer and small baseline approaches. Geophys. Res. Lett. 2008, 35. [Google Scholar] [CrossRef] [Green Version]
  47. Goldstein, R.M.; Werner, C.L. Radar interferogram filtering for geophysical applications. Geophys. Res. Lett. 1998, 25, 4035–4038. [Google Scholar] [CrossRef] [Green Version]
  48. Costantini, M. A novel phase unwrapping method based on network programming. IEEE Trans. Geosci. Remote Sens. 1998, 36, 813–821. [Google Scholar] [CrossRef]
  49. Gaber, A.; Darwish, N.; Koch, M. Minimizing the residual topography effect on interferograms to improve DInSAR results: Estimating land subsidence in Port-Said City, Egypt. Remote Sens. 2017, 9, 752. [Google Scholar] [CrossRef] [Green Version]
  50. Pepe, A.; Berardino, P.; Bonano, M.; Euillades, L.D.; Lanari, R.; Sansosti, E. SBAS-based satellite orbit correction for the generation of DInSAR time-series: Application to RADARSAT-1 Data. IEEE Trans. Geosci. Remote Sens. 2011, 49, 5150–5165. [Google Scholar] [CrossRef]
  51. Kuo, Y.; Yang, T.; Huang, G.-W. The use of grey relational analysis in solving multiple attribute decision-making problems. Comput. Ind. Eng. 2008, 55, 80–93. [Google Scholar] [CrossRef]
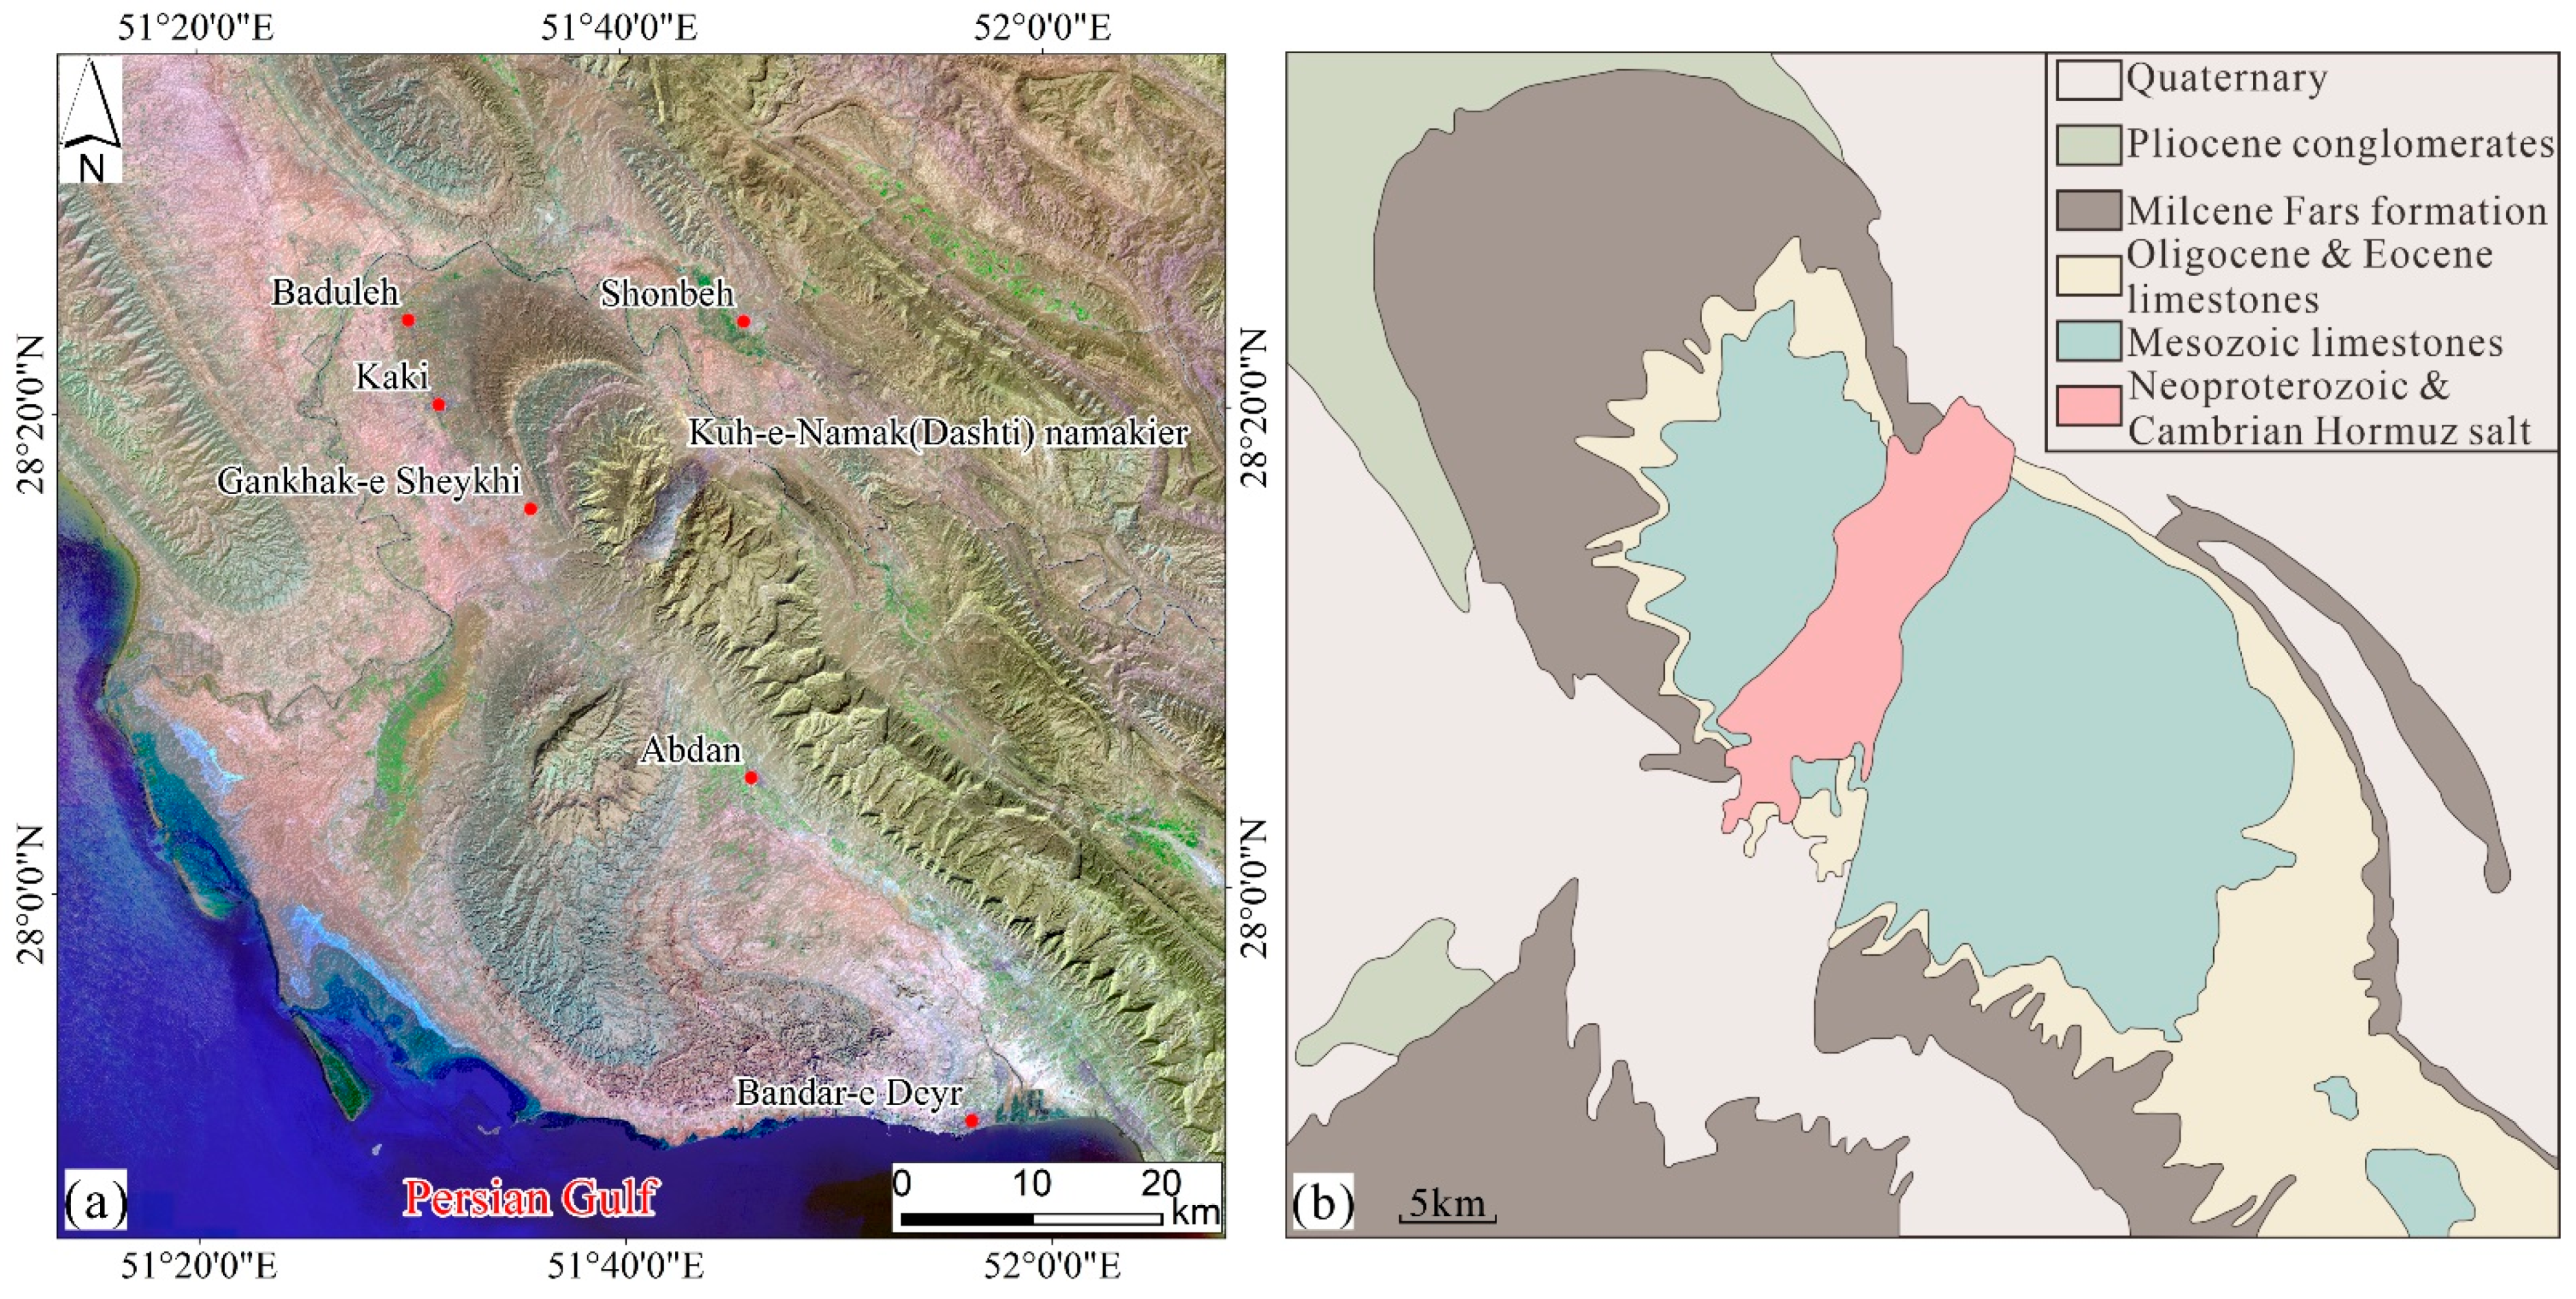
Figure 1. (a) Location of Kuh-e-Namak (Dashti) namakier; and (b) geological map of Kuh-e-Namak (Dashti) namakier (modified from [37]).
Remotesensing 13 00785 g001
Figure 2. (a) Google Earth image of Kuhe-e-Namak (Dashti) namakier. The red rectangle indicates the stable zone used to correct the errors in image registration. (b) Distribution of rock salt types in Kuh-e-Namak (Dashti) (modified from [12]).
Remotesensing 13 00785 g002
Figure 3. (a) Monthly temperature data from January 2016 to October 2020 recorded by BANDAR-E DAYYER weather station; (b) Monthly precipitation data from January 2016 to October 2020 recorded by BANDAR-E DAYYER weather station.
Remotesensing 13 00785 g003
Figure 4. (a) Time–position plot of Sentinel-1A acquisitions; and (b) time–baseline plot of Sentinel-1A interferometric pairs. Each green point represents a slave image, each yellow point represents a super master image, and each line represents an interferometric pairs.
Remotesensing 13 00785 g004
Figure 5. Surface deformation map of Kuh-e-Namak (Dashti) namakier in each Sentinel-2A/B image pair. Total displacements are produced as the Euclidean distance. (ah) represent the surface displacement measurement of the eight correlation pairs in Table 4.
Remotesensing 13 00785 g005
Figure 6. Vector field derived from four Sentinel-2A/B image pairs from 22 October 2016 to 17 October 2018. The red arrows represent the displacement vector during the rainy season, and the blue arrows represent the displacement vector during the dry season. The pointing of the arrow represents the direction in which rock salt flows. (a) The location of selected two zones of the flank; (b) the vector field of the red rectangle zone of the flank during the rainy season; (c) the vector field of the blue rectangle zone of the flank during the dry season. (d) The location of selected two zones of the dome; (e) the vector field of the blue rectangle zone of the dome during the dry season; (f) the vector field of the red rectangle zone of the dome during the rainy season.
Remotesensing 13 00785 g006
Figure 7. The average velocity of surface deformation in Kuh-e-Namak (Dashti) namakier.
Remotesensing 13 00785 g007
Figure 8. (a) The location of Points A and B; (b) the time series displacement for Point A; and (c) the time series displacement for Point B.
Remotesensing 13 00785 g008
Table 1. The specific information of collected Sentinel-2A/B images.
SensorAcquisition Dates (YYMMDD)Orbit NumberCloud Cover (Percentage)Sun Zenith Angle (Degree)Sun Azimuth Angle (Degree)
S2A_MSIL1C22 October 20161060.00741.947159.039
S2A_MSIL1C31 December 20161060.00054.580158.671
S2A_MSIL1C1 March 20171060.15341.277147.256
S2A_MSIL1C17 October 20171060.31140.242157.793
S2B_MSIL1C31 December 20171064.25754.594158.692
S2B_MSIL1C19 February 20181060.35744.797149.363
S2B_MSIL1C17 October 20181061.27840.166157.714
S2B_MSIL1C24 February 2019 1060.04943.189148.427
S2B_MSIL1C22 October 20191060.01241.703158.914
S2A_MSIL1C26 December 20191060.37054.656159.550
Table 2. The specific information of collected Sentinel-1A images and SRTM data.
DataParametersDescription
Sentinel-1ATypeSLC (Single Look Complex)
Image ModeIW (Interferometric Wide)
BandC
Track number28
PolarizationVV (Vertical Polarization)
Range Resolution (m)5
Azimuth Resolution (m)20
SRTMResolution (m)30
Table 3. Mean and standard deviation of displacements and SNR in the stable area of each Sentinel-2A/B image pair.
Pre-Image
(YYYYMMDD)
Post-Image
(YYYYMMDD)
Sun Zenith Angle Differences (Degrees)East/West Displacement (Meters)North/South DISPLACEMENT (Meters)SNR
MeanStandard DeviationMeanStandard DeviationMeanStandard Deviation
22 October 20161 March 20170.670−1.4170.3931.4110.3500.99590.0015
1 March 201717 October 20171.0351.4710.3691.1910.3360.99570.0015
17 October 201719 February 20184.555−2.3010.468−2.8740.3730.99480.0017
19 February 201817 October 20184.631−3.8140.4340.3890.3010.99500.0018
17 October 201824 February 20193.0233.6020.421−1.4040.3230.99470.0021
24 February 201922 October 20191.486−1.6870.4560.2680.2650.99550.0016
31 December 201631 December 20170.014−0.1490.256−0.5800.1740.99770.0008
31 December 201726 December 20190.076−2.2790.1872.4860.1350.99780.0007
Table 4. Displacement and deformation velocity of Kuh-e-Namak (Dashti) namakier in each Sentinel-2A/B image pair and accumulated precipitation and average temperature during each image pair acquisition time interval.
Correlation Pair
(YYYYMMDD)
Accumulated Precipitation (mm)Average Temperature (°C)Displacement (m)Velocity (m/d)
22 October 2016–1 March 2017377.19021.3421.030.162
1 March 2017–17 October 201755.62631.9419.710.086
17 October 2017–19 February 2018113.53822.1314.490.116
19 February 2018–17 October 201851.30831.2619.400.081
17 October 2018–24 February 2019159.00421.6920.000.154
24 February 2019–22 October 201966.29430.9118.290.076
31 December 2016–31 December 2017471.67828.0419.890.054
31 December 2016–26 December 2019887.73027.9719.380.018
Table 5. Maximum Displacement of different rock salt in each Sentinel-2A/B image pair.
Correlation Pair
(YYYYMMDD)
Maximum Displacement (m)
BlackMagentaWhiteGary“Clean”“Dirty”
22 October 2016–1 March 201721.034.003.443.463.6219.78
1 March 2017–17 October 201711.004.773.2319.713.8419.19
17 October 2017–19 February 201814.493.524.814.202.865.99
19 February 2018–17 October 201817.805.094.144.327.345.62
17 October 2018–24 February 201917.884.913.4820.016.925.58
24 February 2019 –22 October 201918.294.482.544.102.975.01
31 December 2016–31 December 20173.342.112.264.363.9519.89
31 December 2016–26 December 201919.383.3117.994.314.0719.10
Table 6. The average grey relational degree between the absolute value of the time series displacement, average temperature, and accumulated precipitation during the Sentinel-1A image acquisition time interval.
Number of PointsLocationAverage
Grey Relational Degree between Average Temperature and Displacement
Average
Grey Relational Degree between Accumulated Precipitation and Displacement
2000Flank0.60260.6932
2000Dome0.60230.7030
Table 7. The average grey relational degree between the absolute value of time series displacement of different rock salt, precipitation, and temperature during the Sentinel-1A image acquisition time interval.
Rock Salt TypesAverage Grey Relational Degree
PrecipitationTemperature
Black0.67560.5935
Magenta0.67890.5652
White0.67320.5725
Gray0.71530.6078
“Clean”0.67940.5831
“Dirty”0.69570.5976
Publisher’s Note: MDPI stays neutral with regard to jurisdictional claims in published maps and institutional affiliations.