Article

Contribution to the Research of the Effects of Etna Volcano Activity on the Features of the Ionospheric Total Electron Content Behaviour

1
Maritime Department, University of Zadar, Ulica Mihovila Pavlinovića 1, 23000 Zadar, Croatia
2
Faculty of Maritime Studies, University of Rijeka, Studentska 2, 51000 Rijeka, Croatia
*
Author to whom correspondence should be addressed.
Remote Sens. 2021, 13(5), 1006; https://doi.org/10.3390/rs13051006
Submission received: 21 January 2021 / Revised: 22 February 2021 / Accepted: 4 March 2021 / Published: 6 March 2021
(This article belongs to the Special Issue GNSS, Space Weather and TEC Special Features)

Abstract

:
This research represents a contribution to the theory on the coupling of the volcanic activity and the ionospheric dynamics, represented by total electron content (TEC) patterns and their behaviour. The ionospheric response to the activity of the Etna volcano has been analysed using global navigation satellite system (GNSS)-derived TEC values, employing data from International GNSS Service (IGS) reference station near the volcano and on two distant IGS locations. Volcanic activity has been modelled using volcanic radiative power (VRP) data obtained by the Middle InfraRed Observation of Volcanic Activity (MIROVA) system. The estimated minimal night TEC values have been averaged over defined index days of the VRP increase. During the analysed period of 19 years, the volcano activity was categorised according to pre-defined criteria. The influence of current space weather and short-term solar activity on TEC near the volcano was systematically minimised. The results showed mean/median TEC increases of approximately +3 standard deviations from the overall mean values, with peak values placed approximately 5 days before the VRP increase and followed by general TEC depletion around the time of the actual volcanic activity increase. Additionally, TEC oscillation pattern was found over the volcano site with a half-period of 6.25 days. The main interpretation of results indicates that the volcanic activity has modified the ionospheric dynamics within the nearby ionospheric region before the actual VRP increase, and that the residual impact in the volcano’s surrounding area refers to terrestrial endogenous processes and air–earth currents. Those changes can be detected during criteria predefined in the research: during quiet space weather conditions, observing night-time TEC values and within the limits of low short-term solar influence.

1. Introduction

The development of the ionospheric total electron content (TEC) determination methods, together with improving the means of volcanic activity monitoring, have allowed for the sensing of the seismic processes and their possible couplings with the ionospheric dynamics. The electromagnetic properties of Earth's upper atmosphere layers are mostly dependent on the solar activity. Compared to solar influences, the seismic causes have a smaller impact on the ionosphere, and details of their coupling mechanisms are still not fully understood. The current body of the scientific literature reflects a substantial amount of research and understanding of the relationships between Earth’s seismic activity and resulting changes within the atmospheric layers. Although rarely emphasised, the scientific knowledge on seismic effects on the ionosphere is one of the most intensively researched areas that could lead to a more reliable earthquake and seismic prediction models. An appropriate scientific review on the topic was presented in [1].
Apart from the possibility to employ ionospheric anomalies for earthquake prediction, there are other related and usable effects of seismo-ionospheric coupling, for instance, on satellite communication and radio navigational electromagnetic signals [2]. The ionospheric layers physically modify the path of the satellite positioning signals, consequently introducing a positioning error. The ionospheric delay is subject to various methods of calculation, determination and estimation for high accuracy positioning requirements [3], with TEC as a main indicator of the ionospheric behaviour.
As a dispersive medium feature, the ionospheric refraction depends on the operating signal’s frequency. By accurately measuring the effects of the ionospheric delay, sound insights into actual physical state of the ionosphere along the signal ray path can be obtained. Using the data that arise from such examinations, it is possible to investigate a connection between the seismic activity and its effects on the ionization.
The research efforts on relations between earthquakes and ionospheric anomalies are summarised in [4] to a significant extent. The geophysical relationship between seismic activity and associated ionospheric anomalies are generally described by the Lithosphere–Atmosphere–Ionosphere Coupling (LAIC) models [5]. LAIC models explain these relationships as a synergy between different ground surface, atmosphere and ionosphere processes and anomalous variations, the latter being usually recognised as a short-term earthquake precursor [5].
Compared to earthquakes, the effects of volcanic activity on ionospheric anomalies are less investigated. Several authors have proved the high electrification of the volcanic dust, such as in [6], where an electrification mechanism of the volcanic ash was simulated. The authors have found that the dominant source of charging of ash particles occurs as a consequence of the ejection of ions and atomic particles during fracture events of solid silicate particles. Charged volcanic plume is often the reason for occurrence of intense lightning from the volcanic dust clouds, repeatedly present during strong eruptions. In [7], authors have also discussed the theory of ash particles fragmentation as a primary mechanism of volcanic clouds charging.
Volcanic activity has a broad and complex effect on atmospheric electrical properties [8,9,10]. Apart from the charging of ash particles, the interaction with air ionization is found as the emanation of radioactive radon gas from the ground. Atmospheric conductivity is greatly modified by volcanic eruptions which affect air–earth electric currents and the global atmospheric electrical circuit system. The global electrical circuit (GEC) model is developed to explain atmospheric electric field and currents within Earth’s coupled atmosphere–ionosphere–magnetosphere system. There are three major drivers of the atmosphere’s electric field and currents [11,12]: thunderstorms, the ionosphere wind dynamo [13] and the solar wind-magnetosphere dynamo [14]. The lithosphere dynamics can locally influence conductivity of near-surface air layer following the radon emanation, changing the current density and modifying the free electron content within the atmosphere [4]. In [15], authors show that boundary layer resistance is decreased following the release of radon, increasing the vertical GEC currents and finally modifying the charge transferred to and from the ionosphere. We consider the possibility that volcanoes are able to exploit the similar mechanism and influence the atmospheric charge to a certain degree.
In [16], the authors found that the ionospheric perturbations, as recorded by the DEMETER satellite network, occurred during intense eruptive events of Etna volcano in 2006. An increase in ion density, particularly O+, was found when a satellite was located at the approximate latitude of the Etna region. At that time, an electric very low frequency (VLF) spectrogram recorded lightning activity in the region. All the findings showed the close relationship between volcanic activity and atmospheric electricity, leading to the possibility of volcanic influence towards ionospheric electrical properties, as discussed and examined further.
Li et al. [17] analysed the coupling relationship between volcanic eruption and TEC anomalies using Global Ionospheric Map (GIM) data before the 15 volcanic eruptions indicated by Volcanic Explosivity Index 4+ (VEI4+). They found anomalies preceding 67% of the analysed eruption events. Approximately 80% of anomalies occurred between days 6 and 17 before eruptions. The occurrence rate of TEC anomalies before large eruptions was related with the volcanic type and the geographical position. The probability of TEC anomalies’ observations before the eruption decreased with latitude; in the equatorial region, 80% of eruptions anomalies were found, but only 60% and 50% of eruptions in mid and high latitudes, respectively, produced preceding TEC anomalies. However, statistical uncertainty was found to be high due to scarce data.
TEC anomalies were analysed in [18] as a response to the Calbuco volcano eruptions. Here, the method of approximation of a spherical wave propagating at a constant velocity from a point source was employed. The authors showed that it is possible, by using dense (30 s) frequency ionospheric GPS data, to calculate the position of the eruptive source within several latitude/longitude degrees. In [19], the relation between volcanic events and ionospheric anomalies was found as well. The total of 269 anomalies were found in relation to 89 eruptions using satellite DEMETER data [20]. The two main types of anomalies were the electrostatic turbulence, and the electromagnetic emissions with a maximum number of those being recorded between 30 and 15 days before the surface volcanic activity. The study on the impact of the 2011 Puyehue-Cordon Caulle volcanic eruption on the GPS ionospheric delay also indicated the presence of ionospheric TEC anomalies several days before the major eruption [21]. In [22], authors analysed global navigation satellite system (GNSS)-derived short-term TEC response to the Merapi 2010 and the Kelud 2014 volcano eruptions. They observed quasi-periodic oscillation of TEC values of a frequency ~4 mHz (period ~250 s), which lasted for ~20 and ~120 min, respectively. Previously [23], it has been shown that these oscillations are related to upward propagation of acoustic waves, causing resonant oscillations in distinct frequencies.
In this paper, we investigated the longer-term relationship of the activity of Etna volcano (Italy), measured by the Middle InfraRed Observation of Volcanic Activity (MIROVA) system, and the ionospheric TEC behaviour calculated using ground-based, dual-frequency GNSS measurements by the International GNSS Service (IGS) network [24]. Almost 20 years’ worth of data were analysed and filtered to select significant volcanic activity increases, rather than focusing on volcano eruptions solely. Identified events were further used to investigate the ionospheric TEC dynamics for the same periods, with the primary goal to detect possible anomalous TEC behaviour during days of significant volcanic activity, with an emphasis on days preceding the activity.
In the following chapter, determinants of research fundamentals referring to ionospheric properties, TEC determination and the means of the volcanic activity tracking are briefly provided. The research design and the methodology are defined, presented and explained in the third chapter. The results are presented and discussed afterwards, drawing inferences and conclusions on obtained findings.

2. Background

2.1. TEC Features and the Ionospheric Response to Solar Activity

The ionospheric layers react to the solar activity by changing the temperature and ion production [25,26]. Depending on the user’s location on the Earth, the ionosphere can be roughly divided in low-, mid- and high-latitude regions, each characterised by its own processes and responses to the solar forcing [27,28]. There are various methods for evaluation and monitoring of the solar activity.
Certain methods, such as solar radio flux (sfu) at 10.7 cm wavelength [29], solar wind [30], or radio noise measurements at centimetre wavelengths [31] are direct, based on instrumental measurements. The others are intermediary, based on the solar activity evaluation effects, implying observations of indices such as sunspot number [32], and planetary geomagnetic K, Kp and Dst indices [33,34,35,36].
The total electron content is considered as a basic parameter of the ionospheric electromagnetic properties and their variations. It is defined as a number of free electrons along an equivalent column having a cross-section of one square meter from the satellite to the receiver’s antenna [37,38]. It is expressed in TEC units ( T E C u ), where [2,39]:
1   T E C u = 10 16 e m 2 .
The amount of the GPS ionospheric delay ( t ) can be expressed as [37]:
t = 40.3 c · f 2 T E C ,
where f is system operating frequency, and c is electromagnetic signal propagation speed.
The GNSS networks and respective ground-truth observations, data and products are used to make accurate estimates of ionospheric TEC values [40,41,42]. As the magnitude of the delay effect is proportional to inverse of the square of the frequency (2), it can be used to directly estimate TEC values [43], using a linear combination of code ( P ) and carrier phase ( ϕ ) measurements [44,45].
The difference in the signals’ reception delay can then be modelled as a sum of the group delays caused by hardware (satellite (Total Group Delay—TGD) and receiver (Receiver Differential Code Bias—rDCB)) biases and the ionospheric TEC. With the receiver calibration and no code smoothing with delay adjustment to code-derived TEC, it is possible to remove sources of error that result from estimation, instead of measurement of the bias, smoothing-induced delay of code TEC, and smoothing-induced ionospheric divergence bias of code TEC [45].

2.2. Specific Parameters of the Volcanic Activity

Used methods for volcanic activity monitoring can be classified as ground-based local, and satellite-based measurements. The former usually consist of developing multidisciplinary surveillance networks that include seismic, positional, tilt, visual and thermal infrared cameras, infrasound, gravity, magnetic and other measurements by local ground-based stations [46,47,48].
One of the first efforts in volcanic activity remote sensing can be found in [49], where an airborne infrared radiometer was used to measure the activity of Hawaiian volcanoes. First attempts to observe volcanic surfaces from the Earth’s orbits are described in [50]. Satellite-derived thermal data within the infrared region between 0.7 and 20 μm are nowadays frequently used as a tool to detect the presence of volcanic eruptions [51]. According to [52], there are 18 satellite-based remote sensing systems which monitor the volcanic activity in terms of radiation measuring, mostly in middle-infrared and thermal-infrared spectrum bands. Notable examples are HOTSAT [53] and MIROVA system [54,55]. MIROVA is a near real-time hot-spot detection system, developed to detect, locate and measure the heat radiation sourced from the volcanic activity.
The main benefit of the system is a combination of the accuracy and ease of exportability of application to different volcanoes. It does not require the analysis of historical data sets but rather produces results of the same quality as the algorithms, specifically calibrated for any volcano target. The system is based on the analysis of the Middle Infrared Radiation (MIR wavelength: 3.44–4.13 µm) extracted from the MODIS Level 1B data [56]. The extraction algorithm is based on spectral and spatial analysis of MIR data, providing detection of heat sources ranging from 1 MW to more than 10 GW of radiated power.

3. Research Methodology

The presented research covered the period from March 2000 to December 2019, containing collected MIROVA data, GNSS observables and selected space weather measurements. MIROVA dataset was obtained courtesy of a collaborative project between the Universities of Turin and Florence (Italy) [57]; GNSS data were retrieved from IGS servers [58], and space weather measurements were obtained from NASA Goddard Space Flight Center (GSFC) servers [59]. The MIROVA dataset of Etna thermal anomalies contains night-time, daily measured values of volcanic radiative power (VRP) in Watts [60]. We defined criteria for locating days of volcanic activity increase (VAI) as days with at least 25% of VRP higher than the preceding day ( V R P ), and with the absolute VRP value higher than the threshold value. To analyse the ionospheric TEC dependence on the volcanic influence, i.e., its activity magnitude, three different scenarios were defined depending on VRP threshold value, as shown in Table 1.
The additional criteria requiring a 25% or more day-to-day increase in VRP were defined, aiming to identify either beginning days of eruptions, or days with significant increase in the activity without actual lava eruptions (in these cases, the radiation increase occurred from the thermal energy build-up).
The comprehensive statistical analysis has been conducted evaluating different daily VRP increase values (5, 15, 25, 35 and 45%, respectively), in order to examine the possibility of random affectation and misleading results. The 25% of day-to-day VRP increase was finally selected as a reference value for further calculations, representing a sound compromise between sufficient number of records which satisfy the criteria, and appropriate number of cases of the volcanic activity increase.
The GPS observables have been obtained from the IGS network in the Receiver Independent Exchange Format (RINEX) [61]. The TEC values were estimated using GPS-TEC analysis software [62] following the standard methodology [63]:
P r , 4 j = P r , 1 j P r , 2 j = 40.3 T E C f 1 2 40.3 T E C f 2 2 + B r , 1 B r , 2 + B 1 j B 2 j ,
ϕ r , 4 j = ϕ r , 1 j ϕ r , 2 j = 40.3 T E C f 2 2 40.3 T E C f 1 2 + b r , 1 b r , 2 + b 1 j b 2 j N 1 N 2 ,
where j , r are satellite and receiver antenna points, respectively; P , ϕ are pseudorange and carrier phase observations, respectively; T E C is the slant total electron content along the propagation path (in TECu) with the ray path zenith angle χ s 0 ° ; f 1 , f 2 are operating frequencies; B r , B j are pseudorange code receiver and satellite hardware delay (in m), respectively; b r , b j are carrier phase receiver and satellite hardware delay (in m), respectively, and N 1 , N 2 are carrier-phase ambiguities (in m).
The simplified representation of the employed TEC determination method is shown in Figure 1. The code difference observables were levelled with phase differences to the correct TEC values, after which they were adjusted with code measurements.
The daily DCB values were retrieved from the Global Ionospheric Maps (GIM) IONEX files [66], employed to refine the ionospheric combinations. Vertical TEC (VTEC) values were obtained by using slant TEC (STEC) to VTEC mapping function [67].

3.1. Mitigation of Short-Term Solar Activity and Other Non-Local Factors’ Impact on TEC Behaviour

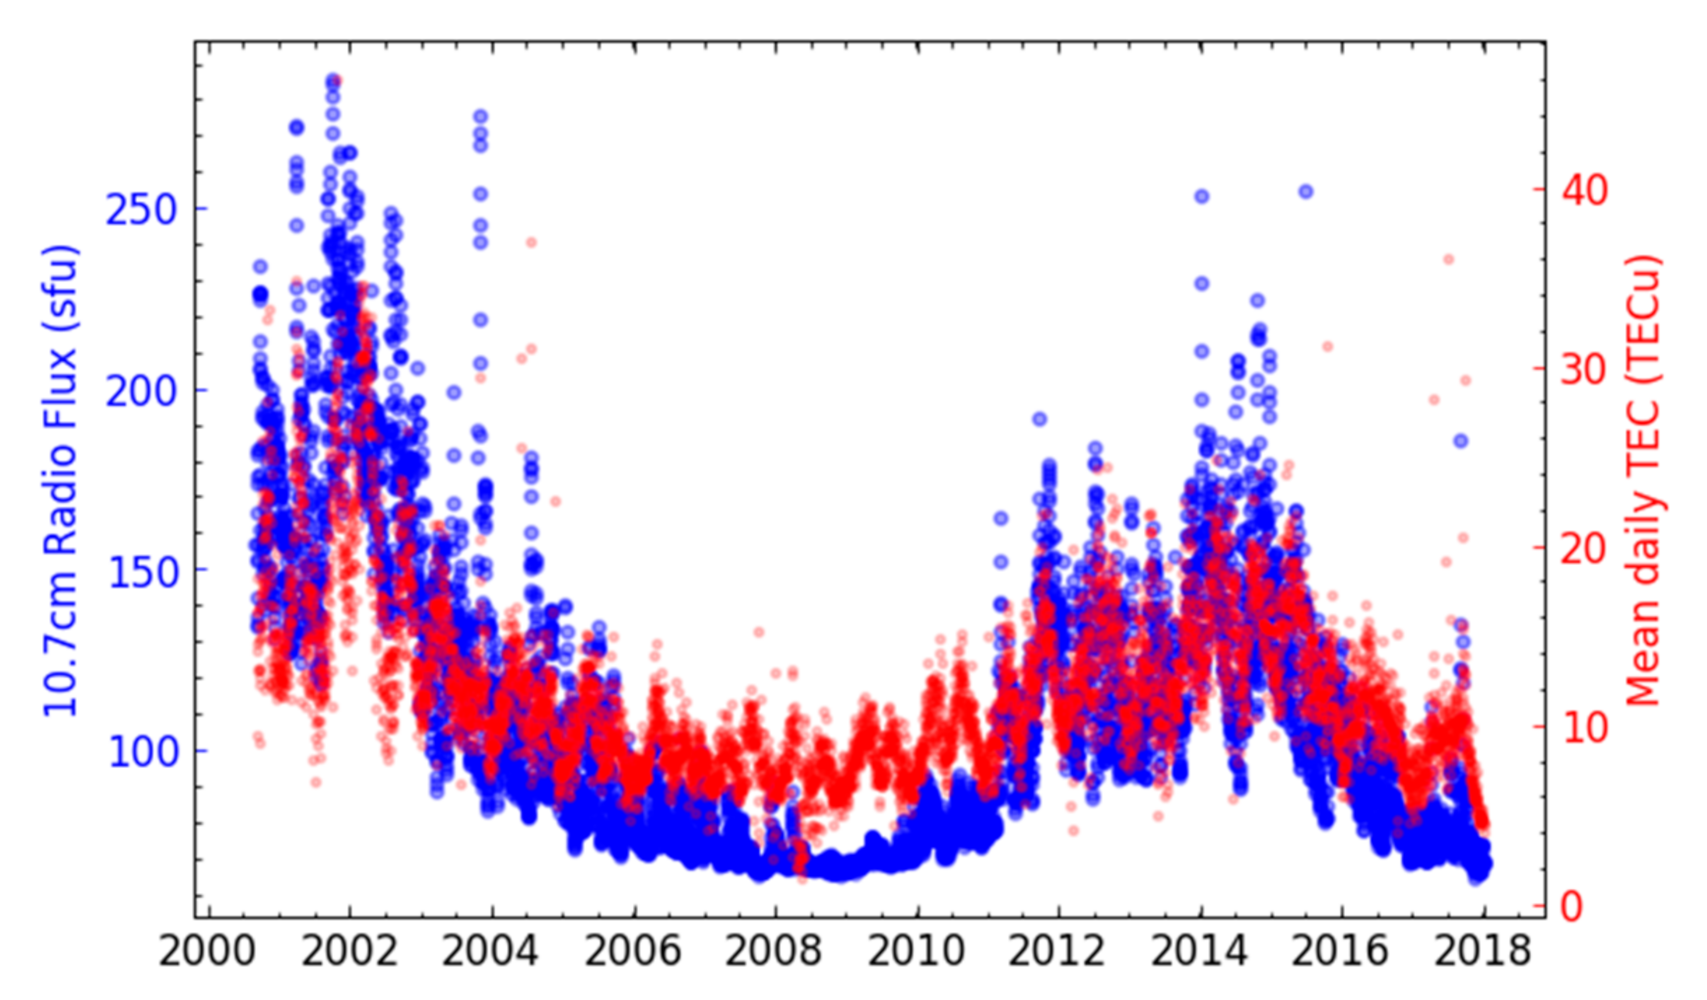
The daily TEC values are strongly correlated to the solar activity, as shown in Figure 2. The ionospheric TEC values were determined from ground-truth data at IGS Noto, and their mean values were compared to 10.7 cm sfu [29], expressed in solar flux units (1sfu = 10−22 Wm−2Hz−1).
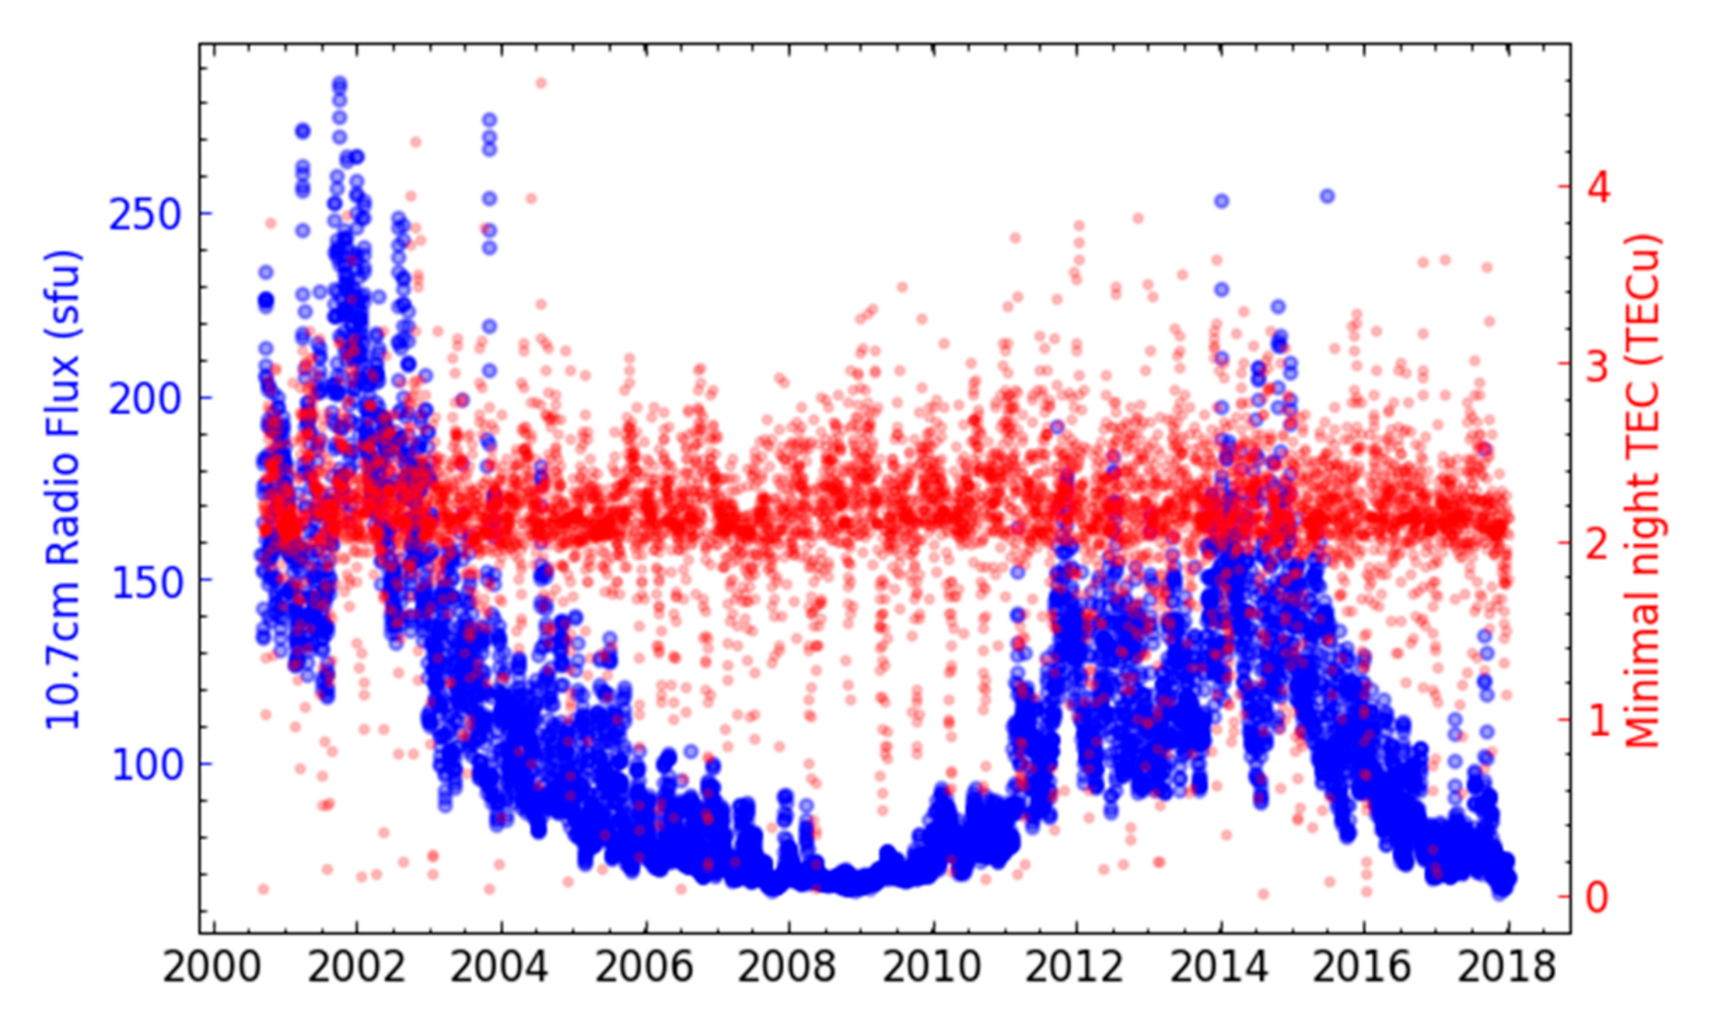
The influence of diurnal solar activity represents a challenge in an effort to detect volcanic influences, and appropriate filtering of the solar impact was essential. By examining various TEC subset patterns, we found that minimal night TEC values vary with solar activity in an acceptably small degree (Figure 3). We utilised this observation for detection of volcanic influence on ionospheric TEC along with larger solar effects. Hence, in further analysis minimal night TEC values were considered to be generally unaffected by the solar activity. In order to increase the confidence in practical validity of such an assumption, a series of data analyses were performed to detect possible adverse effects of the remaining solar influence.
Due to the night persistence of certain ionospheric layers, the minimal night TEC cannot be considered absolutely unaffected. As an additional control parameter, analyses of sfu, solar wind proton density and planetary Kp index were performed, thus confirming generally quiet and stable space weather activity during the elaborated periods.
Other causes of TEC anomalies are not directly related to the solar activity. Travelling Ionospheric Disturbances (TIDs) are propagating perturbations in the ionospheric electron density which, if classified as medium scale, have horizontal wavelengths of 100–250 km [68,69].
All mentioned influences have to be considered when examining TEC dynamics in terms of response to the volcanic and tectonic activity, since these affect the ionospheric TEC to a significantly greater extent than the lithosphere dynamics. This is especially important if a single, particular event is analysed.
The last used method to smooth out the mentioned effects was the TEC averaging over the large number of events as per defined criteria. The assumption was that all non-local forcing should equally affect the results over all employed, regional IGS stations. This was done by averaging over a large number of events, rather than affecting one station significantly more than the others, therefore allowing us to consider that the remaining differences can be attributed to local effects with satisfying confidence.

3.2. Determination of Specific Parameters of the Volacno Activity and Ionospheric TEC Features’ Behaviour Relation

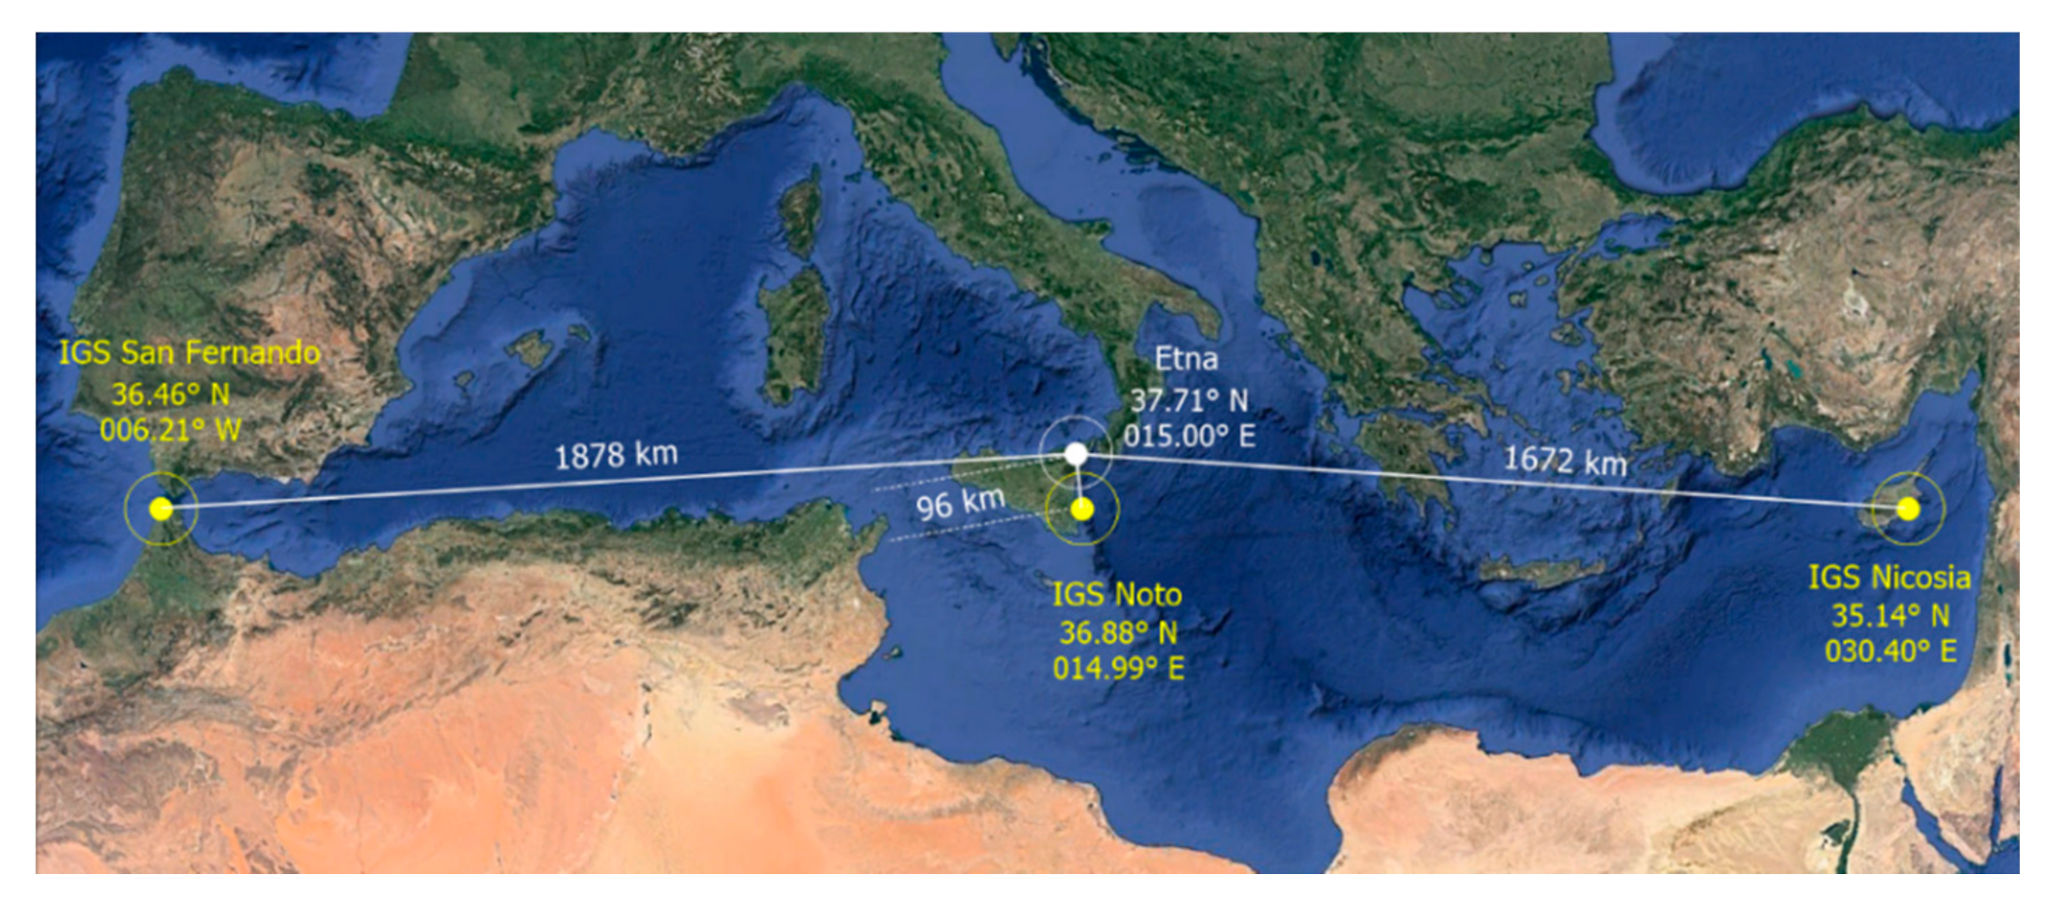
We have analysed the ionospheric TEC patterns around days of VAI at three IGS reference stations, positioned on similar geographical latitudes: IGS Noto (Italy; 36.88°N, 14.99°E), IGS San Fernando (Spain; 36.46°N, 6.21°W) and IGS Nicosia (Cyprus; 35.141°N, 33.396°E). The IGS Noto was chosen due to its close vicinity to the Etna volcano (distance = 96 km). The other two stations were selected as a control distant stations (1878 km and 1672 km, respectively), geographically considered to be outside of the direct volcano influence (Figure 4).
In addition, to directly compare TEC patterns during active and quiet volcanic periods, the same calculation was repeated with reverse criteria; by selecting cases where VRP was less than 1 × 10⁶ Watts (total of 493 days), regardless of amount of relative change from the previous day.
As per activity Criteria A, B and C, we extracted minimal night TEC values for defined index days—30 days before and 20 days after the VAI, respectively. The mean value of minimal night TEC was calculated for each index day. The same analysis was performed independently for all locations. In addition, the median TEC values were also calculated to assess the possibility of misleading results regarding the outliers’ influence. The mean and median calculations of minimal TEC also increased the confidence in assumption that non-local influences on TEC are statistically averaged in a similar manner for all analysed IGS stations.
The preliminary results referring to specific patterns of TEC time-series dictated further analyses. Pearson correlation coefficients between VRP and TEC time-series have been calculated both for the whole period, and separately for the defined activity criteria periods. The obtained 5-day lag of VRP increase after the TEC peak has been verified using a normalised cross-correlation technique [70]. The observed TEC oscillatory pattern was analysed with the Fast Fourier Transform (FFT) method [71,72], converting a function’s time-domain into frequency-domain, with the results confirming the observed periodicity.

4. Structural-Analytical Presentation of the Research Results

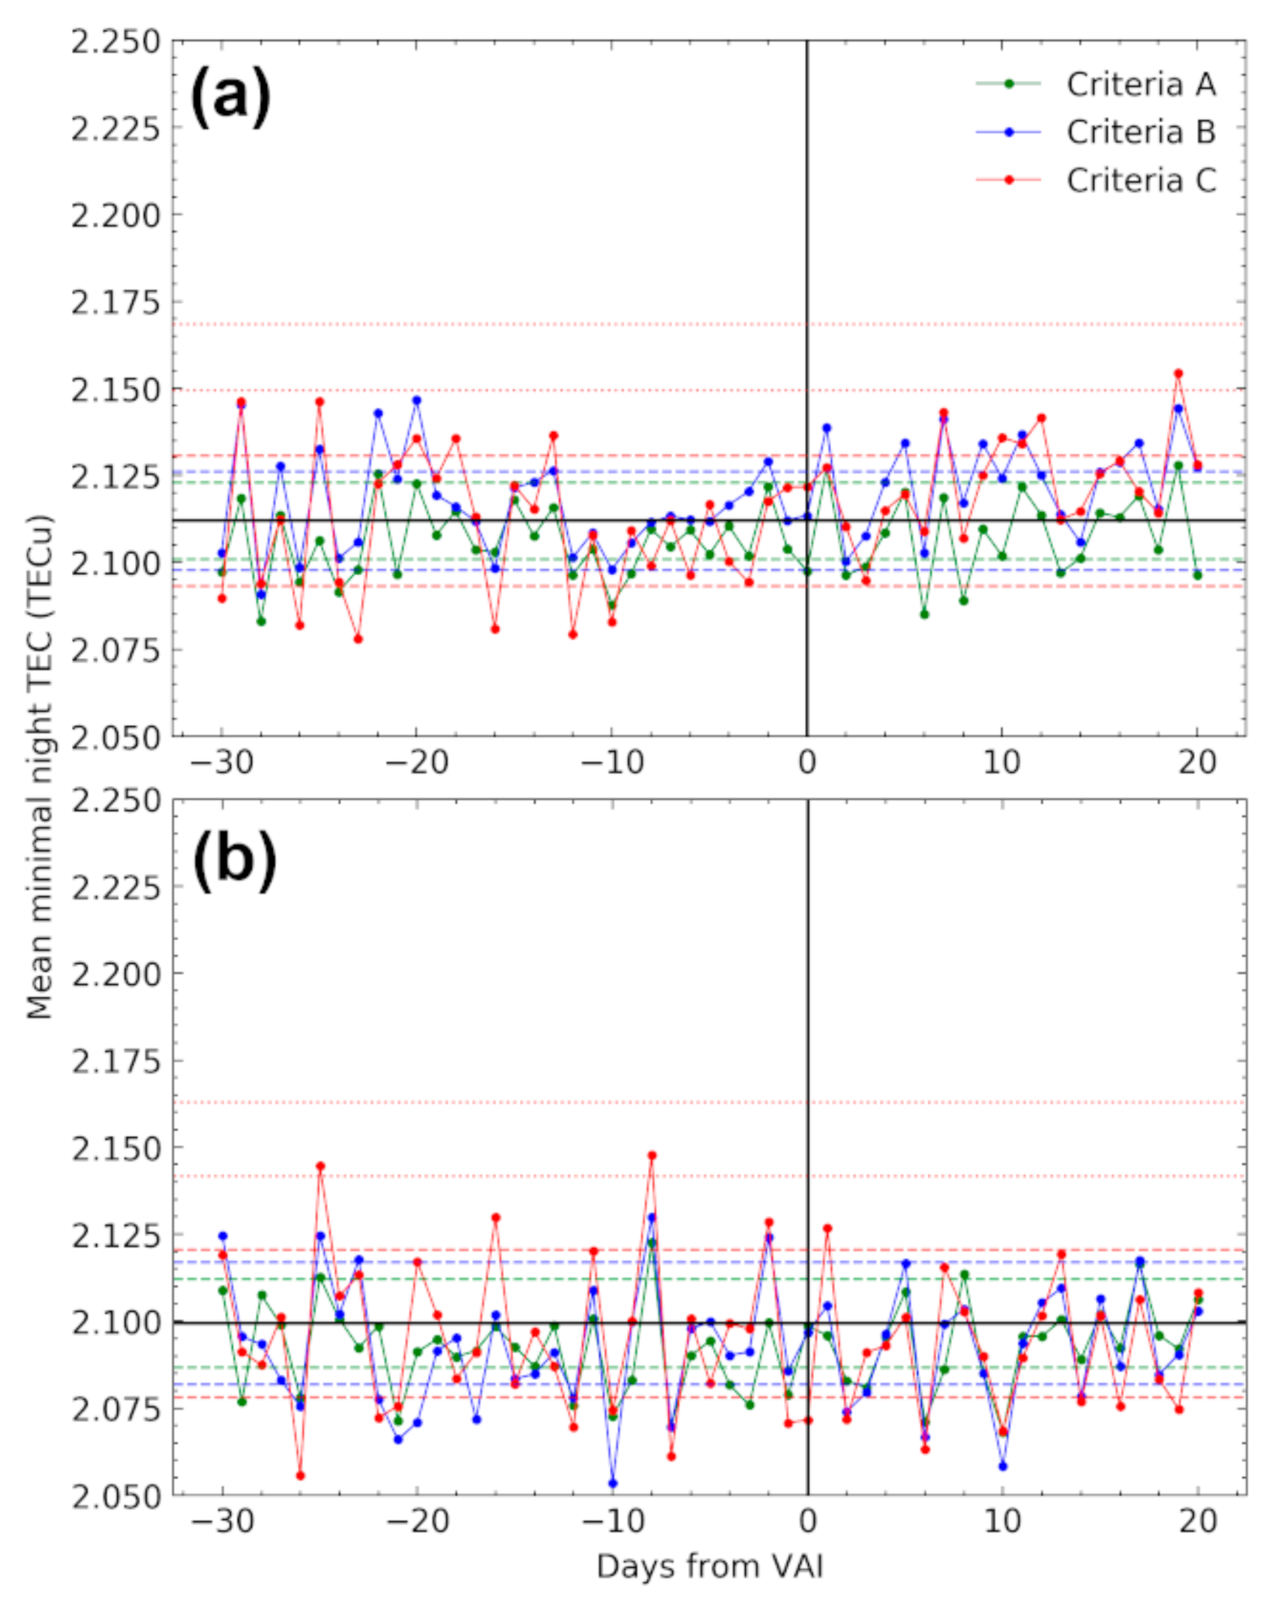
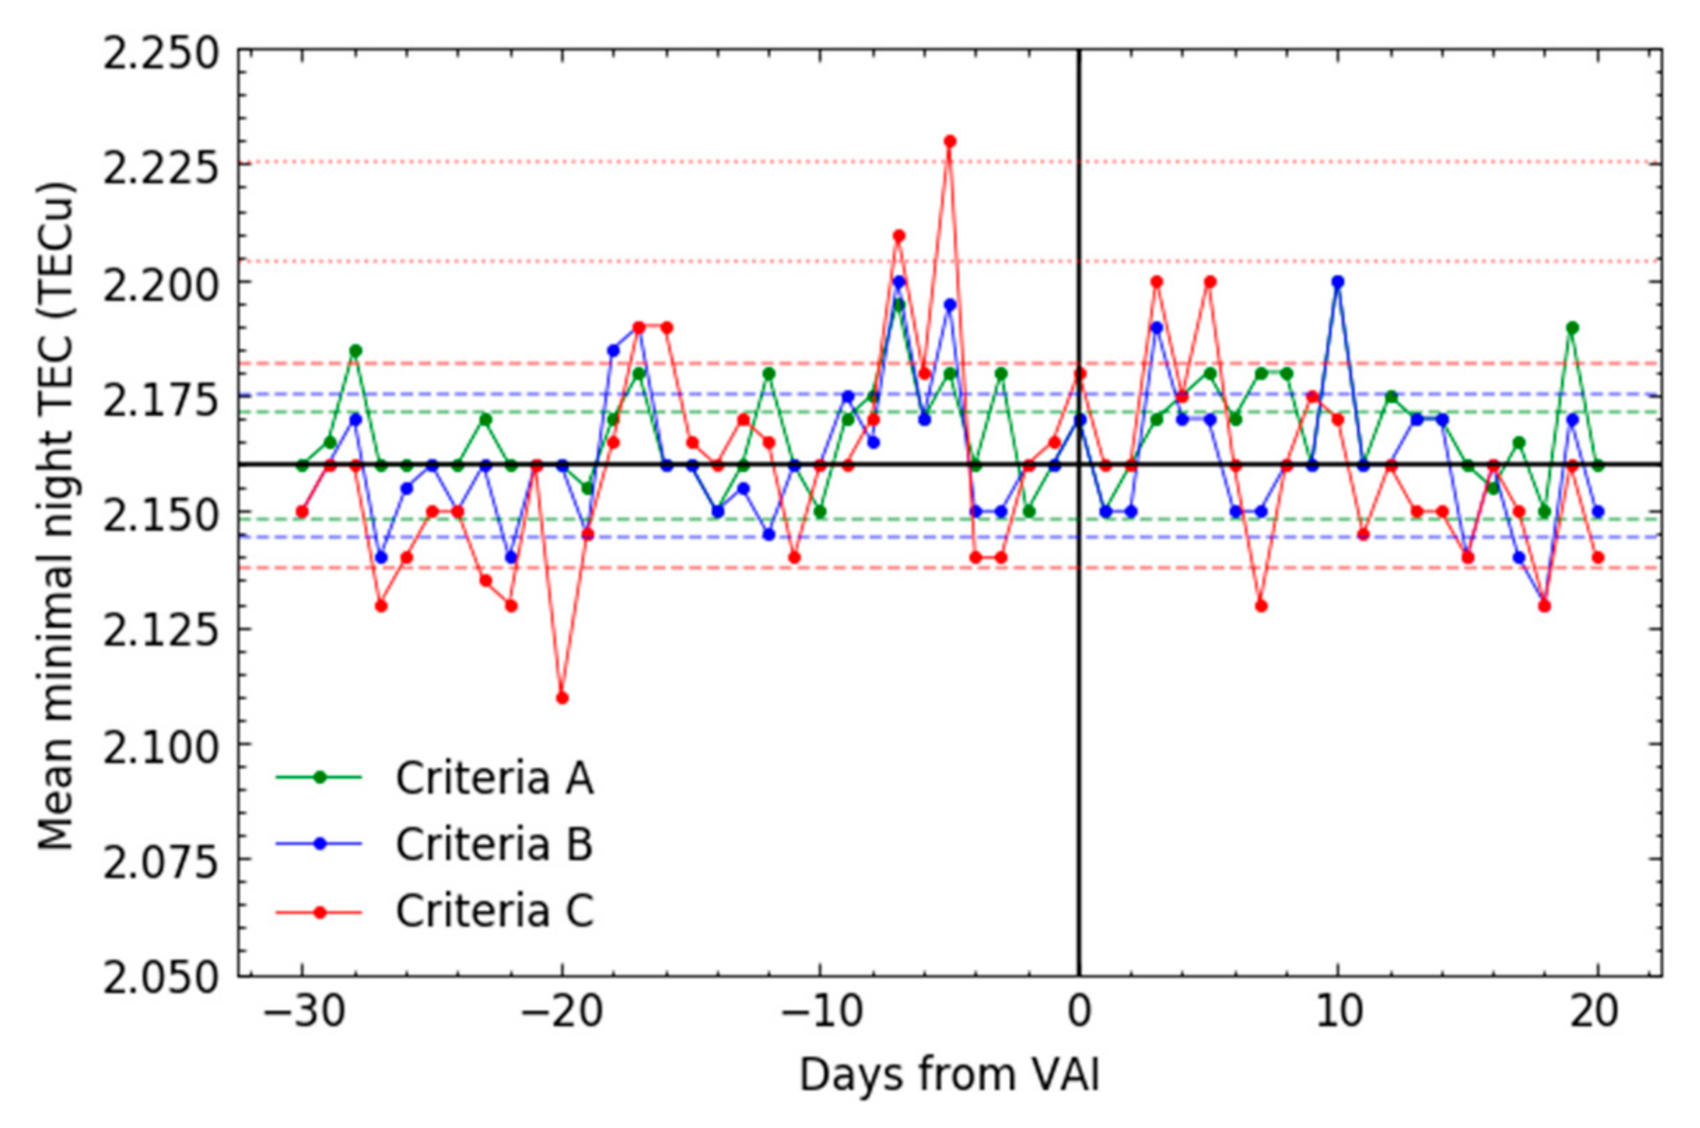
The following same-scale figures represent ionospheric TEC patterns through index days according to defined Criteria A, B and C. Horizontal black lines denote mean minimal values. Horizontal, dashed coloured lines represent ±1 standard deviation from the mean value for the respective criteria. For the Criteria C (for IGS Noto), +2 and +3 standard deviations from the mean value were added as red dotted lines.
The most notable feature within calculated TEC patterns is large and sharp TEC enhancement located at approximately 5 days before the VAI, being most prominent for the Criteria C (Figure 5). This abrupt increase refers to IGS Noto only.
Significantly larger variation of TEC values at IGS Noto can be considered as at least partially attributed to the volcanic activity. However, in this phase other causes cannot be excluded.
The magnitudes of the volcanic activity increase other than 25% were additionally analysed, investigating the possibility of different impacts of VAI threshold values. The pattern which is characterised with the TEC increase 5 days before the VAI is visible in each case (Figure 6), being especially prominent as the VRP increases as well. Since the VRP change did not affected the general pattern, the 25 % day-to-day VRP increase was selected as a valid threshold reference. During the extreme activity increase (45 %—Figure 6e), additional TEC enhancements and depletions were observed, however, due to the small number of days firm conclusions should not be drawn.
The analysis was repeated for IGS San Fernando and IGS Nicosia (Figure 7), revealing significantly different patterns when compared to IGS Noto (Figure 8).
These changes seem to result from noise rather than from a recognizable pattern, especially in the case of IGS Nicosia where the pattern resembles uniform across the whole period.
The median night TEC values were calculated further. According to the similarity of derived time-series (Figure 9), we strengthen our confidence that the possible outlier effects are not a prevalent cause of observed patterns within the analysed datasets.
The results of median calculation arguably show similar TEC pattern around the VAI compared to the mean calculation pattern, with the prominent peak more than +3 standard deviations from the median value for the Criteria C.
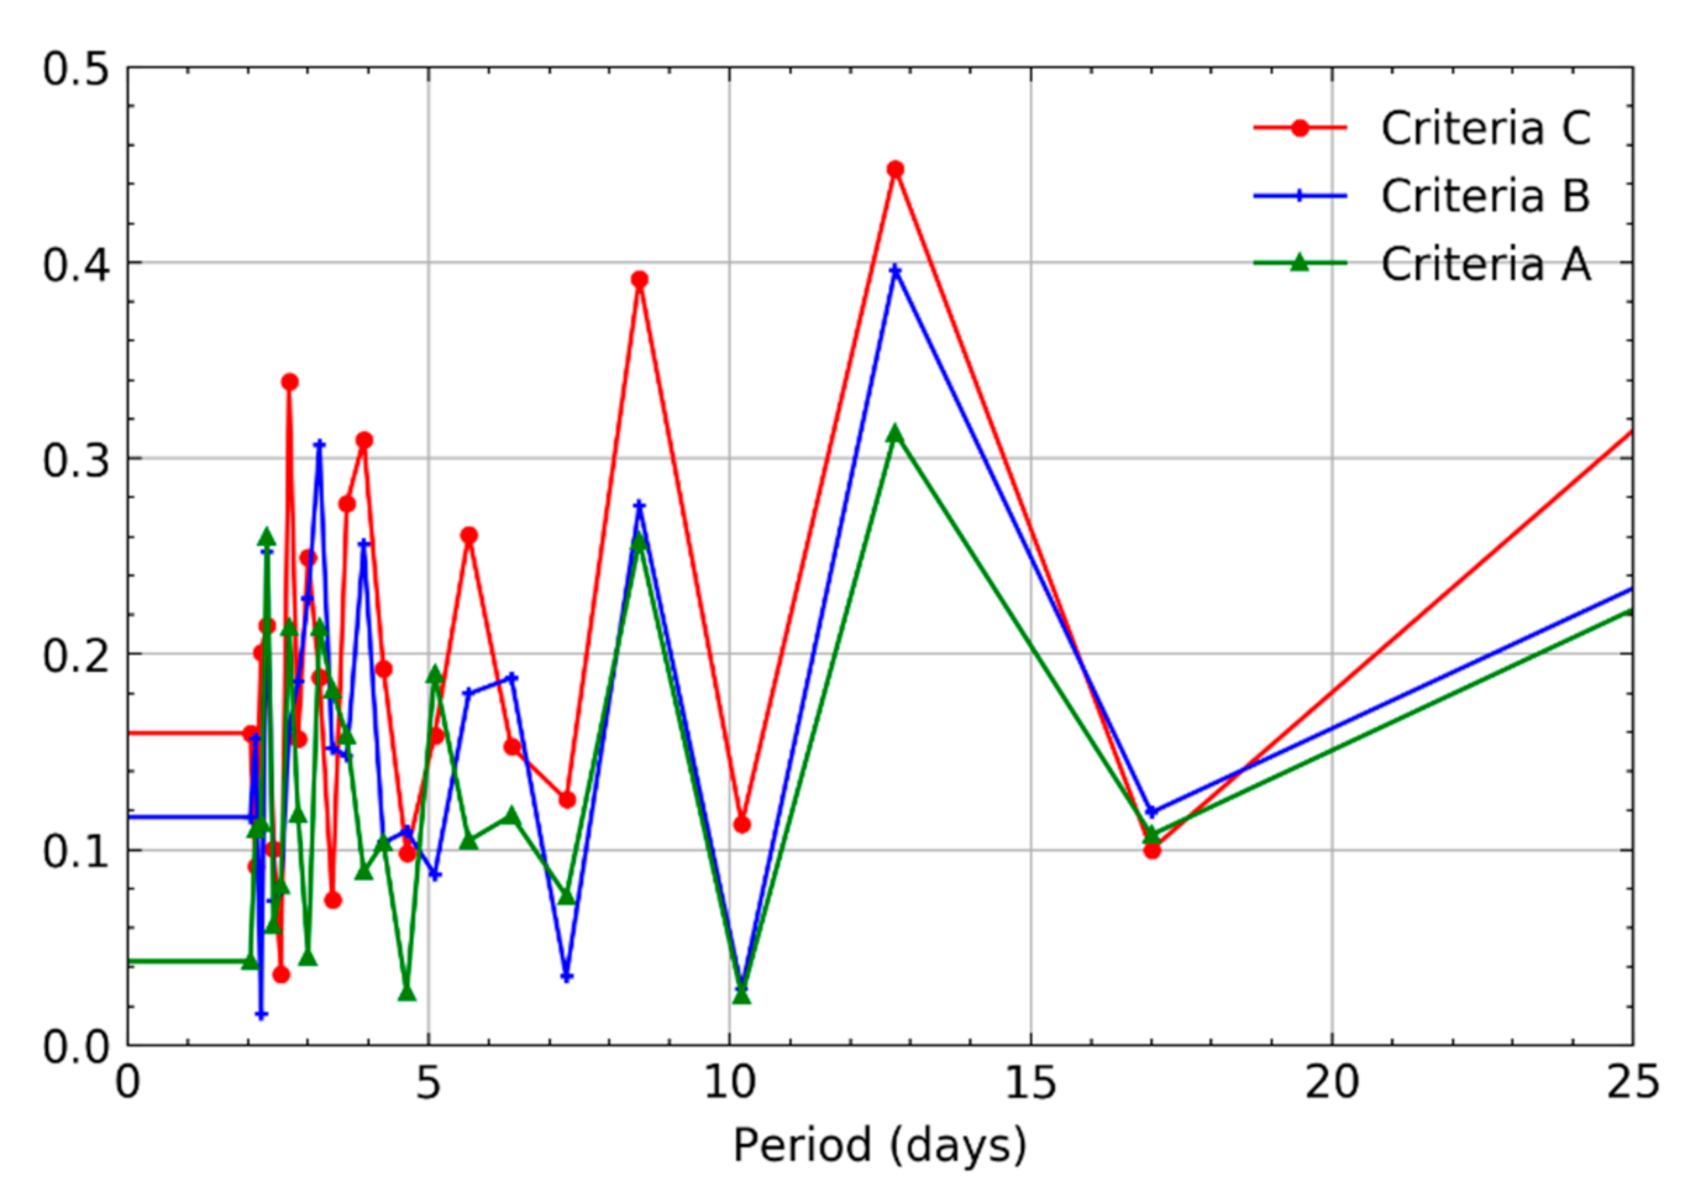
Before the observed peak, TEC oscillations (enhancements and depletions during several days before the VAI) at IGS Noto can be also seen. Such a pattern seems to cease with VAI. Applying the FFT method, two prominent peaks were found (Figure 10). The largest oscillation is found to have a period of 12.5 days (half-period of 6.25 days), with the second largest oscillation of 8.5 days (half-period of 4.25 days). This corresponds to the two most prominent peaks in the frequency-domain data. The observed peaks are consistent within all criteria.
When compared to distant locations, mean TEC values at IGS Noto show increased amplitude and standard deviation. The most prominent anomalous TEC values were found during the activity of Criteria C around the fifth day before the VAI. It can also indicate that the major volcanic activity caused larger deviations in the ionospheric TEC values, when compared to minor- or no-activity periods.
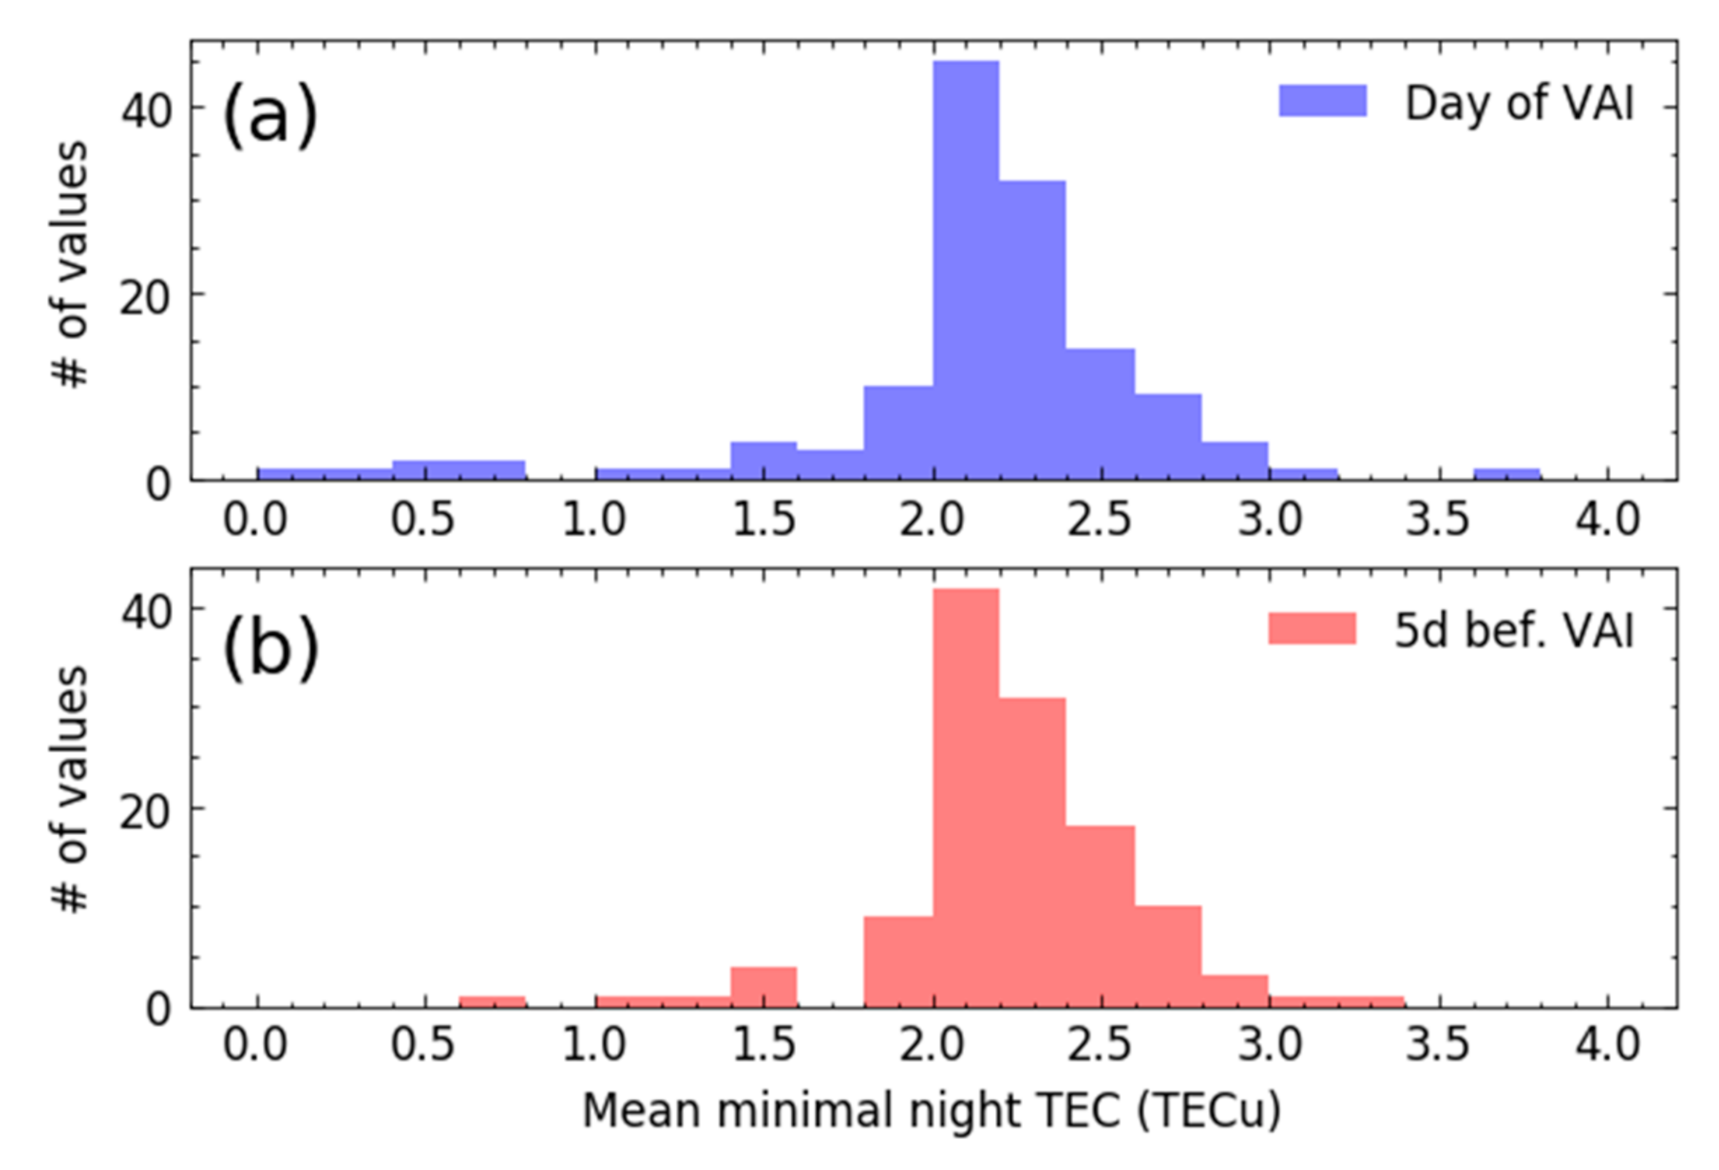
Distribution of minimal night TEC values for IGS Noto (Criteria C) is presented in Figure 11. The majority of data distribution is similar between two datasets: during the day of VAI (Figure 11a) and 5 days before (Figure 11b). The lack of large histogram values additionally suggests that the outlier values have not significantly influenced the datasets.
Basic statistical indicators of minimal night TEC values for all stations are presented in Table 2. Data are shown for the whole dataset, as well as compared to the same indicators for VAI and 5 days before VAI.
The main difference between criteria, in relation to the whole dataset, was the notable increase in mean and median TEC value for Criteria C, 5 days before VAI at IGS Noto solely. The increase is present both compared to Criteria A and B at the same day, as well as compared to Criteria C on VAI. Furthermore, the standard deviation at station Noto is significantly larger when compared to other corresponding values. Absolute minimum values for IGS Noto are significantly smaller than for other two stations. This might indicate the possibility of almost complete temporary removal of free electrons from the atmospheric column during certain stages of volcanic activity.
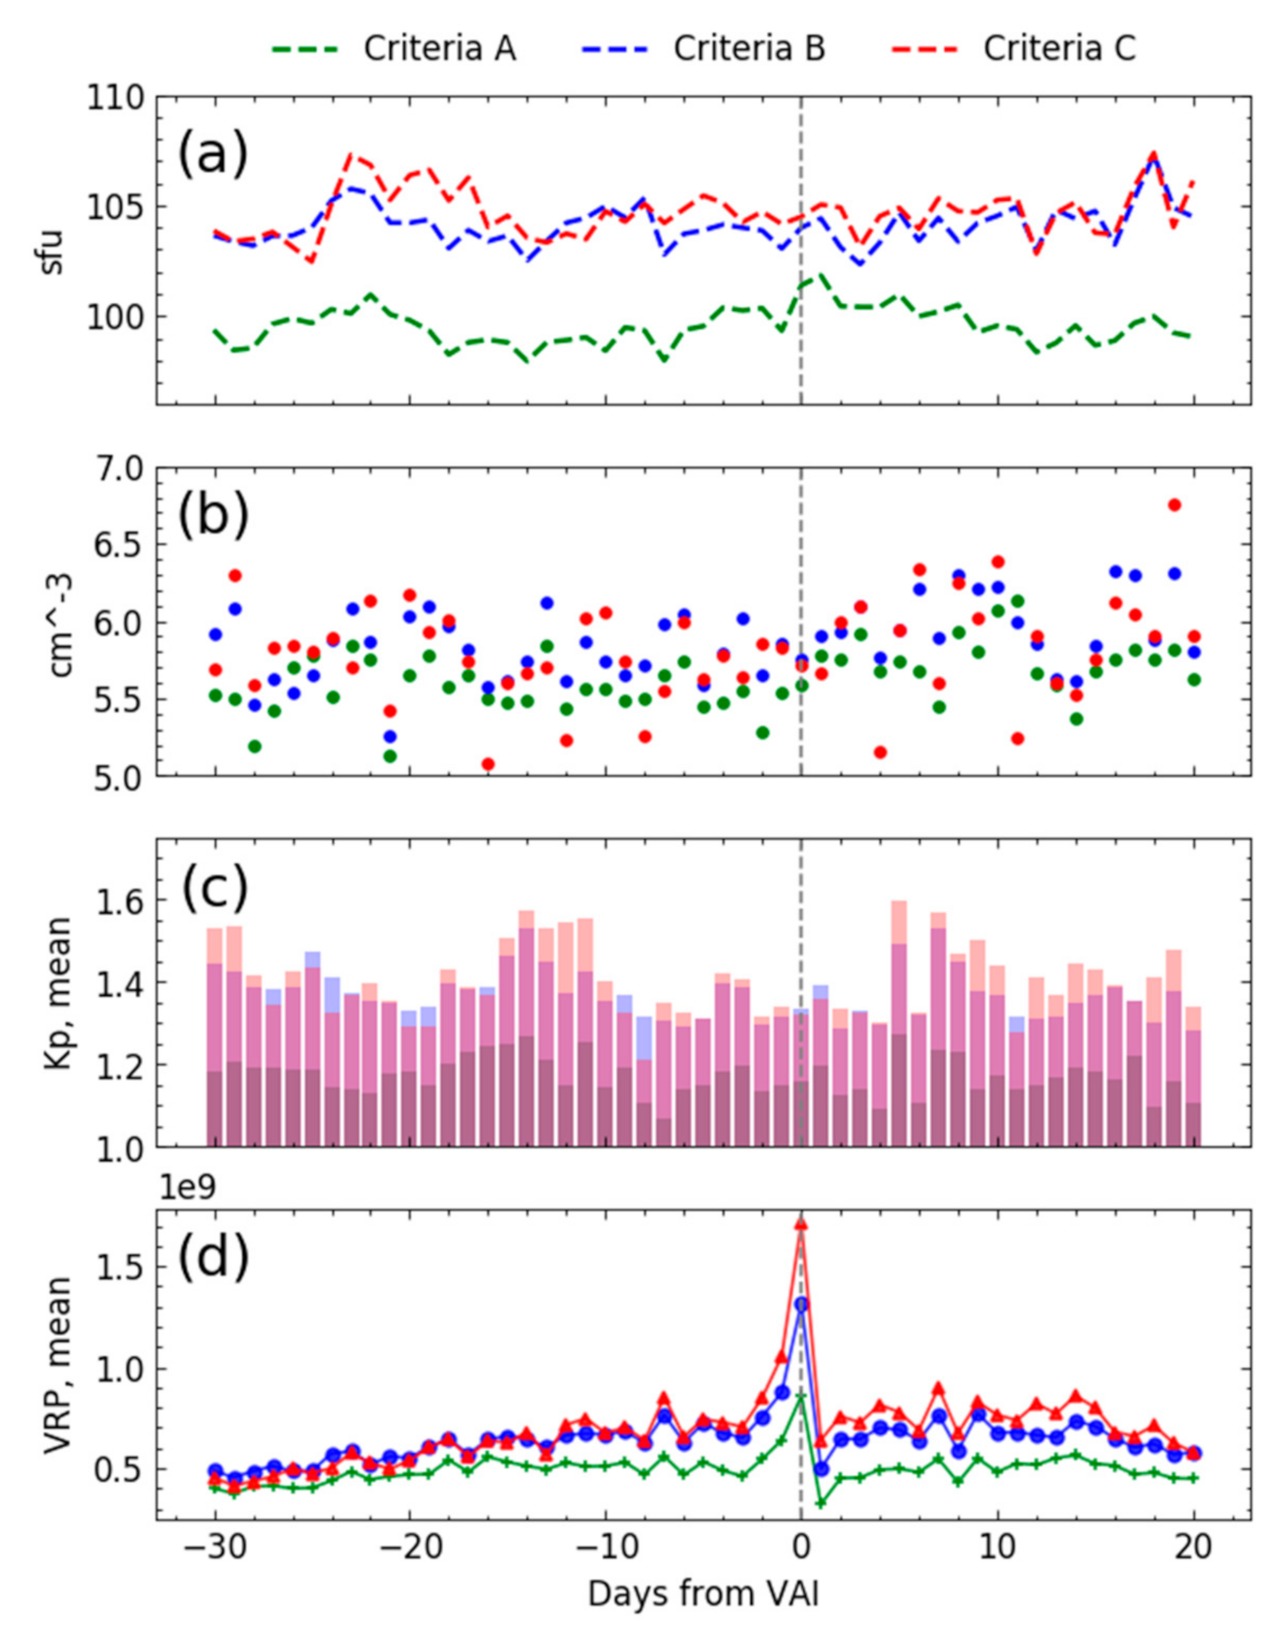
The space weather indices were calculated employing the same methodology of averaging values over the index days (Figure 12).
There is no visible increase in solar flux and solar wind proton density, as well as in the Kp index around the IGS Noto TEC peak days. In Figure 12c, magnitude of geomagnetic disturbance on a 0–9 scale is presented in terms of planetary Kp index. Kp index is an integer value, but here the mean value of respective integers over index days around VAI is presented, yielding results as a float type. Both 10.7 cm sfu and Kp index, with the proton density in a lesser amount (Figure 12b), indicate that the days that enter into Criteria B and C, display increased solar activity compared to those of Criteria A. However, there are no visible anomalies that could explain the peak in the night TEC values over IGS Noto.
The TEC pattern over IGS San Fernando follows 10.7 cm sfu and Kp values to a certain extent. Given the dependence of TEC, it was expected to have a possible effect. Therefore, it might be accredited to the remains of the day-time solar influence and geomagnetic processes. Patterns derived from IGS Nicosia show a less similar shape compared to solar parameters. Any remaining similarity between space weather indices and night TEC values is absent in the pattern derived from IGS Noto.
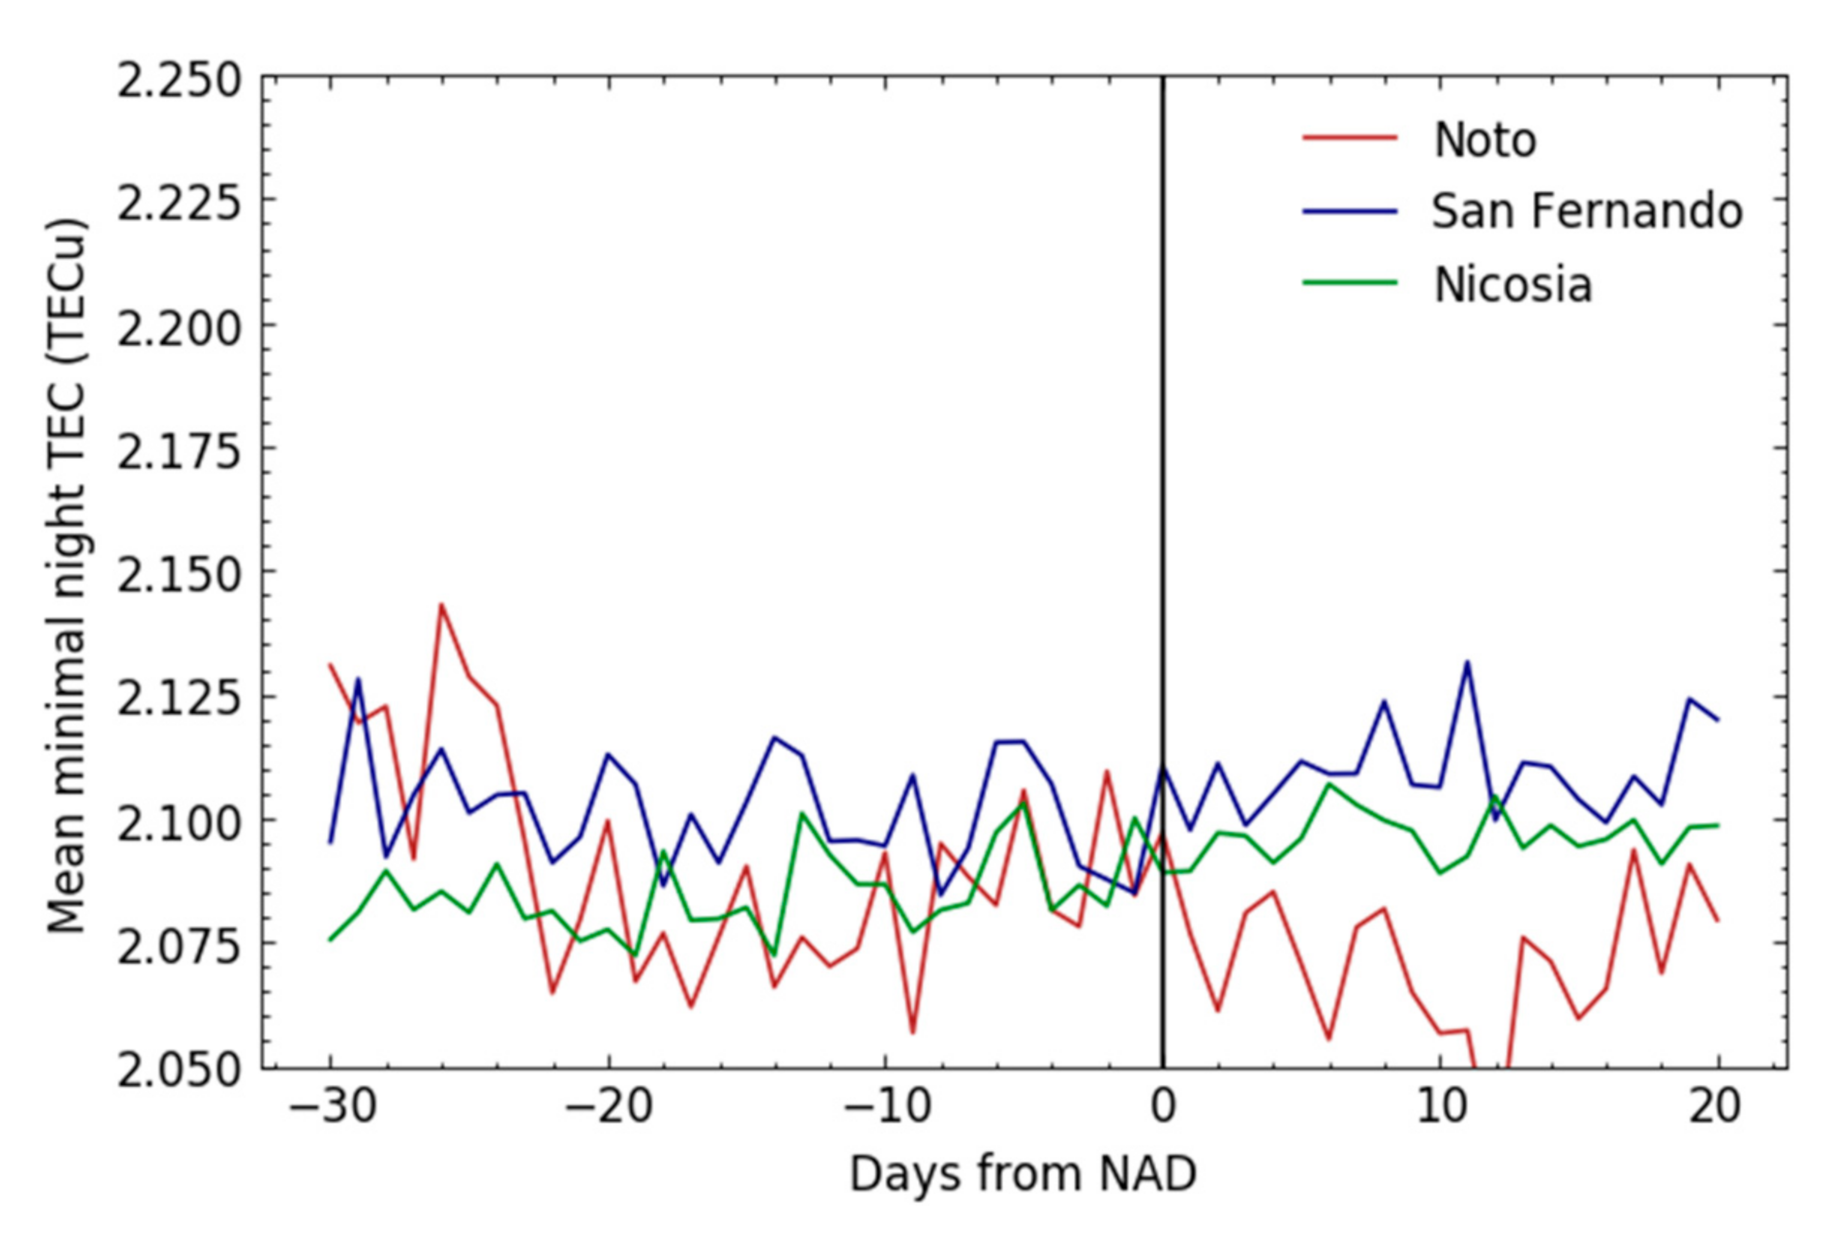
The results of TEC pattern analysis during quiet volcanic periods are presented in Figure 13. The patterns were compared using reverse criterion, i.e., non-active days (NAD), with VRP < 1·106 W. The Figure scale was set as previously described.
The TEC patterns are similar, with the IGS Noto mean value being slightly lower than that at San Fernando, and very similar to the case of IGS Nicosia and again, more variable from day to day around NAD than patterns from both control stations. It should be noted that, although these patterns represent generally quieter conditions, the volcano is never absolutely inactive.
The correlation coefficients were calculated for VRP and TEC for all locations. As the most prominent TEC peak was present 5 days before volcano activity increase, the lagged correlation was performed with TEC time-series, shifted for 5 days before correlating with the VRP (Table 3). The time lag of 5 days VAI increase after the TEC peak was verified using the cross-correlation technique (Figure 14).
The largest correlation took place when a lagged correlation was performed for station Noto, with increasing strength in pace with increasing activity criteria from lower to higher levels. The higher correlation values at IGS Noto strengthen the confidence in the conclusion that the observed TEC peak 5 days before VAI does represent a cause–effect relationship between volcanic activity and the TEC values in nearby ionospheric areas.

5. Brief Overview of the Results’ Specifics

The presented results show larger night TEC deviations from the mean dataset value for IGS Noto than those for IGS San Fernando. A general upward and oscillating trend in TEC pattern with a half-period of 6.25 days is notable until the time reaches the day of VAI, with maximum values generally found around 5 days before. The periodicity analysis also suggests that the pattern oscillation is further modulated with somewhat higher frequency, having a half-period of 4.25 days and a smaller magnitude. Afterwards, a decrease in night TEC values was observed and the pattern loses its wave-like features. The described pattern seems to generally exist for all three activity criteria; however, it is most prominent for the Criteria C, reaching the maximal enhancement at +3 standard deviations from the mean value.
As the Criteria C contains a total of 131 days and is therefore considered to be a representative sample, our argument is that the night TEC increase of +3 standard deviations from the mean value cannot be explained by the random variability. As we could not explain it in this way, or by examining various metrics of solar influence, by comparing with two distant control stations, by considering possible data outlier influence on mean values, or any other way, we conclude that the ionospheric TEC peak located at 5 days before VAI has to be associated with the Etna volcano activity, and moreover, is caused by the same activity. The mentioned enhancement was preceded with oscillatory behaviour of ionospheric TEC; however, the peak was the most prominent observation. As the TEC values increase with tightening criteria definition for the Etna activity level, it follows that the TEC response is also dependent on the amount of the volcanic forcing. Most of the TEC patterns’ variations were found within periods of the highest volcano activity.
The results suggest that the observed TEC variations are related to the volcano seismic activity before the active phase of VRP increase. The observed increase in TEC values perhaps can be explained with an increase in the available endogenous energy which firstly produced an increase in air–earth currents. We propose a hypothesis that radon emanation or other seismic-related pre-eruption factors modified the electrical conductivity of the column of air by increasing the charge of boundary layer, leading to a change of vertical electrical air–earth currents and subsequent local modification of GEC properties, detectable as observed oscillations and peaks of the ionospheric TEC. Further investigation of this phenomena, together with an explanation of possible causes and mechanisms of action, remain a matter for future work.

6. Conclusions

The presented results suggest a causal correlation between the Etna volcano activity and the surrounding ionospheric behaviour, providing insights referring to the mutual relation between the two phenomena. Temporal coupling processes and the respective ionospheric total electron content patterns as a consequent dependent variable were investigated. The volcanic influence was found to be present during the peak activity periods, as well as before the actual increase in VRP. The conclusions are based on the analyses of 19 years of ionospheric and volcanic activity data. The specific volcanic activity scenarios were distinguished and correlated with ionospheric TEC values.
The results suggest that 5 days before the commencement of a significant rise in activity, ionospheric TEC within the volcano region sharply increases, followed by the abrupt decline in values towards the day of VAI. The oscillatory pattern of TEC behaviour is found to be present with a main oscillation half-period of 6.25 days. Larger variations in TEC values were observed near the volcano site. A special care was taken in order to exclude possible external influences in terms of the space weather activity, overall solar influence, and possible outliers. Finally, we compared the TEC behaviour during volcano activity with behaviours during non-active periods. The intensity of the TEC anomalous behaviour was found to be positively related to the amount of forcing from the Etna volcano activity and we have not been able to associate observed TEC behaviour prior to volcanic activity increase to the solar forcing.
The proposed approach and presented findings represent a means of generalization of the TEC behaviour pattern during phases before and at the instance of increased volcanic activity and eruptions, with the possibility of separation of the ionospheric activity as a prognostic parameter.

Author Contributions

Conceptualization, I.T., D.B. and S.K.; methodology, I.T. and D.B.; software, I.T.; validation, I.T., D.B. and S.K.; formal analysis, S.K.; investigation, I.T.; resources, I.T. and D.B.; data curation, I.T.; writing—original draft preparation, I.T.; writing—review and editing, D.B.; visualization, I.T. and D.B.; supervision, D.B. and S.K.; project administration, D.B.; funding acquisition, S.K. All authors have read and agreed to the published version of the manuscript.

Funding

This research was funded by the University of Rijeka under the project—uniri-tehnic 18-66: Research of environmental impact on the operation of satellite navigation system in maritime navigation.

Acknowledgments

This work has been fully supported by the University of Rijeka under the project—uniri-tehnic 18-66. The authors are grateful for all available MIROVA, GNSS and space weather data and products from the respective organisations, based on which we conducted our research. Finally, we are sincerely grateful to the reviewers for their time, efforts and constructive remarks and observations which significantly led to the improvement of our work.

Conflicts of Interest

The authors declare no conflict of interest.

Abbreviations

TECTotal Electron Content
TECuTEC unit
STECSlant TEC
sfuSolar radio flux
GNSSGlobal Navigation Satellite System
LAICLithosphere–Atmosphere–Ionosphere Coupling
GECGlobal Electrical Circuit
VEI4+Volcanic Explosivity Index 4+
MIROVAMiddle InfraRed Observation of Volcanic Activity
rDCBReceiver Differential Code Bias
TGDTotal Group Delay
VRPVolcanic Radiative Power
VAIVolcanic Activity Increase
GIMGlobal Ionospheric Maps
IGSInternational GNSS Service
NADNon-Active Days
FFTFast Fourier Transform

References

  1. Pulinets, S.; Ouzounov, D. The Possibility of Earthquake Forecasting; IOP Publishing: Bristol, UK, 2018. [Google Scholar]
  2. Parkinson, B.W.; Spilker, J.J., Jr.; Axelrad, P.; Enge, P. Global Positioning System: Theory and Applications; American Institute of Aeronautics and Astronautics: Washington, DC, USA, 1996; Volume 2. [Google Scholar]
  3. Klobuchar, J.A. Ionospheric Effects on GPS. In Global Positioning System: Theory and Applications; Parkinson, B.W., Spilker, J.J., Eds.; American Institute of Aeronautics & Astronautics: Reston, VA, USA, 1996; Volume 1, pp. 485–515. [Google Scholar]
  4. Pulinets, S.; Boyarchuk, K. Ionospheric Precursors of Earthquakes; Springer: Berlin, Germany, 2005. [Google Scholar]
  5. Pulinets, S.; Ouzounov, D. Lithosphere–Atmosphere–Ionosphere Coupling (LAIC) model—An unified concept for earthquake precursors validation. J. Asian Earth Sci. 2010, 41, 371–382. [Google Scholar] [CrossRef]
  6. James, M.R.; Wilson, L.; Lane, S.; Gilbert, J.S.; Mather, T.A.; Harrison, R.G.; Martin, R.S. Electrical Charging of Volcanic Plumes. Space Sci. Rev. 2008, 137, 399–418. [Google Scholar] [CrossRef]
  7. Mather, T.A.; Harrison, R.G. Electrification of volcanic plumes. Surv. Geophys. 2006, 27, 387–432. [Google Scholar] [CrossRef]
  8. Kamsali, N.; Prasad, B.S.N.; Datta, J. The Electrical Conductivity as an Index of Air Pollution in the Atmosphere. In Advanced Air Pollution; Nejadkoorki, F., Ed.; Tech Open: Shangai, China, 2011; pp. 365–390. [Google Scholar]
  9. Williams, E.R. The global electrical circuit: A review. Atmos. Res. 2009, 91, 140–152. [Google Scholar] [CrossRef]
  10. Bering, E.A.; Few, A.A.; Benbrook, J.R. The Global Electric Circuit. Phys. Today 1998, 51, 24–30. [Google Scholar] [CrossRef]
  11. Roble, R.G.; Tzur, I. The Global Atmospheric Electrical Circuit. In Study in Geophysics: The Earth’s Electrical Enviroment; National Academy Press: Washington, DC, USA, 1986; pp. 206–231. [Google Scholar]
  12. Roble, R.G. On Modeling Component Processes in the Earth’s Global Electric Circuit. J. Atmos. Sol.-Terr. Phys. 1991, 53, 831–847. [Google Scholar] [CrossRef]
  13. Richmond, A.D. Modeling the ionosphere wind dynamo: A review. Pure Appl. Geophys. 1989, 131, 413–435. [Google Scholar] [CrossRef]
  14. Akasofu, S.I. The solar wind-magnetosphere dynamo and the magnetospheric substorm. Planet. Space Sci. 1975, 23, 817–823. [Google Scholar] [CrossRef]
  15. Harrison, R.G.; Aplin, K.L.; Rycroft, M.J. Atmospheric Electricity Coupling Between Earthquake Regions and the Ionosphere. J. Atmos. Sol.-Terr. Phys. 2010, 72, 376–381. [Google Scholar] [CrossRef] [Green Version]
  16. Tramutoli, V.; Marchese, F.; Falconieri, A.; Filizzola, C.; Genzano, N.; Hattori, K.; Lisi, M.; Liu, J.Y.; Ouzounov, D.; Parrot, M.; et al. Tropospheric and Ionospheric Anomalies Induced by Volcanic and Saharan Dust Events as Part of Geosphere Interaction Phenomena. Geosciences 2019, 9, 177. [Google Scholar] [CrossRef] [Green Version]
  17. Li, W.; Guo, J.; Yue, J.; Shen, Y.; Yang, Y. Total electron content anomalies associated with global VEI4+ volcanic eruptions during 2002–2015. J. Volcanol. Geotherm. Res. 2016, 325, 98–109. [Google Scholar] [CrossRef]
  18. Shults, K.; Astafyeva, E.; Adourian, S. Ionospheric detection and localization of volcano eruptions on the example of the April 2015 Calbuco events. J. Geophys. Res. Space Phys. 2016, 121, 10303–10315. [Google Scholar] [CrossRef] [Green Version]
  19. Zlotnicki, J.; Li, F.; Parrot, M. Signals recorded by DEMETER satellite over active volcanoes during the period 2004 August–2007 December. Geophys. J. Int. 2010, 183, 1332–1347. [Google Scholar] [CrossRef] [Green Version]
  20. Zlotnicki, J.; Li, F.; Parrot, M. Ionospheric Disturbances Recorded by DEMETER Satellite over Active Volcanoes: From August 2004 to December 2010. Int. J. Geophys. 2013, 2013, 1–18. [Google Scholar] [CrossRef] [Green Version]
  21. Jukić, O.; Sikirica, N.; Rumora, I.; Filić, M. Seven days in Chile: Impact of the 2011 Puyehue-Cordon Caulle volcanic eruption on GPS ionospheric delay. In Proceedings of the International Symposium on Global Navigation Satellite System 2018 (ISGNSS 2018), Bali, Indonesia, 21–23 November 2018; Wijaya, D.D., Ed.; p. 1. Available online: https://www.e3s-conferences.org/articles/e3sconf/abs/2019/20/contents/contents.html (accessed on 12 February 2019).
  22. Cahyadi, N.M.; Rahayu, R.W.; Heki, K.; Nakashima, Y. Harmonic ionospheric oscillation by the 2010 eruption of the Merapi volcano, Indonesia, and the relevance of its amplitude to the mass eruption rate. J. Volcanol. Geotherm. Res. 2020, 405, 1–8. [Google Scholar] [CrossRef]
  23. Tahira, M. Acoustic resonance of the atmospheric at 3.7 mHz. J. Atmos. Sci. 1995, 52, 2670–2674. [Google Scholar] [CrossRef] [Green Version]
  24. Dow, J.M.; Neilan, R.E.; Rizos, C. The International GNSS Service in a changing landscape of Global Navigation Satellite Systems. J. Geod. 2009, 83, 191–198. [Google Scholar] [CrossRef]
  25. Liu, L.; Wan, W.; Chen, Y.; Le, H. Solar activity effects of the ionosphere: A brief review. Chin. Sci. Bull. 2011, 56, 1202–1211. [Google Scholar] [CrossRef] [Green Version]
  26. Kutiev, I.; Tsagouri, I.; Perrone, L.; Pancheva, D.; Mukhtarov, P.; Mikhailov, A.; Lastovicka, J.; Jakowski, N.; Buresova, D.; Blanch, E.; et al. Solar activity impact on the Earth’s upper atmosphere. J. Space Weather Space Clim. 2013, 3, 1–21. [Google Scholar] [CrossRef] [Green Version]
  27. Zolesi, B.; Cander, L.R. Ionospheric Prediction and Forecasting; Springer: New York, NY, USA, 2014. [Google Scholar]
  28. Schunk, R.; Nagy, A. Ionospheres: Physics, Plasma Physics and Chemistry, 2nd ed.; Cambridge University Press: Cambridge, UK, 2009. [Google Scholar]
  29. Tapping, K.F. The 10.7 cm solar radio flux (F10.7). Space Weather 2013, 11, 394–406. [Google Scholar] [CrossRef]
  30. Stone, E.; Frandsen, A.; Mewaldt, R.; Christian, E.R.; Margolies, D.; Ormes, J.F.; Snow, F. The Advanced Composition Explorer. Space Sci. Rev. 1998, 86, 1–22. [Google Scholar] [CrossRef]
  31. Covington, A.E.; Harvey, G.A. Impulsive and long-enduring sudden enhancements of solar radio emission at 10 centimeter wavelength. J. R. Astron. Soc. Can. 1958, 52, 161–166. [Google Scholar]
  32. Hathaway, D.H. The Solar Cycle; Springer Nature: Cham, Switzerland, 2010. [Google Scholar]
  33. Bartels, J.; Heck, N.H.; Johnston, H.F. The three-hour-range index measuring geomagnetic activity. J. Geophys. Res. 1939, 44, 411–454. [Google Scholar] [CrossRef]
  34. Thomsen, M.F. Why Kp is such a good measure of magnetospheric convection. Space Weather 2004, 2, 1–10. [Google Scholar] [CrossRef]
  35. Menvielle, M.; Berthelier, A. The K-derived planetary indices: Description and availability. Rev. Geophys. 1991, 29, 415–432. [Google Scholar] [CrossRef]
  36. Chapman, S.; Bartels, J. Geomagnetism; Oxford University Press: Oxford, UK, 1940. [Google Scholar]
  37. Klobuchar, J.A. Ionospheric corrections for timing applications. In Proceedings of the 20th Annual Precise Time and Time Interval (PTTI) Application and Planning Meeting, Vienna, Virginia, 7–9 December 1988; Naval Observatory: Washington, DC, USA, 1988; pp. 193–204. [Google Scholar]
  38. Kintner, P.M.; Ledvina, B. The ionosphere, radio navigation and global navigation satellite systems. Adv. Space. Res. 2005, 35, 788–811. [Google Scholar] [CrossRef]
  39. Petrovski, I.; Tsujii, T. Digital Satellite Navigation and Geophysics; Cambridge University Press: Cambridge, UK, 2012. [Google Scholar]
  40. Liu, J.Y.; Tsai, H.F.; Jung, T.K. The IGS VTEC maps: A reliable source of ionospheric information since 1998. J. Geod. 2009, 83, 263–275. [Google Scholar]
  41. Liu, J.Y.; Tsai, H.F.; Jung, T.K. Total Electron Content Obtained by Using the Global Positioning System. Terr. Atmos. Ocean Sci. 1996, 7, 107–117. [Google Scholar] [CrossRef]
  42. Kouba, J. A Guide to Using International GNSS Service (IGS) Products; IGS Central Bureau: Pasadena, CA, USA, 2009. [Google Scholar]
  43. Schaer, S. Mapping and Predicting the Earth’s Ionosphere Using the Global Positioning System; Institut für Geodäsie und Photogrammetrie, Eidg. Technische Hochschule Zürich: Zürich, Switzerland, 1999. [Google Scholar]
  44. Subirana, J.S.; Zornoza, J.M.J.; Hernandez-Pajares, M. GNSS Data Processing, Volume I: Fundamentals and Algorithms; ESA Communications: Noordwijk, The Netherlands, 2013. [Google Scholar]
  45. Dyrud, L.; Jovancevic, A.; Brown, A.; Wilson, D.; Ganguly, S. Ionospheric measurement with GPS: Receiver techniques and methods. Radio Sci. 2008, 43, 1–11. [Google Scholar] [CrossRef]
  46. Bonaccorso, A.; Bonforte, A.; Calvari, S.; Del Negro, C.; Di Grazia, G.; Ganci, G.; Neri, M.; Vicari, A.; Boschi, E. The initial phases of the 2008–2009 Mount Etna eruption: A multidisciplinary approach for hazard assessment. J. Geophys. Res. 2011, 116, B03203. [Google Scholar] [CrossRef] [Green Version]
  47. Spampinato, L.; Calvari, S.; Oppenheimer, C.; Boschi, E. Volcano surveillance using infrared cameras. Earth Sci. Rev. 2011, 106, 63–91. [Google Scholar] [CrossRef]
  48. Blackett, M. An overview of infrared remote sensing of volcanic activity. J. Imaging 2017, 3, 13. [Google Scholar] [CrossRef]
  49. Fisher, W.A.; Mozham, R.M.; Polcyn, F.; Landis, G.H. Infrared surveys of Hawaiian Volcanoes. Science 1964, 146, 733–742. [Google Scholar] [CrossRef]
  50. Gawarecki, S.J.; Lyon, R.J.P.; Nordberg, W. Infrared spectral returns and imagery of the Earth from space and their application to geological problems: Scientific experiments for manned orbital flight. Am. Astronaut. Soc. Sci. Technol. 1965, 4, 13–133. [Google Scholar]
  51. Harris, A.J.L. Thermal Remote Sensing of Active Volcanoes: A User’s Manual; Cambridge University Press: Cambridge, UK, 2013. [Google Scholar]
  52. Coppola, D.; Laiolo, M.; Cigolini, C.; Massimetti, F.; Donne, D.D.; Ripepe, M.; Arias, H.; Barsotti, S.; Parra, C.B.; Centeno, R.G.; et al. Thermal Remote Sensing for Global Volcano Monitoring: Experiences from the MIROVA system. Front. Earth Sci. 2020, 7, 1–21. [Google Scholar] [CrossRef] [Green Version]
  53. Ganci, G.; Vicari, A.; Fortuna, L.; Del Negro, C. The HOTSAT volcano monitoring system based on a combined use of SEVIRI and MODIS multispectral data. Ann. Geophys. 2011, 54, 544–550. [Google Scholar]
  54. Coppola, D.; Laiolo, M.; Cigolini, C.; Delle Donne, D.; Ripepe, M. Enhanced volcanic hot-spot detection using MODIS IR data: Results from the MIROVA system. Geol. Soc. Spec. Publ. 2016, 426, 181–205. [Google Scholar] [CrossRef]
  55. Coppola, D.; Laiolo, M.; Massimetti, F.; Cigolini, C. Monitoring endogenous growth of open-vent volcanoes by balancing thermal and SO2 emissions data derived from space. Sci. Rep. 2019, 9, 1–12. [Google Scholar] [CrossRef] [Green Version]
  56. Toller, G.N.; Isaacman, A.; Kuyper, J. MODIS Level 1B Product User’s Guide; Members of the MODIS Characterization Support Team for NASA/Goddard Space Flight Center: Greenbelt, MD, USA, 2009; pp. 1–57. [Google Scholar]
  57. MIROVA. A Collaborative Project between the Universities of Turin and Florence (Italy). 2020. Available online: http://www.mirovaweb.it (accessed on 13 January 2020).
  58. International GNSS Service (IGS). Access to Products. 2020. Available online: https://kb.igs.org/hc/en-us/articles/115003935351-Access-to-Products (accessed on 1 July 2020).
  59. NASA, Goddard Space Flight Center. Coordinated Data Analysis Web (CDAWeb). 2020. Available online: https://cdaweb.gsfc.nasa.gov/istp_public (accessed on 13 March 2020).
  60. Coppola, D.; Laiolo, M.; Piscopo, D.; Cigolini, C. Rheological control on the radiant density of active lava flows and domes. J. Volcanol. Geotherm. Res. 2013, 249, 39–48. [Google Scholar] [CrossRef]
  61. Gurtner, W.; Estey, L. RINEX: The Receiver Independent Exchange Format. V3.01; IGS Central Bureau: Pasadena, CA, USA, 2009; pp. 1–100. [Google Scholar]
  62. Krishna, S.G. GPS-TEC Analysis Software Version 2.9. 2017. Available online: http://seemala.blogspot.in/ (accessed on 21 March 2019).
  63. Ren, X.; Zhang, X.; Weiliang, X.; Zhang, K.; Yuan, Y.; Li, X. Global Ionospheric Modelling using Multi-GNSS: BeiDou, Galileo, GLONASS and GPS. Sci. Rep. 2016, 6, 1–11. [Google Scholar] [CrossRef] [Green Version]
  64. Brčić, D. A Model of Non-Specific Daily Pattern of the Satellite Positioning Signal Ionospheric Delay. Ph.D. Thesis, Faculty of Maritime Studies, University of Rijeka, Rijeka, Croatia, 30 April 2015. Available online: https://repository.pfri.uniri.hr/en/islandora/object/pfri%3A175 (accessed on 13 May 2020).
  65. Brčić, D.; Filjar, R.; Kos, S.; Valčić, M. On Global Ionospheric Maps based winter-time ionospheric delay with reference to the Klobuchar model: Case study of the Northern Adriatic. Pomorstvo 2019, 33, 210–221. [Google Scholar] [CrossRef]
  66. Astronomical Institute of the University of Berne, Center for Orbit Determination in Europe (AIUB CODE). Differential Code Bias IONEX DCB Files. 2020. Available online: Ftp://ftp.aiub.unibe.ch/CODE/ (accessed on 14 February 2019).
  67. Xiang, Y.; Yang, G. An Enhanced Mapping Function with Ionospheric Varying Height. Remote Sens. 2019, 11, 1497. [Google Scholar] [CrossRef] [Green Version]
  68. Otsuka, Y.; Suzuki, K.; Nakagawa, S.; Nishioka, M.; Shiokawa, K.; Tsugawa, T. GPS observations of medium-scale traveling ionospheric disturbances over Europe. Ann. Geophys. 2013, 31, 163–172. [Google Scholar] [CrossRef]
  69. Hunsucker, R. Atmospheric gravity waves generated in the high-latitude ionosphere: A review. Rev. Geophys. 1982, 20, 293–315. [Google Scholar] [CrossRef]
  70. Kaso, A. Computation of the normalized cross-correlation by fast Fourier transform. PLoS ONE 2018, 13, e0203434. [Google Scholar] [CrossRef] [PubMed]
  71. Goldblum, C.E.; Ritter, R.C.; Gillies, G.T. Using the fast Fourier transform to determine the period of a physical oscillator with precision. Rev. Sci. Instrum. 1988, 59, 778–782. [Google Scholar] [CrossRef]
  72. Brigham, E.O.; Morrow, R.E. The fast Fourier transform. IEEE Spectr. 1967, 4, 63–70. [Google Scholar] [CrossRef]
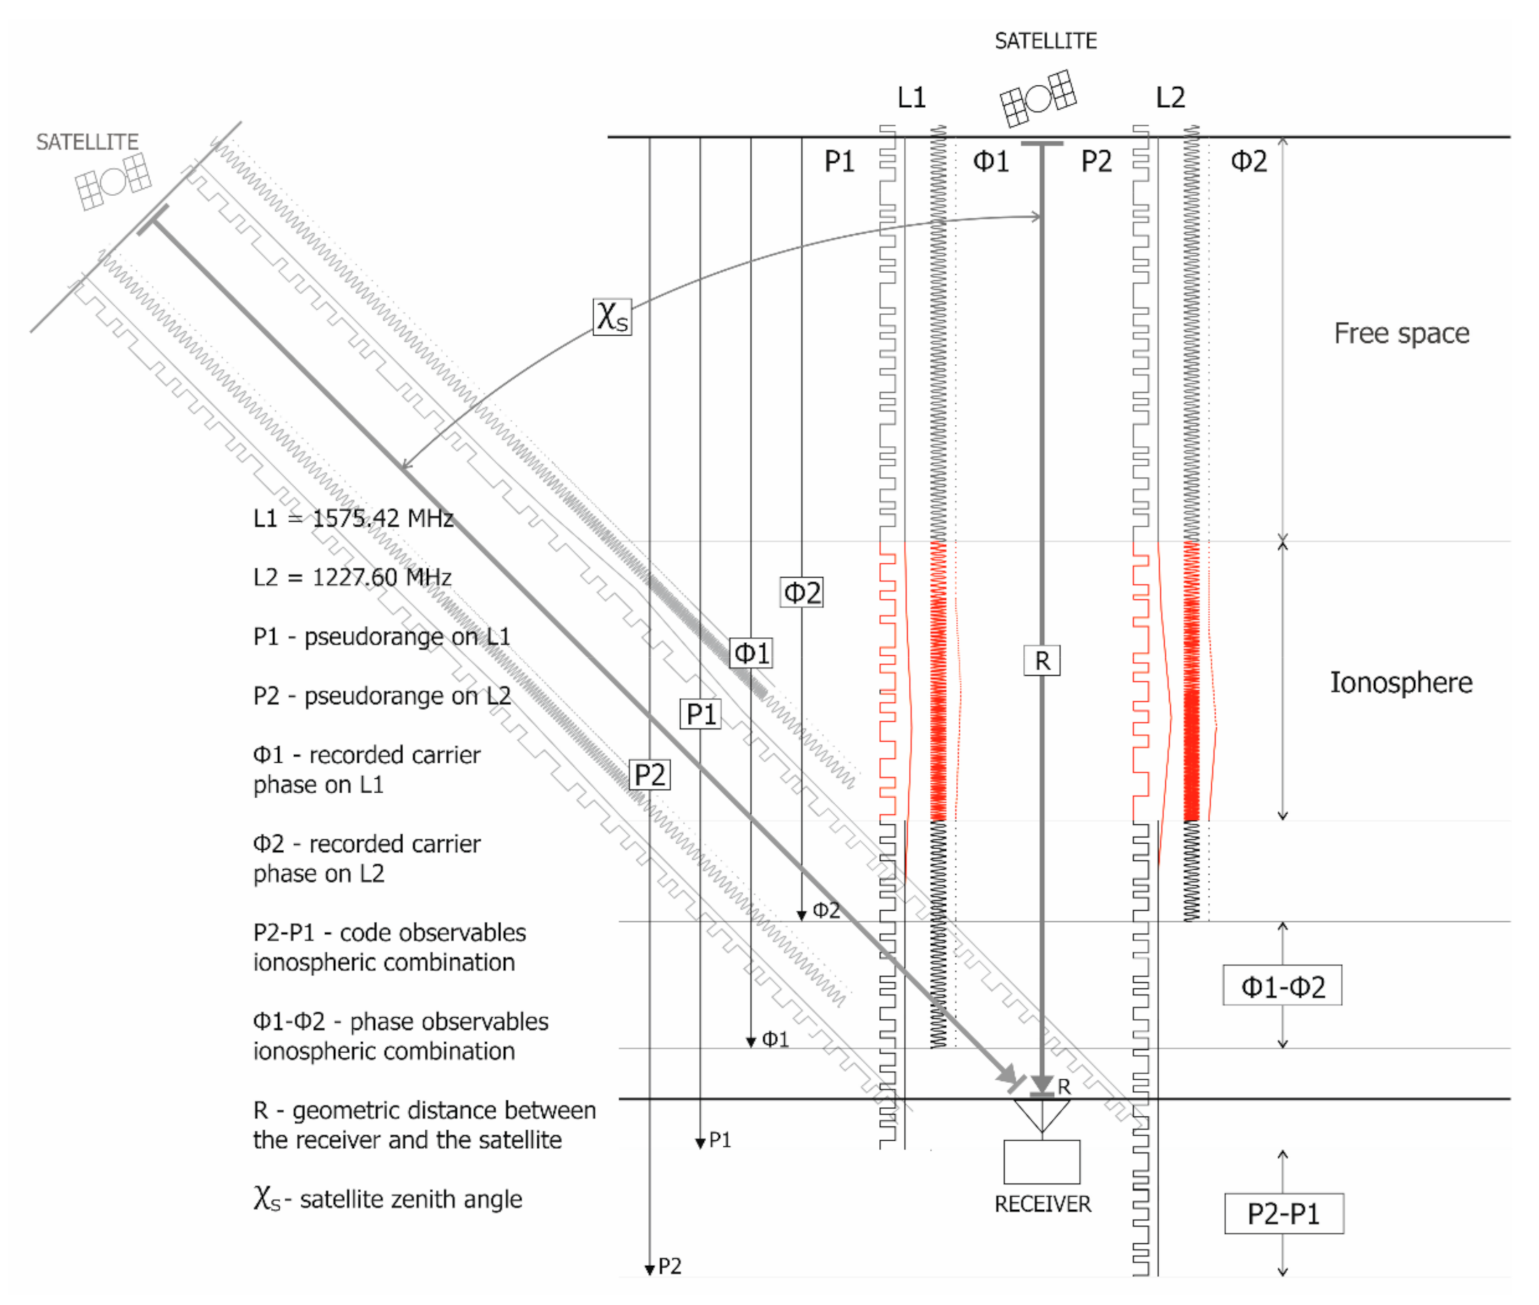
Figure 1. Total electron content (TEC) determination method based on ionospheric GPS dual-frequency combinations. Adapted and modified on the basis of [64,65].
Remotesensing 13 01006 g001
Figure 2. Solar activity expressed as 10.7 cm radio flux (blue) and mean daily ionospheric TEC values as calculated for IGS Noto (red) for the approximate period 2001 to 2018.
Remotesensing 13 01006 g002
Figure 3. Solar activity expressed as 10.7 cm radio flux (blue) and minimal night ionospheric TEC values at IGS Noto (red).
Remotesensing 13 01006 g003
Figure 4. Geographical positions of IGS Noto, IGS San Fernando and IGS Nicosia in relation to the location of Etna volcano.
Remotesensing 13 01006 g004
Figure 5. Mean values of minimal night TEC at IGS Noto for Criteria A (green), B (blue) and C (red). The vertical line denotes the day of volcanic activity increase. Mean +/− 1 standard deviation for respective criteria is added with dashed line of the same colour, and for Criteria C, mean +2 and +3 standard deviations are added as red dotted lines.
Remotesensing 13 01006 g005
Figure 6. Mean values of minimum night TEC at IGS Noto (y-axis) through index days (x-axis) for different daily increase in the volcanic radiative power (VRP) value: (a) 5%, (b) 15%, (c) 25%, (d) 35%, (e) 45% of daily VRP increase, respectively. Described TEC pattern is visible in all plots with slight differences, as discussed in text.
Remotesensing 13 01006 g006
Figure 7. Mean values of minimum night-time TEC at IGS San Fernando (a) and Nicosia (b).
Remotesensing 13 01006 g007
Figure 8. TEC patterns on IGS Noto, IGS San Fernando and IGS Nicosia during index days for the Criteria C. The vertical line denotes the day of defined volcanic activity increase (VAI).
Remotesensing 13 01006 g008
Figure 9. Median values of minimum night TEC at IGS Noto.
Remotesensing 13 01006 g009
Figure 10. Fast Fourier Transform of mean night TEC values during index days at IGS Noto.
Remotesensing 13 01006 g010
Figure 11. Minimal night TEC values distribution for IGS Noto, criteria C, for the day of VAI (a) and 5 days before VAI (b).
Remotesensing 13 01006 g011
Figure 12. Mean values of 10.7 cm solar flux (a), proton density (b), Kp index (c) and VRP (d) during index days for Criteria A (green), B (blue) and C (red).
Remotesensing 13 01006 g012
Figure 13. Comparison of minimum night TEC patterns for IGS Noto, IGS San Fernando and IGS Nicosia during non-active days (NAD).
Remotesensing 13 01006 g013
Figure 14. Normalised cross-correlation between VRP and TEC mean values for Criteria C, IGS Noto. The lag with maximum correlation value is equal to 5 days.
Remotesensing 13 01006 g014
Table 1. Volcanic radiative power (VRP) threshold values and number of corresponding days within analysed Middle InfraRed Observation of Volcanic Activity (MIROVA) dataset for three VRP threshold values and 5 different daily increases in VRP.
CriteriaVRP Threshold ValueNumber of Days that Satisfy Criteria with Daily VRP Increase
5%15%25%35%45%
A>1 × 10⁸ W445402350293226
B>4 × 10⁸ W260236201167121
C>8 × 10⁸ W17215613111178
Table 2. Statistical indicators of minimal night-time TEC values during all criteria (Crit) as calculated for IGS San Fernando (S), IGS Nicosia (NI) and IGS Noto (NO) for the whole dataset (All), the day of VAI and 5 days before VAI.
CritMeanMedianSt devMaxMin
Station SNINOSNINOSNINOSNINOSNINO
All-2.1122.0992.1392.1102.1102.1600.2320.2400.4413.3303.4804.5800.1200.1100.020
VAIA2.0972.0992.1422.0902.1102.1700.1910.2070.4923.0702.8103.7001.0501.0300.020
B2.1132.0972.1342.1002.1102.1700.2050.2160.5033.7002.8103.7001.0501.0300.020
C2.1222.0712.1402.1052.1102.1800.1470.2400.5012.6802.8103.7001.5701.0300.020
5 days before VAIA2.1022.0942.1612.1002.1002.1800.1540.2470.4382.6703.1203.3201.4800.2300.090
B2.1122.1002.1882.1002.1202.1950.1610.2930.4412.6703.1203.3201.6100.2300.090
C2.1132.0822.2432.1152.1202.2300.1630.2800.3462.6702.7703.3201.6100.2300.780
Table 3. Five-day lagged Pearson correlation coefficients between time-series of VRP and TEC for all locations, including whole datasets and defined criteria.
StationWhole SeriesCriteria ACriteria BCriteria C
5-day lagNoto0.0050.1810.2310.251
San Fernando−0.026−0.029−0.098−0.161
Nicosia−0.035−0.037−0.068−0.052
Publisher’s Note: MDPI stays neutral with regard to jurisdictional claims in published maps and institutional affiliations.