Abstract
Although ground-based synthetic aperture radar (GB-SAR) interferometry has a very high precision with respect to deformation monitoring, it is difficult to match the fan-shaped grid coordinates with the local topography in the geographical space because of the slant range projection imaging mode of the radar. To accurately identify the deformation target and its position, high-accuracy geocoding of the GB-SAR images must be performed to transform them from the two-dimensional plane coordinate system to the three-dimensional (3D) local coordinate system. To overcome difficulties of traditional methods with respect to the selection of control points in GB-SAR images in a complex scattering environment, a high-resolution digital surface model obtained by unmanned aerial vehicle (UAV) aerial photogrammetry was used to establish a high-accuracy GB-SAR coordinate transformation model. An accurate GB-SAR image geocoding method based on solution space search was proposed. Based on this method, three modules are used for geocoding: framework for the unification of coordinate elements, transformation model, and solution space search of the minimum Euclidean distance. By applying this method to the Laoguanjingtai landslide monitoring experiment on Hailuogou Glacier, a subpixel geocoding accuracy was realized. The effectiveness and accuracy of the proposed method were verified by contrastive analysis and error assessment. The method proposed in this study can be applied for accurate 3D interpretation and analysis of the spatiotemporal characteristic in GB-SAR deformation monitoring and should be popularized.
1. Introduction
Ground-based synthetic aperture radar (GB-SAR) interferometry is an active microwave remote sensing technology that was developed in the past two decades. GB-SAR interferometry can be used to image the radiation field of radar antenna with high spatiotemporal resolution, yielding single look complex (SLC) images of the target area in the two-dimensional (2D) plane radar coordinate system [1,2]. The emergence of GB-SAR interferometry technology is an important complementarity with spaceborne or airborne interferometric SAR (InSAR) technology, which greatly promotes the application of InSAR technology in the field of deformation monitoring [3]. Owing to the satellite revisit period and side looking angle of the sensor, monitoring with high spatiotemporal resolution on the surface of the local small area is difficult to achieve using traditional spaceborne SAR [3,4]. Compared with spaceborne SAR, GB-SAR can be used to establish specific geometry observation scene in accordance with the monitoring target. A minute- and submeter-level spatial–temporal monitoring resolution can be achieved by using a flexible baseline based on the monitoring needs [5,6,7]. In addition, a submillimeter-level precision can be reached with respect to the deformation measurement by interferometry, which compensates for the monitoring deficiencies of spaceborne InSAR and traditional geodetic monitoring technology, such as deficiencies in the spatiotemporal resolution and accuracy [2,8,9,10]. After years of development and practice, GB-SAR has been widely used for monitoring the motion of landslides [11,12,13,14,15,16,17], dams [18,19], side slopes [8,20,21], open-pit mining areas [22,23], and glaciers [24,25,26,27,28]. This method has good application prospects and research value in the industry.
As a new technology based on microwave interferometry, GB-SAR is mainly based on the stepped-frequency continuous wave (SFCW) [5,24], synthetic aperture and differential interferometry to obtain 2D high-precision displacement maps and high-precision deformation results. Specifically, GB-SAR uses SFCW technology to synthesize signals to improve range resolution and keep a high average transmit power at the same time. It uses synthetic aperture technology to improve azimuth resolution, and uses InSAR technology to compare the phase information of the target at different times, so as to calculate a small displacement change and obtain high accuracy deformation results. The data collected by GB-SAR system is a 2D image including range and azimuth resolution. Each pixel includes amplitude and phase information. The GB-SAR system can distinguish different monitoring targets mainly based on the slant range from the target to the radar center and the deflection angle from the target to the center of the radar antenna beam [29]. In contrast to the orthographic projection of traditional topographic maps and central projection used in photogrammetry, slant range projection in the radar 2D plane coordinate system is used as imaging mode of the GB-SAR. The spaceborne SAR satellite satisfies the far-field approximation conditions of the radar antenna, which can be regarded as SAR image data in a regular grid [30]. Due to the installation mode and antenna size limitations, the imaging distance of GB-SAR is relatively short (maximum distance: 5–10 km), and the target area is mainly in the near field of the radar antenna radiation field, which does not satisfy the far-field approximation conditions [3,11]. Therefore, a special fan-shaped grid coordinate system is used for GB-SAR images.
As the imaging methods and spatial geometric relations vary, the method used for the transformation of the GB-SAR image coordinate system significantly differs from traditional methods. Therefore, the most important task in GB-SAR image data processing and interpretation is to determine the actual position of the deformation according to the 2D plane coordinates of the radar. To address the gap with the real three-dimensional (3D) deformable body, researchers should directly interpret the 2D radar image or interferogram in the imaging mode based on their experience. Otherwise, recognition errors with respect to the deformation target or area could occur [19]. To correctly identify the deformation target and position and compare them with the results of other monitoring technologies or carry out fusion analysis, it is necessary to establish a high-accuracy coordinate system transformation model to accurately geocode the radar images in the 3D space system.
Methods that are commonly used for the transformation from the 2D plane coordinate system to the 3D local coordinate system of the GB-SAR image mainly include parameter transformation and coordinate coding [31,32,33,34]. Parameter transformation mainly includes direct transformation and similar transformation. However, owing to the specific geometric projection method of GB-SAR imaging, direct transformation will cause a large plane coordinate offset error when the elevation angle from the target to the radar center is large [29]. Based on similar transformation, the transformation parameters are calculated by using a limited number of reference points. A certain transformation accuracy can be achieved in the area with a small change in the terrain slope, but it is difficult to achieve a holistic high accuracy because of the imprecise transformation model [34]. The coordinate coding method is relatively rigorous, but it also has several deficiencies. On one hand, it strongly relies on the accuracy and integrity of external auxiliary data such as the digital surface model (DSM) and digital elevation model (DEM). If 3D auxiliary data in the monitoring area are missing, it is difficult to match the 3D information based on coordinate coding using the corresponding pixels [35]. On the other hand, the accuracy of the coordinate coding method depends on the selection of control points and the quality of the positioning. In practical work, artificial corner reflectors (CRs) are generally installed as control points and their positions in the 3D coordinate system are measured [9]. However, it is difficult to distinguish these control points in areas with dense rocks or buildings with strong and complex scattering of ground features, such as glaciers covered by moraines, landslides with surface debris, and mining areas with large ore accumulation. In addition, if the control point is far from the radar center, the azimuth resolution of the pixel increases, and also the side lobe plays a role. Therefore, it is difficult to accurately locate the positions of the CRs in the radar image. Thus, accurate geocoding based on GB-SAR cannot be realized in practice because of the shortcomings of the coordinate transformation methods.
Therefore, in this study, unmanned aerial vehicle (UAV) photogrammetry data, which are widely used in the surveying and mapping industry, were utilized for GB-SAR coordinate transformation as the first consideration to realize high-accuracy geocoding. The digital orthophoto map (DOM) and DSM that were obtained based on the use of UAV aerial photogrammetry data have a high precision and integrity, and thus, effectively compensate for the lack of 3D data based on visual field limitations with respect to ground-based 3D laser scanning and close-range photogrammetry. In addition, the ground photo control points (PCPs) laid out for UAV photogrammetry can be combined with the GB-SAR deployment location, and the coordinates of the points and radar rail azimuth angle can be accurately measured by using the global navigation satellite system (GNSS) or total station. This method can effectively avoid the defects of inaccurate coordinates measurement by using CRs as ground control points (GCPs). With the help of external auxiliary data, an accurate GB-SAR geocoding model was established in this study based on searching the solution space. This model was applied for the monitoring of the Laoguanjingtai (LGJT) landslide that occurred on the Hailuogou Glacier, China. A subpixel level geocoding accuracy was achieved, and the effectiveness and accuracy of the model were verified. The method proposed in this paper can be applied for accurate 3D interpretation and spatiotemporal analysis in GB-SAR deformation monitoring and should be popularized.
2. Materials and Methods
2.1. Dataset
The following data were used in this study.
- GB-SAR original observation dataset. Obtained by GB-SAR by continuous monitoring under specific observation geometry conditions. The azimuth resolution was 2–5 mrad, the maximum range resolution was 0.5 m, and the deformation monitoring accuracy was at the submillimeter level. This was the main dataset used for geocoding in this paper.
- Ground control survey dataset. The azimuth angle of the GB-SAR guide rail was measured by the GNSS or total station and the radar center was combined with ground PCPs in the survey area. The coordinate and angle measurement accuracies reached the centimeter and 0.5 s level, respectively, fully meeting the requirements of GB-SAR coordinate transformation [33,36]. After the measurement, the location point of GB-SAR became the link between the radar and 3D coordinate systems. This dataset was mainly used for the transformation between the two coordinate systems.
- External ancillary 3D information. These data were obtained from aerial photogrammetry or light detection and ranging (LiDAR) carried on UAV. Due to the data gap caused by the shadow of sight, several transformation defects occur during ground-based 3D laser scanning. In this study, UAV aerial photogrammetry technology was used to collect high-resolution images of the monitored area. The PCPs were arranged on the ground to obtain external auxiliary data such as DSM, DOM, and 3D real-scene model (five-lens oblique photogrammetry) using a local unified coordinate system. These data were mainly used to realize the solution space search for geocoding transformation.
The related parameters of the above datasets are shown in Table 1.

Table 1.
Available equipment and related indicators of datasets.
2.2. Solution Space Search Geocoding Model
For accurate geocoding from the 2D radar plane coordinate system of the GB-SAR to the 3D local coordinate system, accurate deployment data of the GB-SAR are required, including the center coordinates of the radar sensor and azimuth angle of the radar guide rail, which are used as a link to realize the unification of the two coordinate systems. For geocoding, with the help of high-precision external elevation data such as DSM, DEM, and 3D terrain point cloud data, the Euclidean distance between the radar center and the ground point is calculated by using MATLAB software programming, and the minimum Euclidean distance is searched and matched with the corresponding azimuth distance in the radar image coordinate system. The geocoding method used in this study mainly included the following parts.
2.2.1. Unified Coordinate System Frame of Each Element
To realize high-accuracy GB-SAR image geocoding, the position and orientation of each coordinate element in the target coordinate system should be accurately determined using the GNSS or total station. The element survey mainly includes the measurement of PCPs and the precise measurement of the GB-SAR location point. Based on the specific requirements of actual work, the target coordinate system also has a certain particularity and independence. By measuring the PCPs, the UAV photogrammetry results can be unified to the target coordinate system and can be used as the basic supporting data for subsequent coordinate transformation. Further, based on the joint measurement with GCPs, the coordinates of the GB-SAR center point and azimuth angle of the radar guide rail can be accurately measured. The azimuth angle can also be calculated by measuring the center coordinates of the positioning screw of the observation pier when the GB-SAR system is set up. After the above-mentioned elements are unified in the target coordinate system, the coordinate transformation model can be established.
2.2.2. Coordinate Transformation Model
Owing to the fan-shaped projection mode of GB-SAR imaging, its range resolution is fixed and the azimuth resolution decreases with increasing observation distance. In addition, the GB-SAR projection mode is slant range projection, therefore, there is a certain angle between the imaging projection plane and horizontal plane, which leads to a scale inconsistency of the same ground feature in the two coordinate systems. If the terrain elevation significantly changes, the coordinate offset will be aggravated [1]. As shown in Figure 1, in the radar coordinate system G-XY, “a,” “b,” and “c” are three ground feature points, which have the same distance from the radar center. However, in the 3D local coordinate system O-ENZ, the radar line of sight (LOS) angle and ground feature elevation differ and the coordinate projection can be Na, Nb, and Nc, respectively. The figure shows that the LOS to the horizontal direction is closer and the coordinate offset is smaller. The larger the elevation difference between the ground object and radar center is, the larger is the projection deviation. This is the error source of the parameter transformation method, which explains why it is difficult to accurately transform the coordinates.
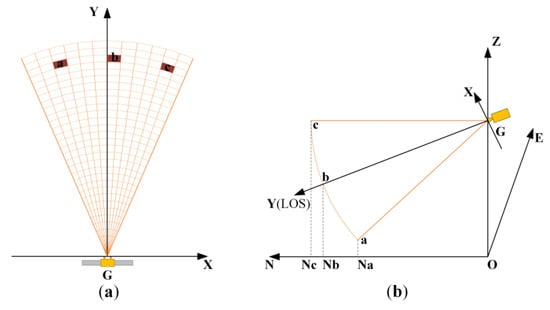
Figure 1.
Schematic diagram of ground-based synthetic aperture radar (GB-SAR) coordinate offset. (a) Three feature points with equal distance from the center of GB-SAR in the radar coordinate system; (b) the north direction projection offset of the three pixels in the three-dimensional (3D) local coordinate system.
After determining the error source, the basic principle of radar imaging is used as the starting point, that is, independent of the coordinate system, the Euclidean distance from the feature point to the GB-SAR center is equal. Based on the assumption that the coordinate of feature point P in the radar coordinate system G-XY is , the distance can be expressed as follows:
where represents the distance from point P to the radar center point G and is the deflection angle from point P to the radar center line direction. Due to the limited scanning angle of GB-SAR, the angle is generally within the range of ± 50°. Under real conditions, the range can be limited to reduce the calculation amount and improve the transformation efficiency (e.g., ).
Based on the assumption that the coordinate of the ground feature point P in the 3D local coordinate system O-ENZ is and the coordinate of the GB-SAR center point G is , the feature point P can be expressed as follows:
where is the Euclidean distance from the ground feature point P to the radar center point G and is the horizontal plane projection quadrant angle of GP.
After establishing the corresponding distance and angle information of the ground feature points in two coordinate systems, it is necessary to further match the angle relationship based on the equal distance, establish a set of connection equations, and provide a mathematical foundation for the searching and matching of the distance solution space. As the orientation of the radar LOS (Y-axis direction) differs from the north direction (N-axis direction) of the 3D local coordinate system, it is necessary to determine the relationships among the coordinate axes when setting up the GB-SAR system. Figure 2 shows the relationships between the 2D image coordinate system and local plane coordinate system of GB-SAR for different orientations. The parameter is the horizontal rotation angle of the two coordinate systems, which can be calculated by using common points. During actual monitoring, the CRs are usually arranged and measured in the 3D coordinate system and the corresponding points in the radar images are identified and calculated [19]. Although the method is easy to operate, it has several disadvantages such as a poor recognition of the reflected echo, low resolution, and strong dependence on manual interpretation. Therefore, it is difficult to accurately calculate the horizontal angle.
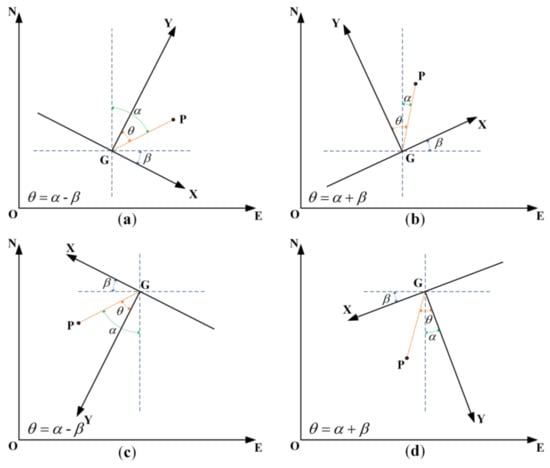
Figure 2.
Diagram of the relationship between the angle of the coordinate axis and orientation of the GB-SAR. The Y-axis represents the line of sight direction of the GB-SAR. (a,c) Relational expression when the line of sight of the GB-SAR is directed toward the first and third quadrant, respectively. (b,d) Relational expression when the line of sight of the GB-SAR is directed toward the second and fourth quadrant, respectively. The horizontal rotation angle of axes is scalar, and are vectors, and the values should be positive and negative.
In this paper, precise engineering measurement was used as global control measurement to measure the GB-SAR center and azimuth of the guide rail. The results were combined with the UAV photogrammetry PCPs or regional control network in the whole region. The coordinates of the GB-SAR center in the 3D local coordinate system and the horizontal angle of the two coordinate axes can be accurately solved. The coordinate precision reached the mm level and the angle measurement precision was 0.5”, meeting the requirements of an accurate coordinate transformation of GB-SAR.
Based on determining the above-mentioned axes relationships, the following coordinate transformation equations can be obtained.
That is,
The overall relationship is changed into the process of obtaining the corresponding pixel in the local 3D coordinate system according to pixel in the 2D radar coordinate system. The sign “±” in the coordinate axis angle relationship equation is based on the GB-SAR orientation quadrant in the 3D local coordinate system, as shown in Figure 2.
2.2.3. Geocoding Based on Solution Space Search
It is not difficult to identify the rank defect of the above-mentioned equations, but it is difficult to solve massive transformation data using traditional methods (e.g., the full search and iterative method). With the help of computing power, we can identify the radar coordinate pixel P corresponding to local 3D coordinates by searching the solution space using the minimum Euclidean distance criterion.
The main ideas are as follows: first, the azimuth angle and range resolutions of the transformation model are set according to the actual monitoring resolution requirements of the project. As the GB-SAR resolution (range resolution: ≈0.5 m, azimuth resolution: ≈4 mrad) is lower than the DSM grid resolution (reaching the cm level) of the UAV photogrammetry results, GB-SAR is generally oversampled or the DSM is downsampled to adapt to the fixed grid resolution. After the processing, speckle noise interferences can be reduced to a certain extent, and the subsequent matching is smoother. The range set and quadrant angle set from each pixel center to the radar center in the DSM and the range set and deflection angle set from each pixel to the radar origin in GB-SAR coordinate system are calculated according to the grid size. Finally, based on azimuth angle matching, the minimum Euclidian distance principle is adopted to match the distances in this direction and the pixels of the range matching in the 2D radar coordinate system are assigned to the corresponding coordinates in the local 3D coordinate system for geocoding.
In addition, to reduce the search workload and improve the matching accuracy, the search scope and range elimination threshold can be set according to the actual GB-SAR observation system and local geographic conditions. If there is no effective distance matching value in the azimuth direction, the range solution is further searched within the scope of the search threshold set in the azimuth direction of the point. The principle of the coordinate search and match method is shown in Figure 3. To accurately calculate the coordinate value in the local 3D coordinate system corresponding to the pixel in the radar image coordinate system, we can determine the 3D topographic profile of the DSM corresponding to the pixel P of the radar based on the unified coordinate frame and through the matching of angular geometric relations among , , and . The distance between the radar sensor center and DSM pixel in the topographic profile is matched sequentially, and the minimum value of the distance within the search threshold is obtained as the optimal solution.
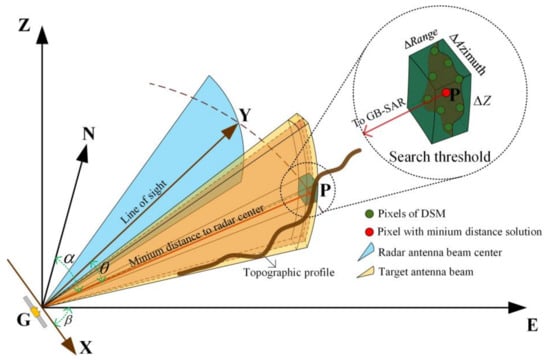
Figure 3.
Schematic diagram of the solution space search. The main figure shows the geometric positional relationship of the GB-SAR in the radar 2D plane coordinate system (XY) and local 3D coordinate system (ENZ). The red line in the figure indicates the minimum Euclidean distance matching solution between the ground target point P and radar sensor center in the topographic profile in the beam direction. The inset in the upper right corner (enlarged picture in the circle) shows the schematic diagram of the solution space search threshold. The ; , and are the range, azimuth, and elevation search thresholds, respectively. The search threshold can be customized according to the actual monitoring needs and the distance matching solutions beyond this scope will be eliminated.
The setting of the search threshold is shown in the inset in Figure 3. The , , and are the range, azimuth, and elevation search thresholds, respectively. The search threshold can be customized according to the actual monitoring needs and distance matching solutions beyond the scope will be eliminated. In general monitoring cases, and should be compatible with the grid resolution of the radar or DSM to unify the order of magnitude. To achieve a comprehensive spatial search of the distance solution, can be defaulted to be the entire topographic profile elevation range, that is, to search and match all DSM elevation points in the beam direction of the radar antenna. The pixel points corresponding to the minimum Euclidian distance from the center of the GB-SAR sensor are selected as the optimal matching points. Based on this method, all radar image pixels are searched and matched sequentially to realize the highly accurate geocoding of the GB-SAR images. The flowchart of the GB-SAR geocoding method based on solution space search is shown in Figure 4.
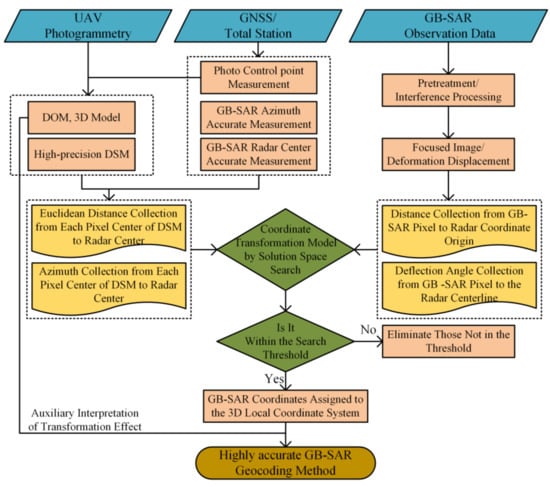
Figure 4.
Flowchart of the GB-SAR geocoding method based on solution space search.
2.3. Method of Geocoding Accuracy Assessment
For the effectiveness of geocoding results, we used the method of contrastive interpretation to analyze and evaluate. Combined with the high-precision DOM and 3D model produced by UAV photogrammetry, we interpreted and analyzed the geocoding situation of pixels in uncoded region, obvious deformation region and invisible region, and compared it with the actual geographical environment to determine whether it is consistent with the radar imaging mechanism and the actual situation, so as to evaluate the correctness of the geocoding results and verify whether the method is effective.
On the basis of the effectiveness of the method, we further assessed the logical accuracy of the geocoding results. The coordinate components of pixels geocoded in the 3D local coordinate system O-ENZ were reprojected into the corresponding GB-SAR image coordinate system G-XY to obtain the distribution of E, N and Z coordinate components, and check whether the plane component E and N are smoothly distributed, and whether the elevation component Z is consistent with the DSM distribution. If the plane components have a mutation or the elevation component does not match the actual DSM distribution, it means that there is a logical error in the process of solution space search and matching, otherwise, the geocoding result is logically accurate.
Finally, we calculated the geocoding error and assessed its accuracy quantitatively. The accuracy index of geocoding includes range error and azimuth error. The basic method is to make differential between the corresponding pixel after geocoding in the local 3D coordinate system and the pixel P in the original GB-SAR coordinate system, and calculate the range error and azimuth error of each pixel, so as to realize the quantitative assessment of the accuracy index of each pixel. Then, the accuracy indicators of all pixels were counted to assess the overall accuracy of geocoding. The error can be expressed as follows:
where is the range error, is the azimuth error, is the distance from the pixel in the local 3D coordinate system to the radar center G, and is the corresponding quadrant angle of pixel in the 3D coordinate system.
3. Experiments
3.1. Overview of the Study Area
To verify the effectiveness and accuracy of the proposed method, we used it to monitor the LGJT landslide in the Hailuogou Glacier area, Mountain Gongga, Sichuan Province, China. Mountain Gongga is located in the southeastern Qinghai–Tibet Plateau. It is the highest peak of the Hengduan Mountains, with an elevation of 7556 m. There are 74 glaciers around the main peak. The largest glacier is the Hailuogou Glacier on the eastern slope, which is ≈13 km long, 250–1200 m wide, and covers an area of 24.7 km2 [37]. It is the most famous glacier in this area, and also a national scenic spot in China, which is visited by many tourists throughout the year. The Hailuogou Glacier is a typical monsoon temperate glacier. Due to the influence of the monsoon and topography, the annual rainfall at the end of glacier tongue above an elevation of 3000 m is 1956 mm and the average number of annual precipitation days is 251 d. Recent observations showed that the glaciers in Hailuogou Valley are notably shrinking. From 1966 to 2008, the glacier receded by ≈728 m (average rate of ≈17.3 m/a). The average surface thinning of the glacier ablation area is 33.9 m (average thinning rate of ≈1.8 m/a). The area near the glacier tongue exhibits the fastest thinning rate of up to 4.3 m/a [24]. The study area is shown in Figure 5.
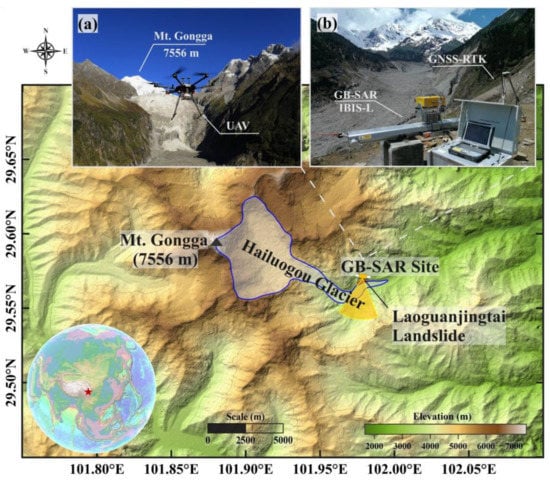
Figure 5.
Main map of the study area shows the relationship between the GB-SAR monitoring station and Hailuogou Glacier and the red spot in the picture indicates the Laoguanjingtai (LGJT) landslide. (a) Five-lens oblique photogrammetric unmanned aerial vehicle (UAV) used to obtain external ancillary data such as the digital surface model (DSM) and digital orthophoto map (DOM). (b) Location of the GB-SAR monitoring station. The LGJT landslide is directly below the station and the Hailuogou Glacier can be seen in the foreground. This station has a good visibility and jointly monitors the landslide and glacier.
The degradation and thinning of the Hailuogou Glacier caused a large number of secondary landslide hazards in the surrounding mountains among which the LGJT landslide was the most representative one. The LGJT landslide occurred beneath the observation platform of the terminal moraine dam of the Hailuogou Glacier, with an area of ≈1.07 × 10⁵ m2, an elevation distribution of ≈3050–3250 m. A tourist footpath leads from the observation platform to the glacier surface. The average slope of the landslide was as high as 80%, and the drop was large. In recent years, as the thinning movement of the glacier intensified, several large slips occurred. The LGJT landslide posed a great risk to the lives of tourists in the scenic area, as shown in Figure 6. Therefore, continuous and effective landslide monitoring should be carried out to ensure the tourists’ safety and normal operation of the Hailuogou scenic spot.
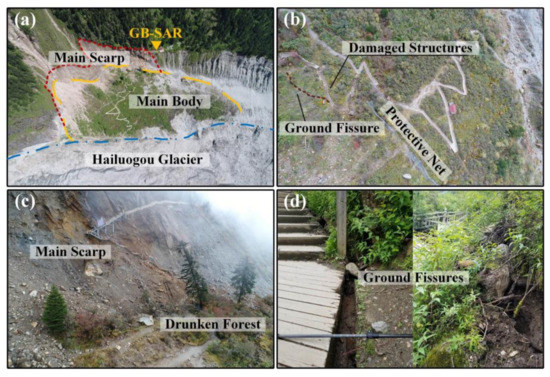
Figure 6.
LGJT landslide on the Hailuogou Glacier. (a) Overview of LGJT landslide. The main scarp that formed by the separation of the rear edge of the landslide’s main body from the mountain mass is very prominent. The front edge of the landslide body is tangent to the Hailuogou Glacier and local collapse is notable. (b) Detailed landslide surface structures can be observed such as partially damaged footpaths, the rockfall protection net, and ground fissures. (c) Details of the main scarp and rear edge of the main body. The altitude difference of the main scarp is >50 m, which causes the trees below to seriously incline and appearance of the unique phenomenon of a drunken forest in the landslide movement. (d) Ground fissures on the surface of the landslide; the fissure width generally ranges from 15 to 30 cm.
To accurately determine the movement and mechanism of the LGJT landslide, both the landslide and tangent glacier must be monitored. After the field investigation, we finally emplaced the GB-SAR system in a stable area in the northeast of the landslide, as shown in Figure 5b. The site conditions were mainly based on the following considerations: elevation of 3195 m, that is, higher than the top of the main body of the landslide; good visibility; joint monitoring of the landslide mass and glacier at its lower edge. The observation platform service station was ≈20 m away from the GB-SAR station, providing stable power and network coverage for long-term monitoring.
3.2. Dataset Acquisition
To implement the method proposed in this study, a high-accuracy and high-resolution DSM for the whole monitoring area should be obtained to accurately geocode the pixels in the GB-SAR radar coordinate system into the 3D local coordinate system. In this paper, the DJI M600 Pro six-rotor flight platform equipped with a Rainpoo DG3 aerial camera (Chengdu Rainpoo Technology Co., Ltd.; Chengdu, China; www.rainpoo.com, accessed on 1 February 2021) was used to collect aerial images covering the middle and lower parts of the Hailuogou Glacier and the slopes around the glacier, as shown in Figure 5a. The longitudinal overlap of the collected image set was 80%, the lateral overlap was 60%. The coverage area was ≈4.5 km2, and the average ground resolution of the images was 3 cm. Prior to the photogrammetry, we set up several PCPs on the surface of the landslide and glacier and four GCPs as datum points in the stable areas next to the GB-SAR and far away from the landslide, respectively. The 3D coordinates of the PCPs were collected using GNSS-RTK; the coordinate acquisition accuracy reached the cm level [38,39]. Finally, the PCPs and photogrammetry image set were joint calculated by GodWork v.1.0 software (www.uavmap.cn, accessed on 20 January 2021). After image preprocessing, aerial triangulation, point cloud editing, and other processes, the high-accuracy and high-resolution DSM and DOM of the target 3D coordinate system were obtained. The DSM grid resolution of this experiment was 5 cm.
In terms of GB-SAR data acquisition, the IBIS-L GB-SAR system developed by the Ingegneria Dei Sistemi (IDS) corporation of Italy was adopted as the monitoring instrument in this study. The radar system was composed of a sensor unit, linear slide rail, control unit, and power supply unit. Based on the principle of spaceborne SAR interferometry, SFCW technology was introduced to overcome low resolution of spaceborne SAR [40]. The system platform was installed on the ground and the sensor periodically obtained monitoring data based on a nearly zero spatial baseline on a fixed linear sliding rail. The sampling frequency was less than 2 min, which solved the problem of temporal and spatial decorrelation that may be caused by spaceborne SAR [7,15,41,42]. Based on the above-mentioned characteristics and the advantages of a small volume, flexible layout, and noncontact measurement method, personnel did not need to enter the target monitoring area. This ensured the safety of the personnel and prevented any disturbance of the deformation body. In conclusion, the IBIS-L GB-SAR system has a great advantage in landslide monitoring.
Before the continuous GB-SAR observation, we used the total station Leica TS02 Plus (www.leica-geosystems.com, accessed on 1 February 2021) to accurately measure the 3D coordinates of the radar guide rail and its azimuth angle, installed a reflection prism at the fixed bolts of the guide rail, and measured the 3D coordinates of the prism center. The angle measurement accuracy was 2” and the ranging accuracy was 1.5 mm + 2 ppm, with a high measurement accuracy. The GNSS-RTK was used to measure the PCPs and GCPs on the surface of the landslide, glacier, and in the stable zone. The coordinates of the radar center point G in the 3D local coordinate system O-ENZ (independent rectangular coordinate system) were obtained based on the arithmetic average of repeated measurements. The coordinates of the radar center point G in this experiment were 498,358.612 m, 3,272,392.383 m, and 3195.448 m and those of the azimuth were 285°42’15.47” (from left to right of the rail) and 105°42’15.47” (from right to left of the rail). The horizontal rotation angle of two axes is 15°42’15.47” (angle in Figure 2).
After the center coordinates of the GB-SAR were determined, the LGJT landslide could be continuously monitored using the GB-SAR system. At a sampling interval of 10 min, a total of 4288 GB-SAR images were acquired from May 20 to June 20, 2018, with a range resolution of 0.75 m and azimuth resolution of 4.38 mrad.
3.3. Data Processing
3.3.1. DSM and DOM Processing
The magnitudes of the GB-SAR radar image and DSM resolutions significantly differ. Combined with the actual requirement of monitoring, we downsampled the DSM and resampled the grid resolution from 5 cm to 0.5 m, representing the same magnitude level as the GB-SAR image resolution. The DSM obtained after downsampling is shown in Figure 7a. The boundary of the LGJT landslide is marked by a red line. Its elevation is ≈3050–3250 m, with a large drop height. In addition, we overlayed the DOM on the DSM to determine the land coverage and obtain information about the geographic environment. After the coordinate frame was unified, the GB-SAR center point and its orientation were marked. The relative position of the radar coordinate system in the 3D local coordinate system is shown in Figure 7b.
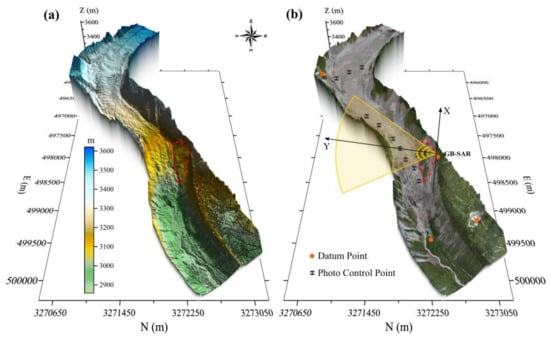
Figure 7.
(a) DSM of the Hailuogou Glacier and its surrounding side slopes. The red dot indicates the LGJT landslide with an elevation of 3050–3250 m. (b) DOM superimposed on the DSM. The positional relationship between the radar 2D plane coordinate system and 3D local coordinate system is indicated.
3.3.2. GB-SAR Image Processing
Each IBIS-L acquisition produces a focused image made of an N×M complex matrix, where N and M values depend on the radar configuration and on focusing parameters specified by the user in the IBISDV v.03.04.005 software (www.idsgeoradar.com, accessed on 1 February 2021). In the data processing of this experiment, N and M correspond to the field distance of 500 and 2000 m, respectively. The average power, coherence coefficient, phase stability, and estimated signal-to-noise ratio (SNR) distribution of the radar image in the study region after processing are shown in Figure 8. The interpretation and analysis of the various quality indicators of the radar image show that the surface of the glacier has a high overall reflection intensity due to the rocks and moraines (Figure 8a). The sampling interval of 10 min ensures the high coherence in the whole region (Figure 8b). Figure 8c shows that the phase stability is better in the area with higher reflection intensity. Based on the DOM ancillary identification in this area, this stability is related to the backscattering characteristics of moraines (rocks) covered by the surface of the Hailuogou Glacier. Almost no movement can be detected at the exposed bedrock (glacial polish) on the south side of the U-shaped glacier valley and the radar backscattering is stable; therefore, the SNR is the highest, as shown in Figure 8d.
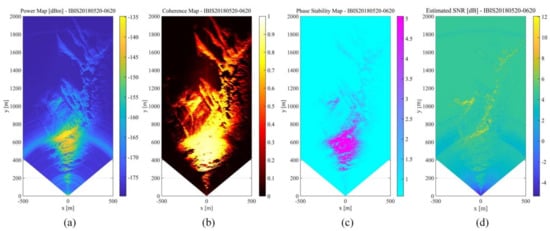
Figure 8.
GB-SAR imaging quality index. (a) Average power map. (b) Coherence coefficient map. (c) Phase stability map. (d) Estimated signal-to-noise ratio (SNR) map.
After focusing, we carried out GB-SAR data processing on the 4288 SLC images using the interference stacking method by IBISDV software. Considering the high humidity in the valley of Hailuogou Glacier terminal, especially the rainy and foggy in summer, in order to improve the accuracy of radar interferometry, the atmospheric delay was estimated and corrected by selecting the stable target point as the GCPs. This processing relied on the stability of the GCPs. If the scatterer with a large deformation was selected, a part of the low-frequency component in the monitored displacement signal would be regarded as the atmosphere and filtered. In this experiment, the stable bedrock on the south side of Hailuogou U-shaped valley with high SNR was selected as the control point to participate in the correction of atmospheric phase [43,44], and obtained the cumulative displacement map of the entire study area, as shown in Figure 9. Figure 9 shows that the area near the radar center point shows a positive value (i.e., the movement direction is far away from the radar LOS) and the glacier long-range perspective area shows a negative value (i.e., the movement direction is close to the radar LOS) during the monitoring period, which is consistent with the downward flow of the glacier and the landslide movement away from the GB-SAR station.
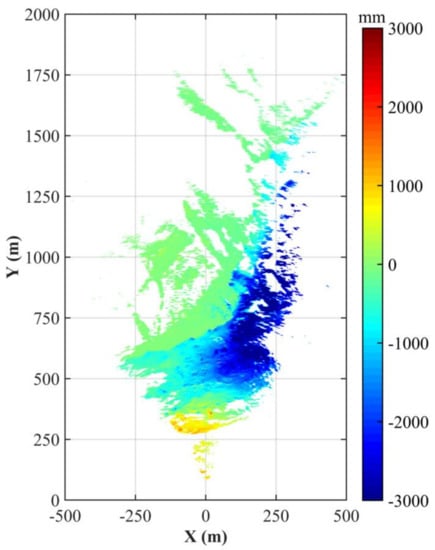
Figure 9.
GB-SAR cumulative displacement distribution from 20 May 2018, 12:07:38 p.m. to 20 June 2018, 12:01:49 p.m. The negative displacement reflects movement towards the sensor along the line of sight (LOS) direction and the positive displacement represents movement away from the sensor.
4. Results
Based on the above-mentioned preliminary processing, we can roughly judge the movement trends of the landslide and glacier at the lower edge. However, we cannot precisely analyze the monitoring area, that is, we cannot effectively determine the specific point position corresponding to each pixel in the radar image. It is difficult to distinguish the boundary between the landslide and glacier and analyze their motion coupling relationship. Therefore, accurate geocoding based on the method proposed in this study is required.
As mentioned above, using MATLAB software programming based on the Formula (1)–(4), we calculated the range set and quadrant angle set from each pixel center to the radar center in the DSM and the range set and deflection angle set from each pixel to the radar origin in the GB-SAR coordinate system according to the grid size. Based on azimuth angle matching, the minimum Euclidian distance principle was adopted to sequentially match the distances in this direction. The pixels of the range matching in the radar 2D coordinate system were assigned to the corresponding coordinates in the local 3D coordinate system for geocoding. In addition, we reduced the workload of the solution space search and improved the matching accuracy by setting search range and distance elimination thresholds. In this study, the DSM resolution was 0.5 m. Therefore, we set the angle matching accuracy to ± 0.05° (i.e., ≈1 km from the GB-SAR center point, the azimuth resolution was consistent with the DSM grid size). The range elimination threshold was set to ±0.5 m. The pixels exceeding the distance threshold were not geocoded in the 3D local coordinate system to ensure that the geocoding accuracy of the entire region was at the subpixel level.
The cumulative displacement map of GB-SAR after searching the solution space is shown in Figure 10. Figure 10 shows that the distribution of cumulative displacement map before and after geocoding is consistent, and there is no mutation. Combined with the ancillary interpretation of the 3D terrain model, the zero boundary of the accumulative displacement coincides with the boundary of the glacier bedrock’s polished surface with high SNR. The boundary between the bedrock and glacier is notable, which is consistent with the local geographic environment. A good geocoding effect was achieved, as shown in Figure 10a. The pixels in the area outside the DSM were eliminated because the minimum Euclidian distance solution space search exceeded the set threshold (Figure 10b). Thus, this method is only applicable if the target monitoring area has an external ancillary data coverage. Based on the different accuracies of the geographic dataset, external ancillary data that can be used to calculate the distance and azimuth values include but are not limited to the DSM, DEM, digital terrain model (DTM), digital line graphic (DLG) with contour, and point cloud generated by 3D laser scanning or a LiDAR system.
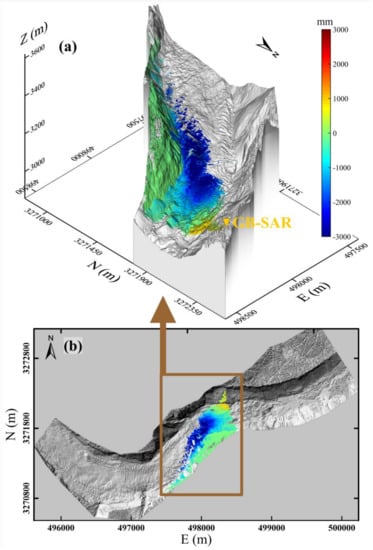
Figure 10.
Geocoding result of the GB-SAR cumulative displacement. (a) Based on the superimposition on the GB-SAR cumulative displacement geocoding result of the 3D terrain model, the displacement value of the polished surface of the bedrock on the southern slope of the glacier is almost zero and the boundary is notable, which is consistent with the local geographic environment. (b) Distribution map of the GB-SAR result geocoded to the DSM. The area outside the DSM cannot be effectively geocoded because the distance cannot be calculated. The method proposed in this paper must be supported by 3D ancillary data in the target monitoring area, such as DSM and DEM data.
5. Discussion
5.1. Discussion on GB-SAR Geocoding Results
The surface of Hailuogou Glacier is covered by massive moraine rocks. It has strong backscattering characteristics and a high average reflection intensity. It is difficult to effectively identify and measure the radar images using the traditional method of placing CRs on the surface of the glacier as GCPs. Thus, accurate geocoding is difficult. The geocoding method used in this paper, that is, searching the solution space, can be realized by reducing the GB-SAR deployment position to the local 3D coordinate system frame using the control survey. It is not necessary to deploy CRs in the monitoring area and a highly accurate GB-SAR geocoding result can be realized.
Based on the analysis of the details of the geocoding results in the experiment (Figure 11), the area including the lower part of the landslide body, which is tangent to the glacier, significantly collapses. The GB-SAR geocoding results show notable boundaries in this area (Figure 11c). Based on the interpretation of the superimposed 3D terrain model, a backslope terrace has formed in the collapsed area at the lower edge of the landslide, which is invisible to GB-SAR due to the melting of the glacier. Therefore, this area cannot be effectively geocoded, which is consistent with the actual geographic condition of the area (Figure 11e). Similarly, there is no effective backscattering of radar waves on the water surface in the area including the glacial lake under the GB-SAR station because of the radar imaging mechanism, the GB-SAR system cannot effectively image in this area, resulting in data holes. Thus, there is no effective geocoding coverage, and the geocoding results around the glacial lake have notable boundaries (Figure 11f). Based on the combination of these results with the auxiliary analysis of the 3D terrain model of this area, the other uncoded regions of the block are also the areas that cannot be reached by the GB-SAR LOS due to terrain undulations. The geocoding results of this area conform to the GB-SAR imaging mechanism and local terrain.
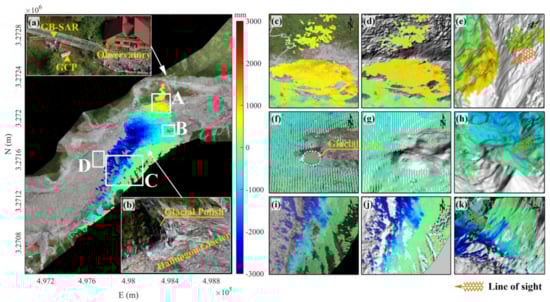
Figure 11.
Map of the GB-SAR geocoding results including superimposed DOM image data. (a) The GB-SAR location and information about its environment. (b) Geographic environment information near the dividing line with a cumulative displacement of 0 mm. The area with a cumulative displacement of 0 mm is mainly the glacial polish. The lower part includes the Hailuogou Glacier covered by a large amount of surface moraine. (c–e) Local details of the area marked by the rectangular box A in the main figure, that is, the geocoding results of the superimposed DOM, superimposed DSM, and 3D terrain model, respectively. Similarly, (f–h) and (i–k) represent the geocoding results of the area marked by the rectangular boxes B and C, respectively. Based on the comparison and interpretation of the local enlarged details of the DOM, DSM, and 3D terrain model superimposed in the three regions A, B, and C, the uncoded areas are mainly concentrated in the backslope, glacial lake, and invisible valley, which conforms to the GB-SAR imaging mechanism and local geographic conditions. The geocoding effect is satisfactory.
The geocoding results of the glacier and its southern side slope far away from the LOS of GB-SAR show that the geocoding results have no effective surface deformation coverage in valley areas that were formed by the glacier and the side slope. Based on the deformation geocoding results and the 3D terrain model, the main reason is the lack of effective backscattering due to the invisible LOS of GB-SAR. However, the deformation area near the center of the glacier is not effectively geocoded or there are few geocoding points, which may be related to the spatial decorrelation of the phase caused by the rapid movement of the middle part of the glacier, as shown in area “D” in Figure 11. In addition, we identified several areas with negative displacement values on the side slope body, such as area “C,” which move toward to the radar sensor and slide downward. The field survey image (Figure 11b) indicates a downward sliding surface debris flow in the side slope area, which is consistent with the actual geographic environment.
Based on the above-mentioned analysis, the GB-SAR geocoding results are highly consistent with the average power map and cumulative displacement distribution map of GB-SAR. Uncoded areas are mainly concentrated in the invisible backslopes, glacial lakes without effective backscattering, and invisible valley terrain. The results of geocoding are in accordance with the radar imaging mechanism and local geographic conditions, which verifies the effectiveness and universality of the solution space search geocoding method proposed in this paper.
5.2. Assessment of the Geocoding Accuracy
As the pixels beyond the scope of DSM cannot be used to solve the 3D spatial distance and effective distance solution space matching cannot be carried out, the values outside the monitoring range should be discarded, and only GB-SAR image pixels within the DSM range should be geocoded.
To verify the accuracy of the solution space search geocoding method, we decomposed the geocoded 3D local coordinates into the GB-SAR image coordinate system and obtained the distribution of the 3D local coordinate system coordinate components of E, N, Z in the radar coordinate system, as shown in Figure 12. Figure 12b,c shows that the coordinate values of each component of E and N are uniformly distributed, smooth, and lack a saltus step in the radar coordinate system G-XY, indicating that the GB-SAR geocoding plane position is accurate. The components of the Z coordinate axis in Figure 12d are consistent with the DSM; that is, the geocoding results have a high logical accuracy in elevation. The GB-SAR pixels correspond to the pixels in the 3D local coordinate system and no logic error occurs, confirming the accuracy of the solution space search geocoding method proposed in this paper.
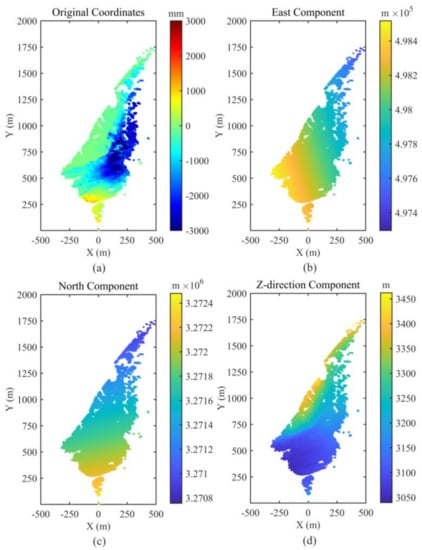
Figure 12.
Distribution of the 3D local coordinate system components in the radar coordinate system. (a) Original GB-SAR monitoring results. (b) Distribution of the east component of the 3D coordinate system in the radar coordinate system. (c) Distribution of the north component of the 3D coordinate system in the radar coordinate system. (d) Distribution of the Z-direction component of the 3D coordinate system in radar coordinate system.
The azimuth and range errors of each pixel in the GB-SAR image during geocoding were calculated. Their distributions are shown in Figure 13. The geocoding error of the GB-SAR image is a standard normal distribution in the radar azimuth direction and uniform distribution in the range direction, which is related to the imaging mechanism of the radar image. This implies that the range resolution in the radar coordinate system is a fixed value and the azimuth resolution is radian. With the increase in the distance, the radar pixel size gradually increases in the azimuth direction and the pixel resolution decreases. The basic logic of the solution space search method proposed in this study is azimuth angle matching, followed by minimum Euclidean distance matching of the radar pixels in the range direction. If the range matching in the azimuth direction in ineffective, a distance solution space search is carried out within the angle threshold range set in the azimuth direction. Therefore, most of the matching pixels are close to the azimuth angle center line near the 0° value of the azimuth error. As a result, the geocoding error of GB-SAR presents a normal distribution in the azimuth direction, as shown in Figure 13b. As the range resolution of the GB-SAR is fixed and the ground surface of the monitoring area is continuous but uneven, the range solutions in the range direction are matched within the set threshold range, forming a uniform distribution, as shown in Figure 13d. Based on the error distribution, the geocoding pixel position errors in this paper are all smaller than the single-pixel resolution and the matching accuracy is at the subpixel level. This proves that the solution space search geocoding method has a high geocoding accuracy.
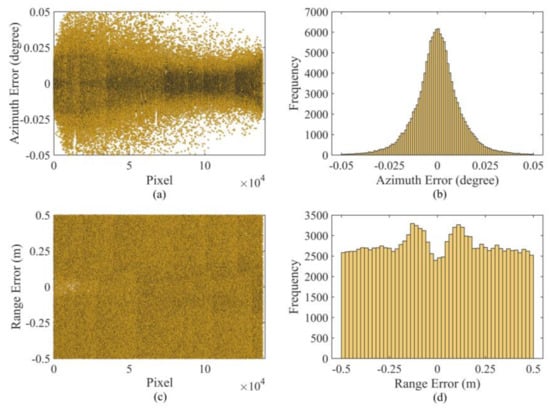
Figure 13.
Distribution charts of geocoding error: (a) distribution of azimuth error, (b) histogram of azimuth error distribution, (c) distribution of range error, and (d) histogram of range error distribution.
5.3. Landslide Migration Mechanism
Based on the combination of the chart data obtained from continuous GB-SAR monitoring and the field investigation of the landslide area, the movement of the LGJT landslide on the Hailuogou Glacier can be inferred. On one hand, owing to the loose soil and rocks on the lateral moraine of Hailuogou Glacier, the thinning of the glacier will lead to the decrease of the sliding resistance section at the lower edge of the landslide mass in the beginning of annual ablation period. The lower part of the landslide significantly collapses, forming a notable collapse terrace, which leads to the increase of the slope free height and the decrease of the overall anti sliding force of landslide mass [24] (Figure 11c,e). On the other hand, the eastward tangential movement of the glacier at the lower edge of the landslide has a strong traction effect on the erosion of the lower part of the landslide and the abundant rainfall in the area promotes the aggravation of the landslide movement [45,46,47]. Based on this information, we can conclude that the migration mechanism of the LGJT landslide is retrogressive movement [39,48], that is, the lower part of the landslide first slides under the traction of the glacier, causing the upper part to lose support, deform, and slide. While sliding down, the landslide’s main body further squeezes the edge of the glacier under the action of gravity, changing the flow direction of the glacier in this area. This leads to the positive accumulated displacement value of GB-SAR in the glacier area at the lower edge of the landslide. However, when it reaches the middle of the glacier, the stress gradually decreases and positive value gradually changes to a negative value in the way of moving close to the GB-SAR sensor center.
This monitoring experiment shows that the high spatiotemporal resolution of the GB-SAR monitoring system directly reflects the cumulative displacement distribution between the landslide mass and its tangent glacier. Based on the combination of the monitoring chart data and information about the local geographic environment, the migration mechanism of the landslide body can be well explained.
6. Conclusions
In this study, the high-resolution DSM obtained by UAV aerial photogrammetry was used to establish a high-accuracy coordinate transformation model of GB-SAR. A high-accuracy geocoding method for GB-SAR based on searching the solution space was proposed, and the coordinate conversion of radar image from 2D plane coordinate system to the local 3D coordinate system was realized. By applying this method to LGJT landslide monitoring experiment on Hailuogou Glacier, the effectiveness was verified by contrastive interpretation and the logical accuracy and accuracy indicators were assessed by quantitative analysis. Finally, a subpixel geocoding accuracy was realized. Based on the geocoding method proposed in this paper, the GB-SAR monitoring system can accurately monitor and interpret the movement of landslides, providing important data and decision support for the monitoring and early warning of high-risk landslides and related geological disasters.
The geocoding method proposed in this study has several limitations. For the geocoding of the target monitoring area, external 3D ancillary data coverage is required such as DSM data (the radar center can be outside of the DSM, only its coordinates and azimuth angle must be measured). In addition, the GB-SAR center and DSM must be in a unified coordinate system to effectively search and match the distance solution space. Therefore, the geocoding method proposed in this study should be supported by spatial data acquired by UAV aerial photogrammetry or LiDAR surveys to obtain the highest geocoding accuracy and best interpretation of the GB-SAR monitoring results.
Author Contributions
Conceptualization, G.L. and H.J.; methodology, J.C.; validation, B.Z. and Y.F.; formal analysis, Q.L. and X.W.; investigation, B.Z. and J.C.; data curation, J.C., B.Z. and R.Z.; writing—original draft preparation, J.C.; writing—review and editing, H.J. and Q.L.; supervision, G.L.; project administration, G.L. All authors have read and agreed to the published version of the manuscript.
Funding
This research was jointly funded by the National Key Research and Development Program of China (Grant No. 2017YFB0502700); the National Natural Science Foundation of China (Grant Nos. 41771402, 41701535, 41871069, and 41804009); the Sichuan Science and Technology Program (Grant Nos. 2019YJ0224, 2019ZDZX0042, 2020JDTD0003, and 2020YJ0322); and the Major Special Airborne Observation System Project for High-resolution Earth Observations (Grant No. 30-H30C01-9004-19/21).
Institutional Review Board Statement
Not applicable.
Informed Consent Statement
Not applicable.
Data Availability Statement
Samples of data are available from the authors.
Acknowledgments
The authors would like to thank the Hailuogou Scenic Spot Management Bureau for providing UAV photogrammetry and GB-SAR observation data acquisition permission and traffic convenience. The authors are also grateful to Chengdu Beidou Tiandi Co., Ltd. (www.compassgnss.com, 20 January 2021) for providing the GodWork software support.
Conflicts of Interest
The authors declare no conflict of interest.
References
- Wang, Y.; Hong, W.; Zhang, Y.; Lin, Y.; Li, Y.; Bai, Z.; Zhang, Q.; Lv, S.; Liu, H.; Song, Y. Ground-Based Differential Interferometry SAR: A Review. IEEE Geosci. Remote Sens. Mag. 2020, 8, 43–70. [Google Scholar] [CrossRef]
- Caduff, R.; Schlunegger, F.; Kos, A.; Wiesmann, A. A Review of Terrestrial Radar Interferometry for Measuring Surface Change in the Geosciences. Earth Surf. Process. Landf. 2015, 40, 208–228. [Google Scholar] [CrossRef]
- Pieraccini, M.; Miccinesi, L. Ground-based Radar Interferometry: A Bibliographic Review. Remote Sens. 2019, 11, 1029. [Google Scholar] [CrossRef]
- Lingua, A.; Piatti, D.; Rinaudo, F. Remote Monitoring of a Landslide Using an Integration of GB-INSAR and LIDAR Techniques. Int. Arch. Photogramm. Remote Sens. Spat. Inf. Sci. 2008, 37, 133–139. [Google Scholar]
- Monserrat, O.; Crosetto, M.; Luzi, G. A Review of Ground-based SAR Interferometry for Deformation Measurement. ISPRS-J. Photogramm. Remote Sens. 2014, 93, 40–48. [Google Scholar] [CrossRef]
- Lowry, B.; Gomez, F.; Zhou, W.; Mooney, M.A.; Held, B.; Grasmick, J. High Resolution Displacement Monitoring of a Slow Velocity Landslide Using Ground Based Radar Interferometry. Eng. Geol. 2013, 166, 160–169. [Google Scholar] [CrossRef]
- Wang, Z.; Li, Z.; Mills, J. A New Approach to Selecting Coherent Pixels for Ground-based SAR Deformation Monitoring. ISPRS-J. Photogramm. Remote Sens. 2018, 144, 412–422. [Google Scholar] [CrossRef]
- Atzeni, C.; Barla, M.; Pieraccini, M.; Antolini, F. Early Warning Monitoring of Natural and Engineered Slopes with Ground-Based Synthetic-Aperture Radar. Rock Mech. Rock Eng. 2015, 48, 235–246. [Google Scholar] [CrossRef]
- Zheng, X.; Yang, X.; Ma, H.; Ren, G.; Zhang, K.; Yang, F.; Li, C. Integrated Ground-based SAR Interferometry, Terrestrial Laser Scanner, and Corner Reflector Deformation Experiments. Sensors 2018, 18, 4401. [Google Scholar] [CrossRef] [PubMed]
- Cossu, R.; Schoepfer, E.; Bally, P.; Fusco, L. Near real-time SAR-based processing to support flood monitoring. J. Real-Time Image Process. 2009, 4, 205–218. [Google Scholar] [CrossRef]
- Li, Y.; Jiao, Q.; Hu, X.; Li, Z.; Li, B.; Zhang, J.; Jiang, W.; Luo, Y.; Li, Q.; Ba, R. Detecting the Slope Movement After the 2018 Baige Landslides Based on Ground-based and Space-borne Radar Observations. Int. J. Appl. Earth Obs. Geoinf. 2020, 84, 1–12. [Google Scholar] [CrossRef]
- Casagli, N.; Catani, F.; Ventisette, C.D.; Luzi, G. Monitoring, prediction, and early warning using ground-based radar interferometry. Landslides 2010, 7, 291–301. [Google Scholar] [CrossRef]
- Pieraccini, M.; Casagli, N.; Luzi, G.; Tarchi, D.; Mecatti, D.; Noferini, L.; Atzeni, C. Landslide Monitoring by Ground-based Radar Interferometry: A Field Test in Valdarno (Italy). Int. J. Remote Sens. 2003, 24, 1385–1391. [Google Scholar] [CrossRef]
- Zhang, R.; Song, Y.; Liu, G.; Zhang, H. Landslide Monitoring Based on GB-SAR Interferometry for the Instable Slopes of Yaoji Reservoir. In Proceedings of the IET International Radar Conference, Hangzhou, China, 14–16 October 2015. [Google Scholar]
- Noferini, L.; Pieraccini, M.; Mecatti, D.; Macaluso, G.; Atzeni, C.; Mantovani, M.; Marcato, G.; Pasuto, A.; Slivano, S.; Tagliavini, F. Using GB-SAR Technique to Monitor Slow Moving Landslide. Eng. Geol. 2007, 95, 88–98. [Google Scholar] [CrossRef]
- Tarchi, D.; Casagli, N.; Fanti, R.; Leva, D.D.; Luzi, G.; Pasuto, A.; Pieraccini, M.; Slivano, S. Landslide Monitoring by Using Ground-based SAR Interferometry: An Example of Application to the Tessina Landslide in Italy. Eng. Geol. 2003, 68, 15–30. [Google Scholar] [CrossRef]
- Bozzano, F.; Cipriani, I.; Mazzanti, P.; Prestininzi, A. Displacement Patterns of a Landslide Affected by Human Activities: Insights from Ground-based InSAR Monitoring. Nat. Hazards 2011, 59, 1377–1396. [Google Scholar] [CrossRef]
- Xing, C.; Huang, J.; Han, X. Research on the Environmental Effects of GB-SAR for Dam Monitoring. Adv. Mater. Res. 2014, 919, 392–397. [Google Scholar] [CrossRef]
- Wang, P.; Xing, C. Research on Coordinate Transformation Method of GB-SAR Image Supported by 3D Laser Scanning Technology. In Proceedings of the ISPRS TC III Mid-term Symposium, Beijing, China, 7–10 May 2018; pp. 1757–1763. [Google Scholar]
- Rouyet, L.; Kristensen, L.; Derron, M.H.; Michoud, C.; Blikra, L.H.; Jaboyedoff, M.; Lauknes, T.R. Evidence of Rock Slope Breathing Using Ground-based InSAR. Geomorphology 2017, 289, 152–169. [Google Scholar] [CrossRef]
- Frodella, W.; Ciampalini, A.; Gigli, G.; Lombardi, L.; Raspini, F.; Nocentini, M.; Scardigli, C.; Casagli, N. Synergic Use of Satellite and Ground Based Remote Sensing Methods for Monitoring the San Leo Rock Cliff (Northern Italy). Geomorphology 2016, 264, 80–94. [Google Scholar] [CrossRef]
- Liu, B.; Ge, D.; Li, M.; Zhang, L.; Wang, Y.; Zhang, X. Using GB-SAR Technique to Monitor Displacement of Open Pit Slope. In Proceedings of the 2018 IEEE International Geoscience and Remote Sensing Symposium, Beijing, China, 10–15 July 2016; pp. 5986–5989. [Google Scholar]
- Pipia, L.; Fabregas, X.; Aguasca, A.; López-Martínez, C. Polarimetric Temporal Analysis of Urban Environments with a Ground-Based SAR. IEEE Trans. Geosci. Remote Sens. 2013, 51, 2343–2360. [Google Scholar] [CrossRef]
- Liu, G.; Zhang, B.; Zhang, R.; Cai, J.; Fu, Y.; Liu, Q.; Yu, B.; Li, Z. Monitoring Dynamics of Hailuogou Glacier and the Secondary Landslide Disasters Based on Combination of Satellite SAR and Ground-based SAR. Geomat. Inf. Sci. Wuhan Univ. 2019, 44, 980–995. [Google Scholar]
- Dematteis, N.; Luzi, G.; Giordan, D.; Zucca, F.; Allasia, P. Monitoring Alpine glacier surface deformations with GB-SAR. Remote Sens. Lett. 2017, 8, 947–956. [Google Scholar] [CrossRef]
- Noferini, L.; Mecatti, D.; Macaluso, G.; Pieraccini, M.; Atzeni, C. Monitoring of Belvedere Glacier Using a Wide Angle GB-SAR Interferometer. J. Appl. Geophys. 2009, 68, 289–293. [Google Scholar] [CrossRef]
- Luzi, G.; Pieraccini, M.; Mecatti, D.; Noferini, L.; Macaluso, G.; Tamburini, A.; Atzeni, C. Monitoring of an Alpine Glacier by Means of Ground-Based SAR Interferometry. IEEE Geosci. Remote Sens. Lett. 2007, 4, 495–499. [Google Scholar] [CrossRef]
- Xie, S.; Dixon, T.H.; Voytenko, D.; Deng, F.; Holland, D.M. Grounding Line Migration Through the Calving Season at Jakobshavn Isbræ, Greenland, Observed with Terrestrial Radar Interferometry. Cryosphere 2018, 12, 1–29. [Google Scholar] [CrossRef]
- Wang, P.; Xing, C. A Method of Transforming GB-SAR Image Coordinate to 3D Terrain Coordinate. J. Yangtze River Sci. Res. Inst. 2018, 35, 122–127. [Google Scholar]
- Bardi, F.; Raspini, F.; Ciampalini, A.; Kristensen, L.; Rouyet, L.; Lauknes, T.R.; Frauenfelder, R.; Casagli, N. Space-Borne and Ground-Based InSAR Data Integration: The Aknes Test Site. Remote Sens. 2016, 8, 237. [Google Scholar] [CrossRef]
- Zhou, J.; Tian, J.; Chen, Y.; Mao, Q.; Li, Q. Research on Data Fusion Method of Ground-Based SAR and 3D Laser Scanning. J. Geomat. 2015, 40, 26–30. [Google Scholar]
- Tapete, D.; Casagli, N.; Luzi, G.; Fanti, R.; Gigli, G.; Leva, D. Integrating Radar and Laser-based Remote Sensing Techniques for Monitoring Structural Deformation of Archaeological Monuments. J. Arch. Sci. 2013, 40, 176–189. [Google Scholar] [CrossRef]
- Dematteis, N.; Giordan, D.; Zucca, F.; Luzi, G.; Allasia, P. 4D Surface Kinematics Monitoring Through Terrestrial Radar Interferometry and Image Cross-correlation Coupling. ISPRS-J. Photogramm. Remote Sens. 2018, 142, 38–50. [Google Scholar] [CrossRef]
- Monserrat, O.; Crosetto, M. Deformation Measurement Using Terrestrial Laser Scanning Data and Least Squares 3D Surface Matching. ISPRS-J. Photogramm. Remote Sens. 2008, 63, 142–154. [Google Scholar] [CrossRef]
- Tian, W.; Zhao, Z.; Hu, C.; Wang, J.; Zeng, T. GB-InSAR-Based DEM Generation Method and Precision Analysis. Remote Sens. 2019, 11, 997. [Google Scholar] [CrossRef]
- Kuras, P.; Ortyl, Ł.; Owerko, T.; Salamak, M.; Łaziński, P. GB-SAR in the Diagnosis of Critical City Infrastructure—A Case Study of a Load Test on the Long Tram Extradosed Bridge. Remote Sens. 2020, 12, 3361. [Google Scholar] [CrossRef]
- Liu, Q.; Liu, S.; Cao, W. Seasonal Variation of Drainage System in the Lower Ablation Area of a Monsoonal Temperate Debris-covered Glacier in Mt. Gongga, South-eastern Tibet. Water 2018, 10, 1050. [Google Scholar] [CrossRef]
- Hassan, A.; Xu, J.; Zhang, L.; Liu, G.; Schmit, A.; Xing, C.; Xu, Y.; Ouyang, C.; Schwieger, V. Towards Integration of GNSS and GB-SAR Measurements: Exemplary Monitoring of a Rock Fall at the Yangtze River in China. In Proceedings of the Embracing Our Smart World Where the Continents Connect: Enhancing the Geospatial Maturity of Societies, Proceedings of the FIG Congress 2018, Istanbul, Turkey, 6–11 May 2018. [Google Scholar]
- Cai, J.; Zhang, W.; Li, Y.; Ren, S. Landslide Stability Analysis Based on Law of Surface Displacement. Sci. Surv. Mapp. 2016, 41, 96–99. [Google Scholar]
- Liu, G.; Chen, Q.; Luo, X.; Cai, G. Principle and Application of InSAR; Science Press: Chengdu, China, 2019; pp. 237–242. [Google Scholar]
- Yang, H.; Cai, J.; Peng, J.; Wang, J.; Jiang, Q. A Correcting Method About GB-SAR Rail Displacement. Int. J. Remote Sens. 2017, 38, 1483–1493. [Google Scholar] [CrossRef]
- Jiang, M.; Monti-Guarnieri, A. Distributed Scatterer Interferometry with the Refinement of Spatiotemporal Coherence. IEEE Trans. Geosci. Remote Sens. 2020, 58, 3977–3987. [Google Scholar] [CrossRef]
- Jehle, M.; Perler, D.; Small, D.; Schubert, A.; Meier, E. Estimation of Atmospheric Path Delays in TerraSAR-X Data Using Models vs. Measurements. Sensors 2008, 8, 8479–8491. [Google Scholar] [CrossRef]
- Noferini, L.; Pieraccini, M.; Mecatti, D.; Luzi, G.; Atzeni, C.; Tamburini, A.; Broccolato, M. Permanent Scatterers Analysis for Atmospheric Correction in Ground-based SAR Interferometry. IEEE Trans. Geosci. Remote Sens. 2005, 43, 1459–1471. [Google Scholar] [CrossRef]
- Nie, Y.; Pritchard, H.D.; Liu, Q.; Hennig, T.; Wang, W.; Wang, X.; Liu, S.; Nepal, S.; Samyn, D.; Hewitt, K.; et al. Glacial change and hydrological implications in the Himalaya and Karakoram. Nat. Rev. Earth Environ. 2021, 2, 91–106. [Google Scholar] [CrossRef]
- Huggel, C. Recent extreme slope failures in glacial environments: Effects of thermal perturbation. Quat. Sci. Rev. 2009, 28, 1119–1130. [Google Scholar] [CrossRef]
- Huggel, C.; Clague, J.J.; Korup, O. Is climate change responsible for changing landslide activity in high mountains. Earth Surf. Process. Landf. 2012, 37, 77–91. [Google Scholar] [CrossRef]
- Wang, X.; Liu, Q.; Liu, S.; He, G. Manifestations and mechanisms of mountain glacier-related hazards. Sci. Cold Arid Reg. 2020, 12, 436–446. [Google Scholar]
Publisher’s Note: MDPI stays neutral with regard to jurisdictional claims in published maps and institutional affiliations. |
© 2021 by the authors. Licensee MDPI, Basel, Switzerland. This article is an open access article distributed under the terms and conditions of the Creative Commons Attribution (CC BY) license (http://creativecommons.org/licenses/by/4.0/).