Abstract
The timely estimation of nitrogen (N) requirements is essential for managing N fertilizer application in pear orchards. Visible/near infrared spectroscopy is a non-destructive and effective technique for real-time assessment of leaf N concentration, but its utility for decisions about fertilizer application in the pear orchards remains to be determined. In this study, we used leaf spectroscopy to determine leaf N concentration, used this value to calculate the amounts of N required for supplementary fertilization, and then evaluated the effects of the application. Over the two-year study, Cuiguan pear trees were treated with N at the following rates: 0 (N0), 100 (N1), 200 (N2), 300 (N3), and 400 (N4) g N per tree, regarded as five “controlled” N application rates. Another four “regulatory” treatments (Nr1-4) were fertilized as the “controlled” N application rates the first year, then given adjusted N application by topdressing as calculated using the N concentrations inferred from visible/near infrared spectroscopy data the second year. A model (R2 = 0.82) was established the first year to relate leaf spectra and N concentration using a partial least squares regression with full bands (350–2500 nm). The amount of N in the topdressing for the supplemental treatments was determined using the predicted leaf N concentration and the topdressing calculation method adapted from the N balance formula. Results showed that adjusted N applications of the Nr1 and Nr2 increased yield by 26% and 23%, respectively, over the controlled treatments N1 and N2. Although treatments Nr3 and Nr4 did not increase yield significantly over N3 and N4, the partial factor productivity of nitrogen in Nr4 was higher than the N4. The transverse diameter of fruit from Nr1 trees was significantly higher than from N1 trees, while the longitudinal diameter of fruit from Nr1, Nr2, and Nr3 trees was significantly higher than from N1, N2 and N3 trees, suggesting that fruit longitudinal growth and single-fruit weight is stimulated by adjusted N applications. However, the soluble solids in fruit from trees receiving adjusted N were not significantly greater than in fruit from non-supplemented trees. In conclusion, our results illustrate that regulatory N management contributes to fruit yield and quality especially in the nitrogen deficiency condition and improves the nitrogen use efficiency in nitrogen surplus. The N prediction model established using the nondestructive visible/near infrared spectroscopy is convenient and economical.
1. Introduction
Although pears (Pyrus L.) are cultivated throughout the world, China is the leading producer of Asian pears [1], one of the most common fruits cultivated in both North and South China [2]. Nitrogen (N) is critical for regulating vegetative growth, promoting flower bud differentiation, and increasing fruit set [3]. N is therefore an important fertilizer input in pear cultivation, and optimizing its application in pear orchards is also important for economic and environmental reasons. Conventional fertilizer application practices in China overuse N and phosphorus, which leads to soil acidification, salinization, and impaired water quality [4]. In Chinese pear orchards, average total N input is 544.3 kg·N·ha−1, and N surplus is 333.3 kg·N·ha−1 [5], far higher than the world average. In contrast, pears in Europe receive 40–50 kg·N·ha−1 to maintain good fruit quality and production; amounts higher than 160 kg·N·ha−1 are rarely applied [6]. Excessive N application often results in the stimulation of shoot growth and leads to the production of fruits with undesirably high N concentrations, making them more prone to post-harvest physiological and pathological disorders [7,8]. Nitrate pollution of surface and ground water is also a concern when N fertilization exceeds tree requirements [9,10,11]. Management practices that produce high yielding crops without wasted N are needed to achieve sustainable agriculture in China [12,13].
Leaf analysis is increasingly used to guide fertilizer application, since the N status of the leaf more accurately reflects the needs of the tree than does soil testing [14]. With the rapid development and improvement of spectroscopic techniques, leaf reflectance has emerged as a fast and cost-effective method for monitoring N [15,16,17,18]. Algorithms for leaf N retrieval from hyperspectral data in the agricultural sector can be divided into physically-based and empirically-based approaches [18]. In addition, both types of leaf N retrieval methods expanded into subcategories and combinations thereof [17], which can be classified in to five general methods (adapted from Berger et al., 2020). They are physically-based model inversion methods (radiative transfer models, RTMs), parametric regression methods (vegetation indices with narrow spectra), nonparametric regression methods (including linear and nonlinear approaches), alternative data (sun induced fluorescence), and mixed regression methods. Recent years, the N retrieval methods responding to the physiological theory of leaf N allocation took advances. Wang et al. (2015) demonstrated that it was more useful to estimate the area-based leaf N content (expressed by the unit of g/cm²) than that of the mass-based leaf N content (expressed by the unit of mg/g), which was not affected by the dilution phenomenon [19]. Some reports demonstrated that the relationship between nitrogen and proteins was essential for identifying optimal spectral regions, because proteins were the major nitrogen-containing biochemical constituents of leaves [18,20,21,22,23,24]. Moreover, it was shown in our previous study that visible/near-infrared spectral measurements in the field could be used to measure nitrogen in pear leaves non-destructively, when interpreted using a partial least squares regression (PLSR) model (one of the nonparametric regression methods). Leaf N concentration can be used as a reliable predictor of required N and yield, based on measurements at 50 days after full bloom (DAB) [25,26]. However, the N fertilizer recommendation by the predicted leaf N concentration using the non-destructive model in pear orchards have not been applied.
To provide accurate and timely assessment of N status during the growing season, analytic methods must be rapid, simple to use, inexpensive, and technically rigorous [27]. Precise N management composed by the sensor-based N monitoring can improve fruit trees’ productivity and overcome adverse effects due to the misapplication of N [28,29]. Appropriate levels of nitrogen (N) promote cell division and growth as well as the synthesis of leaf protein [30]. Efficient use of nitrogen fertilizer, both in terms of timing and the amount applied, is important for achieving high fruit yield and quality in pear orchards [6,30]. Nitrogen deficiency or excess causes pear trees to grow poorly and produce fruit with sub-optimal yield and/or quality [31]. Recently, algorithms (such as the N balance formula and the N nutrition index) have been developed that use leaf or canopy reflectance to calculate N application levels for various crops [32]. Sensor-based N monitoring can be interfaced with a physiological demand model to realize precision N fertilization [33]. Kitchen et al. (2010) conducted field experiments to test whether canopy reflectance could be used to assess crop N and estimate requirements for N fertilization [34]. Their results confirmed that crop-canopy reflectance sensing has potential to improve N management by replacing wasteful conventional single-rate applications [35]. However, nutrient storage in woody perennials is not the same as in other plants [3,36]; the utility of spectroscopy for precision management of N has not been tested in pear trees.
It is not yet known if data obtained from monitoring the nitrogen concentration in leaves can be used to guide nitrogen application in the field and evaluate its effects. In order to address these questions, we conducted a study with three basic aims: (1) to establish a non-destructive model for monitoring leaf nitrogen concentration in pear orchards, (2) to develop an algorithm to calculate an appropriate level of N topdressing using the sensor-based leaf nitrogen monitoring, and (3) to evaluate the performance of algorithm by assessing the effects of the recommended N applications on fruit quality.
2. Materials and Methods
2.1. Plant Material
The two-year field experiment was conducted in Tongzhu Village of Yixing City (Jiangsu Province, China; 31.35N, 119.74E) from January 2015 to September 2016. The annual mean temperature and precipitation were 15.7 °C and 1177 mm, respectively. The soil of experimental site has a clay-loamy texture, contains 15.65 g·kg−1 organic matter, and has a low N concentration of 0.8 g·kg−1. The available phosphate and potassium are 18.61 and 127.8 mg·kg−1 respectively, and the pH of the soil in water is 6.39. Five-year old Cuiguan pear trees (Pyrus pyrifolia Nakai cv. Cuiguan) were used in the experiment. The trees were cultivated in 4 × 3 m frames and bore fruit in 2016.
2.2. Leaf Spectra Collection and Leaf Nitrogen Concentration Measurement
To establish a diagnostic model for nitrogen concentration in pear leaves, we used nondestructive evaluation by spectroscopy. Leaf spectra were collected in the field during May and July 2015 (i.e., 50 DAB, and 80 DAB). The middle leaves of the year’s spring flush were selected for spectral measurements from the external sides of the canopy (east, south, west, and north). Leaf spectral measurements were made in the field using a FieldSpec 3 portable field spectrometer (Analytical Spectral Devices, Boulder, CO, USA) by a probe with an internal light source and a clip to hold the leaf against a black background. The plant probe and leaf-clip are commercial solutions because the accessories are sold with the spectrometer. As demonstrated in our previous study, spectra collected against a black background exhibit a higher signal-to-noise ratio than spectra collected on a white background [25]. The photos which illustrated the measurement procedure revised from our previous study were in the Figure S1. This spectrometer was assembly attached durable battery and stable light source instead of the solar irradiation. The spectroradiometer had a 2 nm sampling interval and a spectral resolution of 3 nm from 350 to 1000 nm, and 10 nm from 1000 to 2500 nm. To prevent outliers at the moment of the in-field measurements, the spectrometer and the light source would be preheated half an hour in advance until getting the condition to be homogeneous and stable. In addition, before leaf spectra measurement of every treatment, the leaf-clip with Teflon white standard would be applied to adjust the maximum reflectance (99.9%) conditions to avoid baseline drift, and then, the leaf-clip with black background was used to collect the leaf spectra through the ratio of leaf reflectance and the white standard reflectance. The adaxial leaf surface should be faced to the plant probe. Two symmetrical points beside the leaf vein were designed to collected five spectra with stable 5 s integration time each measured point. Final leaf spectra were obtained by the average spectrum of the two points. In order to avoid the possible effect of environmental conditions (including temperature and solar irradiation) on the leaf spectra collection, all the leaf spectra measurement were completed in-field with 3.5 h in the early morning (6:00 a.m. to 10:00 a.m. in the same temperature) including the calibration and validation samples.
After the in-field leaf spectra measurement, leaf N concentration of dry mass was determined by the Dumas method using an Elementar Vario Macro CHN analyzer (Elementar Analysensyteme GmbH, Hanau, Germany). The leaves with completed spectra measurements were taken to the laboratory for analysis. The leaf samples were dried in oven firstly at 105 °C for 1 h to de-enzyme and then at 70 °C for 72 h to remove the water. The main vein in the middle of the leaves had to be removed. The dried leaf samples were finely ground, mixed, and weighted in the Tin boat for determination. At the same time, the standard acetanilide and citrus leaf (GBW10020) samples were added every testing time to reduce the system error in the lab-analysis. In the analysis of leaf nitrogen concentration by Dumas method with the Elementar Vario Macro CHN analyzer, acetanilide was used to check whether the equipment in normal condition, especially the instrument consumables, was usable. In detail, if the equipment is in normal condition, the measured nitrogen concentration of acetanilide is 10%. Similarly, the standard citrus leaf samples (GBW10020) were added in the testing procedure to identify whether a system error appeared. The referenced nitrogen concentration of the standard citrus leaf samples (GBW10020) was 2.47% ± 0.06%. If the measured standard samples were out of the referenced value, the measured pear leaves in simultaneous procedure had to be redetermined.
2.3. Leaf Nitrogen Concentration Modeling
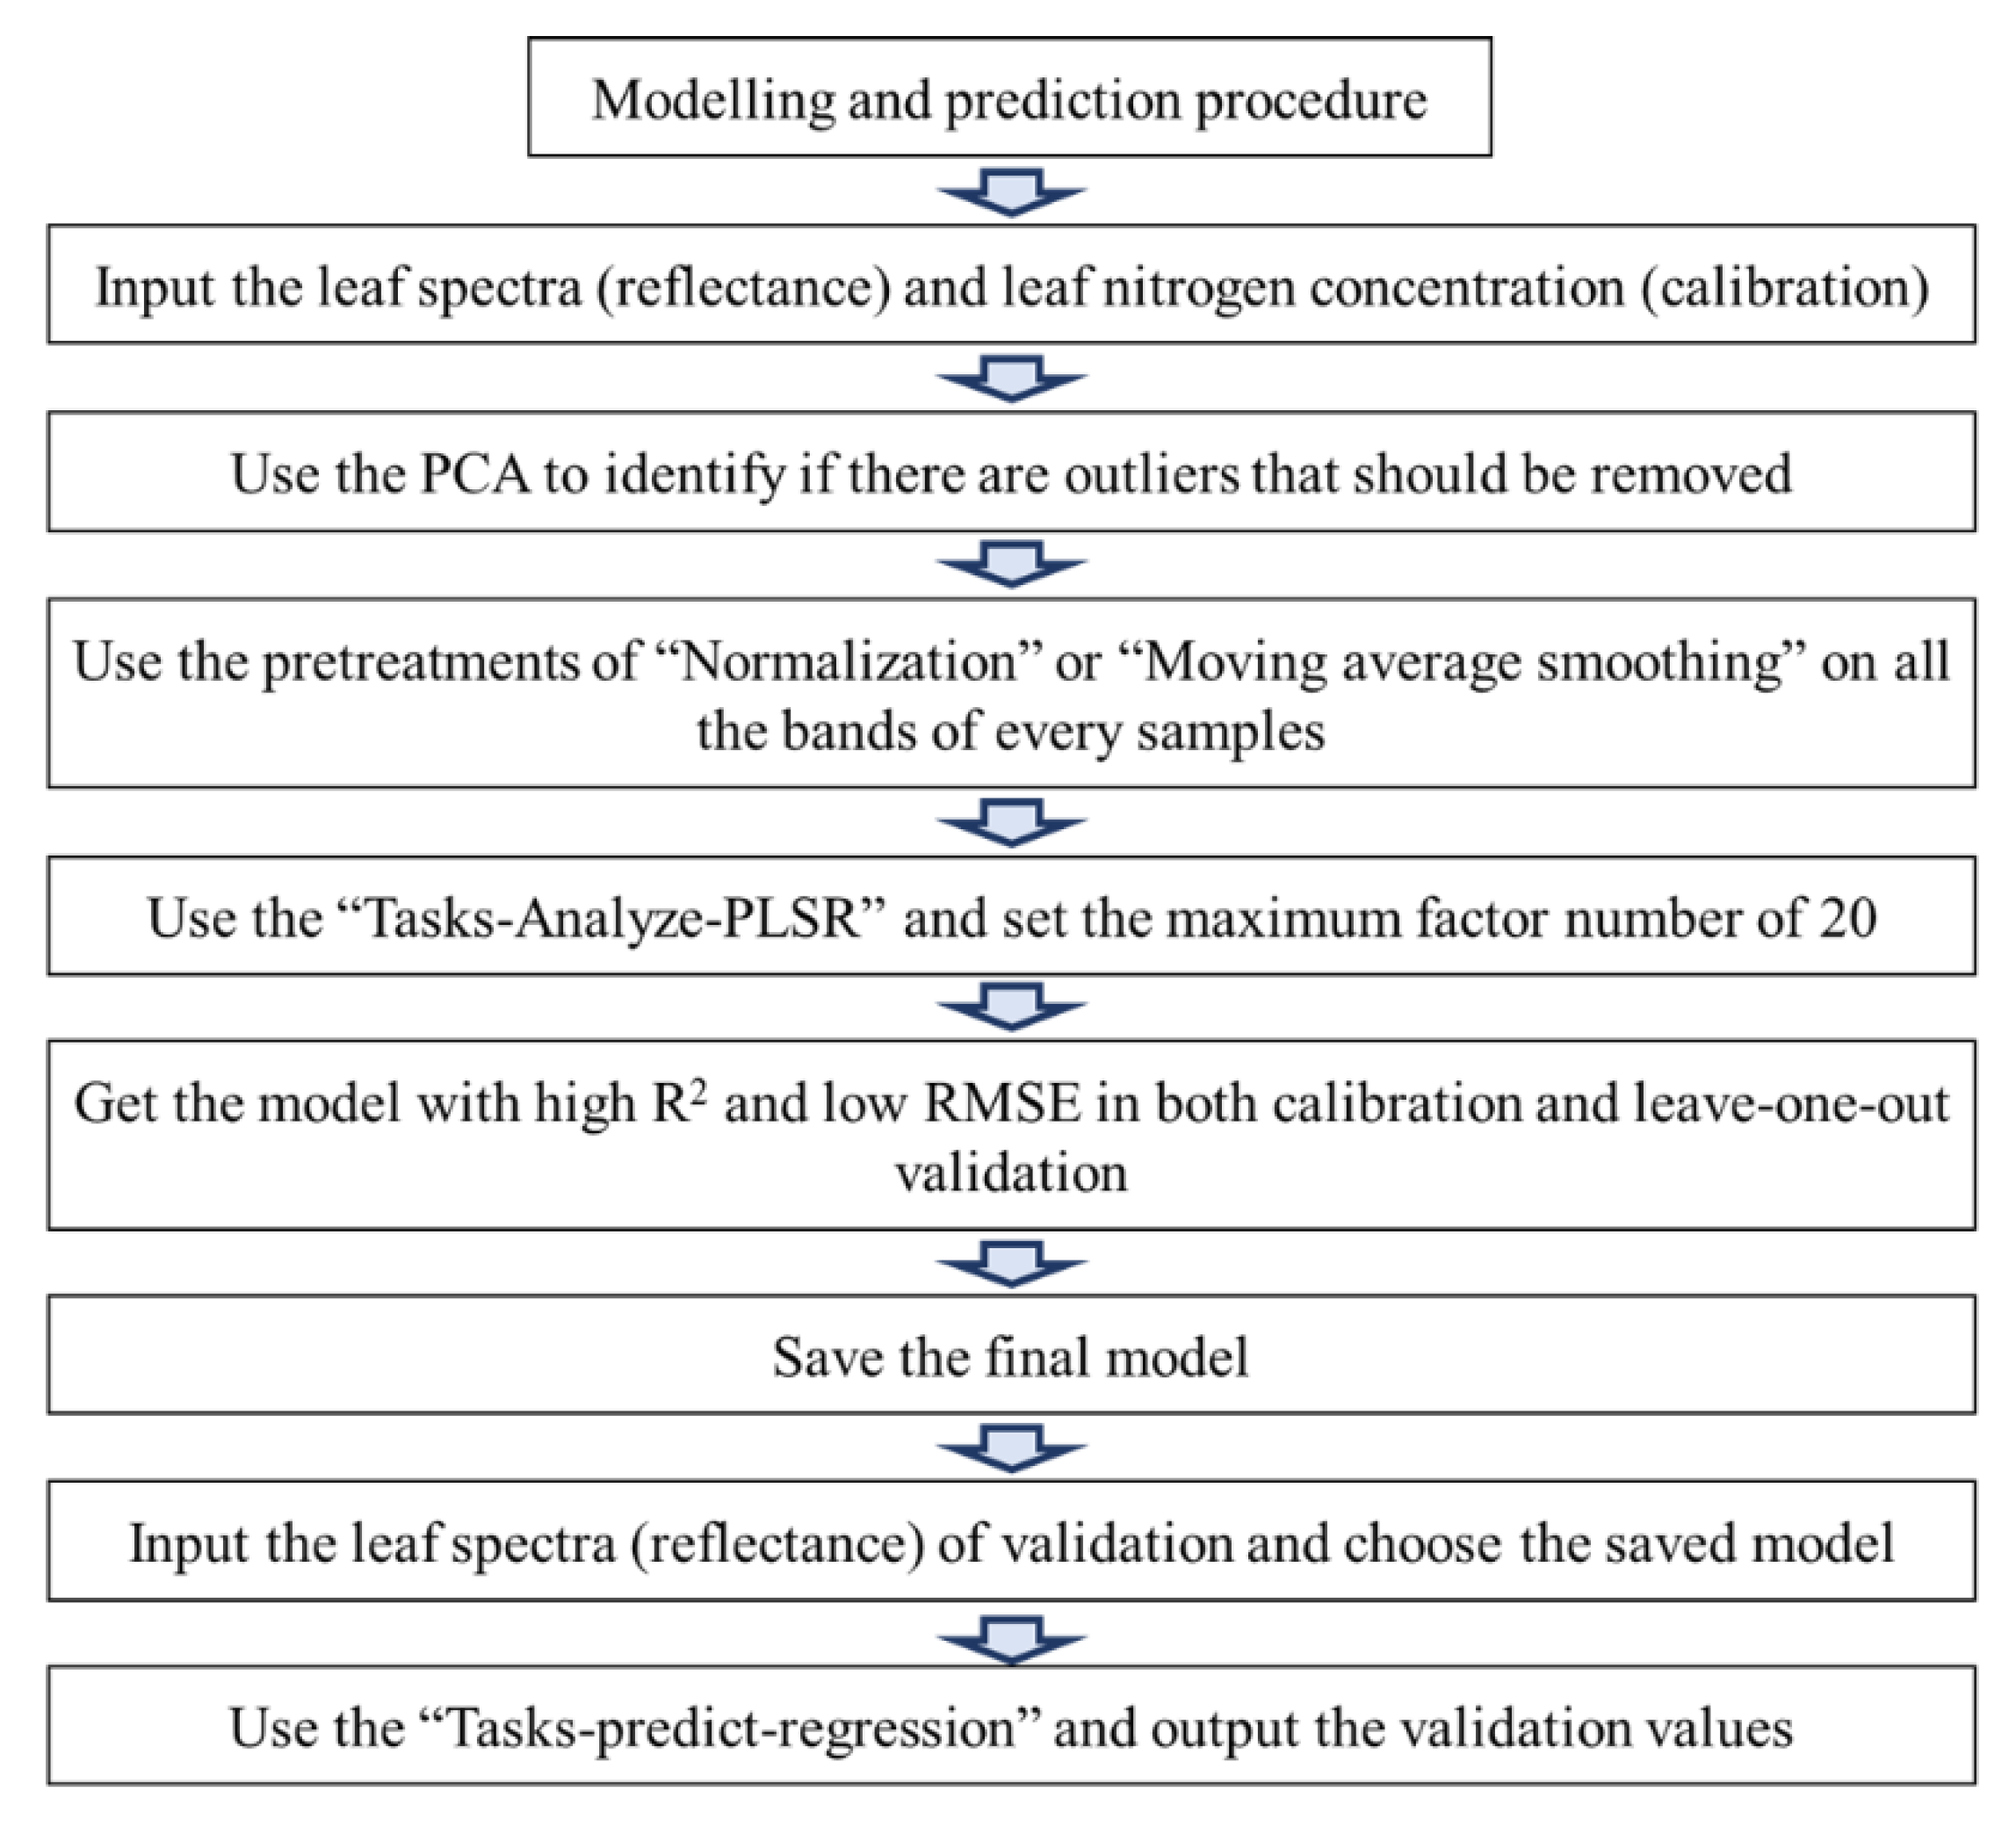
Before modeling, spectral principal component analysis (PCA) was be used to discriminate the outliers throughout the calibration and validation samples (Figure 1). Then, normalization and moving average smoothing pre-treatment in the Unscrambler X 10.3 (Camo Software AS, Oslo, Norway) was applied to deal with the raw spectral data for improving the modeling accuracy [25,26]. As reported in our previous study, a partial least square regression (PLSR) was used to create a diagnostic model for leaf nitrogen concentration by Unscrambler X 10.3. The accuracy and precision of PLSR models were evaluated by coefficient of determination (R2) between predicted and chemical-determined N concentrations, the root mean square error during the calibration phase (RMSEC), and the root mean square error during the validation phase (RMSEV). In the modeling procedure, the leave-one-out cross validation was used to improve the coefficient of determination as well as decrease the errors by adjusting the factor number (Figure 1). Following the criteria of Saeys et al. (2005), a calibration model with an R2 value between 0.81 and 0.90 was considered good [37]. A small difference between the RMSEC and RMSEV values was also important to avoid “over-fitting” during the calibration and validation phases [38].
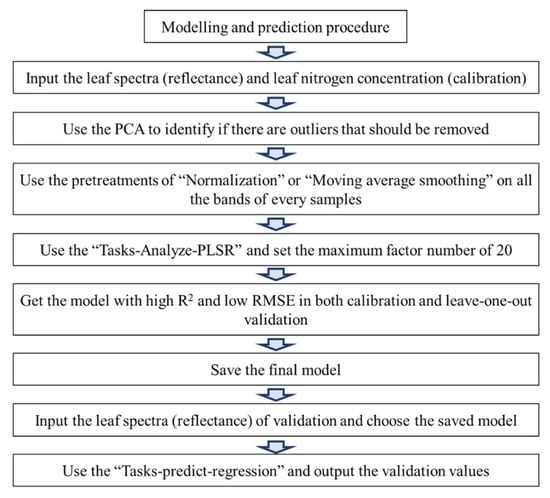
Figure 1.
Diagram for the modeling procedure.
2.4. Treatments and Topdressing Calculation
Based on the conventional N fertilization schedule for the locality (200 g N per tree), five “controlled” N application rates were tested: 0 (N0), 100 (N1), 200 (N2), 300 (N3), and 400 (N4) g N per tree. Four “regulatory” treatments were also tested (Nr1, Nr2, Nr3, and Nr4). The complete design therefore involved 9 treatments (including the N0) and 9 groups of six trees each. In year 1, base fertilizer (60% of the total N) was applied (March 2015). These treatments were identical to the corresponding controlled treatments (i.e., Nr1 = N1). In year 2, topdressing (40% of the total N) was applied (May 2016). Four groups again received N1-4, and 4 groups received Nr1-4 (but with amounts calculated using the fertilization Formula (1) after leaf nitrogen status was determined by spectroscopy; see Table 1). The block design of experiment was in a random arrangement in alternate rows, with three replicates of two trees. Each experimental plot was isolated by inserting 40 × 120 cm baffles into the soil to a depth of 50 cm to minimize nitrogen exchange between plots. Nitrogen fertilizer (urea) was applied using a fertilizer irrigation system. Standard orchard practices adopted by local commercial pear producers, including winter pruning, pest control in the spring and summer, and regular irrigation were employed. Trees were not permitted to bear fruit in 2015. A uniform pruning was carried out in spring of 2016, and the trees were left to bear fruit later that year.

Table 1.
Nitrogen application rates (g·plant−1) for different treatments.
The formula calculating N topdressing of Nr1-4 based on leaf nitrogen concentration in 2016 were revised according to the N imbalance formula by Yin et al. (2010) [39]. Several additional statistical parameters we required were investigated in the field, including the suitable leaf nitrogen content in 50 DAB, average weight of 100 dry leaves, branch numbers, average leaf number of one branch and the local N fertilizer use efficiency. According to Buwalda et al. (1990) and Hou et al. (2012), the suitable leaf nitrogen content in 50 DAB is 27 g·kg−1 [40,41]. Before treatments, all pear trees were pruned uniformly. The number of fruits on each tree was counted during bagging at the maturity stage. The investigated value of the average weight of 100 dry leaves and the local nitrogen use efficiency by fertigation is 57 g (n = 500) and 30%, respectively. The fertilization formula shown as follows:
Nref: suitable leaf nitrogen content in 50 DAB;
Nr: predicted leaf nitrogen concentration by the model;
W(Leaf): the average weight of 100 dry leaves;
Number(Leaf) = branch number × average leaf number of one branch;
NUE: local nitrogen use efficiency.
2.5. Measurement of Fruit Yield and Quality and PFP-N Calculation
All fruit was collected from each tree and measured for weight and quality at maturity. Fruit firmness was measured using the FT 327 firmness tester (BREUZZI, CO, Italy), which fitted with a 5 mm diameter round stainless-steel probe with a flat end, in an equatorial end area of the fruit. Results were expressed in Newtons (N) [42]. Soluble solids content was measured using the PAL-1 electronic refractometer (ATAGO, CO, Japan). Transverse and longitudinal fruit diameters were measured using a Vernier caliper. The partial factor productivity of nitrogen (PFP-N) in each treatment were calculated as the ratio of fresh pear yield to the nitrogen application rate. A high PFP-N is associated with less N use and greater yield [43].
2.6. Statistical Analysis
Preprocessing and modeling of the spectral data was conducted using ViewSpec Pro (Analytical Spectral Devices, Boulder, CO, USA) and Unscambler X 10.3 (Camo Software AS, Oslo, Norway), respectively. Microsoft Excel 2010 was used to process data for leaf nitrogen concentration, fruit yield, and quality. Statistically significant differences among treatments were analyzed using the least significant difference (LSD) multiple range test (p < 0.05) by SPSS17.0 (SPSS Inc., Chicago, IL, USA).
3. Result
3.1. Leaf N Concentration and Its Diagnosis Model by VIS-SWIR Spectroscopy
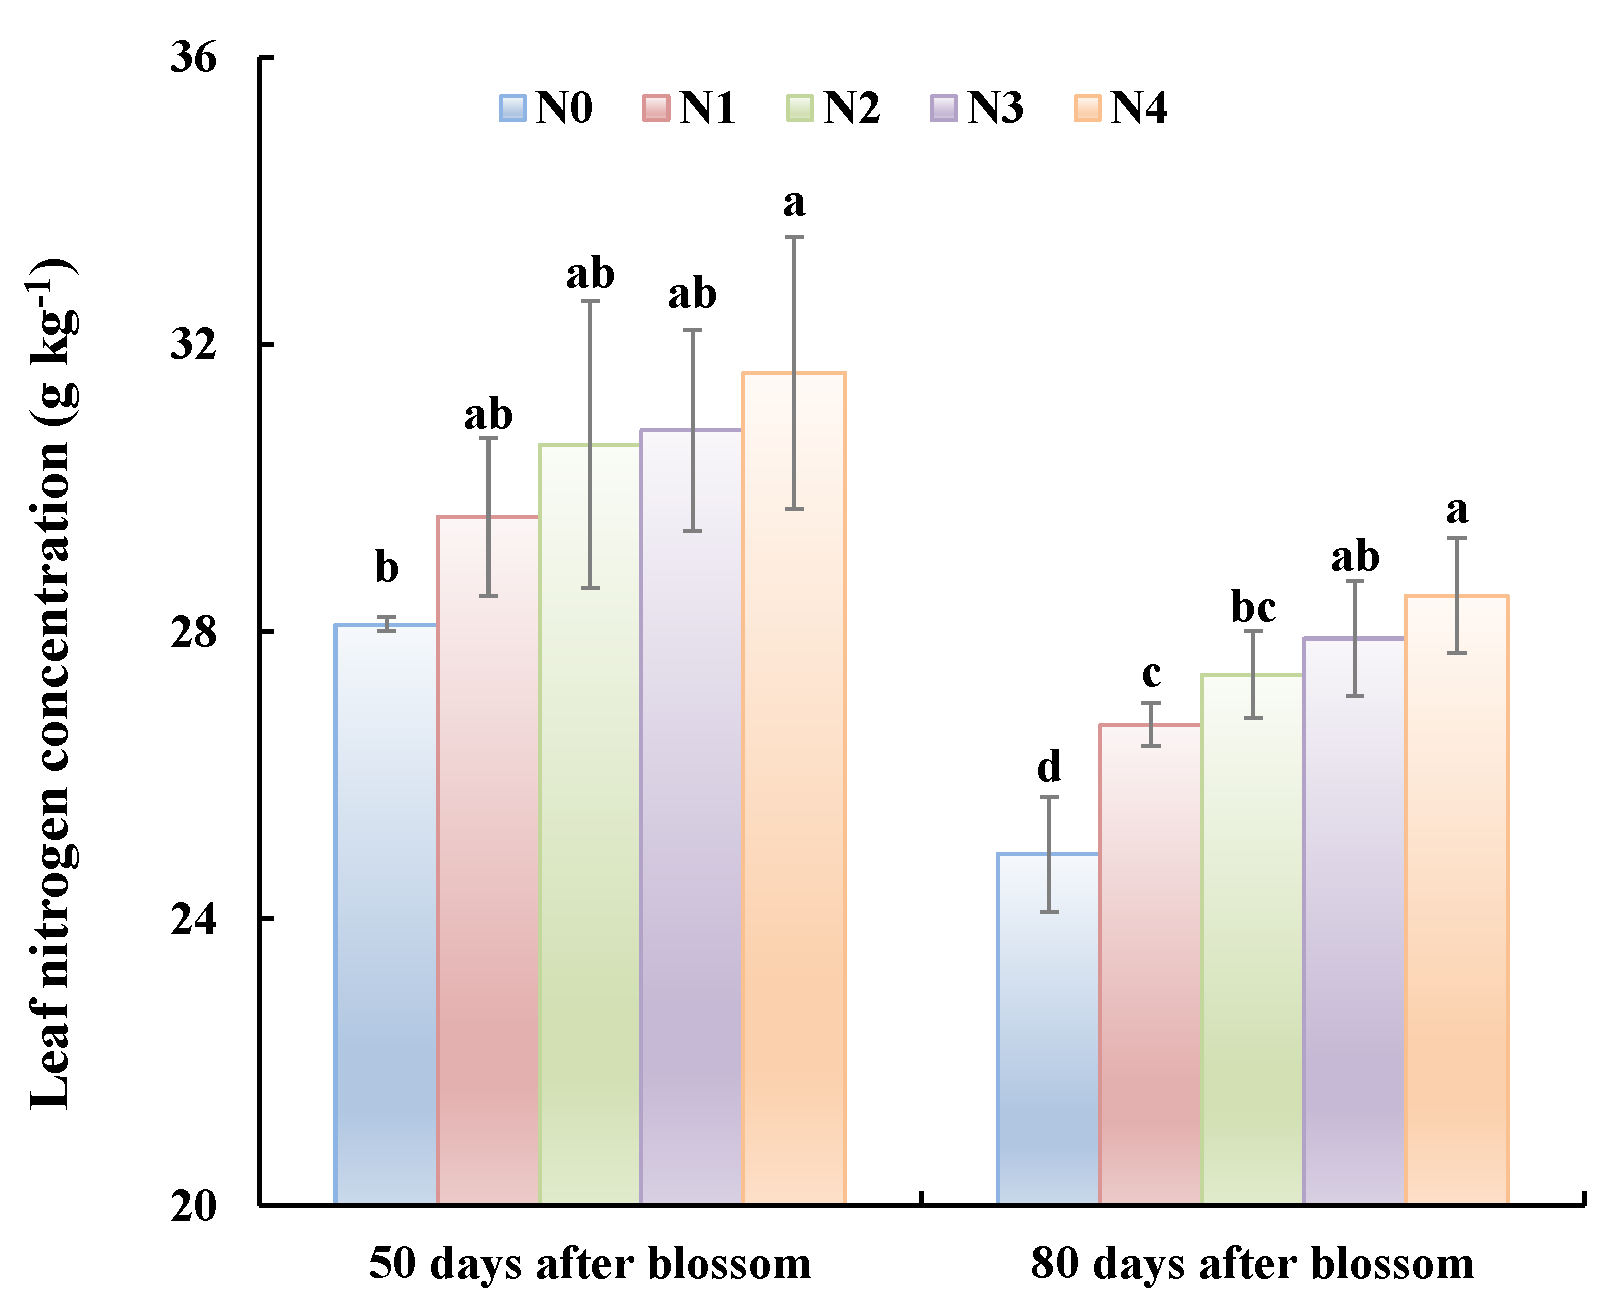
Although the pear trees did not bear fruit in 2015, leaf N concentrations from the 50 DAB to 80 DAB were decreasing with the vegetative growth (Figure 2). Leaf N concentration of 80 DAB was significantly lower than that of 50 DAB for all treatments. Among treatments, the leaf N concentrations were significantly different depending on N application rates (N4 > N3 > N2 > N1 > N0).
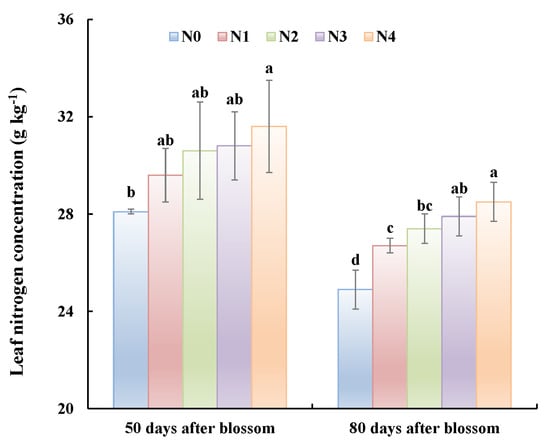
Figure 2.
Nitrogen concentration in leaves from trees under different treatments. Measurements were taken 50 days after bloom and 80 days after bloom in the first year of the experiment (2015). Common letters indicate that data are not significantly different between treatments at p < 0.05.
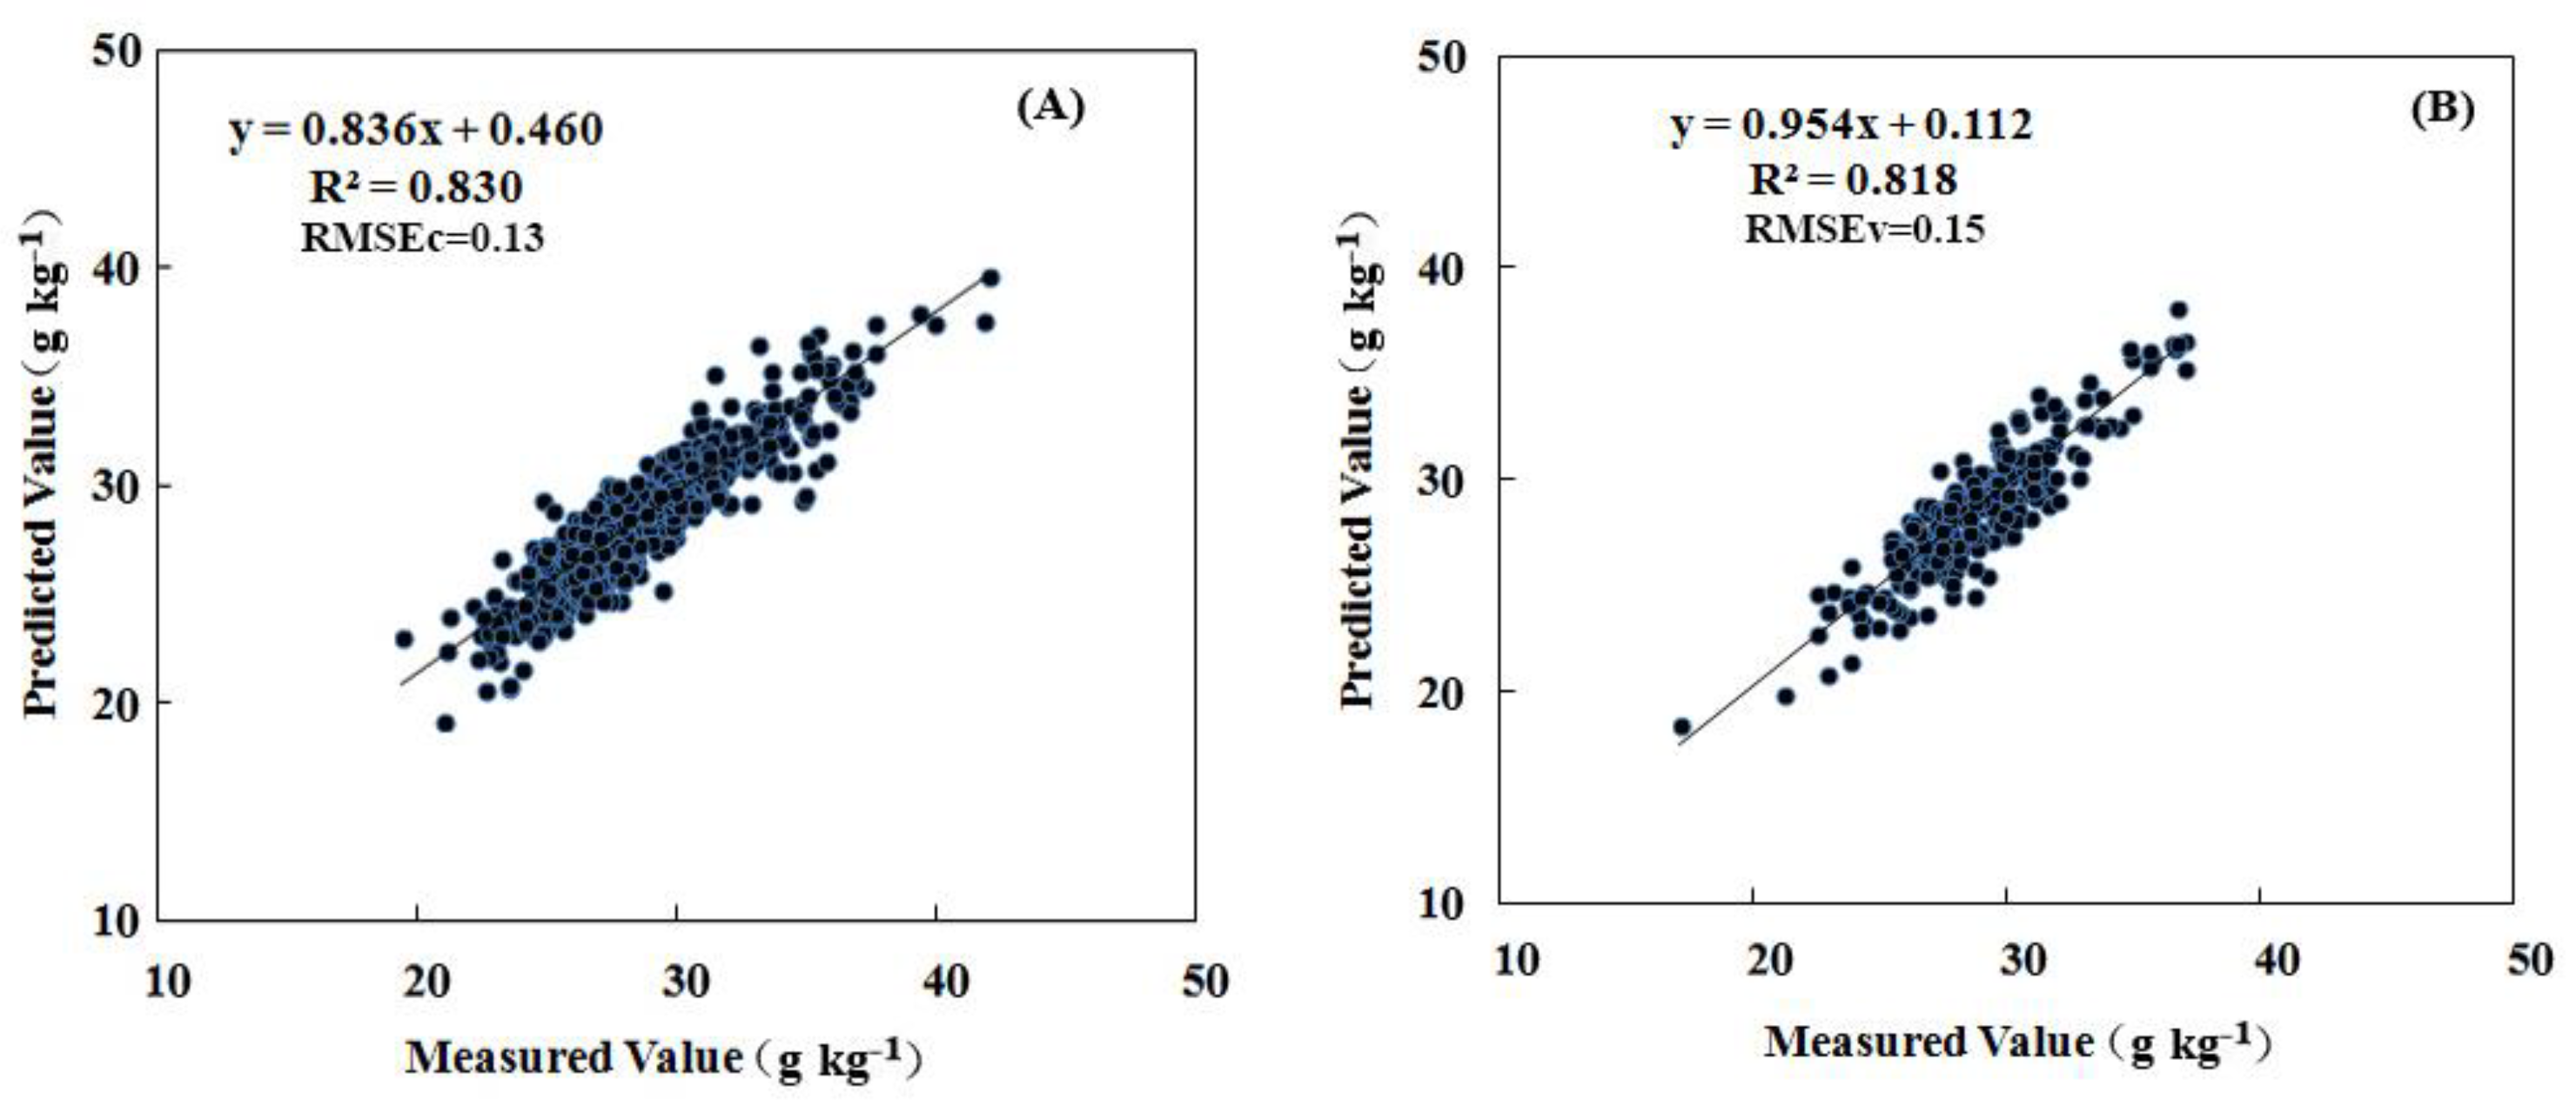
The association between leaf nitrogen concentration and spectral measurements was established using leaf samples collected in May and July (50 and 80 DAB) of 2015. The modeling procedure as expressed in the materials and methods were conducted one by one (Figure 1). Principal component analysis (PCA) was applied to raw spectral data to discriminate the outliers throughout the calibration and validation samples. Before modeling with all the samples, PCA was used to identify “outliers” in the software of “Tasks- Analyze-Principal Component Analysis”. The outliers were automatically selected by the bottom of “mark outliers” in the menu bar of the software (Figure S1). We have retrospect the outliers (only two outliers in the whole samples) were samples numbered “680 and 681”, which were sampled just before the spectral acquisition interruption because of low battery warning. These outlier samples with lower reflectance in all bands for the weakening incident ray (Figure S2) were removed. Then, area normalization and moving average smoothing with 3 “segment size” in the Unscrambler X 10.3 (Camo Software AS, Oslo, Norway) were applied to deal with the raw spectral data for improving the modeling accuracy according to our previous study (Figure S3). The partial least square regression (PLSR) was used to model the relationship between the leaf spectra and the leaf nitrogen concentrations. Samples were randomly divided into a calibration set (n = 780) and a validation set (n = 230) by the Kennard–Stone algorithm (Table 2). In the modeling procedure, the leave-one-out cross-validation will be used to improve the coefficient of determination as well as decrease the errors by adjusting the factor number (initial maximum was 20). The Modeling scenarios with different steps (including modeling with limited regions and preferred pretreatment methods) were shown in the Table 3. The R2 of calibration by wavelength subsets of visible and long-wave near infrared region, and the short-wave near infrared region were 0.66 and 0.76, respectively. The final factor number of the calibration with all bands pretreated by normalization was set as 14 by the leave-one-out cross-validation, which had a good coefficient of determination for the calibration of 0.83 (Figure 3A), and for the validation of 0.82. The mean relative error was less than 5% (Figure 3B). The model therefore reliably predicts N levels based on leaf reflectance.

Table 2.
Statistical values of pear leaf N concentrations for modeling and validation.

Table 3.
Modeling results of partial least squares regression with different regions, pretreatments.
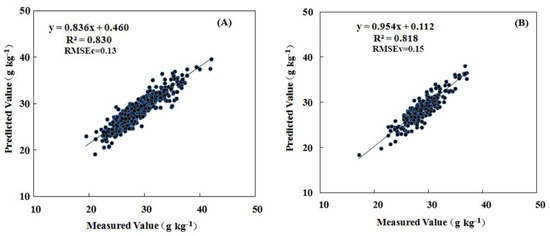
Figure 3.
Measured vs. predicted N concentration. (A) calibration of model (n = 780). (B) validation of model (n = 230). The lines were defined using partial least squares (PLS) regression.
3.2. Predicted Leaf Nitrogen Concentration and Calculation of Topdressing
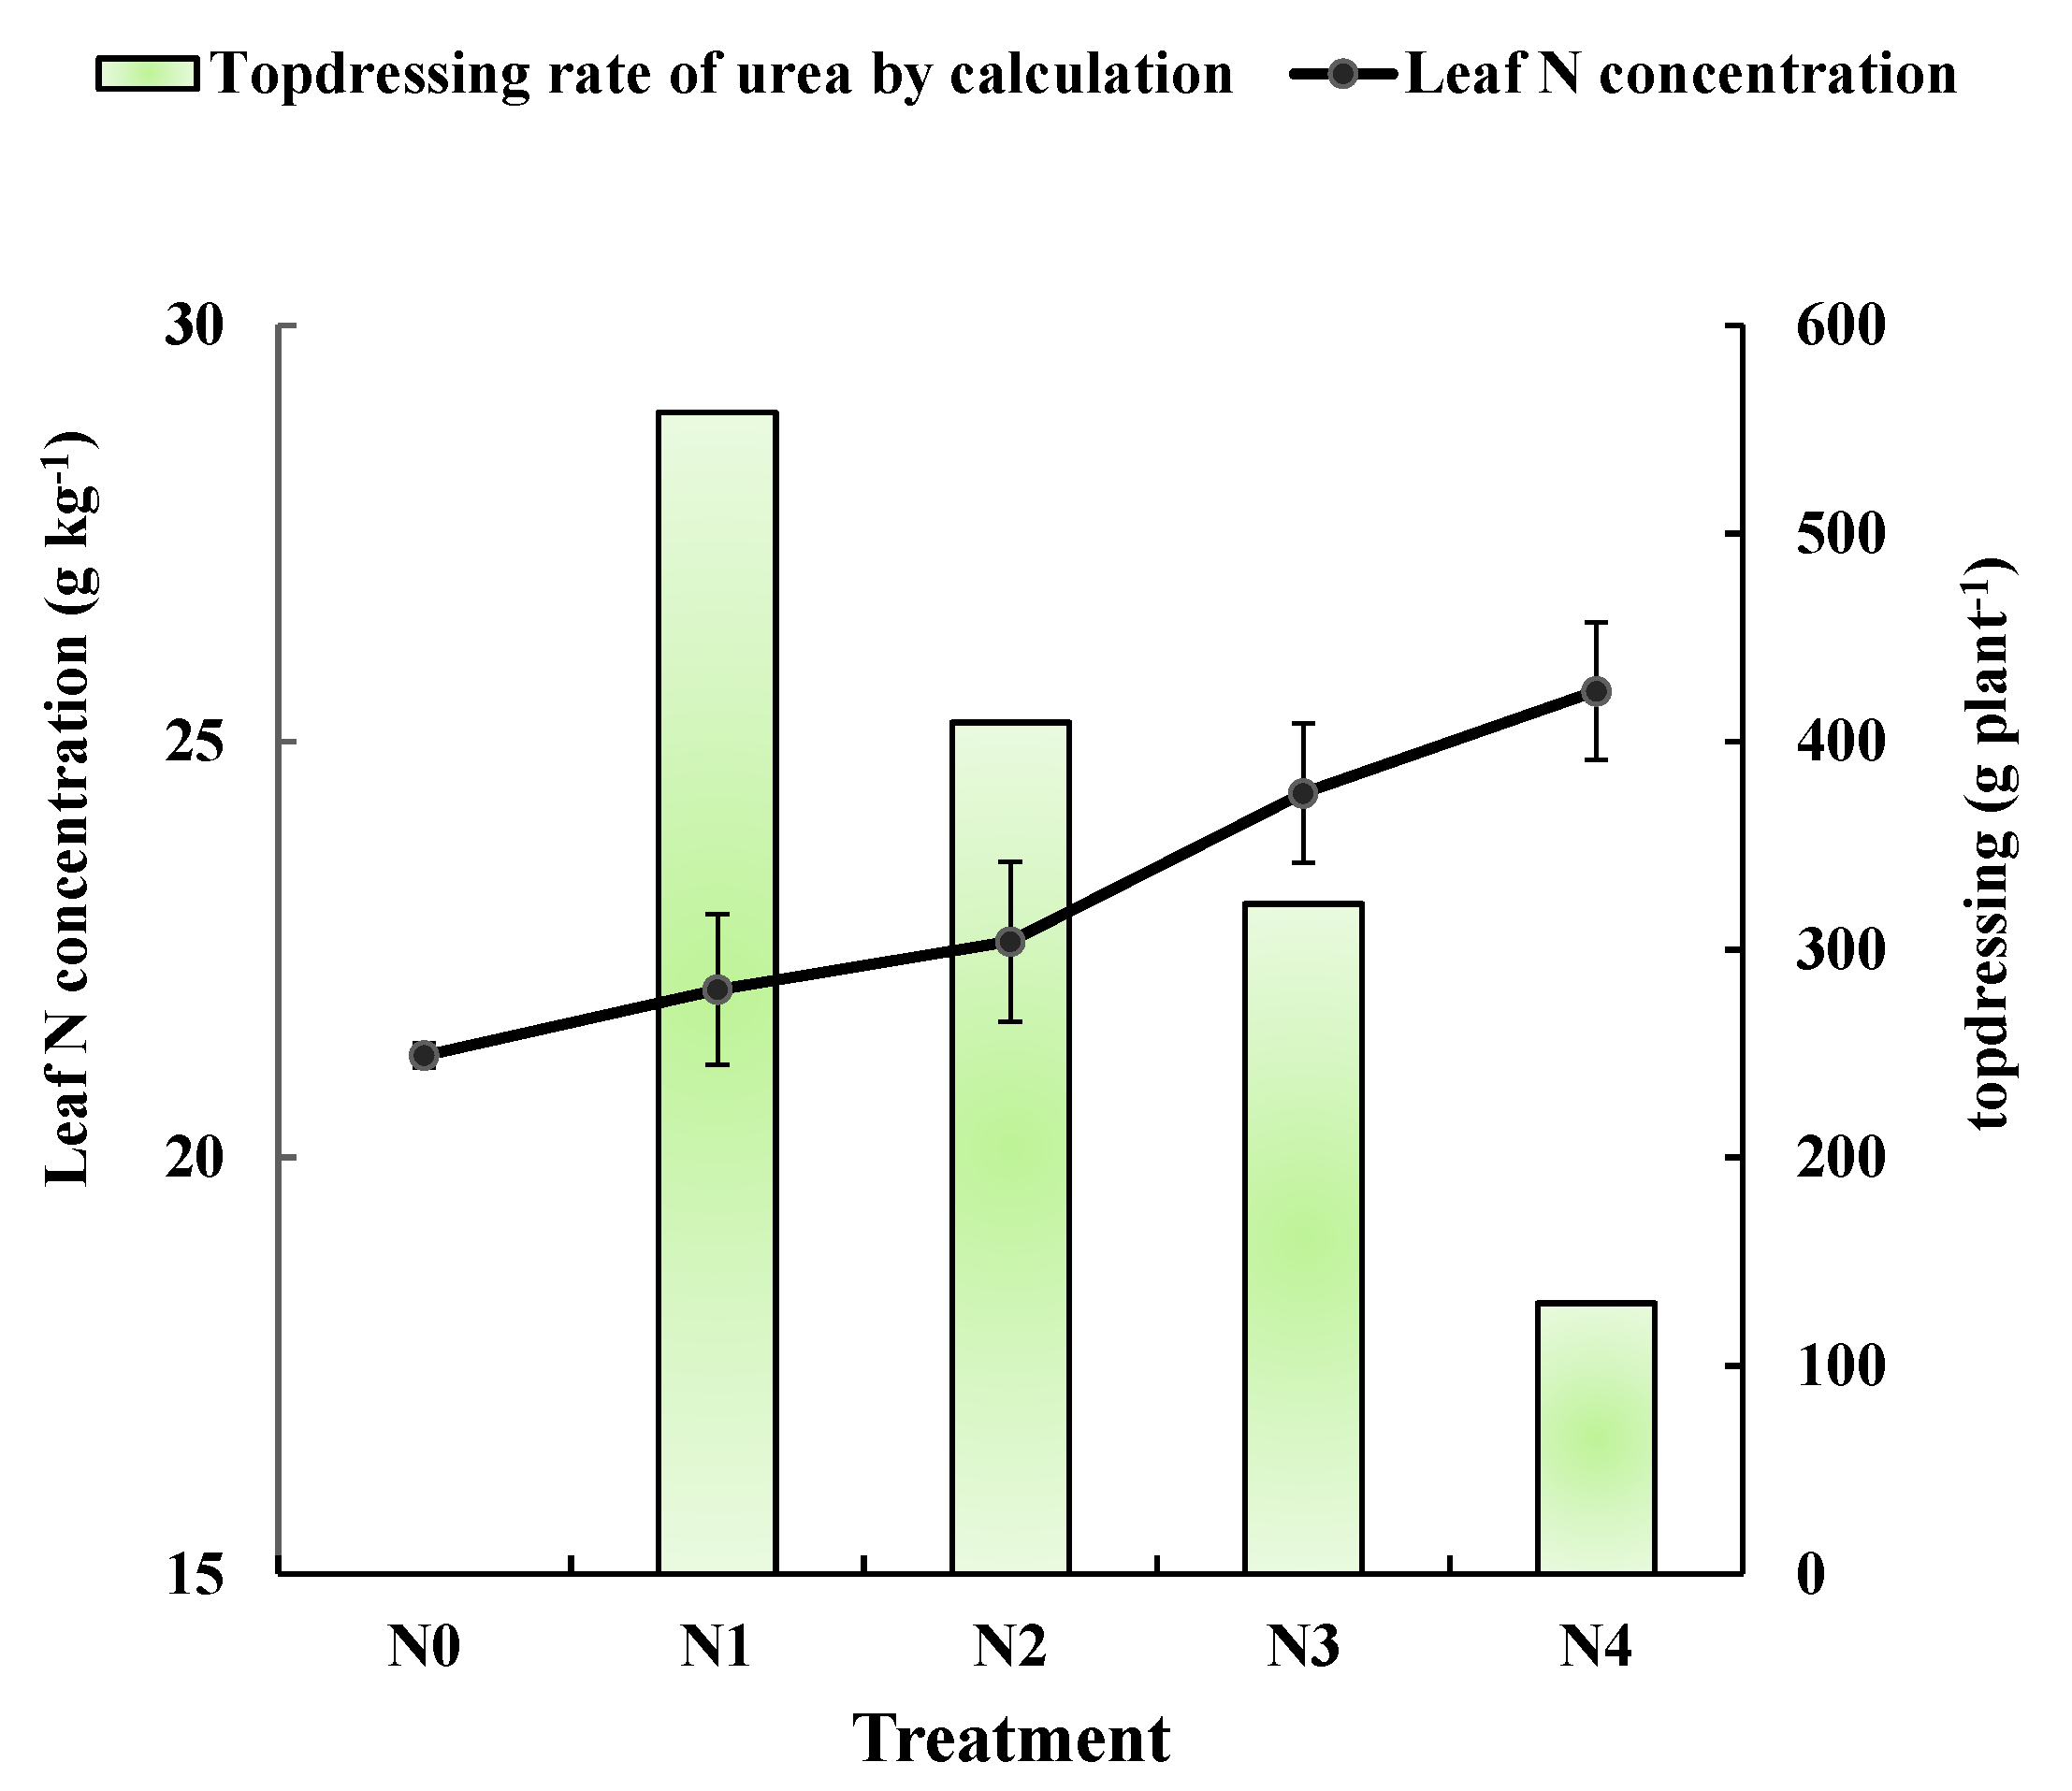
The average leaf nitrogen concentrations were shown for pear trees that received different controlled N application rates in the second year of the experiment (Figure 4). Measurements were taken at the 50 days after bloom. As expected, leaf nitrogen concentration was higher in trees receiving greater amounts of N. However, all concentrations were less than 27 g·kg−1, which is the reference value in during the 50 and 80 days after bloom. To calculate the N fertilization rate based on leaf N concentration and the revised N balance formula, the additional statistical parameters were investigated and recorded in the field, including fruit and branch number in each treatment (Table 4). The fruit number of N0 treatment was significantly lower than that of both controlled and regulatory treatments. Figure 4 also shows the N application rates for the regulatory treatments. The amounts were calculated using the fertilization formula and are listed in Table 5. The calculated regulatory applications are inversely proportional to leaf N concentration. It makes sense that pear trees with high leaf N concentrations should be applied less regulatory nitrogen, and trees with low leaf N concentrations should be applied more regulatory nitrogen.
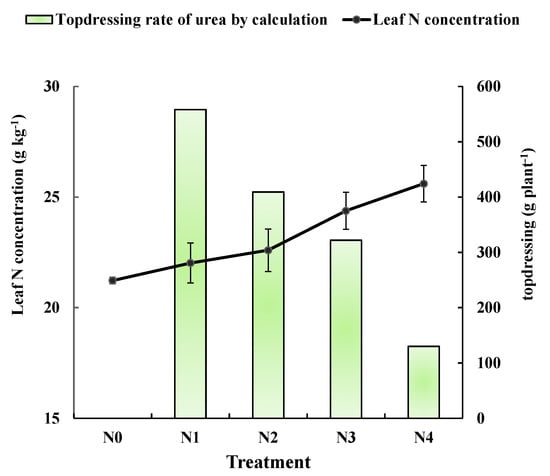
Figure 4.
Leaf nitrogen concentrations determined in 2016 from spectroscopic analysis of leaves from trees receiving different controlling treatments. Points on the black line are the average leaf nitrogen concentration of N0, N1, N2, N3, and N4 (21.2, 22.0, 22.6, 24.4 and 25.6 g·kg−1, respectively). The green column were the urea topdressing rates calculated using the fertilizer formula.

Table 4.
Branches and fruit parameters of tested pear trees.

Table 5.
Details of nitrogen application rates for regulatory treatments.
3.3. Leaf Nitrogen Concentration at Maturity
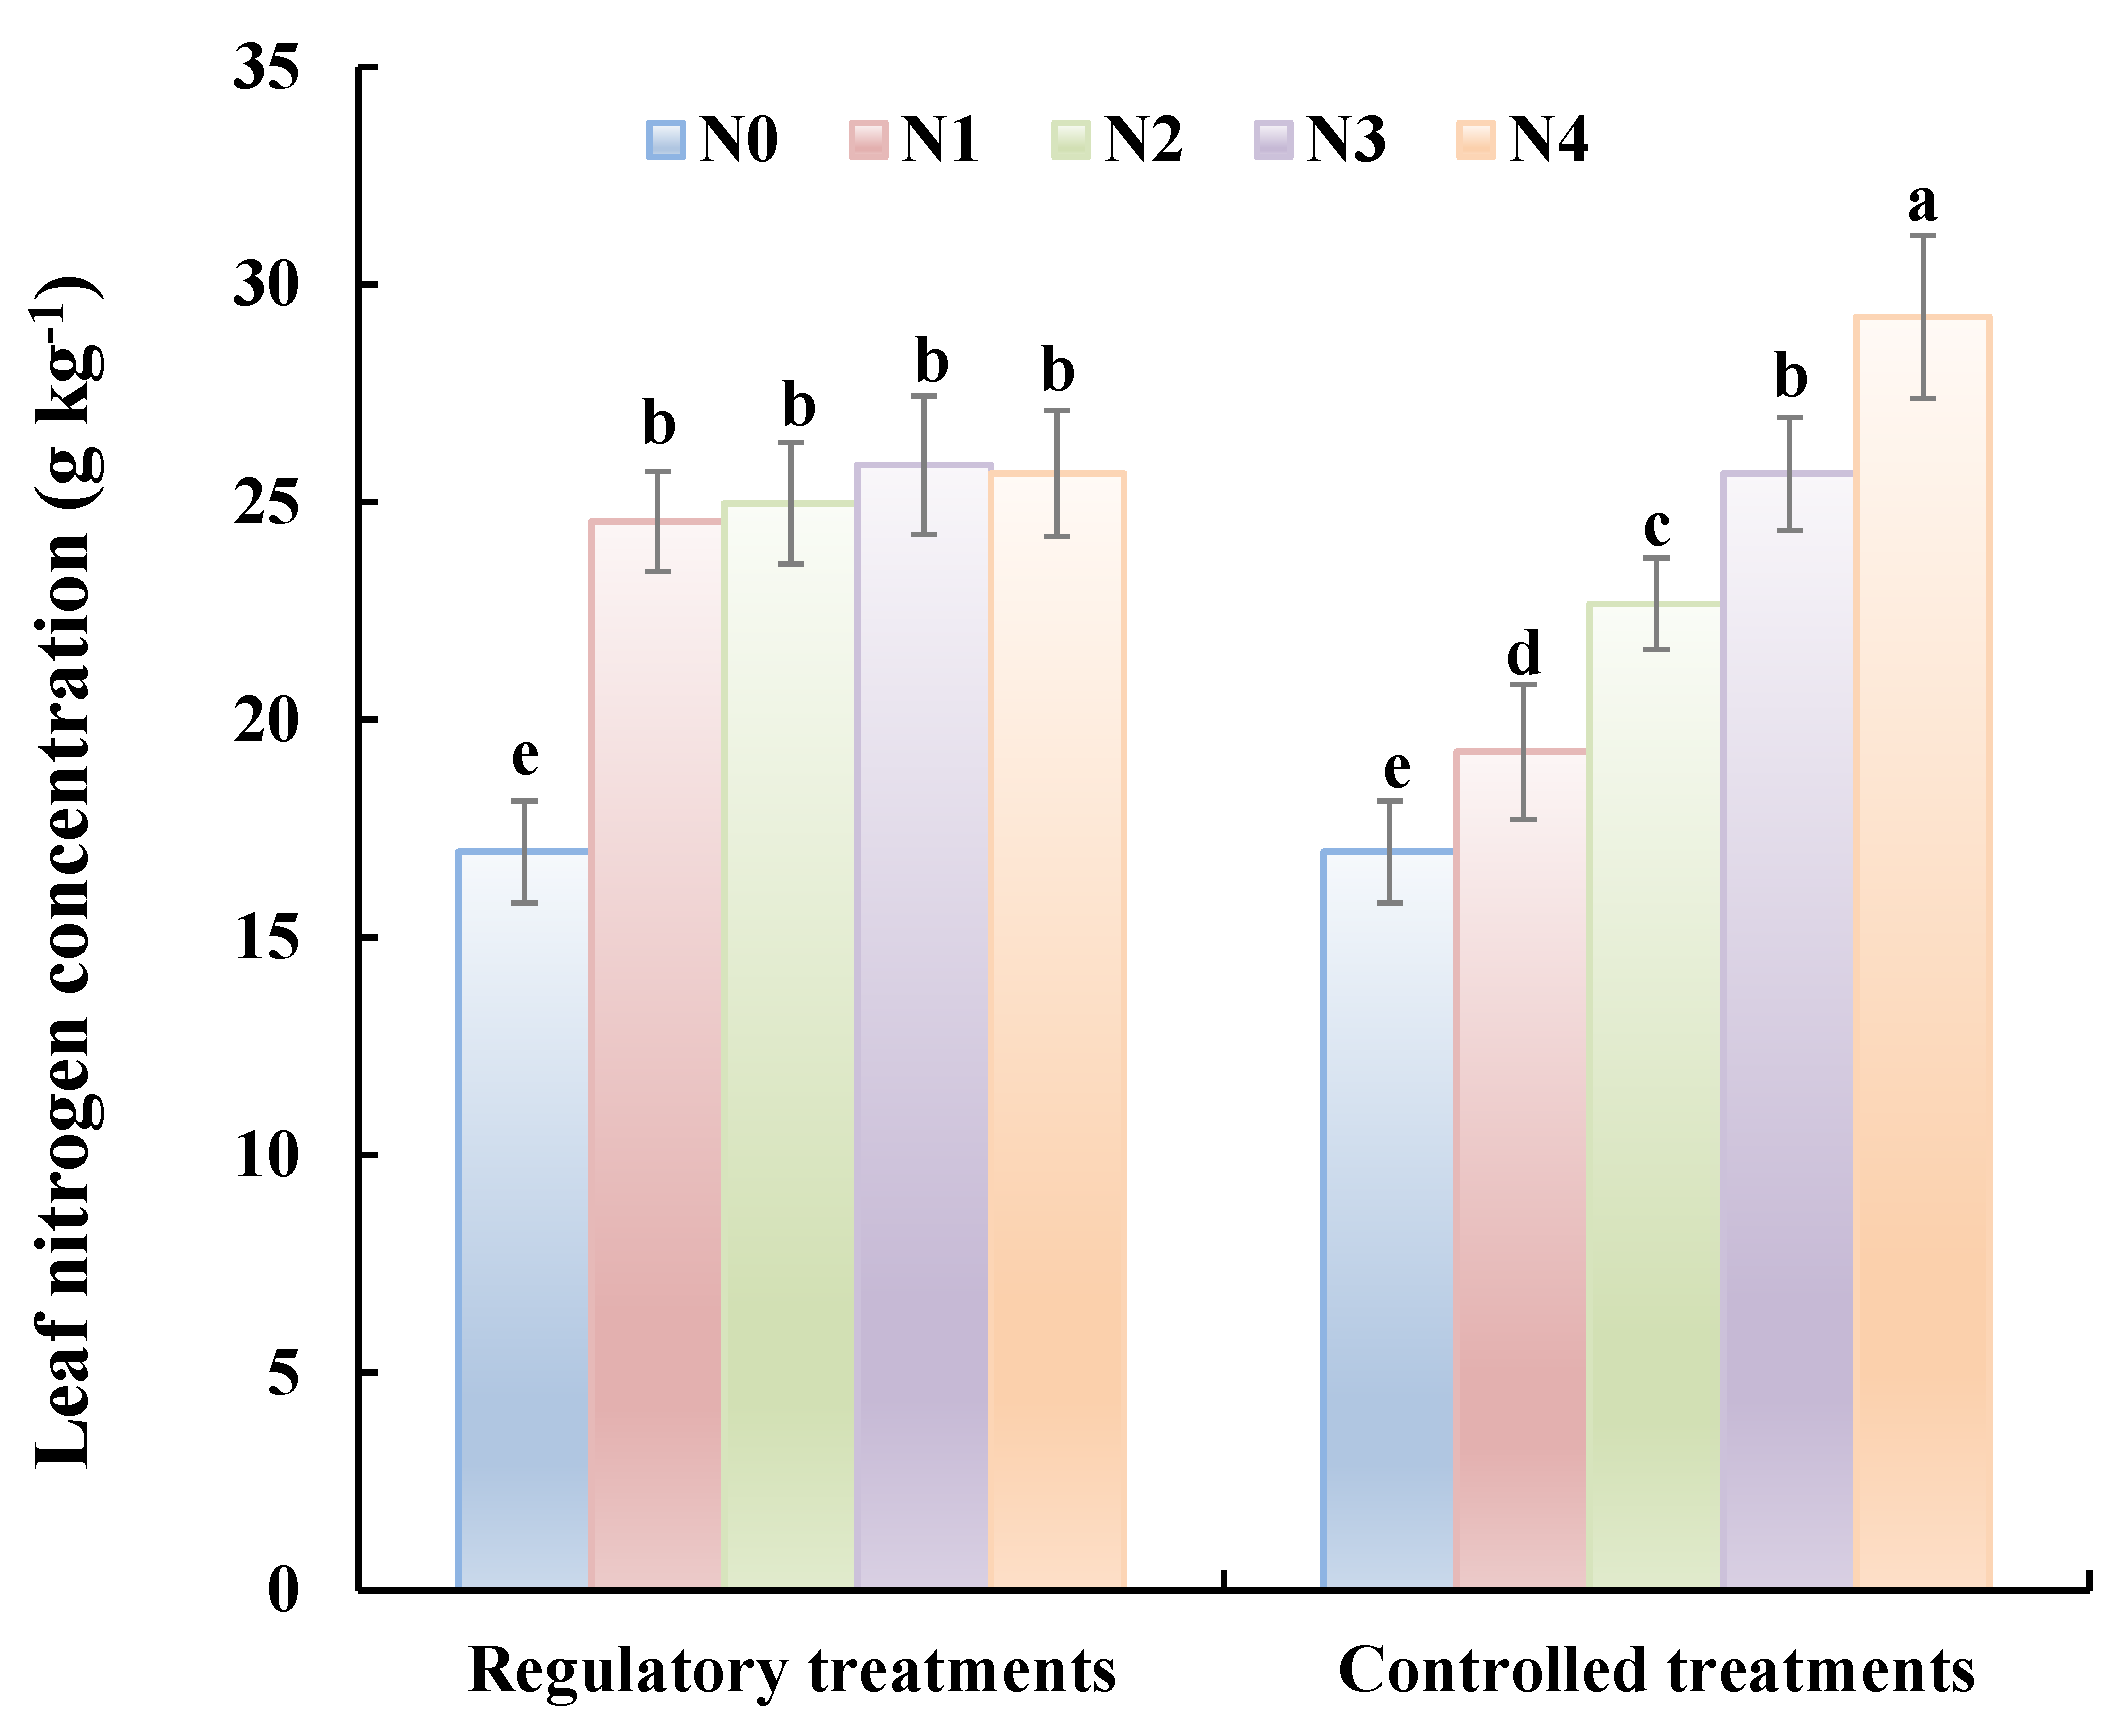
Two months after the application of the regulatory treatment (i.e., at fruit maturity), leaf nitrogen concentrations were determined for trees receiving the controlled and regulatory treatments (Figure 5). For the controlled treatments, nitrogen concentration in the leaves increases as the N application rate increases, and there are significant differences in concentration amongst the treatments. In contrast, nitrogen concentrations in leaves from trees receiving the regulatory treatments tended to be similar across treatments and were 47% higher than for the N0 treatments. The results show that the low leaf nitrogen concentrations conferred by the insufficient basal fertilizer treatments can be increased significantly by applying an appropriate topdressing, as calculated using the predicted leaf nitrogen concentration and the fertilization formula.
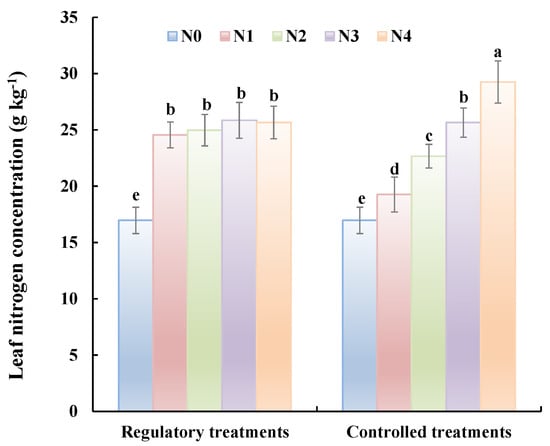
Figure 5.
Leaf nitrogen concentrations for trees receiving different treatment at fruit maturity in 2016. For the controlled treatments, leaf N nitrogen concentrations increases as the N application rate increases, and there are significant differences in concentration amongst the treatments. In contrast, leaf N concentrations from trees receiving the regulatory treatments tended to be similar across treatments.
3.4. Effects of Controlled and Regulatory N Application Rates on Fruit Weight and Yield
Single fruit weight and yield both increased with higher N application rates, and both were significantly higher for trees receiving the regulatory treatments (Table 6). The fruit weight observed with regulatory treatment Nr1 was significantly higher than that for the controlled treatment of N1. However, there were no significant differences between Nr2, Nr3, Nr4, N2, N3, and N4. Compared with the controlled treatments of N1 and N2, Nr1 and Nr2 yields increased significantly by 26% and 23%, respectively. There was no significant difference in yields for Nr3 and N3, while the Nr4 yield was significantly lower than for N4. The results of the partial factor productivity of nitrogen (PFP-N) in each treatment were shown in Table 5. Although the yield of Nr4 was significantly lower than that of N4, the PFP-N of Nr4 was higher than the N4.

Table 6.
Effects of different nitrogen application rates on single fruit weight, yields, and the nitrogen partial factor productivity (PFP-N).
3.5. Effects of Controlled and Regulatory N Application Rates on Fruit Quality
Fruit firmness, under either the controlled or the regulatory treatments, was lower than that of the N0 (Table 7). However, there was no significant difference in fruit firmness amongst the treatments. For trees receiving the regulatory treatments, soluble solids content was significantly higher than for trees of controlled treatments, with the N3 treatment exhibiting the maximum value. The transverse diameter of pear fruit with the Nr1 treatment was significantly higher than for the N1 treatment. The vertical diameters of pear fruits with regulatory treatments Nr1, Nr2, and Nr3 were significantly higher than diameters observed with the controlled treatments N1, N2, and N3.

Table 7.
Effects of different nitrogen application rates on fruit quality.
4. Discussion
Non-destructive monitoring of leaf nitrogen concentration, as well as the corresponding ability to precisely manage N application, is likely to be essential for improving pear production. In this report, we describe an experiment in which different amounts of N were applied over a 2-year period in a pear orchard. Non-destructive measurements of N, acquired using leaf reflectance, were used to determine N application amounts in the second year. A partial least-squares regression was used to establish a model relating leaf nitrogen concentration (LNC) to leaf reflectance with the wavelengths from 350 to 2500 nm. An algorithm that predicts leaf nitrogen concentration for a given fertilizer input was used to calculate the amount of N that was applied in the second year. In this study, the R2 of calibration by wavelength subsets of visible and long-wave near infrared region (VIS-NIR) and the short-wave near infrared region (SWIR) were 0.66 and 0.76, respectively. The SWIR was more sensitive to leaf N concentrations than that of VIS-NIR, due to the physiological link of N with proteins (Feret et al., 2021), which show better retrieval in this wavelength domain [24]. The PLSR is modeled with a parameter named “Factor” (also called the “Latent Variables”), which describes variance in both the independent Y and dependent variables X composed of different X loadings (including all bands), to maximize the covariance described by the model. The modeling accuracy by the PLSR method will be cumulated by the increment of factor number and stopped with the stable platform (Figure S4). An appropriate model should select the proper “Factor number” with higher R2 and lower RMSE, and the leave-one-out cross-validation [25]. PLS regression with all bands (R2 = 0.81) was better than the limited regions (R2 = 0.66–0.76). The coefficients weights for models (X loadings) including both the VIS-NIR and the SWIR wavelengths (Figure S5). This result was consistent with our previous study. PLSR model with the wavelengths from 350 to 2500 nm for the LNC determination were proven to be better than the vegetation indices (R2 = 0.4) calculated by two bands, the stepwise multiple linear regression (R2 = 0.75) calculated by several sensitive bands [25]. The R2 of cross validation by PLSR with several sensitive ranges ranged from 0.83–0.93 versus the R2 of cross validation with all bands was 0.95 [26]. Raw spectral data can also be applied directly in the software to modeling the leaf nitrogen concentrations. However, as reported by the previous study, the modeling accuracy using raw spectra pretreated by normalization is higher than the only raw spectra data [25,26]. In this study, the modeling accuracy using raw spectra pretreated by normalization (R2 = 0.83) was higher than the only raw spectra data (R2 = 0.80). In this case, the pretreatment named “normalization” is a requirement for this kind of application. In addition, the tested pear trees were 5-year-old which were sensitive to the nitrogen application both in vegetative and reproductive growth. Therefore, the accuracy of predicted LNC is critical in this experiment, in which we tried our best to improve the modeling accuracy by all bands and better pretreatments selection. As for the scenario that managers only have a spectrometer with limited bands, we recommend getting the balance between the accuracy of predicted LNC and the required accuracy LNC for topdressing calculated. If the required accuracy of topdressing calculation is not that critical, the less accuracy of LNC determined by limited wavelengths or raw spectra can be acceptable. Compared to the vegetation index and other empirical methods, the PLSR performed well in modeling and easy to be realized in the user-friendly software. Recent years, the physical-based method such as radiation transfer model have developed their own operation interface systems on the Matlab, which can be easily utilized by the users without code written [44]. The modeling performances in the determination of pear leaf nitrogen concentration should be further tried [45].
The regulatory treatments that were defined using the algorithm were particularly effective for low amounts of N. Compared with the controlled applications N1 and N2, Nr1 and Nr2 significantly increased yield by 26% and 23%, respectively. No significant difference in yield was observed between Nr3 and N3, while Nr4 produced a lower yield than N4. The partial factor productivity of nitrogen in Nr4 was higher than the N4. Fruit firmness was lower under both the controlled and regulatory treatments than under the N0. However, there were no significant differences in fruit firmness across treatments. The soluble solids content under the regulatory treatments was significantly higher than under the N0. The soluble solids content of the controlled treatments was found increase with the increase of N application rate first then reduction with the increase of N application rate, the maximum value was found in the N3 treatment. Compared with N0, the transverse and longitudinal diameter of pear fruits were significantly increased by both regulatory treatments and controlled treatments. Controlled under nitrogen treatment, the highest N3 treatment of mature fruit soluble solids, high nitrogen treatment quality is slightly lower, which is consistent with a report by Chen et al. (2010) that a proper quantity of nitrogen fertilizer can increase fruit soluble solid content in Housui pears [30]. In contrast, a lower content of total soluble sugar, due to a decrease in fructose and glucose, was observed when nitrogen was excessive [31,46]. Compared with the controlled treatments, regulatory nitrogen fertilization did not appear to affect soluble solids. The amount of potassium may need to be adjusted along with the amounts of nitrogen applied in each regulatory treatment. When leaf nitrogen is low, the amount of regulatory nitrogen applied is relatively high, and potassium should be increased in proportion to the increase in N fertilizer [47].
5. Conclusions
In conclusion, proper application of topdressing as calculated by visible/near infrared spectroscopy can reduce the negative effects caused by N imbalance on yield and fruit quality, especially under conditions of nitrogen deficiency, and improves the nitrogen use efficiency in nitrogen surplus. In addition, judicious N management that the N prediction model established using the nondestructive visible/near infrared spectroscopy can timely reduce the N fertilizer application and be environmentally friendly under conditions of nitrogen surplus.
Supplementary Materials
The following are available online at https://www.mdpi.com/2072-4292/13/5/927/s1. Figure S1 the schematic diagram of spectral acquisition by the plant probe and leaf clip (picture was adapt from Wang et al., 2017). Figure S2 outliers were automatically by the button of “mark outliers” in the menu bar of the software (a). We have retrospect the outliers named “680 and 681” in the notebook and compared the reflectance with the same leaf nitrogen concentration. Sample “680 and 681” were measured just before the spectral acquisition interruption because of low battery warning. These outlier samples with lower reflectance in all bands for the weakening incident ray (b) were not easy perceptible. Figure S3 raw spectral data (a) versus the normalized data (b). Figure S4 PLSR modelling accuracy cumulated by the increment of factor number and stopped with the stable platform. Figure S5 X-loading weights of the PLSR model (the factor number was 14) calculated by all bands and normalization pretreatments.
Author Contributions
Conceptualization, Y.X. and J.W.; methodology, Y.X. and J.W.; data curation, J.W.; writing—original draft preparation, J.W.; writing—review and editing, C.D. and X.S.; funding acquisition, Y.X., C.D. and J.W. All authors have read and agreed to the published version of the manuscript.
Funding
This research was funded by China Agriculture Research System (CARS-28-10); Key Research and Development Program of Jiangsu Province (BE2018389); China Postdoctoral Science Foundation Grant No. 2019M653818XB, China; Chongqing Special Postdoctoral Science Foundation Grant No. XmT2018059; Science and Technology Project of Chongqing Urban Administration (2019-23), China. The APC was funded by China Agriculture Research System (CARS-28-10), and Key Research and Development Program of Jiangsu Province (BE2018389).
Acknowledgments
We appreciated the assistance in the field experiments from Guorong Shen of Nanjing Agricultural University.
Conflicts of Interest
The authors declare no conflict of interest.
References
- Yang, Y.; Yao, G.; Yue, W.; Zhang, S.; Wu, J. Transcriptome profiling reveals differential gene expression in proanthocyanidin biosynthesis associated with red/green skin color mutant of pear (Pyrus communis L.). Front. Plant Sci. 2015, 6, 795. [Google Scholar] [CrossRef]
- Song, Y.; Fan, L.; Chen, H.; Zhang, M.; Ma, Q.; Zhang, S.; Wu, J. Identifying genetic diversity and a preliminary core collection of Pyrus pyrifolia cultivars by a genome-wide set of SSR markers. Sci. Hortic. 2014, 167, 5–16. [Google Scholar] [CrossRef]
- Quartieri, M.; Millard, P.; Tagliavini, M. Storage and remobilization of nitrogen by pear (Pyruscommunis L.) trees as affected by timing of N supply. Eur. J. Agron. 2002, 17, 105–110. [Google Scholar] [CrossRef]
- Zhang, Y.; Lei, H.; Zhao, W.; Shen, Y.; Xiao, D. Comparison of the water budget for the typical cropland and pear orchard ecosystems in the North China Plain. Agric. Water Manag. 2018, 198, 53–64. [Google Scholar] [CrossRef]
- Lu, S.; Yan, Z.; Chen, Q.; Zhang, F. Evaluation of conventional nitrogen and phosphorus fertilization and potential environmental risk in intensive orchards of north China. J. Plant Nutr. 2012, 35, 1509–1525. [Google Scholar] [CrossRef]
- Duarte, L.; Jordão, P.; Calouro, F.; Sousa, R. Management of nitrogen and potassium fertilizer inputs on fertigated pear orchards and its influence on yield and fruit quality. Acta Hortic. 2010, 868, 307–312. [Google Scholar] [CrossRef]
- Sugar, D.; Righetti, T.L.; Sanchez, E.E.; Khemira, H. Management of Nitrogen and Calcium in Pear Trees for Enhancement of Fruit Resistance to Postharvest Decay. HortTechnology 1992, 2, 382–387. [Google Scholar] [CrossRef]
- Kou, X.; Wu, M.; Li, L.; Wang, S.; Xue, Z.; Liu, B.; Fei, Y. Effects of CaCl2 dipping and pullulan coating on the development of brown spot on ‘Huangguan’ pears during cold storage. Postharvest Biol. Technol. 2015, 99, 63–72. [Google Scholar] [CrossRef]
- Rubio-Covarrubias, O.A.; Brown, P.H.; Weinbaum, S.A.; Johnson, R.S.; Cabrera, R.I. Evaluating foliar nitrogen compounds as indicators of nitrogen status in Prunus persica trees. Sci. Hortic. 2009, 120, 27–33. [Google Scholar] [CrossRef]
- Wang, X.; Feng, A.; Wang, Q.; Wu, C.; Liu, Z.; Ma, Z.; Wei, X. Spatial variability of the nutrient balance and related NPSP risk analysis for agro-ecosystems in China in 2010. Agric. Ecosyst. Environ. 2014, 193, 42–52. [Google Scholar] [CrossRef]
- Hamdi, E.; Javier, A.; Anunciacion, A. Assessment of nutrient removal in bearing peach trees (prunus persical. batsch) based on whole tree analysis. Plant Soil 2013, 369, 421–437. [Google Scholar]
- Zhang, Y.; Shen, Y.; Xu, X.; Sun, H.; Li, F.; Wang, Q. Characteristics of the water–energy–carbon fluxes of irrigated pear (Pyrus bretschneideri Rehd) orchards in the North China Plain. Agric. Water Manag. 2013, 128, 140–148. [Google Scholar] [CrossRef]
- Duan, Y.-H.; Shi, X.-J.; Li, S.-L.; Sun, X.-F.; He, X.-H. Nitrogen Use Efficiency as Affected by Phosphorus and Potassium in Long-Term Rice and Wheat Experiments. J. Integr. Agric. 2014, 13, 588–596. [Google Scholar] [CrossRef]
- Neto, C.B.; Carranca, C.; Clemente, J.; De Varennes, A. Assessing the nitrogen nutritional status of young non-bearing ‘rocha’ pear trees grown in a mediterranean region by using a chlorophyll meter. J. Plant Nutr. 2011, 34, 627–639. [Google Scholar] [CrossRef]
- Wang, W.; Yao, X.; Yao, X.F.; Tian, Y.C.; Liu, X.J.; Ni, J.; Cao, W.X.; Zhu, Y. Estimating leaf nitrogen content with three-band vegetation indices in rice and wheat. Field Crops Res. 2012, 129, 90–98. [Google Scholar] [CrossRef]
- Gerber, F.; Marion, R.; Olioso, A.; Jacquemoud, S.; Da Luz, B.R.; Fabre, S. Modeling directional–hemispherical reflectance and transmittance of fresh and dry leaves from 0.4 μm to 5.7 μm with the PROSPECT-VISIR model. Remote Sens. Environ. 2011, 115, 404–414. [Google Scholar] [CrossRef]
- Verrelst, J.; Camps-Valls, G.; Muñoz-Marí, J.; Rivera, J.; Veroustraete, F.; Clevers, J.; Moreno, J. Optical remote sensing and the retrieval of terrestrial vegetation bio-geophysical properties—A review. ISPRS J. Photogramm. Remote Sens. 2015, 108, 273–290. [Google Scholar] [CrossRef]
- Berger, K.; Verrelst, J.; Féret, J.-B.; Wang, Z.; Wocher, M.; Strathmann, M.; Danner, M.; Mauser, W.; Hank, T. Crop nitrogen monitoring: Recent progress and principal developments in the context of imaging spectroscopy missions. Remote Sens. Environ. 2020, 242, 111758. [Google Scholar] [CrossRef]
- Wang, Z.; Skidmore, A.K.; Darvishzadeh, R.; Heiden, U.; Heurich, M.; Wang, T. Leaf Nitrogen Content Indirectly Estimated by Leaf Traits Derived From the PROSPECT Model. IEEE J. Sel. Top. Appl. Earth Obs. Remote Sens. 2015, 8, 3172–3182. [Google Scholar] [CrossRef]
- Curran, P.J. Remote sensing of foliar chemistry. Remote Sens. Environ. 1989, 30, 271–278. [Google Scholar] [CrossRef]
- Kokaly, R.F.; Clark, R.N. Spectroscopic determination of leaf biochemistry using band-depth analysis of absorption features and stepwise multiple linear regression. Remote Sens. Environ. 1999, 67, 267–287. [Google Scholar] [CrossRef]
- Kokaly, R.F.; Asner, G.P.; Ollinger, S.V.; Martin, M.E.; Wessman, C.A. Characterizing canopy biochemistry from imaging spectroscopy and its application to ecosystem studies. Remote Sens. Environ. 2009, 113, S78–S91. [Google Scholar] [CrossRef]
- Berger, K.; Verrelst, J.; Féret, J.-B.; Hank, T.; Wocher, M.; Mauser, W.; Camps-Valls, G. Retrieval of aboveground crop nitrogen content with a hybrid machine learning method. Int. J. Appl. Earth Obs. Geoinf. 2020, 92, 102174. [Google Scholar] [CrossRef]
- Féret, J.-B.; Berger, K.; de Boissieu, F.; Malenovský, Z. PROSPECT-PRO for estimating content of nitrogen-containing leaf proteins and other carbon-based constituents. Remote Sens. Environ. 2021, 252, 112173. [Google Scholar] [CrossRef]
- Wang, J.; Shen, C.; Liu, N.; Jin, X.; Fan, X.; Dong, C.; Xu, Y. Non-Destructive Evaluation of the Leaf Nitrogen Concentration by In-Field Visible/Near-Infrared Spectroscopy in Pear Orchards. Sensors 2017, 17, 538. [Google Scholar] [CrossRef] [PubMed]
- Wang, J.; Zhao, H.; Shen, C.; Chen, Q.; Dong, C.; Xu, Y. Determination of Nitrogen Concentration in Fresh Pear Leaves by Visible/Near-Infrared Reflectance Spectroscopy. Agron. J. 2014, 106, 1867–1872. [Google Scholar]
- Ata-Ul-Karim, S.T.; Liu, X.; Lu, Z.; Zheng, H.; Cao, W.; Zhu, Y. Estimation of nitrogen fertilizer requirement for rice crop using critical nitrogen dilution curve. Field Crop. Res. 2017, 201, 32–40. [Google Scholar] [CrossRef]
- Hanlon, E.A.; Morgan, K.T.; Obreza, T.A.; Mylavarapu, R.S. Leaf Analysis in Citrus: Developments in Analytical Techniques. Adv. Citrus Nutr. 2012, 6, 81–87. [Google Scholar] [CrossRef]
- Suarez, L.; Berni, J.A.J. Spectral Response of Citrus and Their Application to Nutrient and Water Constraints Diagnosis. Adv. Citrus Nutr. 2012, 10, 125–141. [Google Scholar] [CrossRef]
- Chen, L.; Wu, T.; Zhang, S.L.; Yao, G.F.; Tao, S.T.; Jia, B.; Cao, H. Effects of nitrogen fertilizer on fruit quality and leaf physiological metabolism of Hosui pear. J. Fruit Sci. 2010, 27, 871–876. [Google Scholar]
- Carranca, C.; Brunetto, G.; Tagliavini, M. Nitrogen Nutrition of Fruit Trees to Reconcile Productivity and Environmental Concerns. Plants 2018, 7, 4. [Google Scholar] [CrossRef]
- Lukina, E.V.; Freeman, K.W.; Wynn, K.J.; Thomason, W.E.; Mullen, R.W.; Stone, M.L.; Solie, J.B.; Klatt, A.R.; Johnson, G.V.; Elliott, R.L.; et al. Nitrogen fertilization optimization algorithm based on in-season estimates of yield and plant nitrogen uptake. J. Plant Nutr. 2001, 24, 885–898. [Google Scholar] [CrossRef]
- Mulla, D.J. Twenty five years of remote sensing in precision agriculture: Key advances and remaining knowledge gaps. Biosyst. Eng. 2013, 114, 358–371. [Google Scholar] [CrossRef]
- Kitchen, N.R.; Sudduth, K.A.; Drummond, S.T.; Scharf, P.C.; Palm, H.L.; Roberts, D.F.; Vories, E.D. Ground-Based Canopy Reflectance Sensing for Variable-Rate Nitrogen Corn Fertilization. Agron. J. 2010, 102, 71–84. [Google Scholar] [CrossRef]
- Oliveira, L.F.; Scharf, P.C.; Vories, E.D.; Drummond, S.T.; Dunn, D.; Stevens, W.G.; Bronson, K.F.; Benson, N.R.; Hubbard, V.C.; Jones, A.S. Calibrating Canopy Reflectance Sensors to Predict Optimal Mid-Season Nitrogen Rate for Cotton. Soil Sci. Soc. Am. J. 2012, 77, 173–183. [Google Scholar] [CrossRef]
- Tagliavini, M.; Quartieri, M.; Millard, P. Remobilized nitrogen and root uptake of nitrate for spring leaf growth, flowers and developing fruits of pear (Pyrus communis L.) trees. Plant Soil 1997, 195, 137–142. [Google Scholar] [CrossRef]
- Saeys, W.; Mouazen, A.; Ramon, H. Potential for Onsite and Online Analysis of Pig Manure using Visible and Near Infrared Reflectance Spectroscopy. Biosyst. Eng. 2005, 91, 393–402. [Google Scholar] [CrossRef]
- Gómez, A.H.; He, Y.; Pereira, A.G. Non-destructive measurement of acidity, soluble solids and firmness of Satsuma mandarin using Vis/NIR-spectroscopy techniques. J. Food Eng. 2006, 77, 313–319. [Google Scholar] [CrossRef]
- Yin, C.-Y.; Zhang, H.-C.; Zhang, Q.; Wei, H.-Y.; Dai, Q.-G.; Huo, Z.-Y.; Xu, K.; Ma, Q.; Li, M.; Li, G.-Y. Preliminary Study on Parameters of Precise and Quantitative Nitrogen Appli-cation in Rice Varieties with Different Growth Period Durations. Acta Agron. Sin. 2010, 36, 1342–1354. [Google Scholar] [CrossRef]
- Buwalda, J.; Meekings, J. Seasonal accumulation of mineral nutrients in leaves and fruit of Japanese pear (Pyrus serotina Rehd.). Sci. Hortic. 1990, 41, 209–222. [Google Scholar] [CrossRef]
- Hou, C.; Zhang, S.; Jin, C.; Wu, J. Changing of Mineral Nutrition Distribution in “Cuguan Pear” Tree. Chin. Agric. Sci. Bull. 2012, 28, 173–178. (In Chinese) [Google Scholar]
- Park, D.S.; Tilahun, S.; Heo, J.Y.; Jeong, C.S. Quality and expression of ethylene response genes of ‘Daebong’ persimmon fruit during ripening at different temperatures. Postharvest Biol. Technol. 2017, 133, 57–63. [Google Scholar] [CrossRef]
- Wang, J.; Zhang, L.; He, X.; Zhang, Y.; Wan, Y.; Duan, S.; Xu, C.; Mao, X.; Chen, X.; Shi, X. Environmental mitigation potential by improved nutrient managements in pear (Pyrus pyrifolia L.) orchards based on life cycle assessment: A case study in the North China Plain. J. Clean. Prod. 2020, 262, 121273. [Google Scholar] [CrossRef]
- Verrelst, J.; Berger, K.; Rivera-Caicedo, J.P. Intelligent Sampling for Vegetation Nitrogen Mapping Based on Hybrid Machine Learning Algorithms. IEEE Geosci. Remote Sens. Lett. 2020, 99, 1–5. [Google Scholar] [CrossRef]
- Verrelst, J.; Malenovský, Z.; Van Der Tol, C.; Camps-Valls, G.; Gastellu-Etchegorry, J.-P.; Lewis, P.; North, P.; Moreno, J. Quantifying Vegetation Biophysical Variables from Imaging Spectroscopy Data: A Review on Retrieval Methods. Surv. Geophys. 2019, 40, 589–629. [Google Scholar] [CrossRef]
- Cheng, L.; Ma, F.; Ranwala, D. Nitrogen storage and its interaction with carbohydrates of young apple trees in response to nitrogen supply. Tree Physiol. 2004, 24, 91–98. [Google Scholar] [CrossRef]
- Zegbe, J.A.; Serna-Pérez, A.; Mena-Covarrubias, J. Mineral nutrition enhances yield and affects fruit quality of ‘cristalina’ cactus pear. Sci. Hortic. 2014, 167, 63–70. [Google Scholar] [CrossRef]
Publisher’s Note: MDPI stays neutral with regard to jurisdictional claims in published maps and institutional affiliations. |
© 2021 by the authors. Licensee MDPI, Basel, Switzerland. This article is an open access article distributed under the terms and conditions of the Creative Commons Attribution (CC BY) license (http://creativecommons.org/licenses/by/4.0/).

