Article

Twentieth and Twenty-First Century Water Storage Changes in the Nile River Basin from GRACE/GRACE-FO and Modeling

by
Emad Hasan
1,2,*,
Aondover Tarhule
3 and
Pierre-Emmanuel Kirstetter
4,5,6
1
Department of Geological Sciences and Environmental Studies, State University of New York, SUNY at Binghamton, Vestal, NY 13850, USA
2
Geology Department, Faculty of Science, Damietta University, New Damietta 34518, Egypt
3
Department of Geography, Geology, and the Environment, Illinois State University, Normal, IL 61790, USA
4
School of Meteorology, University of Oklahoma, Norman, OK 73072, USA
5
School of Civil Engineering and Environmental Science, University of Oklahoma, Norman, OK 73072, USA
6
NOAA/National Severe Storms Laboratory, Norman, OK 73072, USA
*
Author to whom correspondence should be addressed.
Remote Sens. 2021, 13(5), 953; https://doi.org/10.3390/rs13050953
Submission received: 17 January 2021 / Revised: 19 February 2021 / Accepted: 26 February 2021 / Published: 4 March 2021
(This article belongs to the Special Issue Remote Sensing Applications for Water Scarcity Assessment)

Abstract

:
This research assesses the changes in total water storage (TWS) during the twentieth century and future projections in the Nile River Basin (NRB) via TWSA (TWS anomalies) records from GRACE (Gravity Recovery and Climate Experiment), GRACE-FO (Follow-On), data-driven-reanalysis TWSA and a land surface model (LSM), in association with precipitation, temperature records, and standard drought indicators. The analytical approach incorporates the development of 100+ yearlong TWSA records using a probabilistic conditional distribution fitting approach by the GAMLSS (generalized additive model for location, scale, and shape) model. The model performance was tested using standard indicators including coevolution plots, the Nash–Sutcliffe coefficient, cumulative density function, standardized residuals, and uncertainty bounds. All model evaluation results are satisfactory to excellent. The drought and flooding severity/magnitude, duration, and recurrence frequencies were assessed during the studied period. The results showed, (1) The NRB between 2002 to 2020 has witnessed a substantial transition to wetter conditions. Specifically, during the wet season, the NRB received between ~50 Gt./yr. to ~300 Gt./yr. compared to ~30 Gt./yr. to ~70 Gt./yr. of water loss during the dry season. (2) The TWSA reanalysis records between 1901 to 2002 revealed that the NRB had experienced a positive increase in TWS of ~17% during the wet season. Moreover, the TWS storage had witnessed a recovery of ~28% during the dry season. (3) The projected TWSA between 2021 to 2050 unveiled a positive increase in the TWS during the rainy season. While during the dry season, the water storage showed insubstantial TWS changes. Despite these projections, the future storage suggested a reduction between 10 to 30% in TWS. The analysis of drought and flooding frequencies between 1901 to 2050 revealed that the NRB has ~64 dry-years compared to ~86 wet-years. The exceedance probabilities for the normal conditions are between 44 to 52%, relative to a 4% chance of extreme events. The recurrence interval of the normal to moderate wet or dry conditions is ~6 years. These TWSA trajectories call for further water resources planning in the region, especially during flood seasons. This research contributes to the ongoing efforts to improve the TWSA assessment and its associated dynamics for transboundary river basins.

Graphical Abstract

1. Introduction

The Nile river basin (NRB; ~3.18 million Km2) is a complex transboundary hydrologic system [1,2,3,4], and one of the world’s preeminent geopolitical hotspots [5,6,7,8]. The NRB is home to more than 320 million people belonging to 11 African nations (2018 population estimation), approximately 24% of Africa’s total population [9,10]. To both upstream and downstream countries, the Nile river is crucial for development planning, food, and energy production. Egypt, a major downstream country, depends on the Nile River for its survival more completely than any other country depends on any single waterway [11]. Yet, the water flowing in the Nile originates from entirely outside of Egypt’s borders. To the 10 other countries, the Nile water is critically needed for energy generation, to assure their own food security, mitigate the disastrous effects of periodic droughts, and assure social-economic development [5,12,13].
Consequently, from the point of view of hydropolitics and hydroclimatology, the NRB is also one of the most intensely studied and researched basins in the world. Specifically, several studies have addressed the simmering dispute over who owns the Nile, i.e., [5,14,15]. Aside from this, considerable research efforts have been devoted to model the flow dynamics of the basin [16,17,18,19,20,21], water balance [22,23,24,25], groundwater [26,27], and precipitation variability [28,29] among numerous others. Despite the plethora of existing hydroclimatology studies, recent data acquisition methods and algorithmic solutions afforded by platforms such as GRACE (Gravity Recovery and Climate Experiment) and GRACE-FO (Follow-On) satellite data have begun to produce additional insights into the dynamics of water resources in the NRB [24,30,31,32,33,34,35]. GRACE-derived TWSA (total water storage anomalies) data integrate storage changes in all forms of water, including surface water storage (SWS), soil moisture storage (SMS), groundwater storage (GWS), and snow water equivalent (SWE), as well as the impacts of anthropogenic processes on these stocks of waters [36,37,38,39]. Significantly, therefore, the spatial and temporal patterns of TWSA produced by GRACE are unique and distinct from those generated by other sources, such as land surface models (LSMs) outputs and hydrologic models [40,41].
The new and unique perspectives produced by GRACE point to a need for the application of the same consistent methodology in the pre- and beyond-GRACE periods. Herein, we report a reconstruction of monthly TWSA data for the Nile Basin spanning the entire 20th century and projections for the 30+ years in the 21st century, specifically to the year 2050. To achieve the reconstruction, we integrated the current GRACE TWSA observations, with probabilistic simulated TWS records (see Section 3.6) for past scenarios to provide an overview of the TWSA variability in the NRB. Armed with the new 100 yearlong TWSA simulated time series, we investigated several hydroclimatic dynamics in the NRB, including floods, droughts, and spatiotemporal water storage variability across the basin, as well as across two main water source regions and water sink areas (see Section 4.2). Additionally, we used the same analytic framework to generate future projections of TWSA for the period 2021 to 2050. In total, therefore, our approach allowed us to extend the TWS data both backward (by 80 years) and forward (by 30 years) using the same consistent data and methodology. The reconstructed/projected GRACE-like data reproduced many established hydroclimatic events in the NRB based on other independent data types, including floods, droughts, and periods of wet and dry regimes. The results also point to important differences between new estimates generated using GRACE data compared to those produced from other data types.
As noted previously, the NRB has been intensively studied both in terms of historical and future trends of rainfall, runoff, and evapotranspiration (ET) records [19,29,42,43,44]. For instance, climate circulation model (GCM) outputs were used to illustrate the future precipitation patterns in the basin [45]. The runoff vulnerability to climate change was assessed using streamflow records [19], hydrological model outputs [29], projected precipitation, temperature [20,45,46], and the ET, and potential-ET (PET) variabilities [20]. To improve the seasonal and annual predictability of rainfall, runoff, and ET dynamics across the basin, the available in-situ observations were blended with satellite-derived hydrological data and LSMs outputs [18,24,42,47,48]. Further, several research studies have employed multisource remote sensing observations including precipitation [18,49,50], ET and moisture products [47,51,52], and gridded hydrological records [53,54,55] to understand the water resources potentials in the hydrologic source and sink areas [50], investigate the seasonal variability across the entire NRB [20,56,57], and individual hydrologic units, i.e., Lake Victoria [25,58] and the Blue Nile Basin (BNB) [51,55,59]. Consequently, recent research utilized GRACE-TWS data to study the changes in key water storage components and the hydrological mass variation in the basin [24,58]. The gridded and lumped GRACE-TWS products were coupled with Global Land Data Assimilation System (GLDAS) outputs, satellite precipitation, climate teleconnections, and remote sensing-based drought indices [60,61,62] to illustrate the recent water storage variations in the NRB and to assess their variabilities relative to various hydroclimatic and anthropogenic drivers [30].
None of the available/previous research, however, has provided a comprehensive evaluation of the TWSA, especially through the past century. Additionally, no studies have provided a foreseen evaluation of the TWSA changes to assess the enduring anthropogenic activities on the Nile waters. Moreover, the historical hydrological extremes (drought and flooding) severity/magnitude, duration, frequencies, and their future trajectories on the available water resources in the NRB have not been fully investigated. Furthermore, the most recent record of GRACE-FO TWSA has not been fully implemented to assess the most recent variability across the basin. This research, therefore, aims specifically to provide a vital water resource assessment for one of the major transboundary water systems in Africa, and contributes to understanding the TWSA variability in one of the major drought-prone regions with fewer management protocols. Such an assessment should help to (i) improve our understanding of the hydrological water cycle in the basin and assess the implication of hydrological extremes and resource vulnerability in the NRB. (ii) Redefine the knowledge of water storage dynamics in the basin to advance and improve water resource management. (iii) Identify potential changes in the basin’s water storage to improve the nexus management policy, and to move to the basin towards the benefit of future resource-sharing. This paper, therefore, is a contribution to the ongoing efforts to improve the assessment of the TWSA and its associated dynamics in the NRB. The presented results have theoretical and practical applications related to the management of the basin’s shared and transboundary water resources. The mismanagement of water storage in the NRB has the potential to amplify the existing instability and result in the basin transitioning to a hydro-conflict hotspot for food, water, and energy acquisition. Understanding the TWS changes is critical to: (i) devise the best management practices for the basin’s available water resources, (ii) identify the potential TWS trajectories that will sustain future hydropower management plans.

2. The Nile River Basin (NRB)

With a total flow length of 6850 Km, the Nile is the world’s longest river and the second greatest (after the Amazon) in terms of the watershed area. Unique among African rivers, the Nile flows from south to north as a confluence of two rivers, the White Nile and the Blue Nile rivers. Annually, the average natural water flow in the Nile generates a total runoff estimated at approximately 88 ± 5 BCM/yr. (billion cubic meters) at Aswan High Dam in Egypt. In general, the Nile basin can be divided into four major sub-basins [1]: (1) the White Nile Basin (WNB); (2) the BNB; (3) the Atbara River Basin; and (4) the main or trunk stem Nile Basin (Figure 1). Within the WNB, the Nile takes its rise from the Equatorial Lake system (Lake Victoria water tower in the south). Northward, the river flows into the Sudd wetlands, spreading across nearly 57,000 km2 and markedly slowing down. As a result, approximately 4 BCM of water is lost to evaporation here, making the Sudd the main water sink region in the WNB. As a result of these losses, the White Nile, which produces 37 BCM/yr. near its source, produces only 33 BCM/yr. or 29% of the total Nile runoff downstream of the Sudd. The Blue Nile River originates at Lake Tana in the Ethiopian highlands. It generates about 57% (50.6 BCM/yr.) of the total runoff to the Nile. The Atbara River arises in northern Ethiopia. It is a flashy river that is dry for half the year. The Atbara contributes ~14% (4.4. BCM/yr.) of the total Nile runoff. The Main Nile Basin begins at the confluence of the White and Blue Niles. It also receives flow from the Atbara River a short way downstream. The Main Nile Basin itself grades from semiarid to arid in the north. Consequently, the basin experiences little to no surface runoff. It also experiences large evaporation losses due to high temperatures nearly year-round [6], the Main Nile is the second water sink region in the basin.
The total annual rainfall is variable in amount and timing across the different sub-basins of the NRB. In the Equatorial Lakes, rainfall varies between ~900 to 2000 mm/yr. The rainy season is bimodal, occurring between March to May and August to December [2]. The Ethiopian highlands receive an annual rainfall that varies between 1200 and 1800 mm/yr. with an average of about 1000 mm/yr. Most precipitation occurs between July to October. For the Atbara sub-basin, the annual average precipitation reaches 553 mm/yr., the lowest among other southern Nile sub-basins [9]. The rainfall amount over the Sudd wetlands is around 800 to 900 mm/yr., occurring from April to November [64]. The precipitation rate across the Main Nile Trunk, located within an arid climate, is approximately 200 mm/yr. [9].
As a product of precipitation (gross precipitation rates), theoretically, the basin’s water storage should reach ~1661 BCM/yr.; The sole contribution of each water source in the basin is as follows. The Equatorial Lakes provide ~517 BCM/yr., the water storage at the Ethiopian highlands reaches ~935 BCM/yr., of which only ~590 BCM /yr. reaches the Blue Nile waters. In southern Sudan, the total storage reaches ~554 BCM/yr. of the Nile water. The total precipitation flux within the basin produces an average of 1000 m3/yr. per capita; an amount that surpasses the present absolute water scarcity status. The available Nile water share per capita is less than ~500 m3/yr. [13,65]. Several climate projections have revealed a spike in the rainfall amount in the NRB [43,46]. Despite these projections, the hot and dry conditions coupled with a rising population will reduce the amount of runoff and the water available for agricultural, ecological, and residential use [43].
Due to terrain-topography and climate complexities, the river flow is very low, ~0.98 L/s. Km2 or ~99.20 BCM/yr. [50,66]; the Nile river is one of the lowest flowing rivers globally. The total runoff water in the Nile river basin has been predicted to be 161 BCM annually, with the total amount of water reaching Aswan in Egypt predicted to be ~84 BCM/yr.; This is less than 5% of the total drainable water storage in the basin; ~54 km3 per annum arriving at the delta [67]. The runoff is a key component of the water balance that defines the amount of renewable water resources within the basin [68]. The lack of in situ and gauging stations in the region make such an assessment incomprehensive and fragmented; few gauge stations are available to monitor the total streamflow on the main Blue Nile watercourse, at the headwater zone of the Owen Reservoir, at the exits of the White Nile, the Atbara tributaries, and as cumulative streamflow from all tributaries at the Aswan Dam (see, Figure 1).
The ET figures follow the general precipitation patterns across the basin, where ET rates exceed 1000 mm/yr. in the Equatorial Lake region, and drop to less than 80 mm/yr. in the arid zone [3,28,69]. Higher ET rates across the region are responsible for significant water losses annually. The ET diminished by: ~260 to 310 BCM of water over the Equatorial Lakes, Lake Tana and the Sudd marshes; ~7 BCM at the conjunction of the two river systems; and ~19 BCM yearly over the Lake Nasser area [69]. In total, this equates to ~286 to 336 BCM of water being lost to ET yearly. Within the basin resides several natural lake systems, open water areas, and artificial reservoirs that provide a buffer against seasonal rainfall variations, and maintain a regular water flow. The total lake area, however, represents less than 3% of the basin’s total area.

3. Data and Methods

This research utilizes several gridded observations for hydrological variables (i.e., TWSA, precipitation), temperature records, and a number of drought indicators. The datasets are available at various grid-scales and span different temporal extents. To reconcile with the varied spatial resolutions, the data were summarized at the same spatial extent (same boundaries/area), either for the basin-level or the sub-basin scale.

3.1. GRACE TWS Observations

This research utilized GRACE and GRACE-FO (Follow-On) TWSA records between 2002 to 2017, and 2018 to 2020, respectively. Herein, we employed GRACE data of release- 6 (RL06), version 2 [70,71,72,73] from both SHs (spherical harmonics) and mascons (mass concentration blocks) solutions. See Table S1 for more details about GRACE datasets. Traditionally, GRACE-based equivalent water thickness (EWT) estimates were obtained from SH functions via several spatial filtering (north–south destriping), and spatial smoothing tools [70]. Unlike SHs, the mascon solutions do not require the application of any filtering and can retain good gravity signals over ocean and land [73]. The GRACE gravity maps are available at a spatial resolution of 300 Km, or 3° × 3° degree area, using either SHs or mascons solutions. GRACE data provide an excellent source for global TWSA as EWT in cm/month [39]. Arithmetically, GRACE TWSA is the sum of changes in water stored in all forms, i.e.,
Δ T W S   = Δ S W S +   Δ S M S +   Δ G W S +   Δ S N S
where Δ S W S represents changes in surface water storage; Δ S M S represents changes in soil moisture storage (SMS); Δ G W S represents changes in groundwater storage, and Δ S N S represents changes in snow cover.
This research incorporates GRACE and GRACE-FO data in the original grids, as posted by the three major mission partners: the Center for Space Research, University of Texas Austin (CSR; SH and mascon); the Jet Propulsion Laboratory in California (JPL; SH and mascon); and the Geo Forschungs Zentrum (GFZ, SH) in Potsdam, Germany. The data can be accessed freely from the GRACE Tellus portal.

3.2. LSM Datasets

The long-term TWS estimates were also extracted using GLDAS LSM outputs of version 2.2 from the CLSM-F2.5 (catchment land surface model). In general, the GLDAS model generates land surface fluxes via ingesting satellite- and ground-based observational data products in advanced LSM and data assimilation (DA) tools [74]. The GLDAS 2.2 model is forced using a combination of model, observational data, and DA from GRACE and GRACE-FO [75]. The CLSM-based TWS data were obtained from the Goddard Space Flight Center (GSFC) Hydrological Sciences Laboratory (HSL) and the Goddard Earth Sciences Data and Information Services Center (GES DISC). The data are available at a 0.25° × 0.25° grid resolution for the period between 1948 and 2014 [76].

3.3. GPCC and CRU Datasets

We utilized long-term precipitation records between 1901–2020 from the GPCC (Global Precipitation Climatology Centre) gridded gauge-analysis precipitation products. The data were obtained from the Deutscher Wetterdienst (DWD), the German Meteorological Service. The GPCC provides global monthly gauge-corrected precipitation products at a 0.5° × 0.5° grid-scale [77,78]. The long-term monthly precipitation, temperature, and PET records were obtained from time-series (TS) datasets from the CRU (Climate Research Unit) at the University of East Anglia, UK. The CRU data were calculated at a resolution of 0.5° × 0.5° based on 4000+ weather stations around the world [79]. This research employed the most recently released CRU-TS of version 4.04 between 1901–2020.

3.4. ClimGen Data

The future precipitation and temperature projections were obtained using the CRU ClimGen precipitation and temperature records between 2021 to 2050. The datasets are freely available through the CRU ClimGen data portal. The ClimGen datasets provide spatial climate scenarios for future climate records at regional scales [80]. ClimGen is based on the “pattern-scaling” approach, which encompasses the geographical, seasonal, and multi-variable structure of future climate information. The pattern-scaling approach derives the magnitude of the future precipitation (mm/month) and temperature (degree Celsius) from the GCM at different climate sensitivities and emission scenarios using a set of exponential and logistic functions [81]. The pattern-scaling was initially introduced to enable the creation of transient climate projections, especially for probabilistic approaches [82]. It is typically set to a specific warming level to either explore the magnitude of climate projections or the associated uncertainties [81]. The reliability assessment of the pattern-scaling outputs showed smaller error margins compared to the uncertainties exist in other future climate scenarios [83]. The ClimGen was simulated by coupled atmosphere–ocean general circulation models (AOGCMs) under different emission scenarios. ClimGen initially provided these scenarios in a common format, with options to extract user-defined regions, seasons, and specific periods. (Osborn et al., 2009) has provided detailed information about the ClimGen data [80].

3.5. Drought Indicators

To characterize different drought incidents across the NRB region, several drought indicators were employed, including: the GPCC drought index (GPCC_DI) between 1952 to 2014 [84]; the CRU self-calibrated Palmer Drought Severity Index (scPDSI) between 1901 to 2018, i.e., Palmar Drought Severity Index (PDSI) 1901 to 2014; the Standardized Precipitation Index (SPI) between 1901 to 2016; and the Standardized Precipitation–Evaporation Index (SPEI) between 1901 to 2015 [85]. The SPI and SPEI were utilized on 6-moth time scales. The scPDSI was determined using the CRU precipitation and PET records according to the scPDSI-package in R Development [86]. The SPI was calculated using precipitation records according to [87]. Table S1 provides the source links and information about all utilized drought indicators in this research. Additionally, the long-term drought records were constructed for the period between 1901–2050 using the GRACE-based total water storage deficit (TWSD) (see Section 3.10).

3.6. GAMLSS Model

To develop retrogressive (inclusive) TWSA records for the NRB between 1901–2002, and projected (exclusive) TWSA records from 2021 to 2050, a probabilistic conditional distribution fitting was performed using the GAMLSS (generalized additive model for location, scale, and shape approach) [88]. The long-term CRU precipitation and temperature records were used as regressors to estimate TWSA. The GAMLSS approach makes use of a probability distribution function (PDF) scheme to accommodate the nonlinearity between the predicted and predictor variables, as well as in the location and heteroskedasticity scale. Additionally, the PDF offers a set of probabilistic quantiles (Q) or percentile ranges within which all possible TWSA values could be generated. Here, we generated TWSA within 7 quantiles between Q5 to Q95.
The model was developed using continuous monthly GRACE-TWSA records obtained between 2002–2010 as a training period and these were subsequently validated using the TWSA data from 2011–2017. The assumption was made that the training TWSA set between 2002–2010 follows a known distribution with a density f (TWSA|μ,σ) which is conditional on the parameters mean (μ) and standard deviation (σ). Similarly, the mutually independent observed TWSA records for 2011–2017 give the parameter vector (μ,σ). Simply, to distinguish between systematic variability/trends and (random) uncertainties, conditional PDFs were fitted using the first two moments: the location, μ, describing the systematic trends, and the scale, σ, representing the associated uncertainties. The distribution was given according to Equation (2) as
f ( T W S A | μ , σ ) = 1 2 π σ   e ( T W S A μ ) 2 2 σ 2
After selecting the distribution family, an iterative procedure following forward, backward, and step-wise models was used to refine the model structure and to test the best model output. Then, penalized splines were used to fit the trends for each parameter for their flexibility to model complex nonlinear relationships [89,90]. The GAMLSS goodness-of-fit was tested using supervised diagnostic plots and significant information criteria tests (i.e., the Akaike information criterion (AIC), the Schwarz Bayesian criterion (SBC), the generalized AIC), as well as standard goodness-of-fit diagnostics. Based on the model performance during the training and validation periods, the GAMLSS model was used to build the backward (retrogressive) inclusive records for TWSA between 1901–2002, and forward exclusive TWSA records from 2021 to 2050. The model was accessed using the GAMLSS-package in R Development [91]. For additional details about the GAMLSS model, please see [90].

3.7. ARIMA Model

To fill the one-year gap (July 2017 to July 2018) between GRACE and GRACE-FO records, an ARIMA (Auto-Regressive Integrated Moving Average) model was used on the GRACE TWSA data. The ARIMA model was selected to explore another statistical-based approach (deterministic statistic) to fill the missing record between GRACE and GRACE-FO. Currently, several ongoing research efforts are implementing either complex modeling tools [92], different explanatory variables from satellite or LSMs (i.e., precipitation, and temperature) [31,93], or independent geophysical datasets (i.e., Swarm satellite data) [94] to fill the one-year gap between GRACE and GRACE-FO. Herein, we present an alternative/easy-to-apply approach to fill the one-year gap without any exogenous/independent variables/data. ARIMA, as a deterministic model, provides “deterministic values” using the time series itself [95]. The ARIMA model generates a single output predication of the input variable using the variable main statistical characteristics, moving average, autocorrelation, seasonal, and different lags. The model follows a system of linear equations to capture the relationship between two consecutive values of the system as:
Y t = i = 1 p a i Y t i + i = 1 q m i ε t i   +   ε t
where   Y t   is the independent variable. The missing value is derived using the variables first differencing of   Y t i and the ( p , q ) , which represent the variable autoregressive and moving average parameters, respectively. The terms ( a i ,   m i )   represent the model coefficient for the seasonal and moving average, the error term is given as ( ε t ), and is generally assumed to be independent and randomly distributed. The ARIMA model non-seasonal part of the ARIMA model is set at 0-order, 1-degree differencing, and the 1-month moving average. The seasonal part of the model is fixed using the same parameters’ set with a seasonal spike at lag 12. The ARIMA model was performed using 31 iterations. The model was accessed using the forecast-package in R Development [95]. The goodness-of-fit of the model was tested using the AIC criterion among other criteria.

3.8. Uncertainty Analysis and Model Performance

The uncertainties in GRACE-TWSA and LSM-based TWSA were assessed following a standard approach as introduced by [96,97]. Specifically, each time series was detrended by removing the deterministic components including the long-term trend, the annual and semi-annual components that were determined using STL (seasonal and trend decomposition using a LOESS (locally estimated scatterplot smoothing) decomposition model as
S t o t a l =   S c y c l e   t r e n d + S s e a s o n a l + S r e s i d u a l
where S t o t a l is the total time series component, S c y c l e   t r e n d is the cycle/cyclic trend, S s e a s o n a l is the seasonal component, S r e s i d u a l is the residual component.
Next, a linear regression approach was applied to remove any further trend (deterministic) signals in the reminder signals (residual), then, we interpreted the standard deviation as the maximum uncertainty or measurement error (the amplitude of the measurement error). This approach was utilized to express the uncertainty bounds for the retrogressive and the projected TWSA records as well.
For the GAMLSS-based TWSA outputs, we interpreted the standard deviation of the total time series as the uncertainty bounds to account for all possible dispersions in the series. Additionally, GAMLESS and ARIMA model performances were tested using standardized evaluation criteria including supervised coevolution plots between the simulated and actual TWSA during GRACE-era, cumulative distribution function (CDF), Pearson correlation coefficient (R-Square), the Nash Sutcliffe Coefficient Efficiency (NSCE), Root Mean Square Error (RMSE), among other goodness-of-fit coefficients. The performance of the GAMLSS-based long-term TWSA, and the extended TWSD were evaluated against independent TWSA from CLSM-F2.5 LSM and other standardized long-term drought indicators including SPI, SPEI, PDSI, GPCC_DI, and precipitation anomalies, see Section 4.5.2. The CRU precipitation was evaluated against the GPCC corrected precipitation record.

3.9. NRB Water Storage

The water storage was assessed using an ensemble record of SH and mascons solutions between 2002 to 2020 for the NRB, two major water source areas (i.e., Lake Victoria and BNB water towers), and two main water sink regions (Sudd Basin and Main Nile area). The analysis over the water towers and water sinks was carried out at the mascon levels of a 3° × 3° degree area. The missing GRACE record between July 2017 to July 2018 was estimated using the ARIMA approach, see Section 3.7. The storage assessment was done for wet periods between July to October, and dry periods from November to June for the NRB, BNB, and Sudd Basin. Because of a two-month storage lag, the wet period for the Main Nile area (Nile trunk) runs between September to December, and the dry period goes from January to August. Because the Lake Victoria water tower region is characterized by bimodal wet periods between March to May and August to December, the intervening months define the dry period in the region. CLSM-F2.5 LSM-based TWSA estimates were used to assess comparative TWSA estimates for the NRB.
Additionally, the STL approach (Equation (4)) was utilized to assess the TWS annual cycle trends over the NRB. Next, to identify the relative changes in the mean (short-term average) TWSA, a regime-shift detection (change in the mean), multiple change points, was applied on the total TWSA time series and the cycle component. The regime-shift algorithm was developed by [98].

3.10. GRACE Total Water Storage Deficit (TWSD)

GRACE-based total water storage deficit (TWSD), and extended TWSD were calculated by comparing the monthly TWSA to a reference monthly value. Here, we utilized the monthly median value for time series data as
T W S D i   = T W S A i   M
where T W S D i is the water storage deficit for the i month, T W S i is the corresponding monthly TWSA, and M is the median value. GRACE-TWDS and the drought severity index (DSI) defines the drought and flooding incidents across the season, respectively.
Then, the drought severity levels were obtained via standardizing the TWSD values as follows,
s T W S D i   = T W S D i   T W S D ¯ σ
where, T W S D ¯ is the mean TWSD value, and σ is the standard deviation.
The sTWSD delineates the conditions from very dry to very wet following standard thresholds, see Supplementary Information Table S3. Similarly, we standardized all drought indicators utilized in this research following Equation (6).
To assess the year-to-year flooding and drought frequencies in the NRB, the severity, timing, and duration of each event were assessed. Severity was described as extreme wet, normal, and extreme dry using standardized thresholds (see, Table S3). Likewise, to assess the exceedance probability and recurrence, each flood event was ranked according to the severity levels. The exceedance probability was then calculated as
E   = R n 1
where R is the rank, n is the total number of years on record. While the recurrence (return period) was calculated as
R I   = 1 E
The timing and duration were assessed by the approximate dates of onset and cessation, while the accumulated drought magnitude (DM), during either flooding or drought incidents, was assessed as
D M   = ± { i = 1 n s T W S D i }
where ± refers to flooding ( + ) or drought ( ) events in time series, n is the number of months for each event at i   timestep, and the s T W S D i is the standardized GRACE-based drought indicator.

4. Results

4.1. Uncertainty Analysis and Model Performance

The performance of CRU precipitation (explanatory variable) was evaluated against an independent precipitation record from GPCC gauge corrected data, see Figure S1A. Overall, the coevolution plot shows a strong agreement between both variables with a significant p-value < 0.0001. Figure 2 shows the performance of the simulated/reconstructed TWSA against GRACE-based TWSA using standard evaluation criteria including a coevolution plot (Figure 2A), CDF (Figure 2B), and R-Square (Figure 2C). Additionally, the historical simulated TWSA records were compared to CLSM-based TWSA estimates from 1948 to 2010 (Figure 2D and Figure S1B). The ARIMA model was also evaluated using coevolution and residual plots (Figure S2A,B). Other evaluation criteria incorporate the goodness-of-fit for both the GAMLSS and ARIMA model outputs, including NSCE and RMSE (see Table S2). The uncertainty bounds in the simulated TWSA were expressed using standard deviation as described earlier (see Section 3.8).
Figure 2A unveils the performance of the GAMLSS model during the training period between 2002 and 2010. The coevolution results show strong agreement between simulated TWSA and GRACE-based estimates. As noted earlier, to account for all possible dispersion in the time series, the shaded area (uncertainty bounds) represents the standard deviation of the total series. The CDF plot, Figure 2B, between the simulated and GRACE-based TWSA records revealed a strong agreement between the two estimates, with a p-value < 0.0001. As the plot shows, the simulated TWSA matches the GRACE-TWSA across all spectra. Apart from some higher values, the model slightly underestimated the TWSA. The NSCE indicates a 0.86 agreement, with an R-square of 0.86, and a p-value < 0.0001 (Figure 2C). Further, the historical TWSA records were evaluated using CLSM-based TWSA (Figure 2D). The historical plot shows a good agreement temporal between the CLSM-TWSA and the simulated TWSA. As expected, there is some mismatching between the magnitudes of the two figures as a result of the unique nature of the two variables. The performance of the TWSD-based indicator was tested against independent drought indicators and precipitation anomalies. The results showed a very good temporal agreement between all hydrological extreme indicators (see Section 4.5.2). Additionally, the ARIMA model presented a good coevolution/temporal agreement between the GRACE-TWS and the modeled TWS during the training period, with an NSCE of 0.87, R-square of 0.87, significant p-value < 0.0001, and good residual plot (Figure S2). Table S2B shows additional goodness-of-fit criteria for the ARIMA model.

4.2. Present TWS Changes in NRB (2002 to 2020)

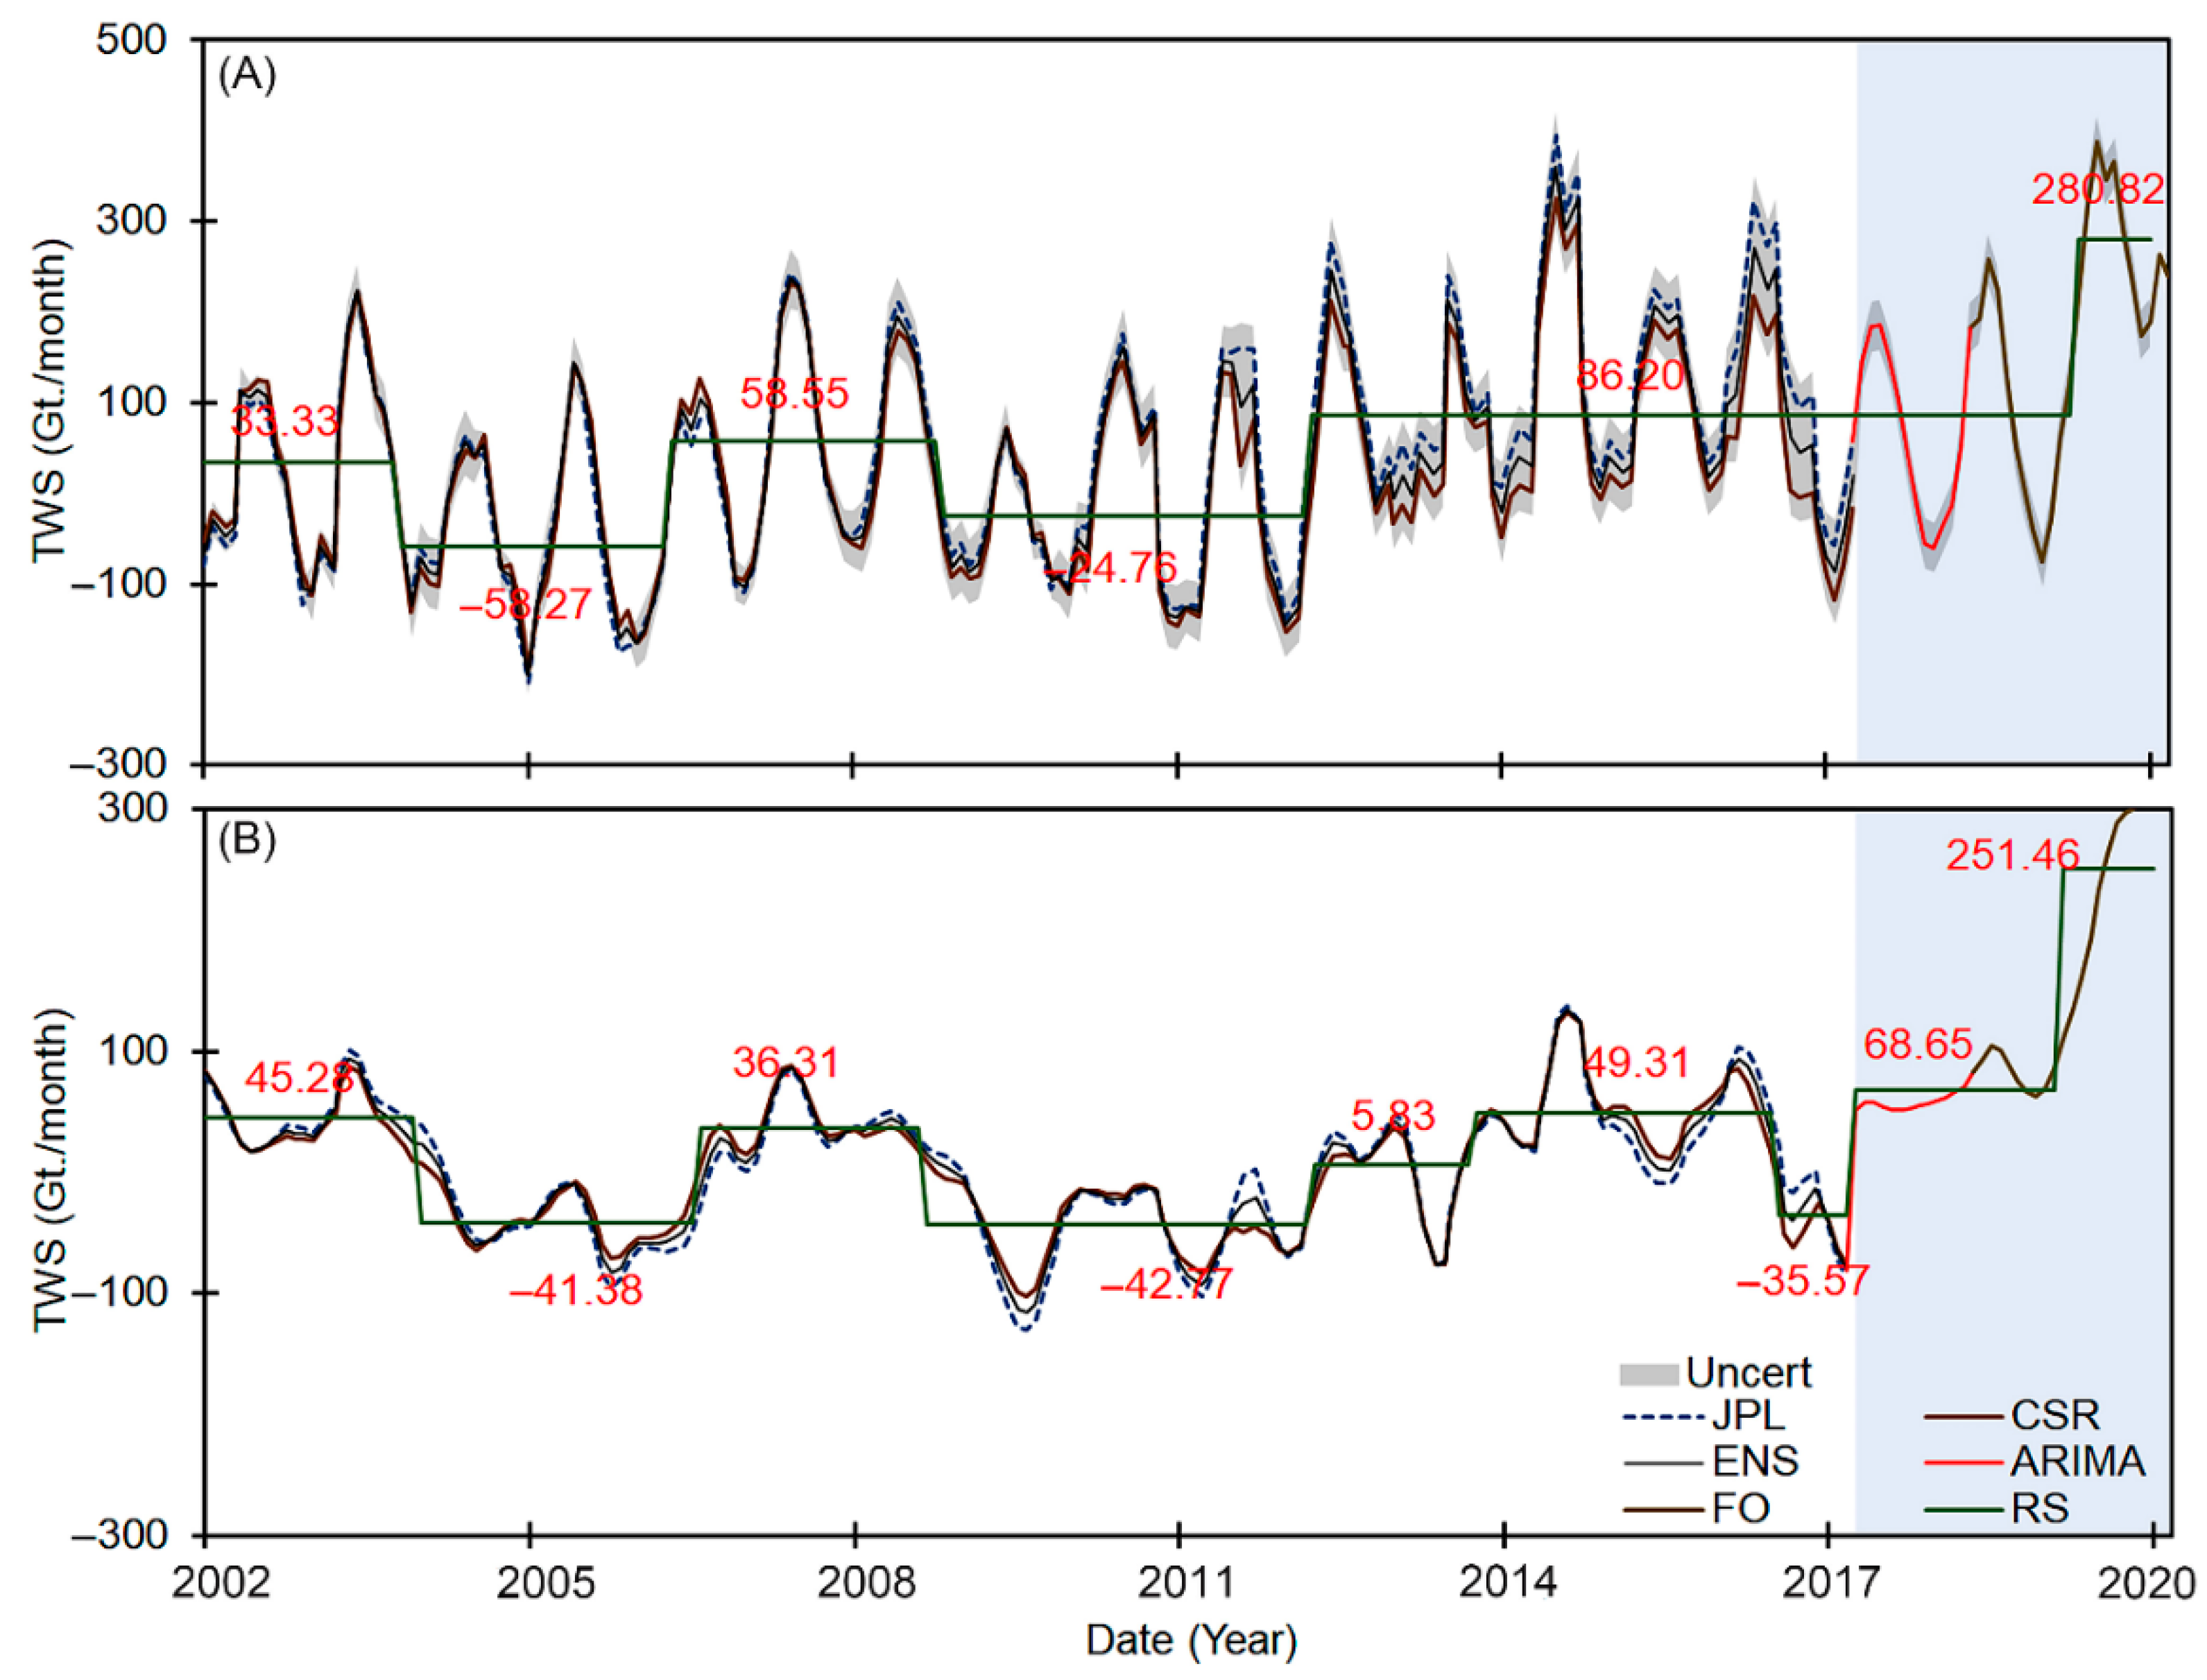
Figure 3 shows the basin-wide TWSA time series between 2002 to 2020 from GRACE, ARIMA, and GRACE-FO. The result of the homogeneity/change-point analysis (green line) (Figure 3A) revealed four periods of positive storage increase and two periods of negative decreases. Notably, two consecutive periods of increases since 2012 have raised the average TWSA five-fold relative to the early part of the series. Explicitly, (1) between April 2002 to January 2003, the mean average TWSA pinned at ~33 Gt./yr., (2) between August 2006 to January 2008, ~58 Gt./yr. of storage with ~75% increase in the storage, (3) the period between July 2013 to July 2019 during which mean storage increased to 86 Gt./yr. or ~48% increase relative to the previous period. (4) Between August 2019 to June 2020, the mean annual storage in the NRB reached the highest storage of ~280 Gt./yr. or more than a two-times increase relative to the storage levels between 2013 to 2019. On the other hand, the TWSA record between 2002 to 2020 indicates two periods of storage reduction. Between February 2004 to July 2006, the storage dropped ~−58 Gt./yr. In the second period between February 2009 to June 2012, the storage loss levels reached ~−24 Gt./yr. or ~1.4 times recovery levels in the storage losses compared to the previous period. The TWSA cycle trend component, Figure 3B, exhibits six main wet cycles. The wet cycles exhibit a significant TWSA storage increase from ~45 Gt./yr. between April 2002 to April 2004 to ~251 Gt./yr. in the late year, 2019 or an ~8.5 times increase in the wetness levels during the year from June 2019 to June 2020. The TWSA cycle showed three negative cycles, where storage losses started at ~−41 Gt./yr. between April 2004 to October 2010, then ~−42 Gt./yr. between December 2008 to June 2012, and finally, ~−35 Gt/yr. between October 2016 to June 2017. The TWSA cycle indicates a ~17% storage recovery between 2004 to 2016. Tables S4 and S5 in the Supplementary Information summarize the wet and dry records for both total TWSA time series and cycle components.
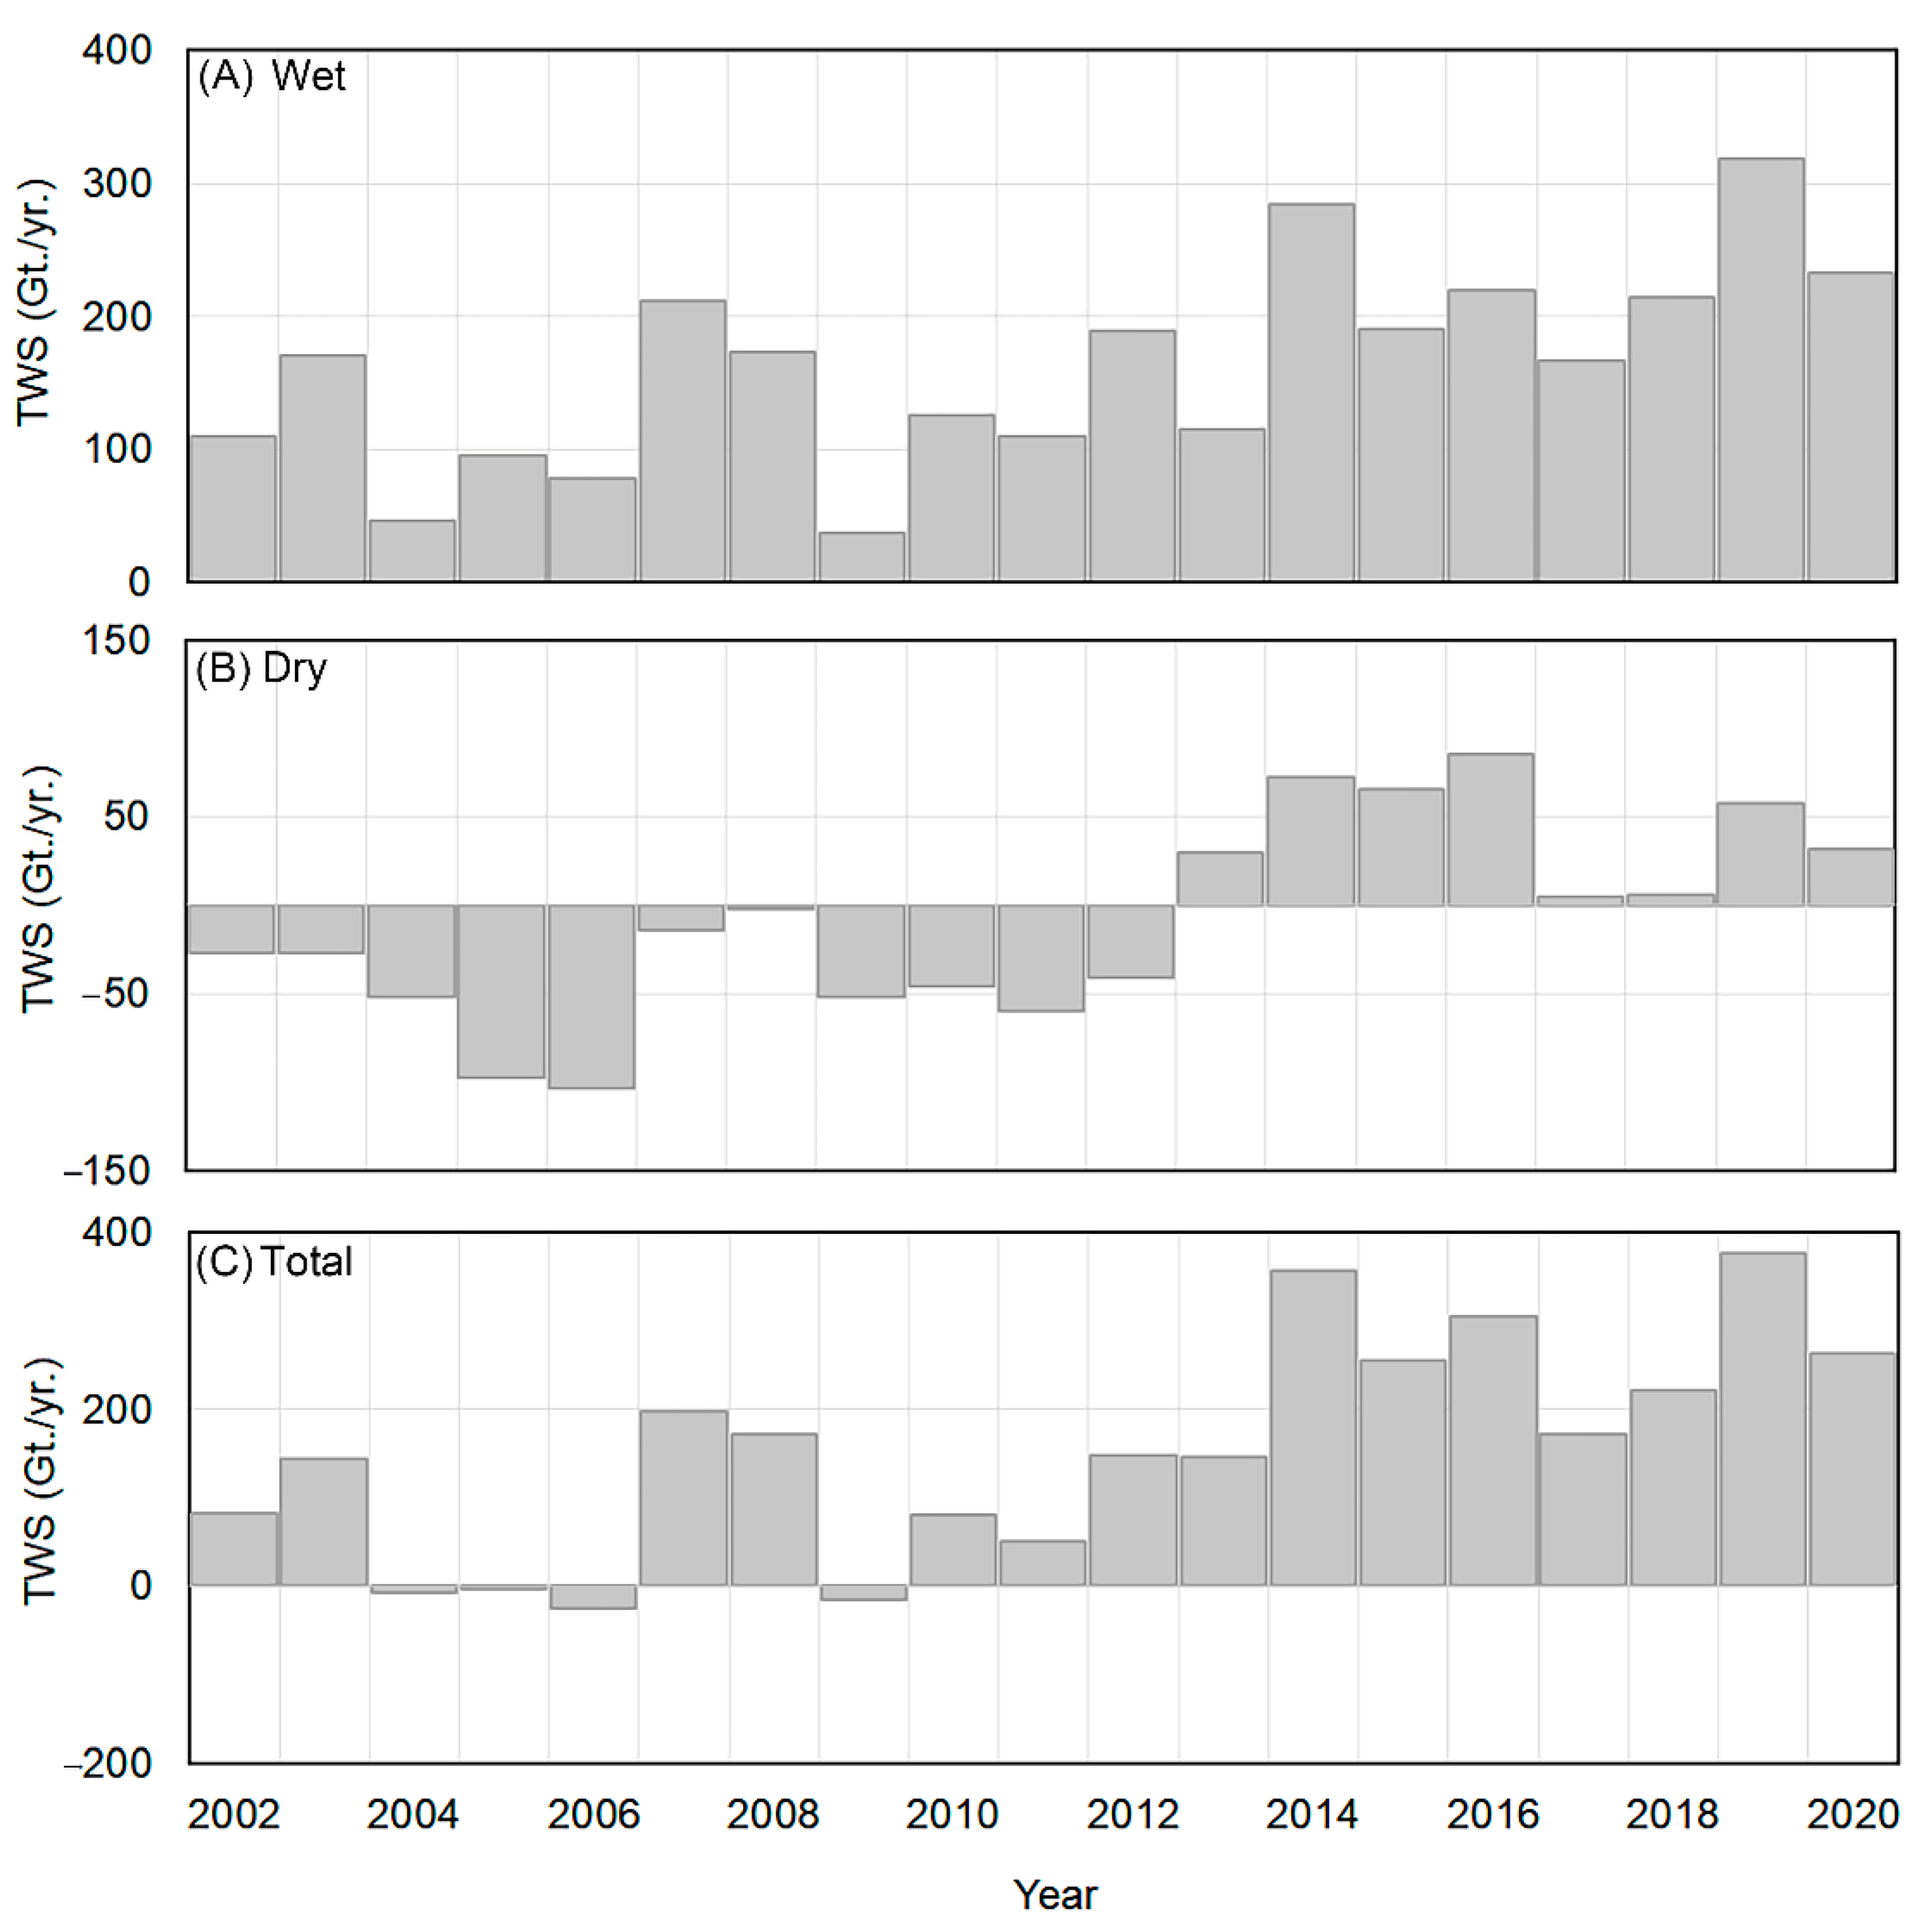
Figure 4 summarizes the change in the TWSA across the NRB during the wet (A) and dry season (B), and the net change between the two periods between 2002 to 2020 (C). The plot shows that, on average, the NRB received storage between 50 Gt./yr. to ~310 Gt./yr. during the wet season. In contrast, dry season losses ranged between ~30 Gt./yr. to ~70 Gt./yr. As a result, the net TWSA change across the NRB showed a substantial increase from 2010 to 2020 of about 200 Gt./yr. on average. Additionally, we assessed the year-to-year rate of change (ROC) in the TWS, and the overall yearly changes compared to the mean annual average in TWS between 2002 to 2020 (see Figure S3A,B in the Supplementary Info). The yearly changes in the TWS showed a fluctuation in the trend from one year to another. The comparison of the yearly storage to the overall average showed a negative trend between 2002 to 2013, which later fluctuated to a positive trend from 2014 to 2020.
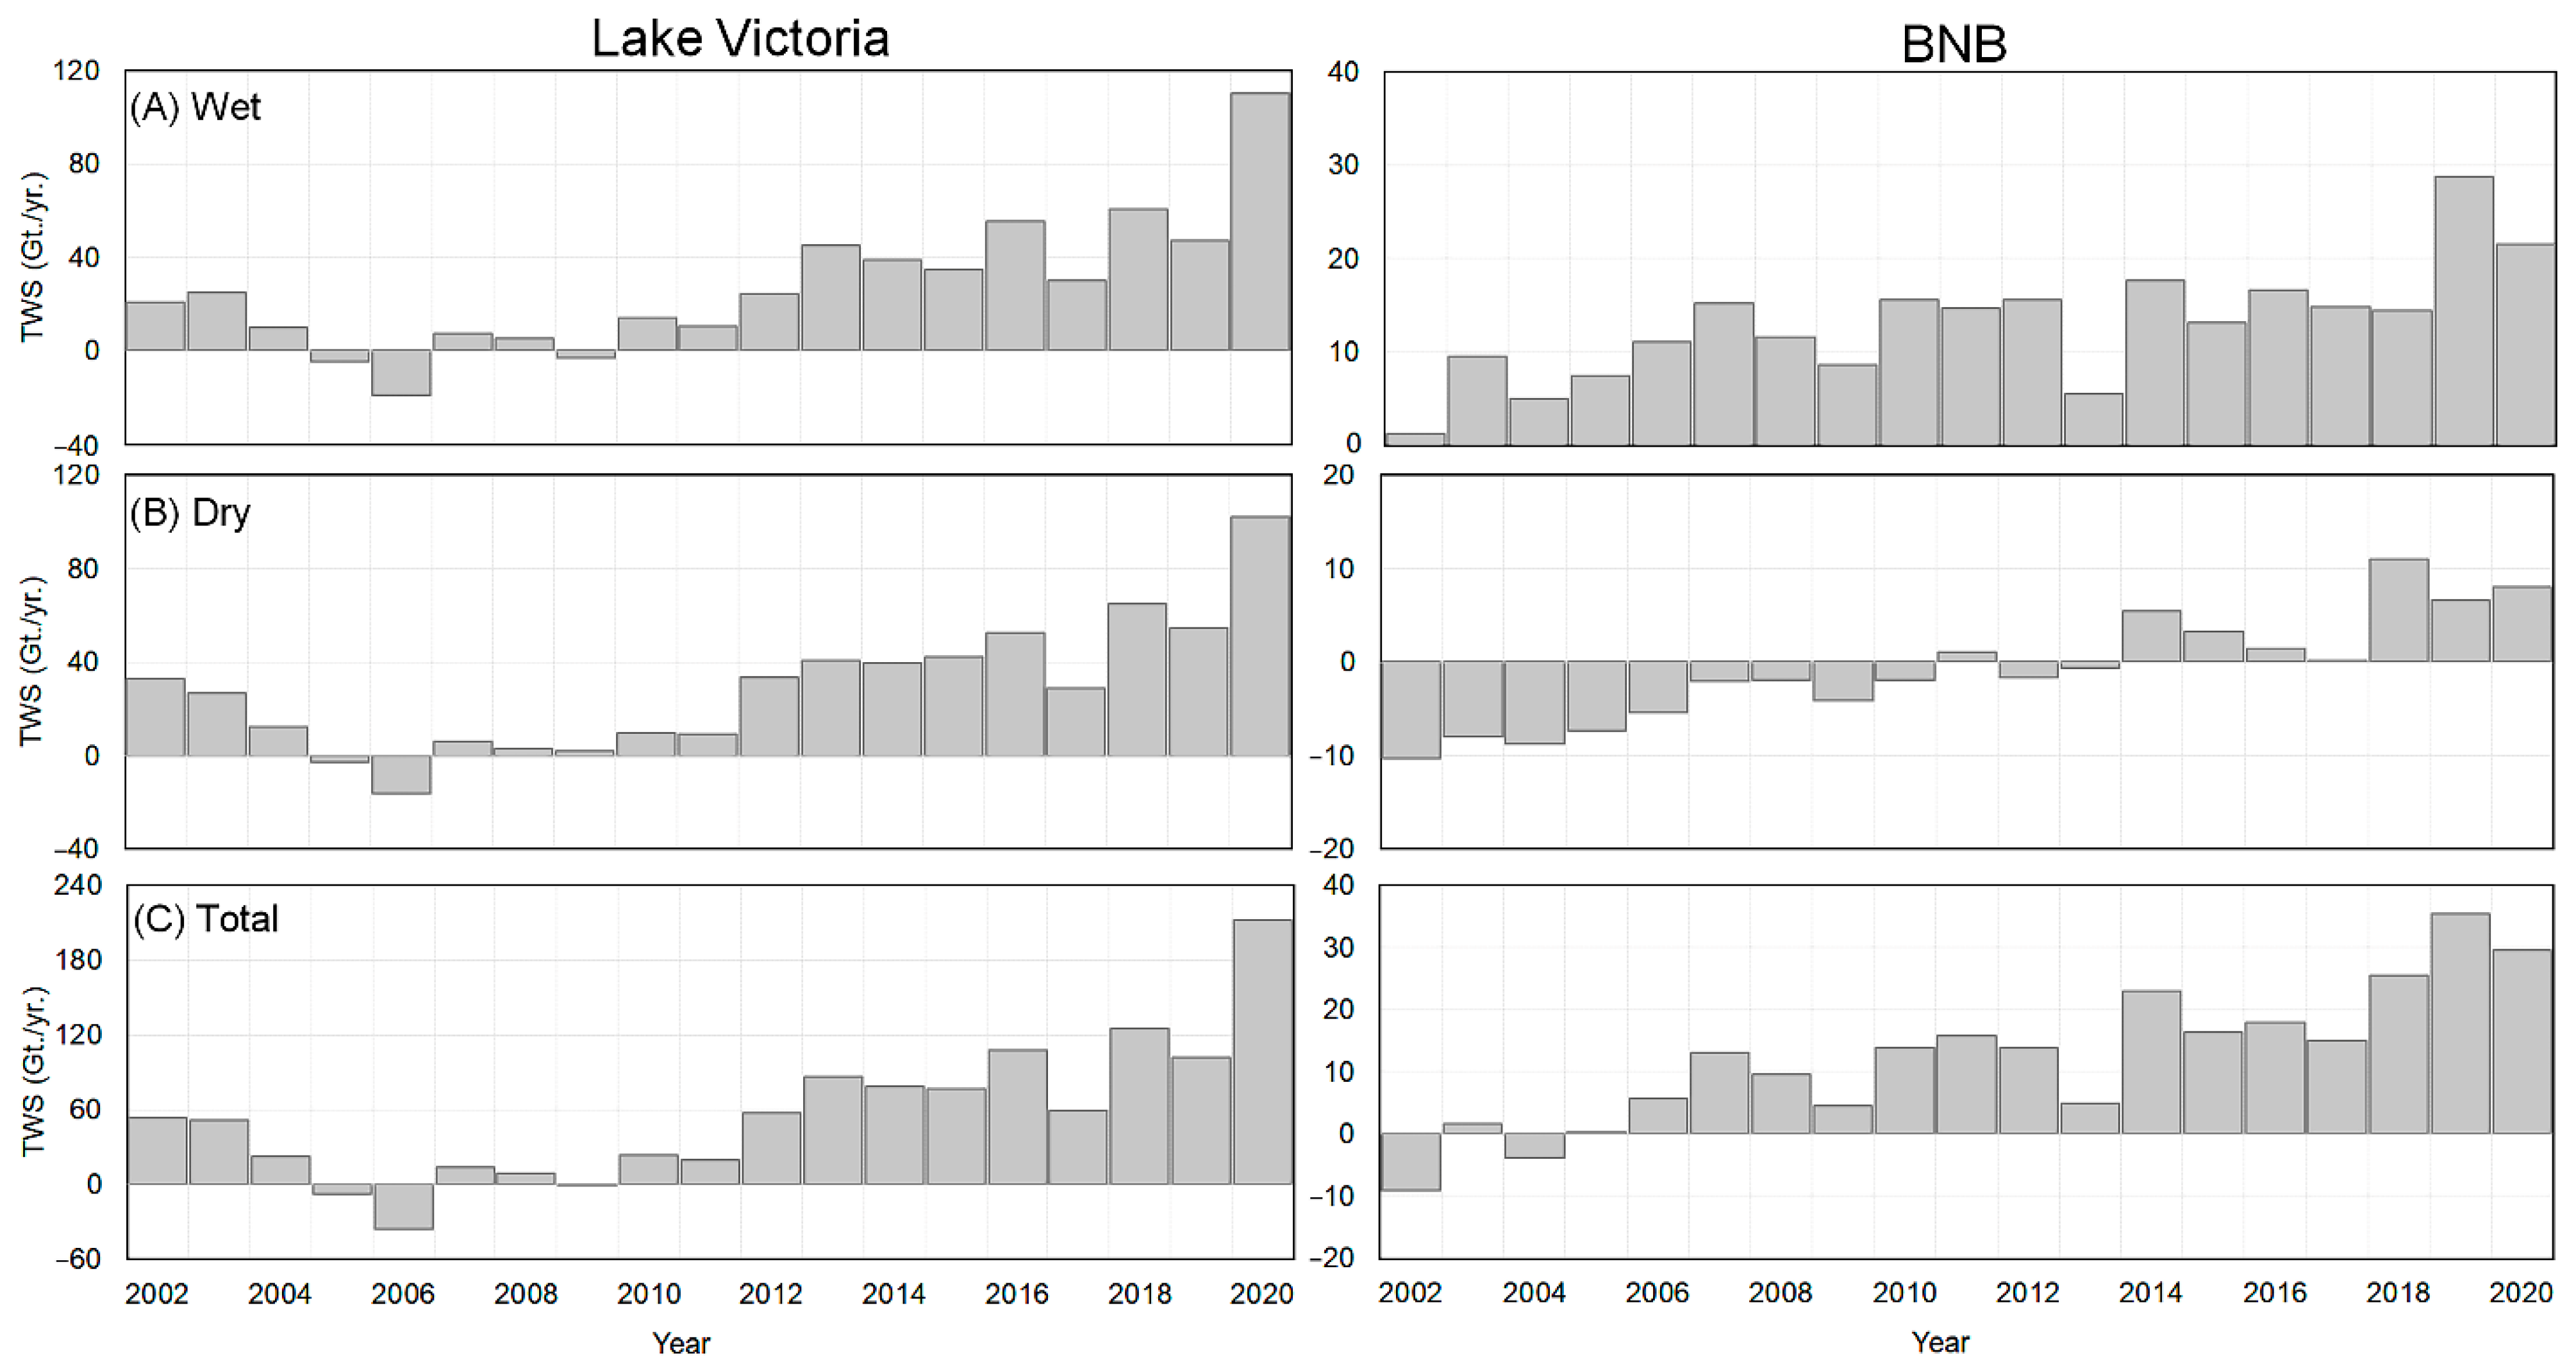
Figure 5 shows similar TWSA dynamics during the wet and dry periods at two main source water areas (i.e., Lake Victoria and BNB). Specifically, Figure 5 shows important contrasts between the Lake Victoria Basin and the BNB in terms of surface runoff and TWSA. Recall that the BNB contributes 57% of the surface runoff of the Nile Basin, while the White Nile contributes approximately 30%. The TWSA suggests another pattern. For instance, during the wet season (Figure 5A), the Lake Victoria Basin stores, on average, twice as much as the BNB. Additionally, beginning as early as 2006, the Lake Victoria net annual storage increased significantly, as confirmed by [23]. During the dry season, TWSA at the Lake Victoria area indicates a general increasing pattern, except for the years 2005 and 2006. In the BNB, however, during the dry season the TWS improved continuously since 2002, it did not become positive until 2014. Figure 5C, suggests the net surplus in the TWSA; generally, the net pattern confirms the significant increase in the TWSA storage over the Lake Victoria water tower area compared to the BNB. Noteworthy, 2005, 2006, and 2009 displayed the lowest TWSA records over the Lake Victoria region. The years between 2002 to 2005 present the lowest recorded TWSA over the BNB water tower region. The net storage between 2002 to 2020 was summarized across the three main sub-basins: BNB, WNB, and Atbara (see Figure S4).
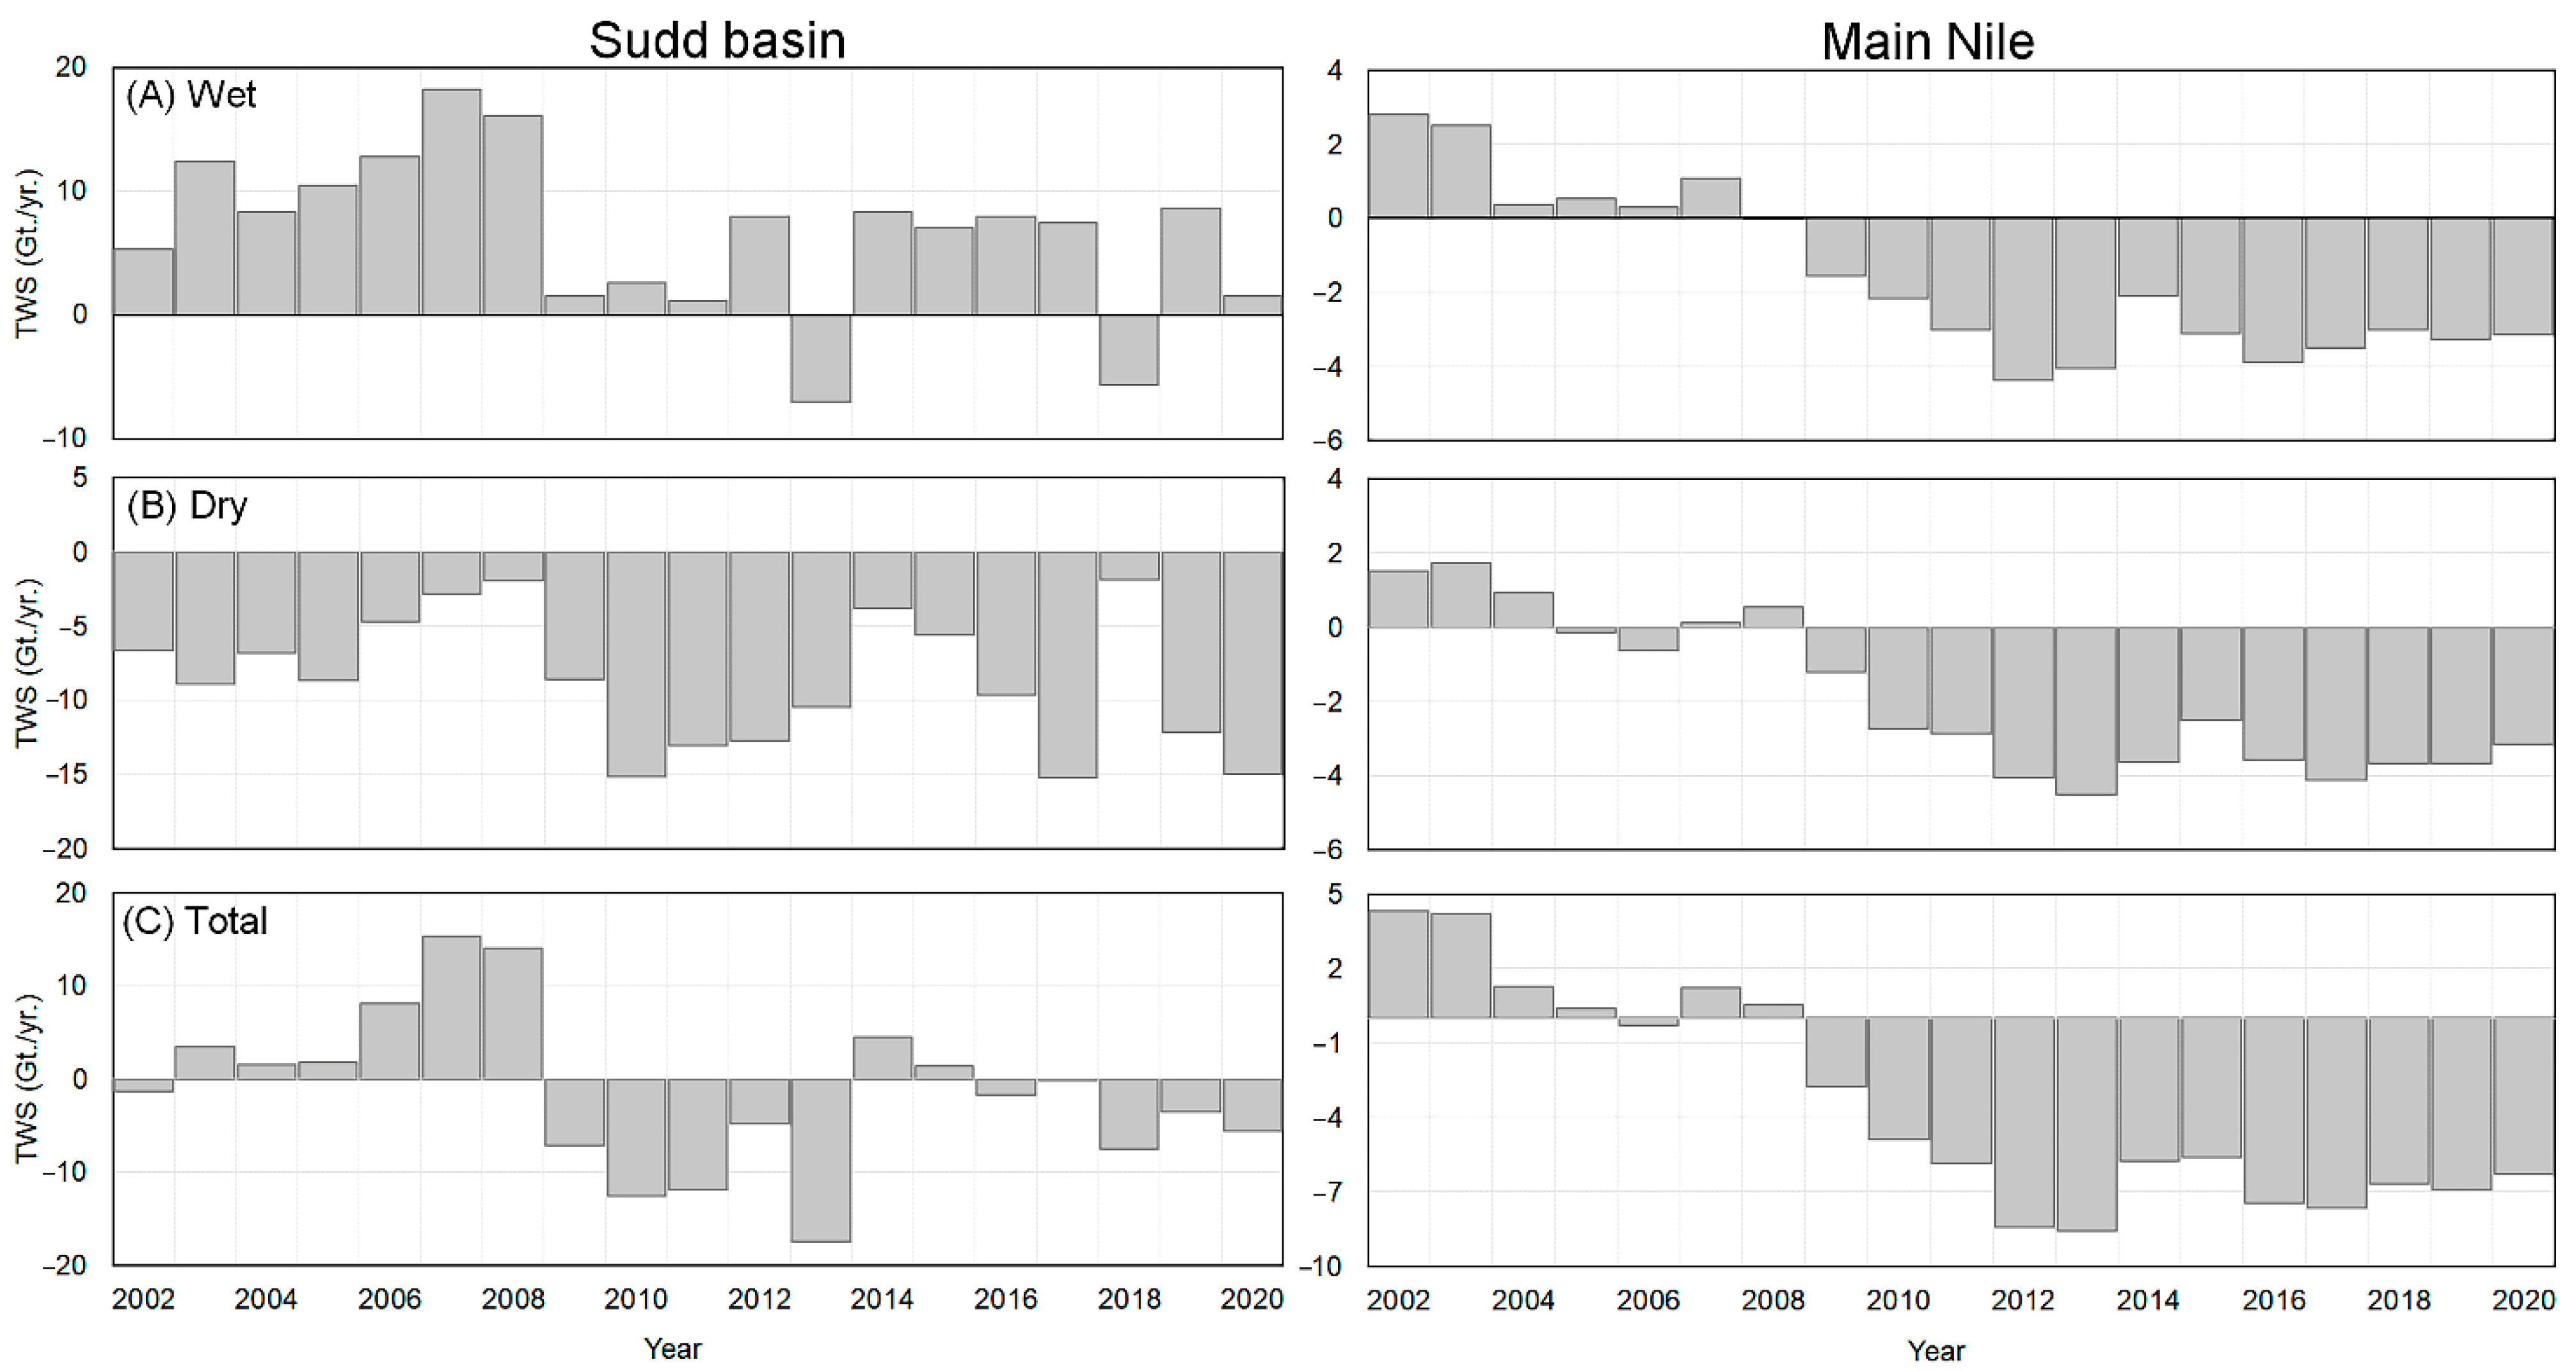
In the two water sink regions (Figure 6), the temporal patterns observed in the water source regions are flipped. That is, in both sink areas, net positive water storage occurred during the early part of the series, followed by water deficits. For instance, during the wet season (Figure 6A), the Sudd Basin receives an average TWS of ~8 Gt./yr. There were two negative records of TWSA during the years 2014 and 2016. In contrast, the Main Nile region showed a significant decline in the TWSA during the wet period, ranging from ~4 Gt./yr. in 2002 to −3 Gt./yr. in 2020. Both the Sudd Basin and Main Nile regions display significant water volume losses during the dry period (Figure 6B). The Sudd Basin displays an average of ~−6 Gt./yr. during the wet period. For the Main Nile region, except for the period from 2002 to 2004, the TWSA displays significant negative records of ~−3 Gt./yr. of water loss. The net change in TWSA over the regions (Figure 6C) indicates that the Sudd Basin exhibits a net record of positive storage between 2003 and 2008, and between 2014 to 2015. The Main Nile region, however, shows declining storage from ~4 to ~0.5 Gt./yr. between 2004 to 2005. The net TWSA change in the Main Nile region presents a continuous decline in TWSA between 2009 to 2020.
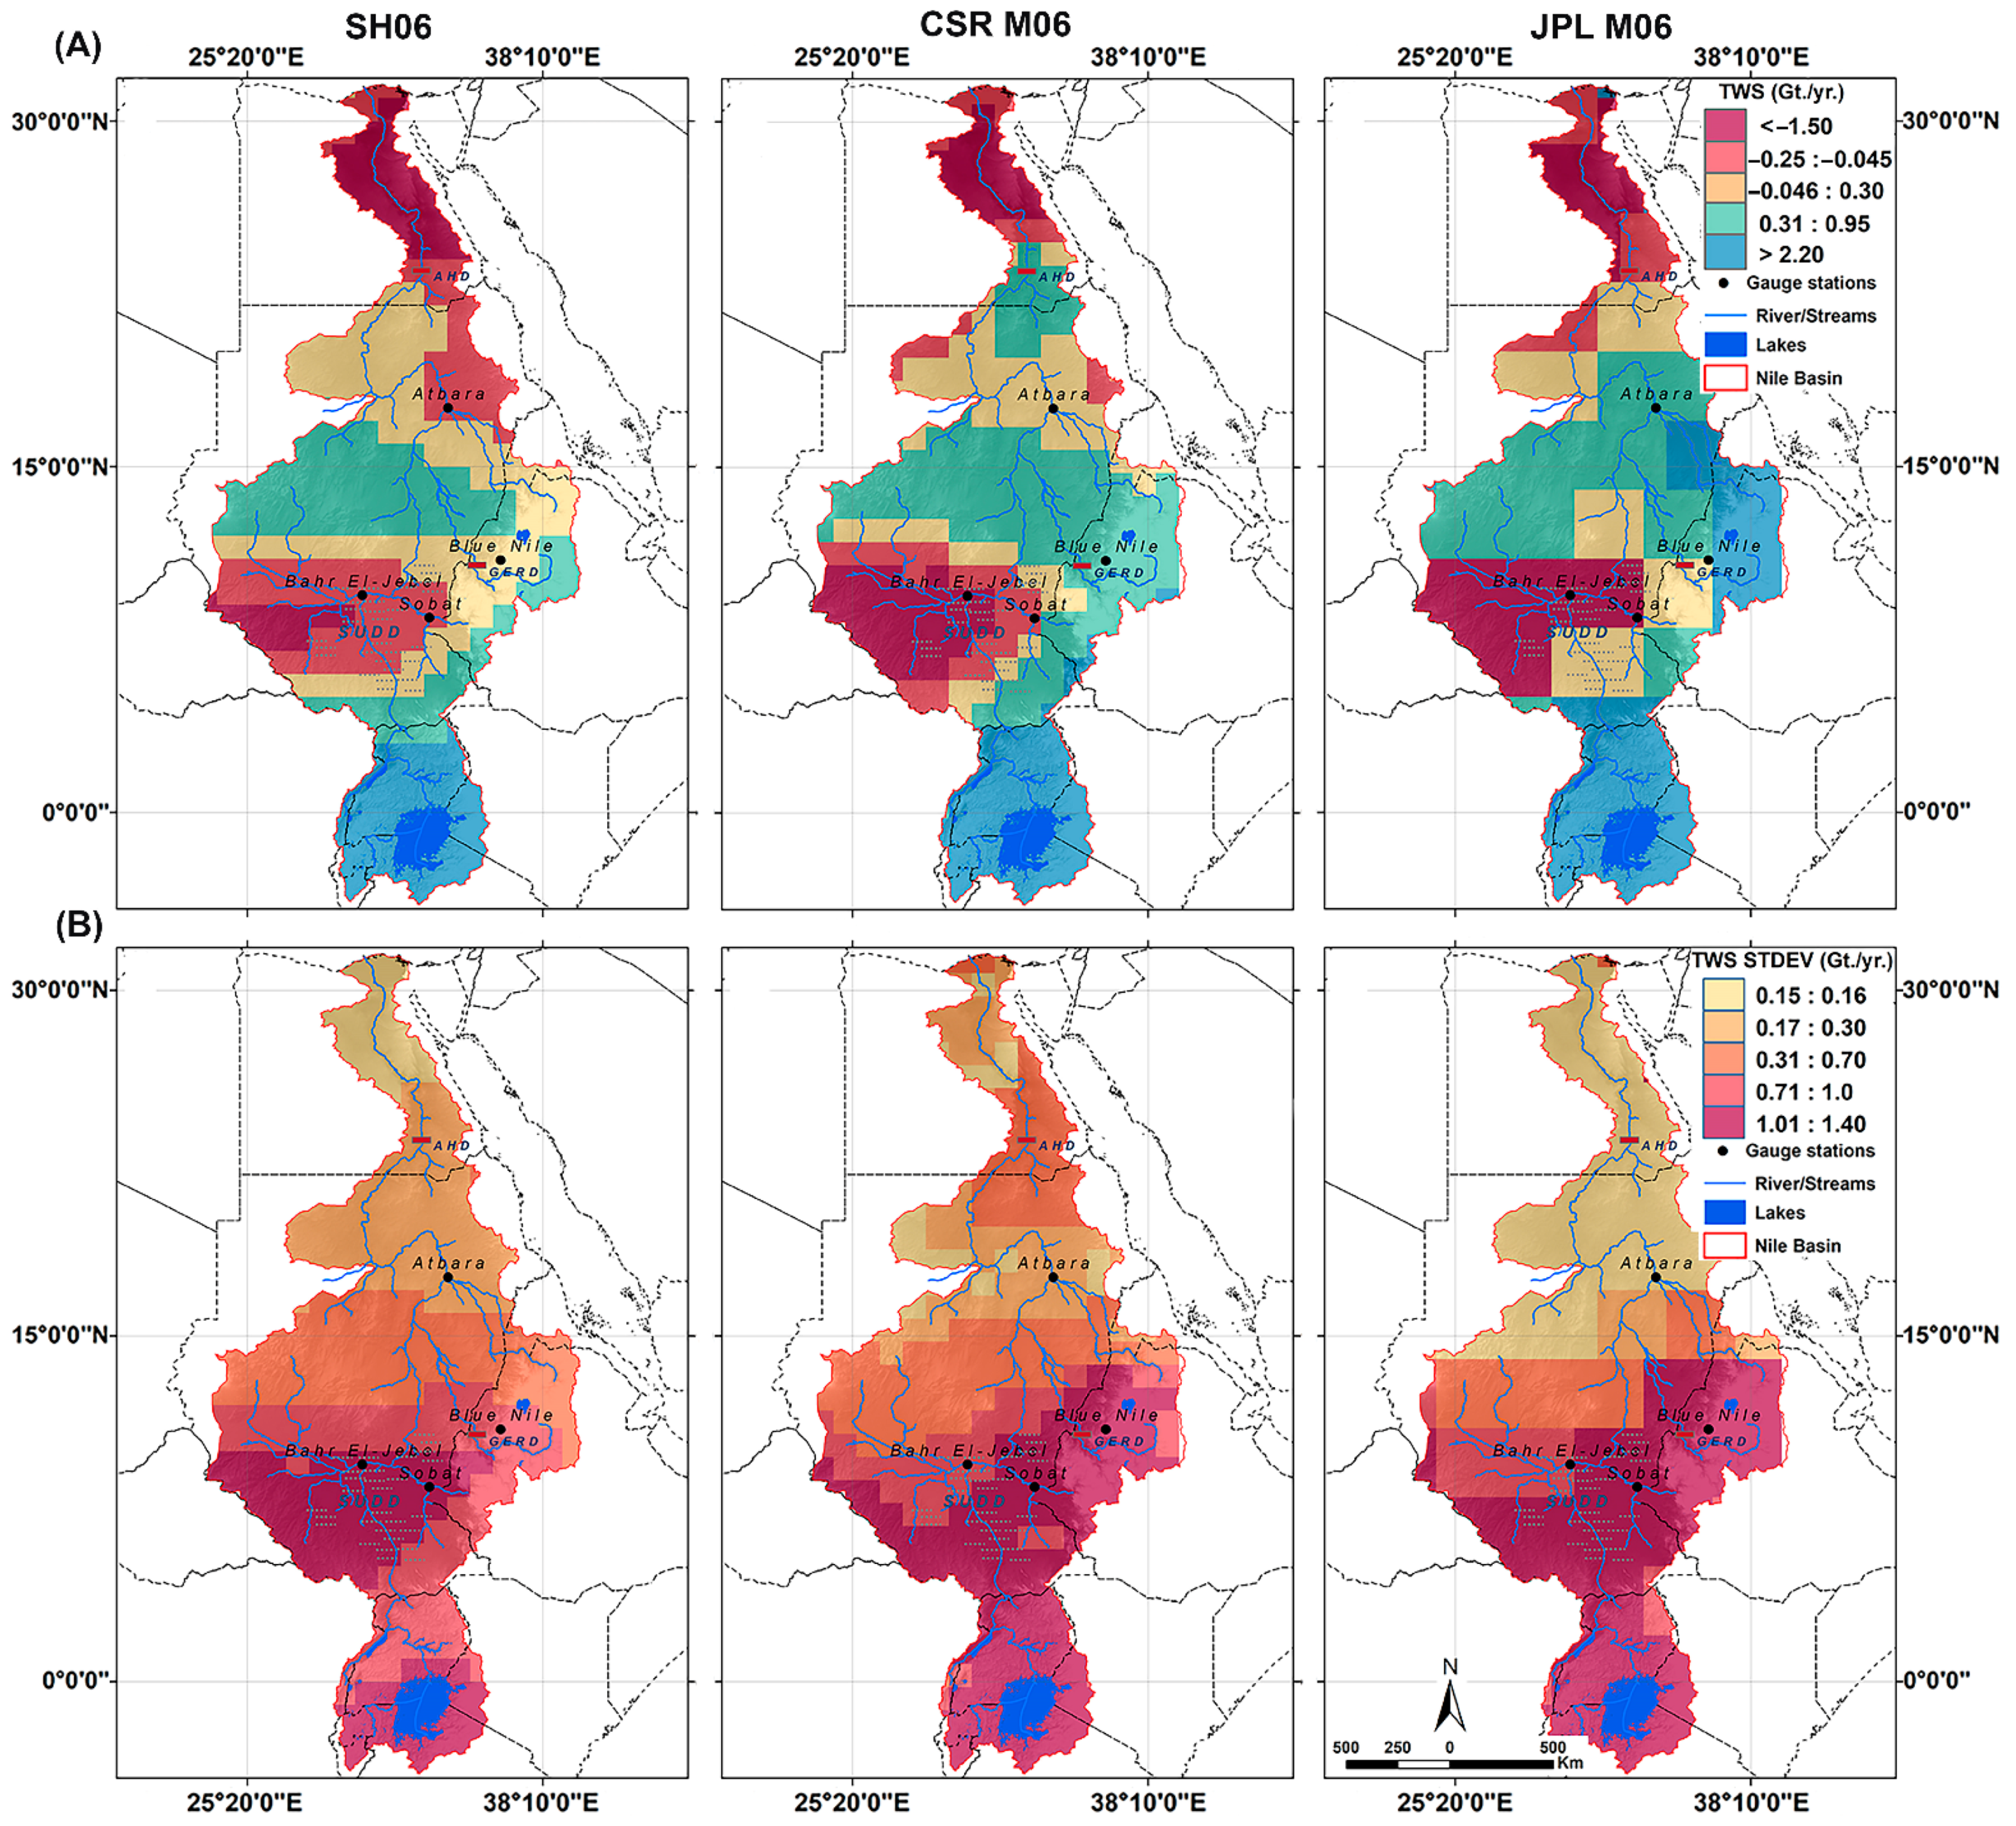
Figure 7 reveals the spatial patterns and distribution of TWSA across the NRB for the period between 2002 and 2017 using the mean annual average and standard deviations of SH06, CSR-M06, and JPL-M06 solutions. Spatially, the reported patterns are consistent with the temporal trends reported in Figure 4. Overall, a positive TWSA annual average is observed across the Equatorial Lake region in the south, and the Ethiopian Highlands east of the BNB (water source regions). While a largely negative annual average is recorded across the water sink areas including the Sudd Basin, west WNB, and Main Nile in the north. Specifically, based on an ensemble average of three solutions, during the study period, the Equatorial Lake region displayed a positive increase of about 0.74 Gt./yr., while the sink region in the west (Sudd Basin, Sobat, and Bahr El-Jebel areas) experienced declines of between −0.25 Gt./yr. and −0.49 Gt./yr. The higher levels of water reductions are observed at the stream junctions at the Bahr El-Jabal area. The eastern portions of the WNB, BNB, and northward at the confluence region of the White Nile and the Blue Nile rivers also had positive TWSAs of between 0.25 Gt./yr. to 0.49 Gt./yr. Finally, the desert area in the northern portion of the basin declined by about −0.25 Gt./yr.
The standard deviation plots for the three solutions, Figure 7B, indicate the spatial variability of the TWSA across the Nile region. From south to north, there is a strong deviation from the mean—between 1.23 Gt./yr. to 0.74 Gt./yr.—at the southern Equatorial Lake region, the Western WNB, and the eastern BNB. While, northward, across the Main Nile region, the standard deviation degrades gradually to around ~0.12 Gt./yr. indicating that less temporal variability in the TWSA estimates is observed further to the north of the basin. Overall, the TWS variability in the NRB degrades northward, following the general pattern of the precipitation records in the region. Extensive precipitation occurred across the Equatorial Lake region and the Ethiopian Highlands, opposed to the west portion of the WNB and the Main Nile region.
The mean annual average TWSA period between 2018 to 2020 is represented using GRACE-FO TWS estimates using an ensembled SH06, CSR-M06, and JPL-M06 solution (Figure 8). Figure 8A shows the TWS distribution over the NRB between 2018 to 2020. Over the southern portion of the basin, the Equatorial Lake region exhibits a positive increase in TWS of 1.23+ Gt./yr. Northwards over the Sudd Basin, Sobat, and Bahr El-Jebel areas, the TWS fluctuates between +0.25 Gt./yr. to −0.25 Gt./yr. The western portion of the WNB, the BNB area, and the area at the junction between the White Nile and the Blue Nile rivers display positive TWS values that scale between 0.30 to ~2.20 Gt./yr. The desert area in the northern portion of the basin exhibits a significant decline in the TWS trajectories between −0.25 Gt./yr. to −1.23 Gt./yr. The standard deviation (Figure 8B) during the studied periods indicates a strong deviation from the mean, between 1.23 Gt./yr. to 0.74 Gt./yr., at the southern Equatorial Lake region and the White Nile basin. The standard deviation degrades gradually to around 0.12 Gt./yr. further toward the desert portion of the basin.

4.3. Past TWS Changes in the NRB (1901–2002)

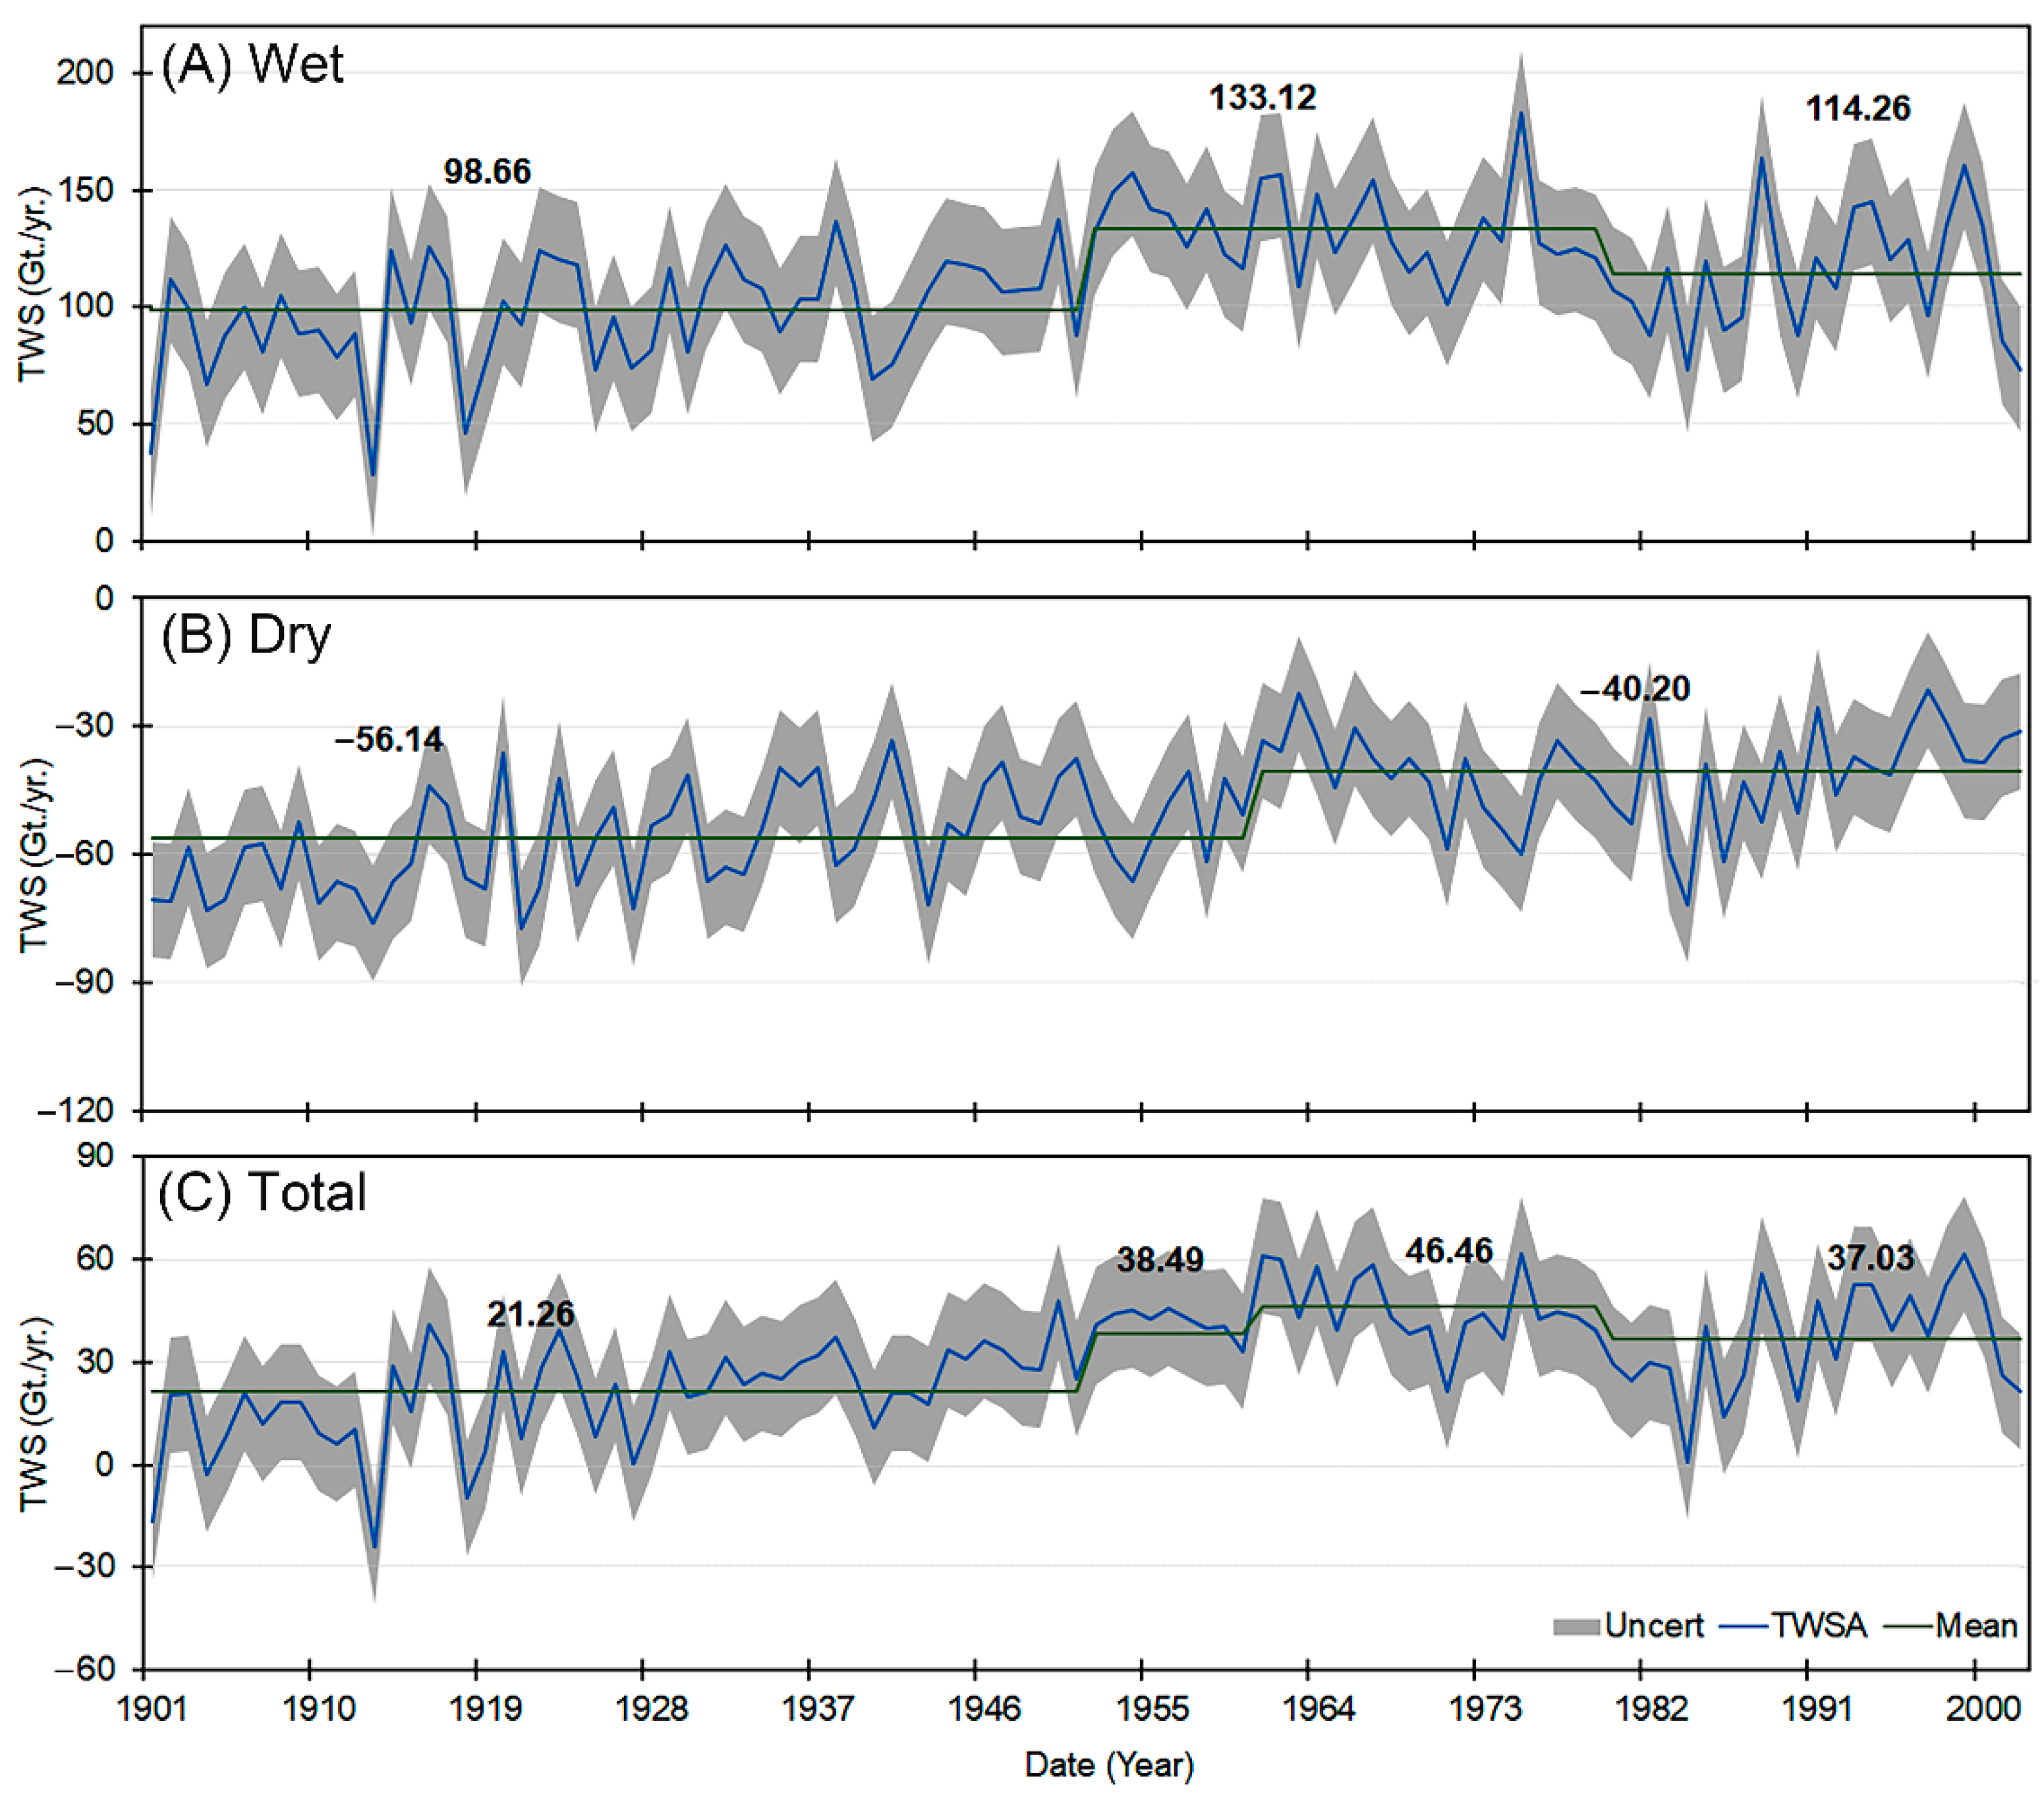
The monthly reconstructed TWSA was developed for the period before GRACE-era between 1901 to 2002 (see Figure S1B in the Supplementary Info). Figure 9 summarizes the general temporal pattern of the reconstructed TWSA using mean annual TWSA estimates during the wet (Figure 9A), the dry (Figure 9B), and the net changes in the two seasons (Figure 9C). The results show substantial yearly variation in the TWSA across the NRB. During the wet period (Figure 9A), there are three eras of changes in the TWSA annual mean (regime shift), between 1901 to 1951 with ~98 Gt./yr. of TWS. Then, between 1952 to 1979, the mean annual TWSA peaked at ~133 Gt./yr. During the period from 1980 to 2002, the mean annual TWSA slightly decreased to 114 Gt./yr. These records indicated that the TWS during the wet season over the basin had witnessed a positive increase of ~17%. The dry period (Figure 9B) also showed slight temporal changes in the TWSA annual average with two identified periods of storage reductions of ~−56 Gt./yr. between 1901 to 1960 and ~−40 Gt./yr. from 1961 to 2002. Overall, the TWS storage witnessed a recovery of ~28% during the dry season. The net changes in the TWS (Figure 9C), show four identified positive periods—between 1901 to 1951, 1952 to 1960, 1961 to 1979, and 1980 to 2002—of an average storage of 21 Gt./yr., 38 Gt./yr., 46 Gt./yr. and 37 Gt./yr., respectively. With an average increase in the TWS of 76%. The uncertainty bounds (gray area) are represented by one standard deviation of the total time series.

4.4. Future TWS Scenarios in NRB (2021 to 2050)

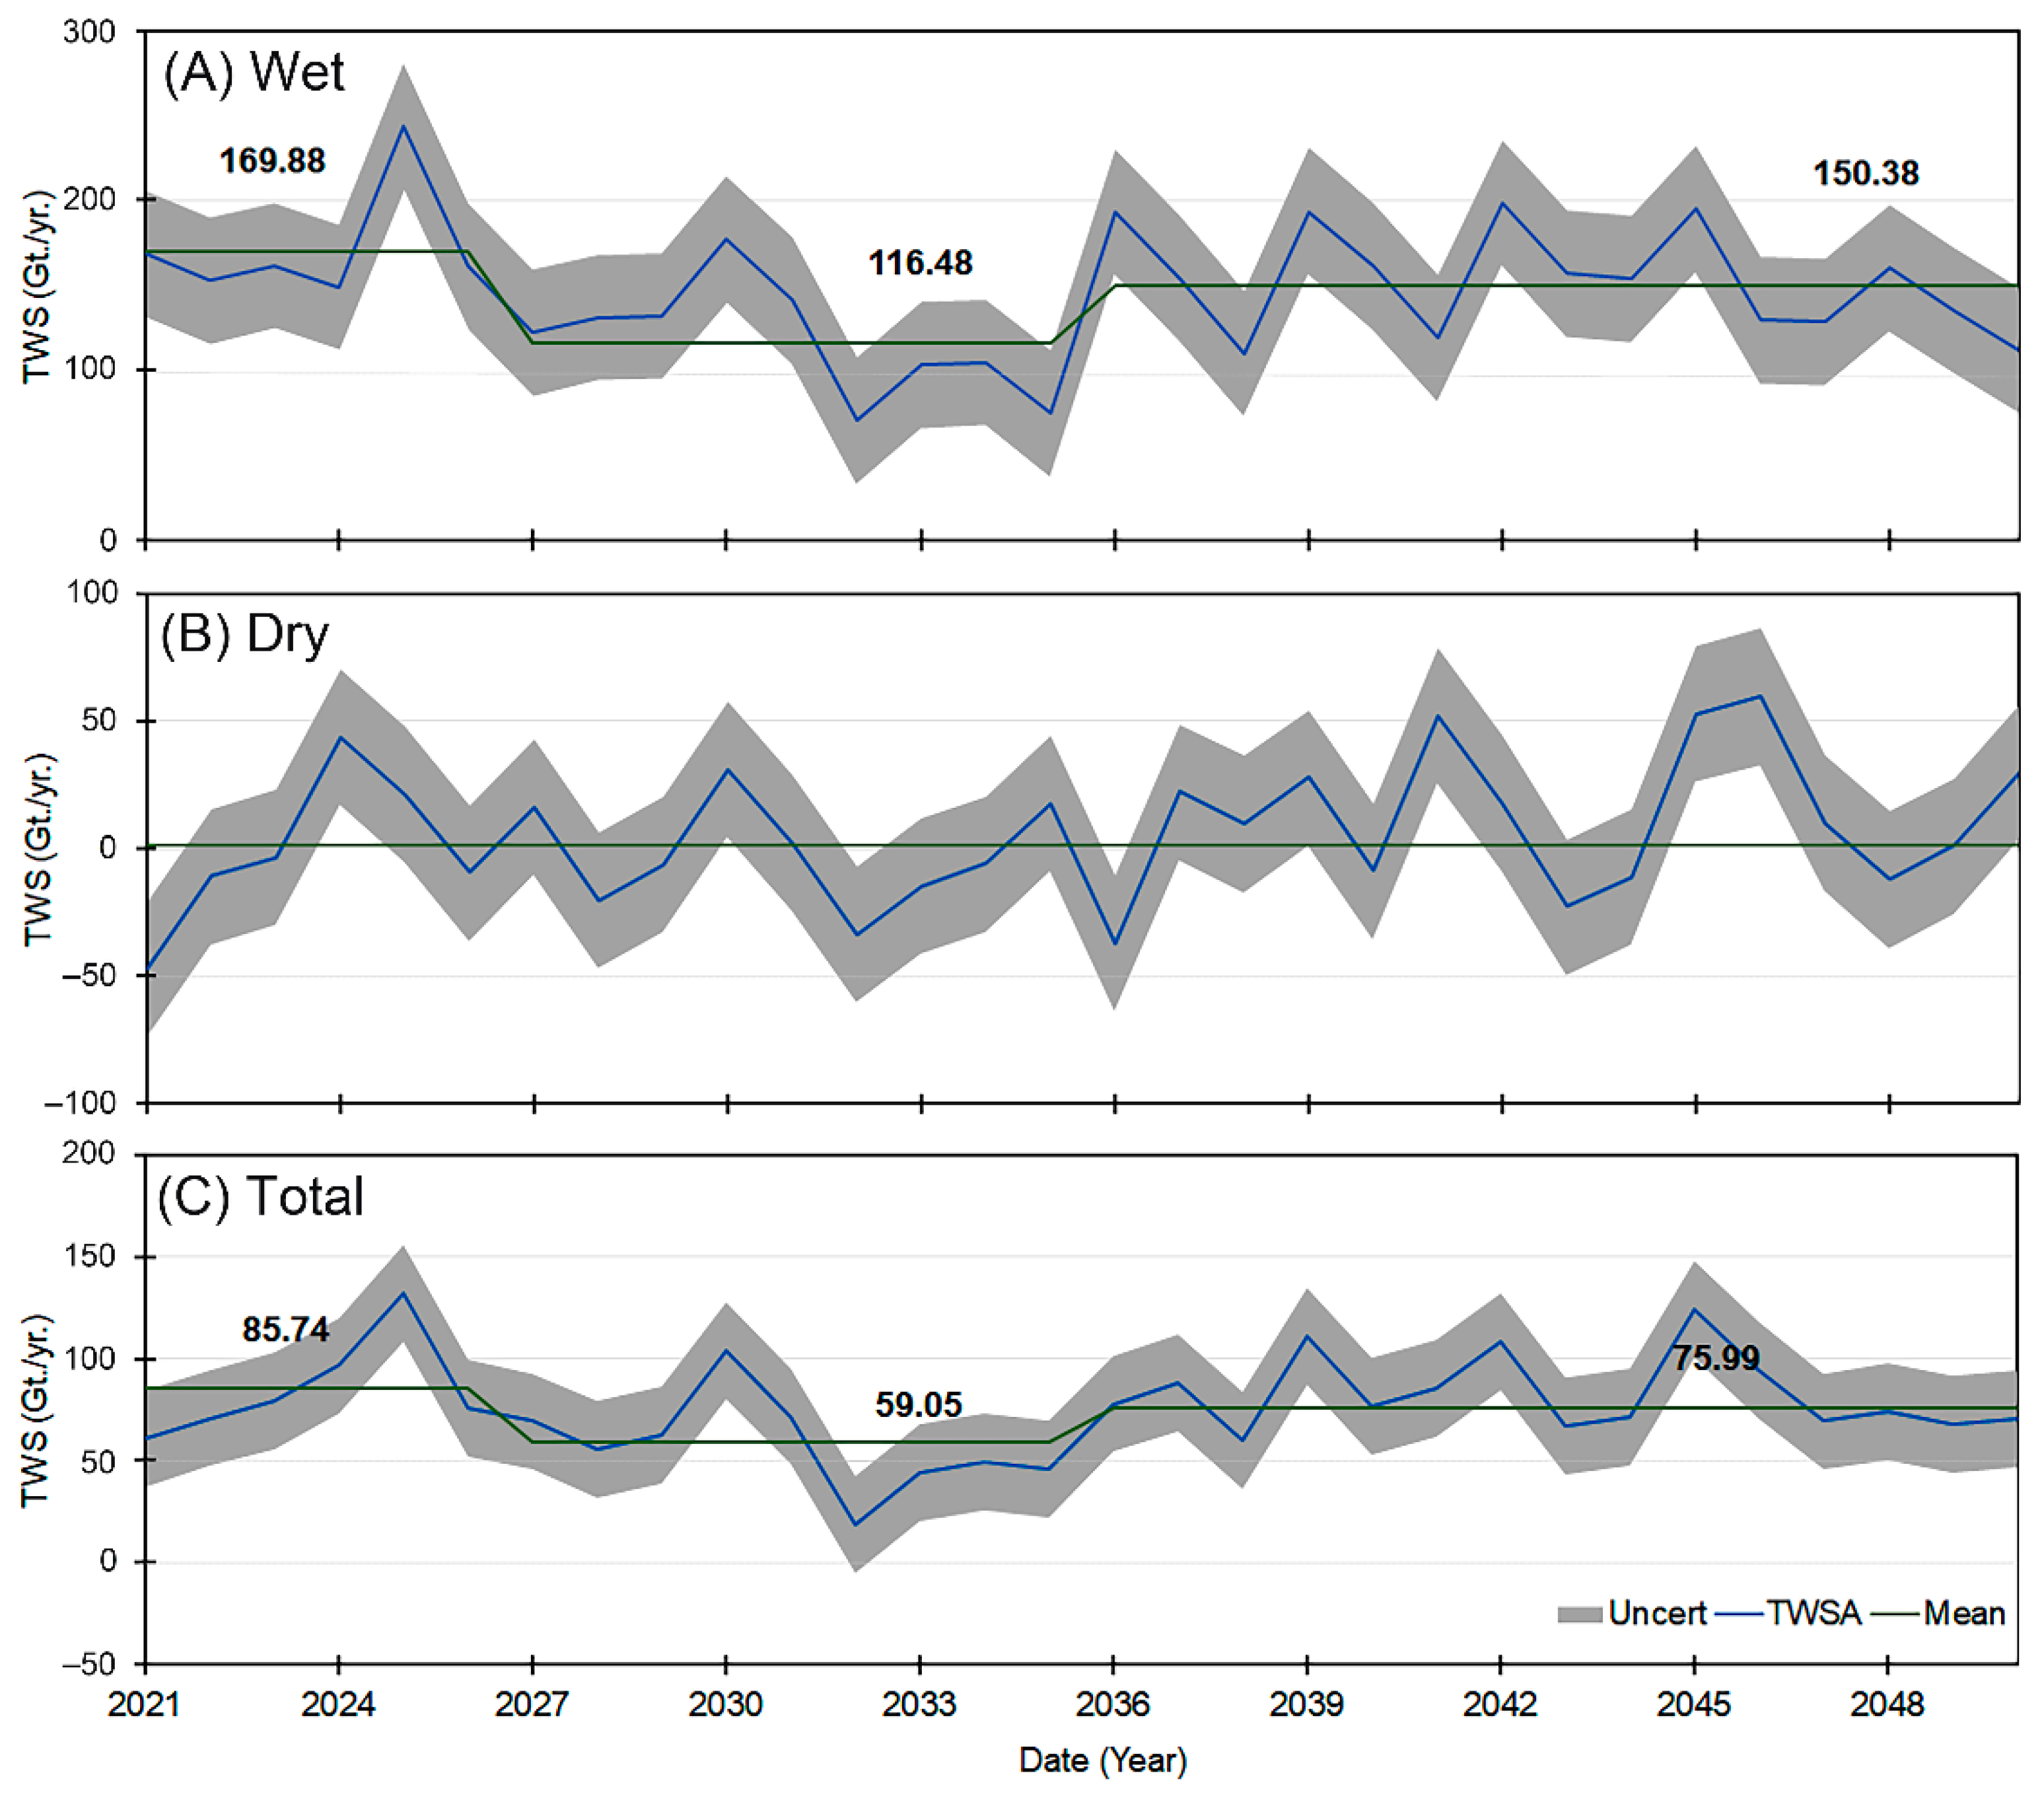
The TWSA in the NRB region was projected for the period 2021 and 2050. Figure S5 shows the monthly projected TWSA record. The future precipitation and temperature records were used to estimate the TWSA following the methodology reported in Section 3.6. Figure 10 summarizes the overall temporal variability in the TWSA estimates using mean annual average records during the wet season (Figure 10A), the dry season (Figure 10B), and the total changes (Figure 10C). Three main regions of TWSA regime shift were recorded, between 2021 to 2025, 2026 to 2035, and from 2036 to 2050 of ~170 Gt./yr., 116 Gt./yr., and 150 Gt./yr., respectively. The projected TWSA between 2021 to 2050 suggests a reduction in the TWS between 11 to 30% during the rainy season. The projected TWSA records show insubstantial increase changes in the TWSA mean during the dry period across the basin. While the net changes TWS, Figure 10C, indicates three periods of positive TWS between 2021 to 2026, 2027 to 2035, and between 2036 to 2050 of 86 Gt./yr., 59 Gt./yr. and 76 Gt./yr., respectively. However, these positive records, the projected TWS between 2021 to 2050 unveiled reduction rates between 10 to 30%. The uncertainty bounds (gray area) are represented by one standard deviation of the total time series.

4.5. Drought and Flooding in the NRB

4.5.1. GRACE-Based TWSD between 2002 to 2020

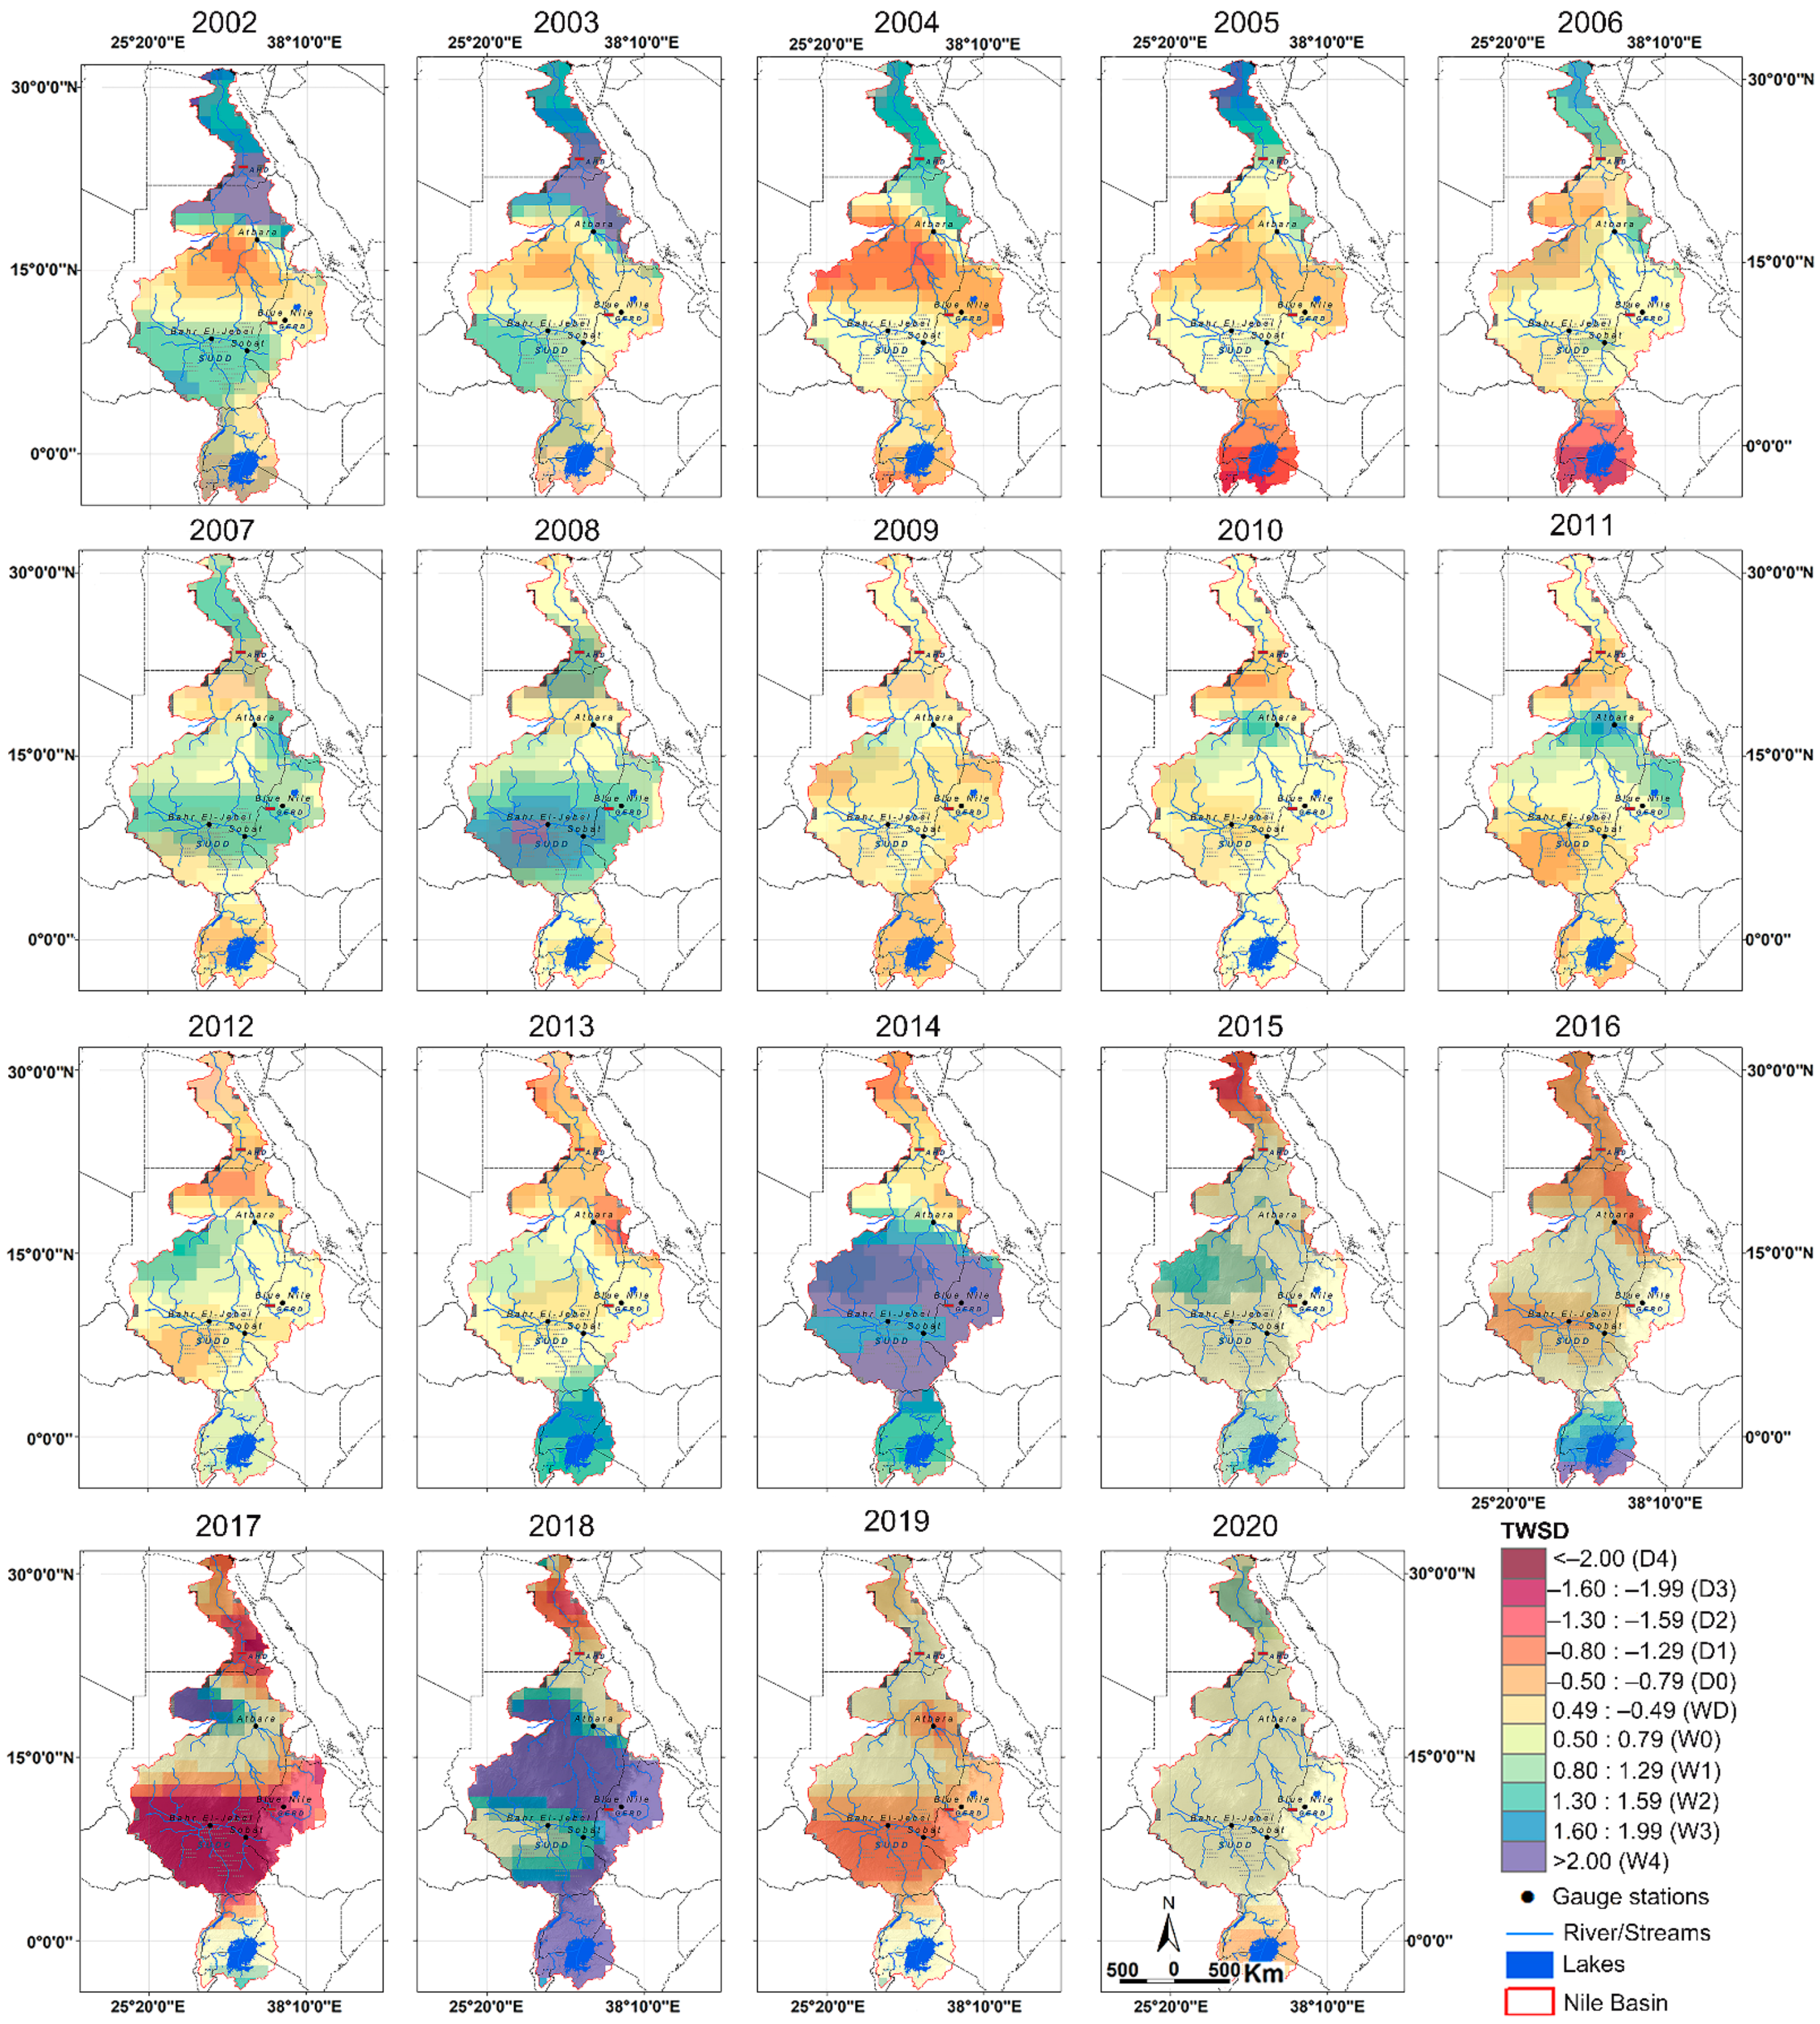
Spatially, Figure 11 shows the yearly TWSD across the NRB between 2002 to 2020 using ensemble SHs and mascons data. Table S3 shows the standard thresholds for the TWSD levels. As may be expected for a large and heterogenous basin, spatially, the TWSD varies from extremely wet to extremely dry conditions for different portions of the basin. For example, the Equatorial Lake region in the south was characterized by abnormally dry (D0) in 2002 to exceptional drought conditions (D4) between 2005 and 2006. During the next two years, however, the region recovered to near normal status. On the other hand, the main stem of the Nile experienced generally moderate to favorable drought conditions between 2002 and 2007 but adverse drought conditions between 2014 and 2018. For most parts of the basin, the years 2007, 2008, 2014, and 2018 were wet to abnormally wet, while 2004, 2006, 2017, and 2019 were abnormally dry.
Other regions across the basin showed remarkable dryness and wetness records between 2002 to 2020. The western portion of the White Nile at the Bahr El Jabel area, for instance, exhibited moderate to very wet conditions during the years of 2002, 2003, 2007, and the year 2008. The years 2014 and 2018 showed extreme wet conditions. The Bahr El Jabel region demonstrated normal conditions for the period between 2004 to 2006, and the years of 2009, 2010, 2013, and 2020. In the years 2017 and 2019, the Bahr El Jabel region recorded extreme dry conditions to moderately dry conditions, respectively. The northern portion of the White Nile Basin at the junction between the White Nile and the Blue Nile rivers fluctuated from moderate drought in 2002 to severe drought conditions in 2004. This was followed by slightly dry conditions being recorded in 2005, then a progressive recovery started from 2006 to the year 2008, accompanied with very wet condition status. The years 2014 and 2018 showed exceptionally wet conditions across the region. The BNB region changed from ranking as normal conditions in 2002 to moderately dry conditions in 2004 and 2005. The severity levels show recovered conditions in the years 2007 and 2008. Extreme dry conditions were recorded in 2017, then, the 2018 ranking was towards the extremely wet conditions. Additional research is recommended to link these recent hydrological extremes with climatic teleconnection indices.

4.5.2. NRB Drought and Flooding Records (1901 to 2050)

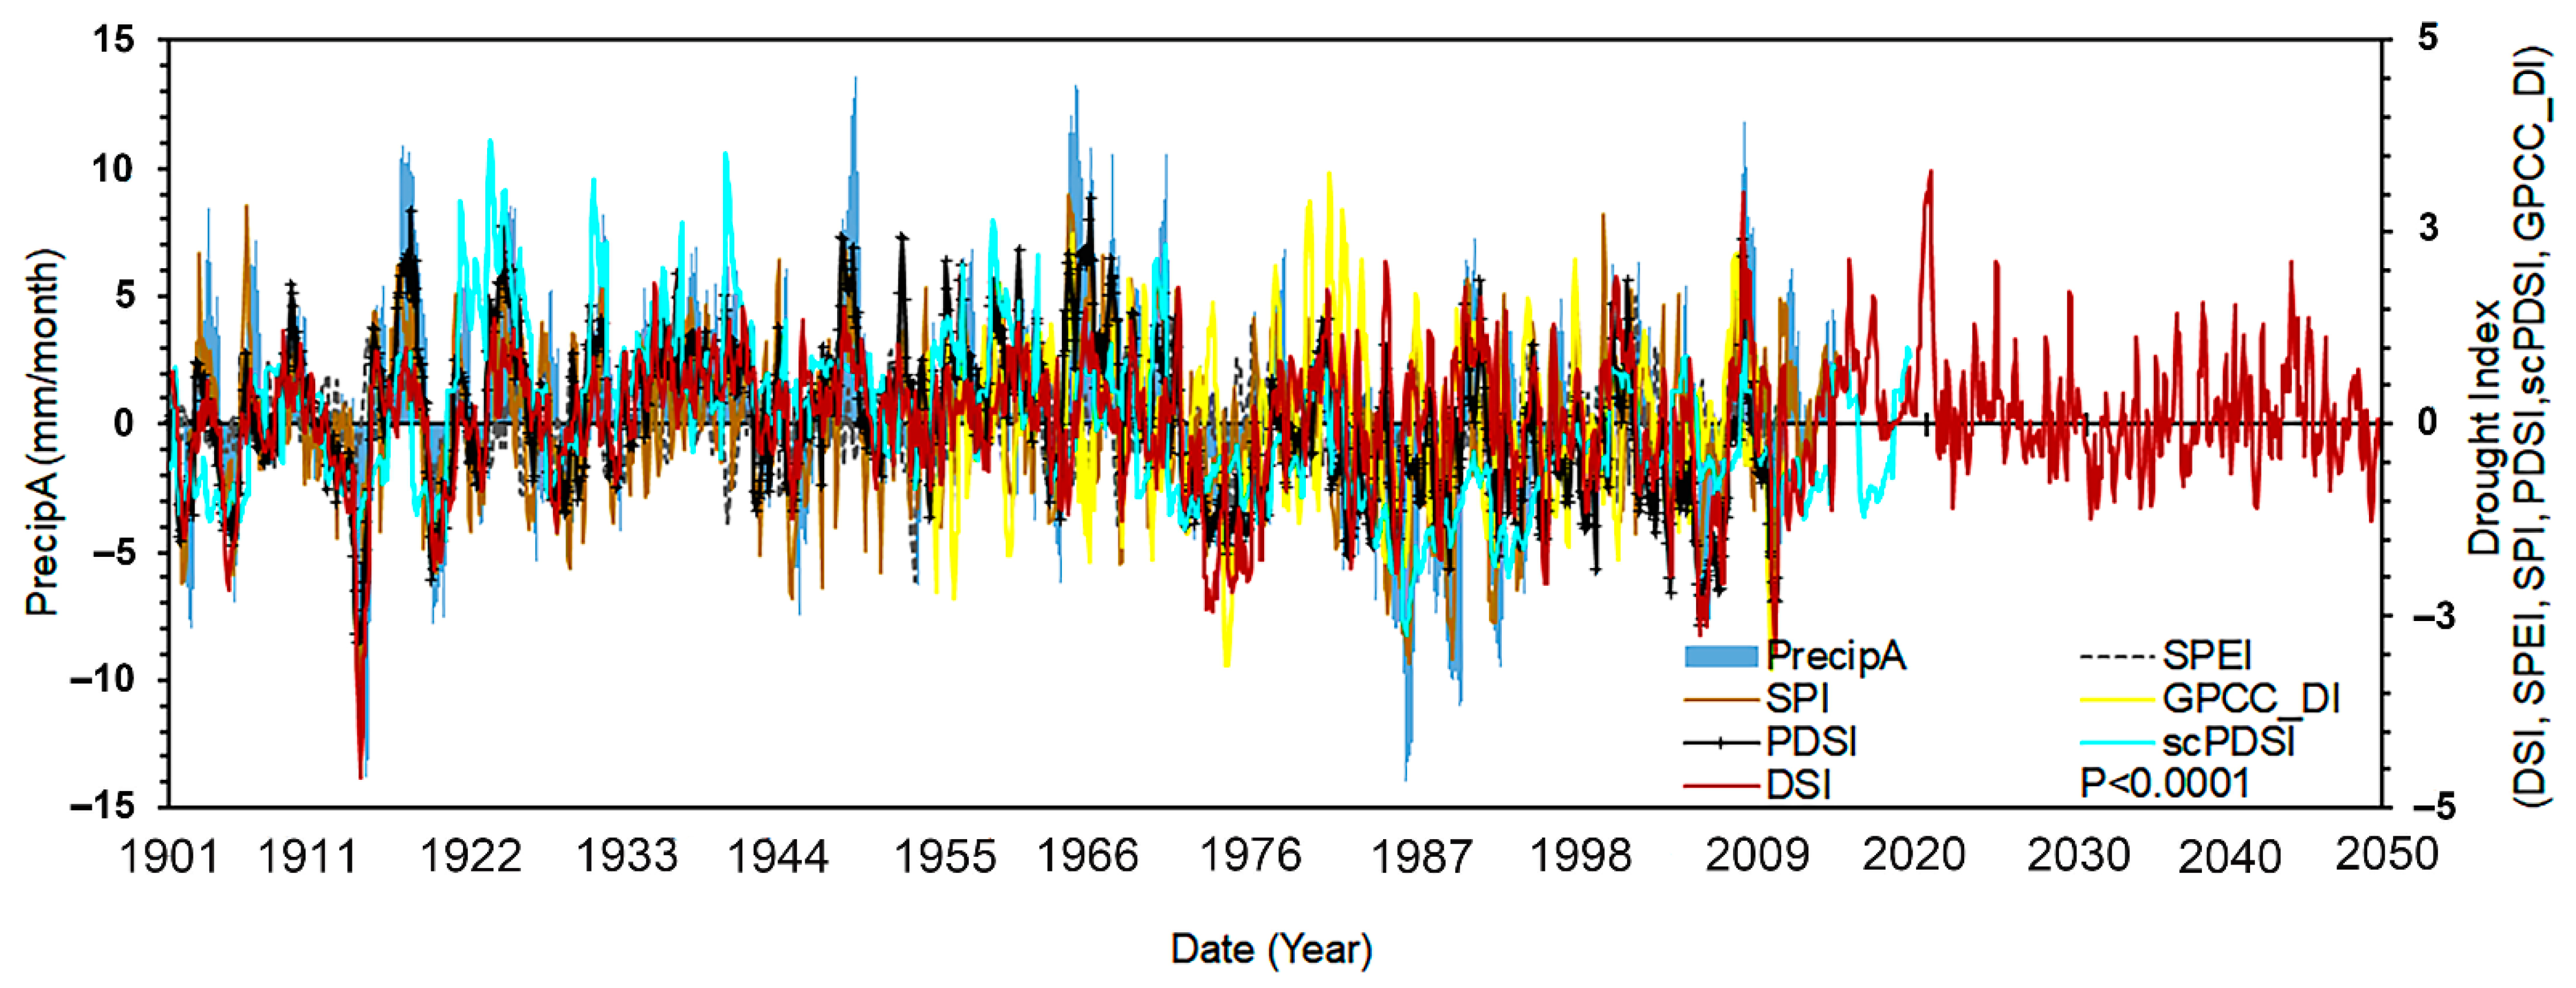
Temporal, historical, current, and future drought and flooding events were established using statistical-based TWSD between 1901 to 2050. The TWSD records were compared to other standardized drought indicators including SPI, SPEI, scSPDI, PDSI, GPCC_DI, and TWSD indicators, along with the precipitation anomaly in the basin. Figure 12 shows both droughts (−2) and flooding (+2) records from standardized drought indices. Noteworthy, the inter-comparison between each drought indicator and precipitation anomalies indicates strong temporal coevolution (p-value 0.0001). According to Table S3, Figure 12 clearly illustrates different exceptionally dry periods, i.e., during the years of 1913, 1918, 1943, 1984, 1987, 1990, 1992, 2004, and 2009. Additionally, remarkable wet periods were noted during the years 1917, 1924, 1930 to 1940, 1964, 1989, 2000, 2007, 2014, and the year 2020. Between 2021 to 2050, the future TWSD record indicates fewer dry conditions relative to normal, and slightly wetter conditions. Additional research is recommended to investigate the association of historical variabilities to multidecadal climatic variability in the region.
Analysis of the entire reconstructed (retrogressive/inclusive), present, and projected (exclusive) periods (1901 to 2050) shows that the NRB has more wet periods (86 years) compared to 64 years of dry records (Figure 13). While the dry years are fewer, they tend to be deeper. For example, both the droughts of 1912 and 1971–1973 exceeded −2.0 on the DSI scale. Furthermore, the wet and dry years tend to occur as runs. The longest wet run-length occurred during the decade from 1931–1940. The longest dry run occurred between 2000 and 2006. Finally, the projection suggests that future wet and dry periods in the Nile Basin will be mild compared to the historical period.
Figure 14 summarizes the drought and flooding recurrence intervals and frequencies in the NRB between 1901 to 2050. The frequency analysis indicates that the recurrence interval of the normal to moderate wet or dry conditions is ~6 years, indicating that the basin has short-term drought and flooding intervals. Longer recurrence periods in the basin are less likely to occur. The analysis also shows that from 1901 to 2050, the recurring drought events are less intense compared to the flooding record that displays significantly higher reoccurrence intervals with time.
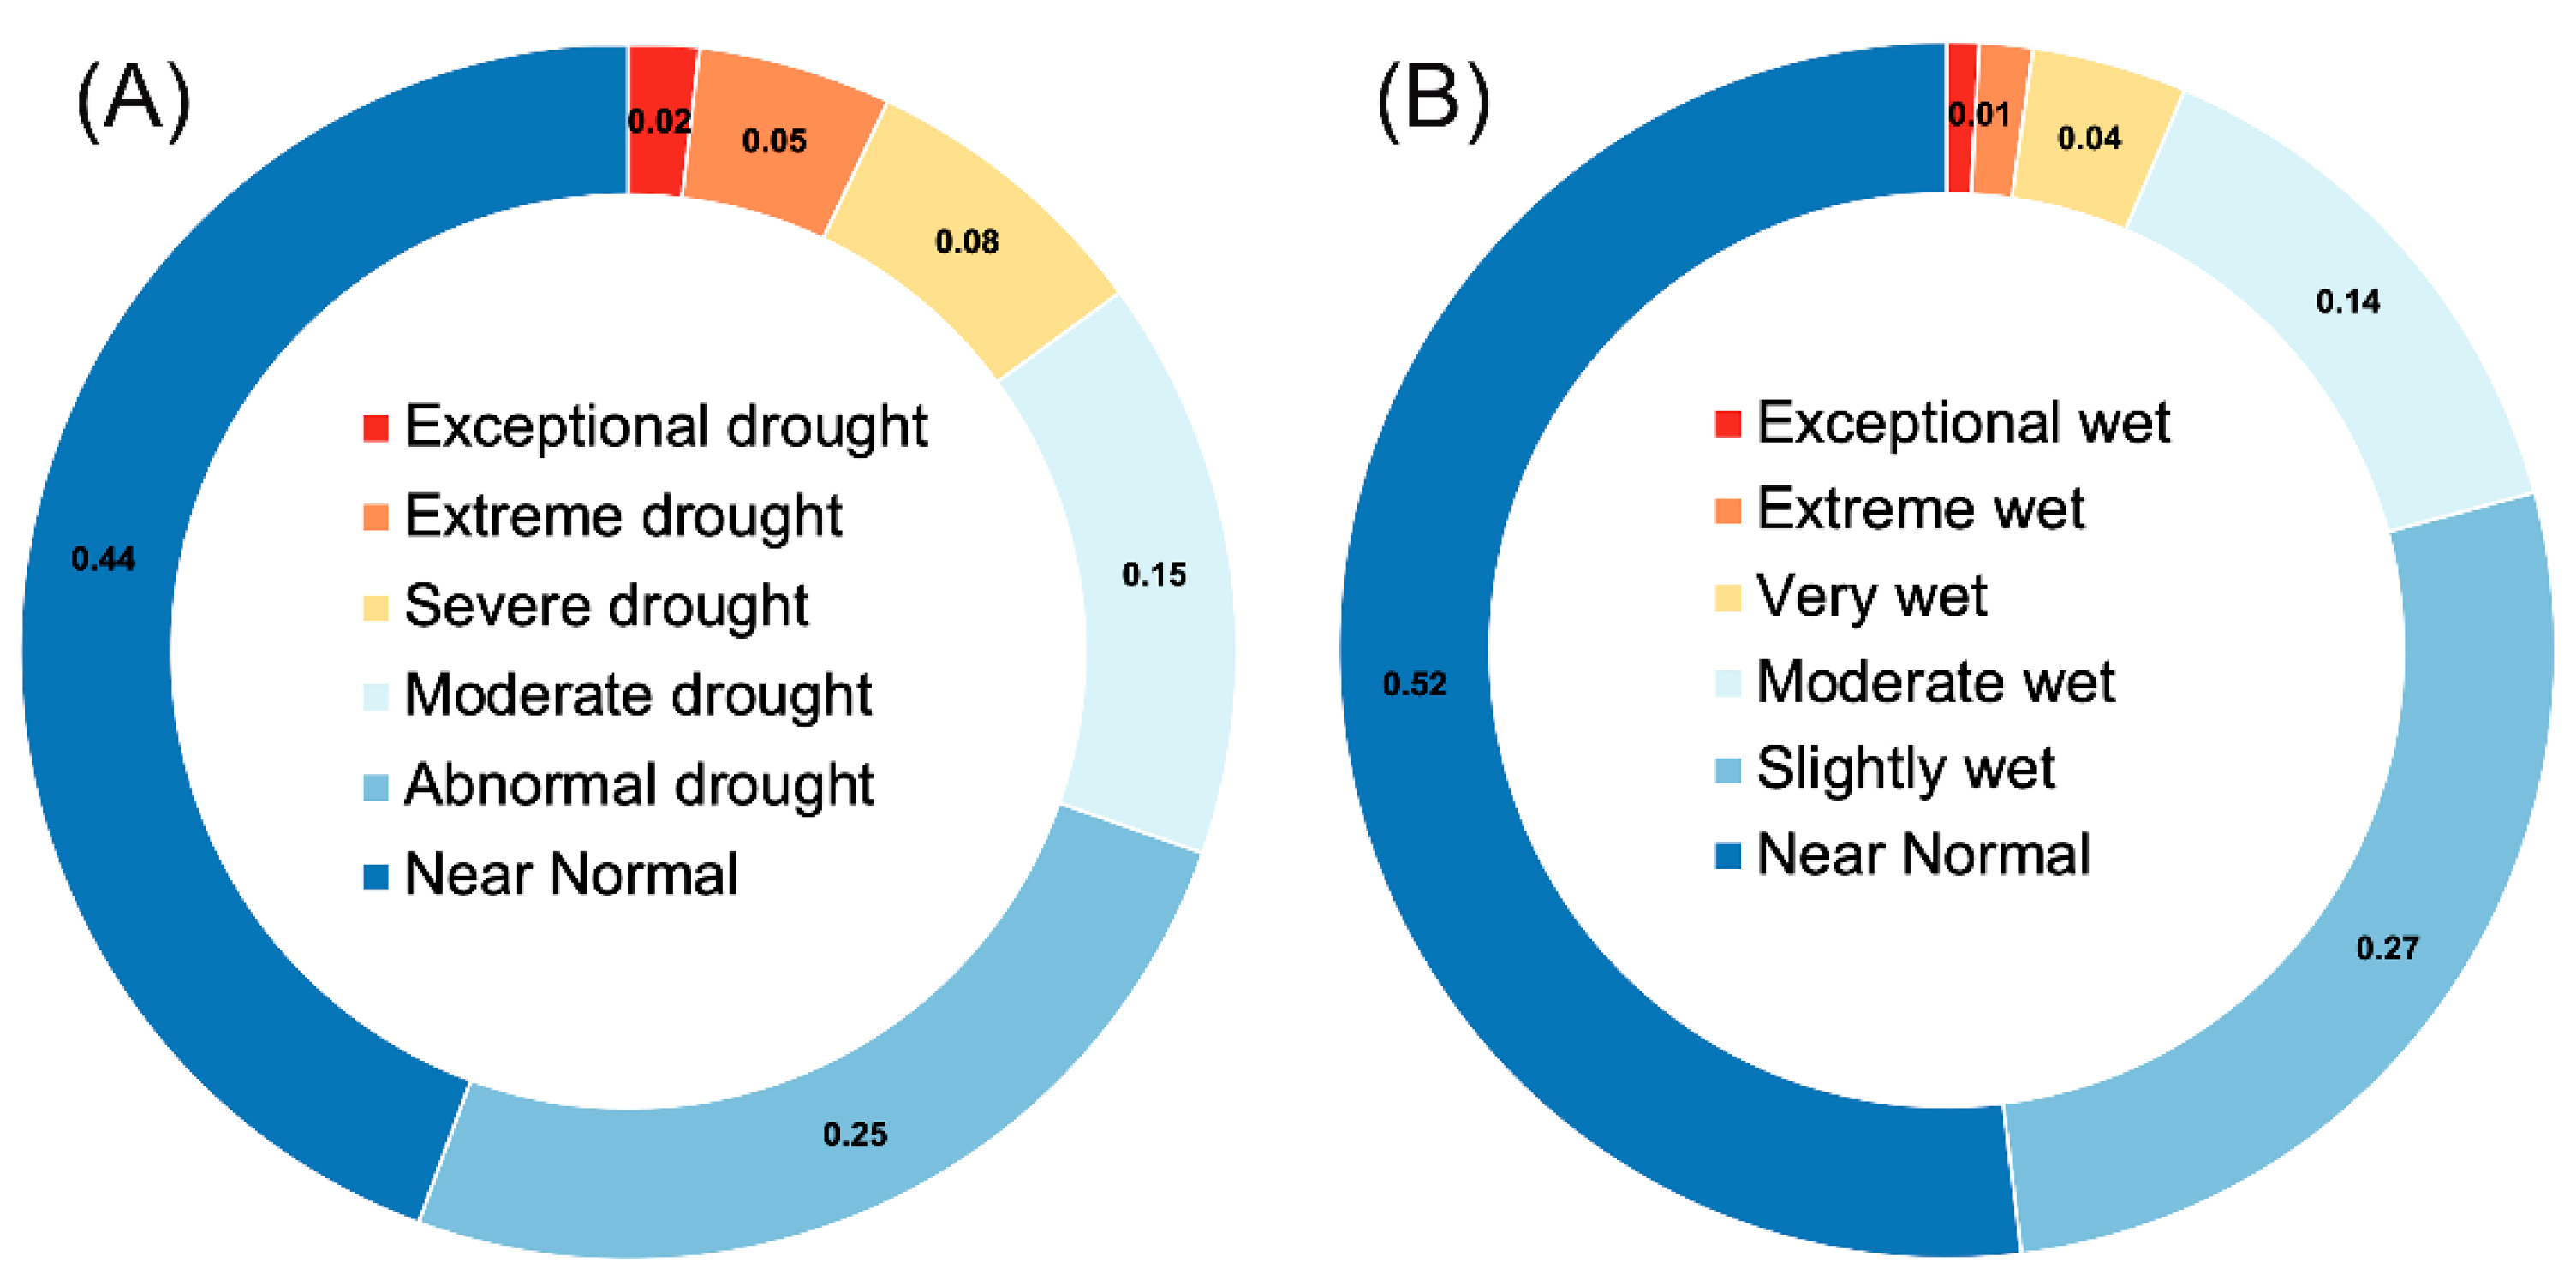
Figure 15 illustrates the exceedance probabilities of different severity levels for both drought and flooding incidents in the NRB between 1901 to 2050. Overall, the exceedance probability indicates that the near-normal conditions for both hydrological extremes, drought and flooding events, occupy a percentage of 44 and 52%, respectively. The extreme and exceptional drought or flooding incidents are likely to occur between 2 and less than 4% in the basin. Moreover, the exceedance probabilities for the abnormally dry and slightly wet conditions range between 25 and 27%. With respect to the other severity levels, they are likely to occur with a percentage chance of less than 14%.

5. Discussion

5.1. Water Storage in the NRB

Distinctive from current research on the NRB that utilizes GRACE-based TWS measurements to study water storage variation relative to hydroclimate variability [24], the recent changes in the hydrological mass variation in the basin [58,99] interpret the variability of different water storage components [26,65] and identify the TWS spatial drivers [30]. This research explicitly provides new insights into the water storage availability and changes in the NRB using GRACE/GRACE-FO between 2002 to 2020, GRACE-like TWS data between 1901 to 2002, and their foreseen projections between 2021 to 2050. From this new perspective, the NRB between 2002 to 2020 has experienced a humid phase; more storage was received towards the end of the studied period compared to the initial dates. Additionally, a cursory review of existing research showed that the maximum reported water storage from surface water flow in the NRB is ~100 BCM/yr. [100]. Herein, however, our analysis shows that the total available water storage from all sources (surface, groundwater storage) is in the order of 200 BCM/yr., nearly double the previous estimate (see Figure S6). Several factors may account for the differences between the TWS amount reported here and previous estimates. First, GRACE based TWS estimates represents all water storage down to the deepest levels of the aquifer, including water locked away in fossil or hydrologically inactive aquifers. As such, there is an important caveat to these new storage figures; the total amount of available water cannot be extracted and used due to technological and economic constraints. Therefore, the new figure likely overestimates the amount of useable storage within the basin. Despite such differences, GRACE-derived TWS estimates have the advantage of being spatially distributed rather than lumped as in most previous estimates. It also most likely that the conventional water budget-based approach underestimates the total amount of water storage within the basin. Moreover, even with these new higher storage estimates, the basin would still be considered a water-stressed [65] based on current and projected population figures.
Accordingly, this research, contributes to the ongoing efforts to improve the TWSA assessment and its associated dynamics for transboundary river basins. While other research studies on the NRB utilized lumped/basin-average TWSA estimates, i.e., [58], the current study unequivocally acknowledges the spatial variability of TWSA at different parts of the NRB region. Spatially, the TWS displays uneven storage patterns across the region. The Equatorial Lake region, the WNB, and the BNB, for instance, show positive TWSA records with higher standard deviation values due to the strong seasonal amplitude fluctuations. The northern portion of the basin, on the other hand, displays a remarkable decline in the TWS values with low standard deviation values due to minimal seasonal amplitudes. Moreover, analysis of the TWS at mascon-level across two main water towers (Lake Victoria and BNB), and two other water sink regions (Sudd Basin and Main Nile), specifies the TWSA dynamics during the GRACE and GRACE-FO era.
Our results highlight another aspect of the Nile Basin hydrology not generally appreciated. That is, while the BNB contributes between 57 to ~60% of the Nile’s runoff, the WNB—especially the Equatorial Lake region—holds twice the total water storage of the BNB. This is important because the NRB is sensitive to changes in the TWSA; an increase/decrease of +/−~2 cm of TWS across the basin would increase/decrease the total available storage by (+/−)~60%. Accurate information on the available water storage greatly facilitates water resource planning and management throughout the basin.

5.2. Hydrological Extremes in the NRB

Several research studies have implemented various statistical tools to extend the GRACE-TWS to before-GRACE-era, i.e., [31,92,101,102,103,104]. Fewer studies, however, have provided GRACE-like TWS in the NRB during the past century, i.e., [31]. Furthermore, no available research has considered the future TWS trajectories in the region. Herein, armed with the new 100 yearlong TWSA simulated time series, this research provides inclusive insights about the long-term hydrological extremes in the region. Via a probabilistic conditional distribution fitting, the GAMLSS model, we produced all possible probabilistic estimates for the TWSA using a PDF distribution; GAMLSS outputs were evaluated using standard evaluation criteria (see Section 4.1 and Table S2). Aside from this, we employed another deterministic approach, the ARIMA model, to fill the one-year-gap between GRACE and GRACE-FO missions. As noted, all model evaluation results are satisfactory to excellent.
Thus, using GAMLSS-based extended TWS records and the future projections, the 20th-century TWS variabilities were evaluated during the wet and dry seasons across the basin. Overall, the wet-months were more frequent compared to the dry-months in the region. The projected TWS indicated insignificant TWS changes during the dry seasons compared to normal, and slightly wetter conditions during the wet seasons. These projections are compared favorably with those reported by, e.g., [43,46], that showed a trend towards increased water resources in the NRB and considerable changes. For example, the increased TWS is likely driven by the projected increase in precipitation over the basin during the next five decades. While the temperature will also likely increase, the net precipitation increase exceeds the expected higher water losses via ET due to higher temperatures [20]. There are good grounds for presuming that such changes result from global warming, the intensity of which has increased considerably in the last few decades.
Additionally, both GRACE-TWS and the extended GRACE-like TWS estimates were utilized to produce a long-term comprehensive water deficit indicator, TWSD. Compared with other traditional drought indicators, i.e., SPI, SPEI, and PDSI, the GRACE-based TWSD illustrates a holistic overview of the storage deficit/surplus within all stocks of waters. Noteworthy, exiting research studies, i.e., [60,103,105,106], used GRACE-based TWSD to illustrate the recent water storage shortage within a basin or study region during GRACE-era [103]. Yet, the extended TWSA records were not fully implemented to produce retrogressive records of TWSD. Furthermore, the TWSD has not yet been employed to evaluate the future hydrologic extremes (drought and flooding) severity/magnitude and recurrence frequencies in the NRB basin or similar regions. Based on TWDS results, the NRB is dominated by near-normal conditions relative to the extreme events. Additionally, the frequency intervals of the normal to moderate wet or dry conditions are within ~6 years intervals. Such recurrence highlights the fact the NRB needs a short period to fully recover from any extreme conditions. The upcoming 30+ projections have confirmed that the NRB will experience more frequent near normal-conditions. Yet, the NRB is too sensitive to any hydroclimatic variability. Noteworthy, historical drought and flooding records in the NRB have shown that six feet (~2 m) of water in the river channel above/below normal during flood/drought season could bring life and prosperity to the land and renew its fertility. Alternatively, this could bring severe drought and famine, reducing agricultural yields by three-quarters [107].

5.3. Call for Further Water Resources Planning

The reported TWSA trajectories as well as the uniquely produced TWSD thresholds call for further water resources planning in the region. Recently, the basin has experienced a substantial water storage during the wet season. Additionally, the total water loss at the Sudd Basin area is approximately twice the water storage loss at the Main Nile region. In total, half of the Sudd water inflow is lost to evapotranspiration [64]. Despite the recent and future TWS projections, the NRB is still threatened by significant water shortage status. Currently, for instance, many parts across the basin are under severe water stress conditions. In Egypt, for example, the available water to use per capita is approximately less than 500 cubic meters a year [65]; a threshold that represents an absolute water scarcity condition. Moreover, the NRB between 2021 to 2050 is projected to experience a severe water deficit of between ~11 to 30% during the wet period. The available water storage, consequently, will not be enough to meet the peoples’ demands of many riparian states in the future. The projected population in the basin is expected to reach 800 million by 2050. More than ever before, the riparian states need to reinforce conservative agreements for future water planning and new water-sharing policies, especially during flood seasons. Establishing an intrinsic water-sharing agreement among riparian nations to govern the water resources allocation in the region is a must. It is not an easy task for the 11 countries in the basin to agree to a water-sharing plan. However, the key to ensuring cooperation among riparian states is good information sharing and technical cooperation to avoid chronic water shortages in the future.

6. Conclusions

TWS is critical for understanding the water availability and changes in the NRB. This research, hence, developed a comprehensive 100+ yearlong TWSA record for the pre-GRACE, GRACE (GRACE and GRACE-FO), and beyond-GRACE-era between 1901 to 2050. The GRACE-like TWS data were derived using a probabilistic statistical distribution fitting via the GAMLSS model. Herein, the results provide new insights into the TWSA variability, drought and flooding severity/magnitude, duration, and recurrence frequencies in the NRB. The results showed the following key findings:
-
The present TWS changes in NRB (2002 to 2020) indicated that the basin is experiencing a generally humid phase. In recent years, the NRB has received more water storage. Furthermore, the TWSA exhibited more wet cycles compared to the dry cycles in the region.
-
Temporally, the net changes in TWAS were assessed during the wet, dry seasons across the NRB, two main water source regions (Lake Victoria and BNB), and two main water sink areas (Sudd and Main Nile regions).
-
TWS basin-wide water storage records indicated that the basin has received ~50 Gt./yr. to ~310 Gt./yr. during the wet season, and lost ~30 Gt./yr. to ~70 Gt./yr. during the dry season.
-
While the BNB contributes between 57 to ~60% of the surface runoff in the Nile River, the Lake Victoria region (Equatorial Lake area) holds at least twice as much water storage during the wet season compared to BNB.
-
The Sudd Basin, on the other hand, loses twice the amount of water storage compared to that of the Main Nile region.
-
Spatially, GRACE-based TWSA displayed positive changes at the Lake Victoria and BNB regions, with strong temporal variability. While in the area to the north, the TWS degrades negatively with less temporal variability.
-
The basin-wide TWSA from GRACE shows significantly higher storage amounts compared to the reported water storage volume from surface water flow (i.e., 200 BCM vs. 100 BCM). The discrepancy in the TWSA estimates is likely due to the fact that the GRACE satellite detects all forms of available storage, including the deep groundwater component, as well as the anthropogenic influence on different water stocks.
-
The past and future TWS changes in the NRB between 1901 to 2002 and 2021 to 2050, respectively, were evaluated using standard evaluation criteria. Overall, the model performance showed satisfactory results. The uncertainty bounds for the extended (past and future) TWS records were illustrated using standard deviation.
-
The Past TWS records indicated that NRB has witnessed a positive increase in TWS of ~17% during the rainy season. While, the TWS has recovered by ~28 during the dry periods.
-
The future TWS scenarios suggest slight positive changes in the TWSA mean during the dry period across the basin. However, TWS in the NRB is subjected to decrease by 10 to 30% from 2021 to 2050.
-
The flooding and drought analysis using the reconstructed (inclusive), present, and projected (exclusive) TWSD records between 1901 to 2050 showed that the NRB has more wet periods, 86-years, compared to 64-years of dry record.
-
The recurrence analysis of the drought and flooding records in the NRB between 1901 to 2050 revealed short drought and flooding intervals of ~6 years recurrence intervals.
-
The exceedance probability analysis for the extreme hydrological events in the basin indicates that the near-normal conditions occupy a higher percentage of 44 and 52% relative to the extreme events.
-
The future projections of TWSA indicate an insignificant increase in the TWS during the wet and dry seasons of the projected TWSA compared to the overall mean average. The reason for this is likely related to the projected increase in the precipitation amount in the region.
The complex hydrology and social–environmental systems in the Nile Basin, historically, have required delicate negotiations and management. Future dynamics related to population growth, climate change, and the socio-economic and political decisions of the countries which cohabit the Nile Basin will require an ever-increasing amount of information regarding the shared resources of the NRB, of which, water is by far the most important. This study demonstrates that GRACE data can provide unique new insights and perspectives relevant to the sustainable management of water resources in the Nile River and similar transboundary river systems.

Supplementary Materials

The following are available online at https://www.mdpi.com/2072-4292/13/5/953/s1, Figure S1: Coevolution between monthly GPCC and CRU precipitation data (A), and GAMLSS-based TWSA and CLMS TWSA (B), Figure S2: Simulated ARIMA TWS (A), the dark blue of the plot is the one-year gap, plot (B) shows the residual the model, Figure S3: The year-to-year changes in TWSA (A) between 2002 to 2020, and the yearly changes (compared to the overall average) of the TWSA (B) across the NRB, Figure S4: GRACE-based net storage changes between 2002 to 2020 across BNB (A), WNB (B) and Atbara sub-basins (C), Figure S5: Monthly projected TWSA between 2021 to 2050. Figure S6: NRB storage figures from TWS (A), GWS (B), SMS (C), and runoff (D) between 1948 to 2014 from the CLSM-F2.5 LSM. The storage-based figures are relatively higher relative to the runoff in the basin. Table S1: Source information for datasets and drought indicators utilized in this research, Table S2: GAMLESS (A) and ARIMA (B) models’ goodness-of-fit criteria, Table S3: Standard thresholds used to identify the drought and flooding severity levels, Table S4: Summary of the regime-shift analysis of the NRB mean TWS between 2002 to 2020, Table S5: Summary of the regime-shift analysis of the NRB in the TWS cyclic component between 2002 to 2020.

Author Contributions

Conceptualization, E.H. and A.T.; methodology, E.H., and P.-E.K.; validation, E.H., and P.-E.K.; formal analysis, E.H., P.-E.K., and A.T.; writing—review and editing, E.H. and A.T.; supervision and funding acquisition, A.T. All authors have read and agreed to the published version of the manuscript.

Funding

This research was funded by The Provost Office at Binghamton University.

Data Availability Statement

This study was performed based on public-access data. Data utilized in this research can be requested by contacting the first author at a reasonable request.

Acknowledgments

The authors thank the Provost’s office at the State University of New York (SUNY) at Binghamton for providing research funds for this study. Thanks also go to the provost office at Illinois State University, Normal, IL, the USA for supporting this research. The authors express their sincere gratitude to three anonymous reviewers who provided very constructive comments on the manuscript. We also extend our thanks to the acting associate editor for handling our manuscript. We also wish to thank the three GRACE data centers: the Center for Space Research (CSR) at the University of Texas, Austin; the Jet Propulsion Laboratory (JPL, NASA California, USA); and the Deutsches GeoForschungsZentrum (GFZ, Potsdam, Germany), the GRACE Tellus and the Physical Oceanography Distributed Active Archive Center (PO.DAAC) for the data access. We also wish to thank NASA Goddard Earth Science Data and Information Service Centers, the CRU, and GPCC, for the various datasets used in this work.

Conflicts of Interest

We would like to declare that the first two authors are the acting guest editors for the Special Issue “Remote Sensing Applications for Water Scarcity Assessment” for the journal Remote Sensing. However, neither of the two authors nor any other acting guest editor of this Special Issue have handled this manuscript at any stage. The authors declare no conflict of interest.

References

  1. Shahin, M. Hydrology of the Nile Basin; Elsevier Science Publishing Company Inc.: New York, NY, USA, 1985. [Google Scholar]
  2. Sutcliffe, J.V.; Parks, Y.P. The Hydrology of the Nile; IAHS Special Publication no. 5; The International Water Management Institute: Colombo, Sri Lanka, 1999. [Google Scholar]
  3. Collins, R. The Nile; Yale University Press: New Haven, CT, USA; London, UK, 2002. [Google Scholar]
  4. Said, R. The Geological Evolution of the River Nile; Springer: Berlin/Heidelberg, Germany, 1981. [Google Scholar]
  5. Swain, A. Challenges for water sharing in the Nile basin: Changing geo-politics and changing climate. Hydrol. Sci. J. 2011, 56, 687–702. [Google Scholar] [CrossRef] [Green Version]
  6. Karyabwite, D.R. Water Sharing in the Nile River Valley; UNEP/DEWA/GRID: Geneva, Switzerland, 2000. [Google Scholar]
  7. Oestigaard, T. Nile Issues, Small Streams from the Nile Basin Research Programme; Fountain Publishers: Kampala, Uganda, 2010. [Google Scholar]
  8. Arsano, Y. Ethiopia and the Nile; Center for Security Studies (CSS): ETH Zurich, Switzerland, 2007; p. 324. [Google Scholar]
  9. NBI. Nile Basin Water Resources Atlas; Seid, A.H., Mbuliro, M., Alarabawy, M., Eds.; Nile Basin Initiative (NBI): Entebbe, Uganda, 2017. [Google Scholar]
  10. Haub, C.; Kaneda, T. 2013 World Population Data Sheet: Population Reference Bureau (PRB). 2013. Available online: https://www.prb.org/2013-world-population-data-sheet/ (accessed on 1 March 2019).
  11. Abu-Zeid, M. The river Nile: Main water transfer projects in Egypt and impacts on Egyptian agriculture. In Long-Distance Water Transfer; Tycooly International Publishing Ltd.: Dublin, Ireland, 1983; pp. 6–34. [Google Scholar]
  12. Basheer, M.; Wheeler, K.G.; Ribbe, L.; Majdalawi, M.; Abdo, G.; Zagona, E.A. Quantifying and evaluating the impacts of cooperation in transboundary river basins on the Water-Energy-Food nexus: The Blue Nile Basin. Sci. Total Environ. 2018, 630, 1309–1323. [Google Scholar] [CrossRef]
  13. Oestigaard, T. Water Scarcity and Food Security Along the Nile Politics, Population Increase and Climate Change; Nordiska Afrikainstitutet: Uppsala, Sweden, 2012. [Google Scholar]
  14. Turhan, Y. The hydro-political dilemma in Africa water geopolitics: The case of the Nile river basin. Afr. Secur. Rev. 2020, 1–20. [Google Scholar] [CrossRef]
  15. Carlson, A. Who owns the Nile? Egypt, Sudan, and Ethiopia’s history-changing dam. Origins 2013, 6, 2–8. [Google Scholar]
  16. Ayele, H.; Li, M.-H.; Tung, C.-P.; Liu, T.-M. Impact of Climate Change on Runoff in the Gilgel Abbay Watershed, the Upper Blue Nile Basin, Ethiopia. Water 2016, 8, 380. [Google Scholar] [CrossRef] [Green Version]
  17. Conway, D. Water resources: Future Nile river flows. Nat. Clim. Chang. 2017, 7, 319–320. [Google Scholar] [CrossRef] [Green Version]
  18. Dessie, M.; Verhoest, N.E.C.; Pauwels, V.R.N.; Admasu, T.; Poesen, J.; Adgo, E.; Deckers, J.; Nyssen, J. Analyzing runoff processes through conceptual hydrological modeling in the Upper Blue Nile Basin, Ethiopia. Hydrol. Earth Syst. Sci. 2014, 18, 5149–5167. [Google Scholar] [CrossRef] [Green Version]
  19. Gleick, P.H. The vulnerability of runoff in the Nile basin to climatic changes. Environ. Prof. 1991, 13, 66–73. [Google Scholar]
  20. Hasan, E.; Tarhule, A.; Kirstetter, P.-E.; Clark, R.; Hong, Y. Runoff sensitivity to climate change in the Nile River Basin. J. Hydrol. 2018, 561, 312–321. [Google Scholar] [CrossRef]
  21. Hurni, H.; Tato, K.; Zeleke, G. The Implications of Changes in Population, Land Use, and Land Management for Surface Runoff in the Upper Nile Basin Area of Ethiopia. Mt. Res. Dev. 2005, 25, 147–154. [Google Scholar] [CrossRef] [Green Version]
  22. Kebede, S.; Travi, Y.; Alemayehu, T.; Marc, V. Water balance of Lake Tana and its sensitivity to fluctuations in rainfall, Blue Nile basin, Ethiopia. J. Hydrol. 2006, 316, 233–247. [Google Scholar] [CrossRef]
  23. Swenson, S.; Wahr, J. Monitoring the water balance of Lake Victoria, East Africa, from space. J. Hydrol. 2009, 370, 163–176. [Google Scholar] [CrossRef]
  24. Awange, J.L.; Forootan, E.; Kuhn, M.; Kusche, J.; Heck, B. Water storage changes and climate variability within the Nile Basin between 2002 and 2011. Adv. Water Resour 2014, 73, 1–15. [Google Scholar] [CrossRef] [Green Version]
  25. Khaki, M.; Awange, J. Improved remotely sensed satellite products for studying Lake Victoria’s water storage changes. Sci. Total Environ. 2019, 652, 915–926. [Google Scholar] [CrossRef] [PubMed]
  26. Bonsor, H.C.; Mansour, M.M.; MacDonald, A.M.; Hughes, A.G.; Hipkin, R.G.; Bedada, T. Interpretation of GRACE data of the Nile Basin using a groundwater recharge model. Hydrol. Earth Syst. Sci. Discuss. 2010, 7, 4501–4533. [Google Scholar] [CrossRef] [Green Version]
  27. Shamsudduha, M.; Taylor, R.G.; Longuevergne, L. Monitoring groundwater storage changes in the highly seasonal humid tropics: Validation of GRACE measurements in the Bengal Basin. Water Resour. Res. 2012, 48. [Google Scholar] [CrossRef] [Green Version]
  28. Conway, D. From headwater tributaries to international river: Observing and adapting to climate variability and change in the Nile basin. Global Environ. Chang. 2005, 15, 99–114. [Google Scholar] [CrossRef]
  29. Conway, D.; Hulme, M. The Impacts of Climate Variability and Future Climate Change in the Nile Basin on Water Resources in Egypt. Int. J. Water Resour. Dev. 1996, 12, 277–296. [Google Scholar] [CrossRef]
  30. Hasan, E.; Tarhule, A. GRACE: Gravity Recovery and Climate Experiment long-term trend investigation over the Nile River Basin: Spatial variability drivers. J. Hydrol. 2020, 586. [Google Scholar] [CrossRef]
  31. Hasan, E.; Tarhule, A.; Zume, J.T.; Kirstetter, P.E. +50 Years of Terrestrial Hydroclimatic Variability in Africa’s Transboundary Waters. Sci. Rep. 2019, 9, 12327. [Google Scholar] [CrossRef] [Green Version]
  32. Hassan, A.; Jin, S. Water storage changes and balances in Africa observed by GRACE and hydrologic models. Geod. Geodyn. 2016, 7, 39–49. [Google Scholar] [CrossRef] [Green Version]
  33. Anyah, R.O.; Forootan, E.; Awange, J.L.; Khaki, M. Understanding linkages between global climate indices and terrestrial water storage changes over Africa using GRACE products. Sci. Total Environ. 2018, 635, 1405–1416. [Google Scholar] [CrossRef] [PubMed] [Green Version]
  34. Khaki, M.; Awange, J.; Forootan, E.; Kuhn, M. Understanding the association between climate variability and the Nile’s water level fluctuations and water storage changes during 1992–2016. Sci. Total Environ. 2018, 645, 1509–1521. [Google Scholar] [CrossRef] [PubMed] [Green Version]
  35. Hasan, E.; Khan, S.I.; Hong, Y. Investigation of potential sea level rise impact on the Nile Delta, Egypt using digital elevation models. Environ. Monit Assess. 2015, 187, 649. [Google Scholar] [CrossRef]
  36. Swenson, S.; Famiglietti, J.; Basara, J.; Wahr, J. Estimating profile soil moisture and groundwater variations using GRACE and Oklahoma Mesonet soil moisture data. Water Resour. Res. 2008, 44, 1–12. [Google Scholar] [CrossRef] [Green Version]
  37. Swenson, S.; Wahr, J. Estimating Large-Scale Precipitation Minus Evapotranspiration from GRACE Satellite Gravity Measurements. J. Hydrometeorol. 2006, 7, 252–270. [Google Scholar] [CrossRef] [Green Version]
  38. Tapley, B.D.; Bettadpur, S.; Ries, J.C.; Thompson, P.F.; Watkins, M.M. GRACE Measurements of Mass Variability in the Earth System. Science 2004, 305, 503. [Google Scholar] [CrossRef] [Green Version]
  39. Tapley, B.D.; Watkins, M.M.; Flechtner, F.; Reigber, C.; Bettadpur, S.; Rodell, M.; Sasgen, I.; Famiglietti, J.S.; Landerer, F.W.; Chambers, D.P.; et al. Contributions of GRACE to understanding climate change. Nat. Clim. Chang. 2019, 9, 358–369. [Google Scholar] [CrossRef]
  40. Scanlon, B.R.; Zhang, Z.; Rateb, A.; Sun, A.; Wiese, D.; Save, H.; Beaudoing, H.; Lo, M.H.; Müller-Schmied, H.; Döll, P.; et al. Tracking Seasonal Fluctuations in Land Water Storage Using Global Models and GRACE Satellites. Geophys. Res. Lett. 2019. [Google Scholar] [CrossRef]
  41. Scanlon, B.R.; Zhang, Z.; Save, H.; Sun, A.Y.; Muller Schmied, H.; van Beek, L.P.H.; Wiese, D.N.; Wada, Y.; Long, D.; Reedy, R.C.; et al. Global models underestimate large decadal declining and rising water storage trends relative to GRACE satellite data. Proc. Natl. Acad. Sci. USA 2018, 115, E1080–E1089. [Google Scholar] [CrossRef] [Green Version]
  42. Alemu, H.; Senay, G.; Kaptue, A.; Kovalskyy, V. Evapotranspiration Variability and Its Association with Vegetation Dynamics in the Nile Basin, 2002–2011. Remote Sens. 2014, 6, 5885–5908. [Google Scholar] [CrossRef] [Green Version]
  43. Coffel, E.D.; Keith, B.; Lesk, C.; Horton, R.M.; Bower, E.; Lee, J.; Mankin, J.S. Future Hot and Dry Years Worsen Nile Basin Water Scarcity Despite Projected Precipitation Increases. Earth’s Future 2019, 7, 967–977. [Google Scholar] [CrossRef] [Green Version]
  44. Tesemma, Z.K.; Mohamed, Y.A.; Steenhuis, T.S. Trends in Rainfall and Runoff in the Blue Nile Basin: 1964–2003. Hydrol. Process. 2010, 24, 3747–3758. [Google Scholar] [CrossRef] [Green Version]
  45. Elshamy, M.E.; Seierstad, I.A.; Sorteberg, A. Impacts of climate change on Blue Nile flows using bias-corrected GCM scenarios. Hydrol. Earth Syst. Sci. 2009, 13, 551–565. [Google Scholar] [CrossRef] [Green Version]
  46. Siam, M.S.; Eltahir, E.A.B. Climate change enhances interannual variability of the Nile river flow. Nat. Clim. Chang. 2017, 7, 350–354. [Google Scholar] [CrossRef]
  47. Allam, M.M.; Jain Figueroa, A.; McLaughlin, D.B.; Eltahir, E.A.B. Estimation of evaporation over the upper Blue Nile basin by combining observations from satellites and river flow gauges. Water Resour. Res. 2016, 52, 644–659. [Google Scholar] [CrossRef] [Green Version]
  48. Digna, R.F.; Mohamed, Y.A.; van der Zaag, P.; Uhlenbrook, S.; Corzo, G.A. Nile River Basin modelling for water resources management—A literature review. Int. J. River Basin Manag. 2016, 15, 39–52. [Google Scholar] [CrossRef]
  49. Dile, Y.T.; Berndtsson, R.; Setegn, S.G. Hydrological response to climate change for Gilgel Abay River, in the Lake Tana Basin -Upper Blue Nile Basin of Ethiopia. PLoS ONE 2013, 8, e79296. [Google Scholar] [CrossRef] [PubMed] [Green Version]
  50. Senay, G.B.; Velpuri, N.M.; Bohms, S.; Demissie, Y.; Gebremichael, M. Understanding the hydrologic sources and sinks in the Nile Basin using multisource climate and remote sensing data sets. Water Resour. Res. 2014, 50, 8625–8650. [Google Scholar] [CrossRef]
  51. Ayehu, G.; Tadesse, T.; Gessesse, B. Monitoring Residual Soil Moisture and Its Association to the Long-Term Variability of Rainfall over the Upper Blue Nile Basin in Ethiopia. Remote Sens. 2020, 12, 2138. [Google Scholar] [CrossRef]
  52. Rebelo, L.M.; Senay, G.B.; McCartney, M.P. Flood Pulsing in the Sudd Wetland: Analysis of Seasonal Variations in Inundation and Evaporation in South Sudan. Earth Interact. 2012, 16, 1–19. [Google Scholar] [CrossRef]
  53. Abdelwares, M.; Lelieveld, J.; Zittis, G.; Haggag, M.; Wagdy, A. A comparison of gridded datasets of precipitation and temperature over the Eastern Nile Basin region. Euro-Mediterr. J. Environ. Integr. 2020, 5. [Google Scholar] [CrossRef]
  54. Belete, M.; Deng, J.; Wang, K.; Zhou, M.; Zhu, E.; Shifaw, E.; Bayissa, Y. Evaluation of satellite rainfall products for modeling water yield over the source region of Blue Nile Basin. Sci. Total Environ. 2020, 708, 134834. [Google Scholar] [CrossRef]
  55. Koukoula, M.; Nikolopoulos, E.I.; Dokou, Z.; Anagnostou, E.N. Evaluation of Global Water Resources Reanalysis Products in the Upper Blue Nile River Basin. J. Hydrometeorol. 2020, 21, 935–952. [Google Scholar] [CrossRef] [Green Version]
  56. Yitayew, M.; Melesse, A.M. Critical Water Resources Issues in the Nile River Basin. In Nile River Basin; Springer: Berlin/Heidelberg, Germany, 2011; pp. 401–416. [Google Scholar] [CrossRef]
  57. Degefu, D.M.; He, W. Water bankruptcy in the mighty Nile river basin. Sustain. Water Resour. Manag. 2015, 2, 29–37. [Google Scholar] [CrossRef] [Green Version]
  58. Shamsudduha, M.; Taylor, R.G.; Jones, D.; Longuevergne, L.; Owor, M.; Tindimugaya, C. Recent changes in terrestrial water storage in the Upper Nile Basin: An evaluation of commonly used gridded GRACE products. Hydrol. Earth Syst. Sci. 2017, 21, 4533–4549. [Google Scholar] [CrossRef] [Green Version]
  59. Lakew, H.B.; Moges, S.A.; Asfaw, D.H. Hydrological performance evaluation of multiple satellite precipitation products in the upper Blue Nile basin, Ethiopia. J. Hydrol. Reg. Stud. 2020, 27. [Google Scholar] [CrossRef]
  60. Bayissa, Y.; Maskey, S.; Tadesse, T.; van Andel, S.; Moges, S.; van Griensven, A.; Solomatine, D. Comparison of the Performance of Six Drought Indices in Characterizing Historical Drought for the Upper Blue Nile Basin, Ethiopia. Geosciences 2018, 8, 81. [Google Scholar] [CrossRef] [Green Version]
  61. Longuevergne, L.; Wilson, C.R.; Scanlon, B.R.; Crétaux, J.F. GRACE water storage estimates for the Middle East and other regions with significant reservoir and lake storage. Hydrol. Earth Syst. Sci. 2013, 17, 4817–4830. [Google Scholar] [CrossRef] [Green Version]
  62. Nie, N.; Zhang, W.; Chen, H.; Guo, H. A Global Hydrological Drought Index Dataset Based on Gravity Recovery and Climate Experiment (GRACE) Data. Water Resour. Manag. 2017, 32, 1275–1290. [Google Scholar] [CrossRef]
  63. Woodward, J.; Welsby, D.; Macklin, M. The Holocene fluvial sedimentary record and alluvial geoarchaeology in the Nile Valley of northern Sudan. In River Basin Sediment Systems—Archives of Environmental Change; Taylor & Francis Group: London, UK, 2001. [Google Scholar] [CrossRef] [Green Version]
  64. Sutcliffe, J.; Brown, E. Water losses from the Sudd. Hydrol. Sci. J. 2018, 63, 527–541. [Google Scholar] [CrossRef]
  65. Hasan, E.; Tarhule, A.; Hong, Y.; Moore, B. Assessment of Physical Water Scarcity in Africa Using GRACE and TRMM Satellite Data. Remote Sens. 2019, 11, 904. [Google Scholar] [CrossRef] [Green Version]
  66. Moges, S.A.; Gebremichael, M. Climate Change Impacts and Development-Based Adaptation Pathway to the Nile River Basi; Melesse, A., Abtew, W., Setegn, S.G., Eds.; Springer International Publishing Switzerland: Berlin/Heidelberg, Germany, 2014. [Google Scholar]
  67. Abu-Zeid, M.; Shiklomanov, I.A. Water Resources as a Challenge of the Twenty-First Century; World Meteorological Organization: Geneva, Switzerland, 2004. [Google Scholar]
  68. Camberlin, P. Nile Basin Climates. In The Nile: Origin, Environments, Limnology and Human Use; Dumont, H.J., Ed.; Springer, Monographiae Biologicae: Berlin/Heidelberg, Germany, 2009; pp. 307–333. [Google Scholar]
  69. NBI. State of River Nile Basin 2012; Nile Basin Initiative (NBI): Entebbe, Uganda, 2012. [Google Scholar]
  70. Landerer, F.W.; Swenson, S.C. Accuracy of scaled GRACE terrestrial water storage estimates. Water Resour. Res. 2012, 48, 1–11. [Google Scholar] [CrossRef]
  71. Save, H. CSR GRACE RL06 Mascon Solutions, V1 ed.; Save, H., Ed.; Texas Data Repository Dataverse, University of Texas at Austin: Austin, TX, USA, 2019. [Google Scholar] [CrossRef]
  72. Save, H.; Bettadpur, S.; Tapley, B.D. High-resolution CSR GRACE RL05 mascons. J. Geophys. Res. Solid Earth 2016, 121, 7547–7569. [Google Scholar] [CrossRef]
  73. Watkins, M.M.; Wiese, D.N.; Yuan, D.-N.; Boening, C.; Landerer, F.W. Improved methods for observing Earth’s time variable mass distribution with GRACE using spherical cap mascons. J. Geophys. Res. Solid Earth 2015, 120, 2648–2671. [Google Scholar] [CrossRef]
  74. Rodell, M.; Houser, P.; Jambor, U.E.A.; Gottschalck, J.; Mitchell, K.; Meng, J.; Arsenault, K.; Brian, C.; Radakovich, J.; Mg, B.; et al. The Global Land Data Assimilation System. Bams 2004, 85, 381–394. [Google Scholar] [CrossRef] [Green Version]
  75. Li, B.; Rodell, M.; Kumar, S.; Beaudoing, H.K.; Getirana, A.; Zaitchik, B.F.; Goncalves, L.G.; Cossetin, C.; Bhanja, S.; Mukherjee, A.; et al. Global GRACE Data Assimilation for Groundwater and Drought Monitoring: Advances and Challenges. Water Resour. Res. 2019, 55, 7564–7586. [Google Scholar] [CrossRef] [Green Version]
  76. Li, B.; Beaudoing, H.; Rodell, M.; NASA/GSFC/HSL. GLDAS Catchment Land Surface Model L4 daily 0.25 × 0.25 Degree V2.0 [Dataset]; Goddard Earth Sciences Data and Information Services Center (GES DISC): Greenbelt, MD, USA, 2018. [CrossRef]
  77. Schneider, U.; Becker, A.; Meyer-Christoffer, A.; Ziese, M.; Rudolf, B. Global Precipitation Analysis Products of the GPCC; Deutscher Wetterdienst, Offenbach a. M.: Frankfurter, Germany, 2011. [Google Scholar]
  78. Schneider, U.; Finger, P.; Meyer-Christoffer, A.; Rustemeier, E.; Ziese, M.; Becker, A. Evaluating the Hydrological Cycle over Land Using the Newly-Corrected Precipitation Climatology from the Global Precipitation Climatology Centre (GPCC). Atmosphere 2017, 8, 52. [Google Scholar] [CrossRef] [Green Version]
  79. CRU. Climate Research Unite Data; CRU[Dataset]; University of East Anglia: Norwich, UK, 2015. [Google Scholar]
  80. Osborn, T.J. A User Guide for ClimGen: A Flexible Tool for Generating Monthly Climate Data Sets and Scenarios; Climatic Research Unit (CRU), School of Environmental Sciences, University of East Anglia: Norwich, UK, 2009; pp. 1–17. [Google Scholar]
  81. Osborn, T.J.; Wallace, C.J.; Harris, I.C.; Melvin, T.M. Pattern scaling using ClimGen: Monthly-resolution future climate scenarios including changes in the variability of precipitation. Clim. Chang. 2015, 134, 353–369. [Google Scholar] [CrossRef] [Green Version]
  82. Watterson, I.G.; Whetton, P.H. Distributions of decadal means of temperature and precipitation change under global warming. J. Geophys. Res. 2011, 116. [Google Scholar] [CrossRef] [Green Version]
  83. Mitchell, T.D. Pattern Scaling: An Examination of the Accuracy of the Technique for Describing Future Climates. Clim. Chang. 2003, 60, 217–242. [Google Scholar] [CrossRef]
  84. Finger, P.; Ziese, M.; Meyer-Christoffer, A.; Schneider, U.; Becker, A. GPCC Interpolation Test Dataset at 1.0°; Global Precipitation Climatology Centre (GPCC) at Deutscher Wetterdienst: Frankfurter, Germany, 2015. [Google Scholar]
  85. Beguería, S.; Vicente, S. SPEIbase v.2.6 [Dataset]: DIGITAL.CSIC. 2020. Available online: http://hdl.handle.net/10261/202305 (accessed on 1 April 2020).
  86. Zhong, R.; Chen, X.; Wang, Z.; Lai, C.; Goddard, S.; Wells, N.; Hayes, M. scPDSI: Calculation of the Conventional and Self-Calibrating Palmer Drought Severity Index, v. 0.1.3: R package V. 0.1.3. 2018. Available online: https://CRAN.R-project.org/package=scPDSI (accessed on 10 March 2019).
  87. Beguería, S.; Vicente, S. SPI Calculator: DIGITAL.CSIC. 2009. Available online: http://hdl.handle.net/10261/10006 (accessed on 14 July 2017).
  88. Rigby, R.A.; Stasinopoulos, D.M. Generalized additive models for location, scale and shape. J. R. Stat. Soc. 2005, 54, 507–554. [Google Scholar] [CrossRef] [Green Version]
  89. Akantziliotou, C.; Rigby, R.; Stasinopoulos, D. The R implementation of generalized additive models for location, scale and shape. In Statistical Modelling in Society, Proceedings of the 17th International Workshop on Statistical Modelling, Chania, Crete, 8–12 July 2002; Statistical Modelling Society: Chania, Crete, 2002; pp. 75–83. [Google Scholar]
  90. Stasinopoulos, D.M.; Rigby, R.A. Generalized additive models for location scale and shape (GAMLSS) in R. J. Stat. Softw. 2007, 10, 1–46. [Google Scholar] [CrossRef] [Green Version]
  91. Stasinopoulos, M.; Rigby, B.; Voudouris, V.; Akantziliotou, C.; Enea, M.; Kiose, D. Gamlss: Generalised Additive Models for Location Scale and Shape: R package V 5.2-0. 2020. Available online: https://www.gamlss.com/ (accessed on 21 October 2020).
  92. Jing, W.; Di, L.; Zhao, X.; Yao, L.; Xia, X.; Liu, Y.; Yang, J.; Li, Y.; Zhou, C. A data-driven approach to generate past GRACE-like terrestrial water storage solution by calibrating the land surface model simulations. Adv. Water Resour. 2020, 143. [Google Scholar] [CrossRef]
  93. Ahmed, M.; Sultan, M.; Elbayoumi, T.; Tissot, P. Forecasting GRACE Data over the African Watersheds Using Artificial Neural Networks. Remote Sens. 2019, 11, 1769. [Google Scholar] [CrossRef] [Green Version]
  94. Richter, H.M.P.; Luck, C.; Klos, A.; Sideris, M.G.; Rangelova, E.; Kusche, J. Reconstructing GRACE-type time-variable gravity from the Swarm satellites. Sci. Rep. 2021, 11, 1117. [Google Scholar] [CrossRef]
  95. Hyndman, R.J.; Athanasopoulos, G.; Bergmeir, C.; Caceres, G.; Chhay, L.; O’Hara-Wild, M.; Petropoulos, F.; Razbash, S.; Wang, E.; Yasmeen, F. Forecast: Forecasting Functions for Time Series and Linear Models: R package V. 8.3. 2020. Available online: https://cloud.r-project.org/web/packages/forecast/index.html (accessed on 30 October 2020).
  96. Scanlon, B.R.; Zhang, Z.; Save, H.; Wiese, D.N.; Landerer, F.W.; Long, D.; Longuevergne, L.; Chen, J. Global evaluation of new GRACE mascon products for hydrologic applications. Water Resour. Res. 2016, 52, 9412–9429. [Google Scholar] [CrossRef]
  97. Tiwari, V.M.; Wahr, J.; Swenson, S. Dwindling groundwater resources in northern India, from satellite gravity observations. Geophys. Res. Lett. 2009, 36. [Google Scholar] [CrossRef] [Green Version]
  98. Rodionov, S.N. Use of prewhitening in climate regime shift detection. Geophys. Res. Lett. 2006, 33. [Google Scholar] [CrossRef] [Green Version]
  99. Abd-Elbaky, M.; Jin, S. Hydrological mass variations in the Nile River Basin from GRACE and hydrological models. Geod. Geodyn. 2019, 10, 430–438. [Google Scholar] [CrossRef]
  100. FAO. AQUASTAT—FAO’s Information System on Water and Agriculture; Food and Agriculture Organization (FAO): Rome, Italy, 2016. [Google Scholar]
  101. Becker, M.; Meyssignac, B.; Xavier, L.; Cazenave, A.; Alkama, R.; Decharme, B. Past terrestrial water storage (1980–2008) in the Amazon Basin reconstructed from GRACE and in situ river gauging data. Hydrol. Earth Syst. Sci. 2011, 15, 533–546. [Google Scholar] [CrossRef] [Green Version]
  102. Nerem, S.R.; Talpe, M.; Pilinski, E.; Lemoine, F.G.; Chinn, D.S. Reconstruction of Greenland and Antarctica Mass Changes Prior to the GRACE Mission; EGU General Assembly: Vienna, Austria, 2013; p. 11285. [Google Scholar]
  103. Nie, N.; Zhang, W.; Zhang, Z.; Guo, H.; Ishwaran, N. Reconstructed Terrestrial Water Storage Change (ΔTWS) from 1948 to 2012 over the Amazon Basin with the Latest GRACE and GLDAS Products. Water Resour. Manag. 2015, 30, 279–294. [Google Scholar] [CrossRef]
  104. Zhao, Q.; Wu, W.; Wu, Y. Variations in China’s terrestrial water storage over the past decade using GRACE data. Geod. Geodyn. 2015, 6, 187–193. [Google Scholar] [CrossRef] [Green Version]
  105. Taye, M.; Sahlu, D.; Zaitchik, B.F.; Neka, M. Evaluation of Satellite Rainfall Estimates for Meteorological Drought Analysis over the Upper Blue Nile Basin, Ethiopia. Geosciences 2020, 10, 352. [Google Scholar] [CrossRef]
  106. Tessema, R.S. Agricultural Drought Assessment for Upper Blue Nile Basin, Ethiopia Using SWAT; UNESCO-IHE Institute for Water Education: Delft, The Netherlands, 2007. [Google Scholar]
  107. Wilkinson, T. The Nile: A Journey Downriver through Egypt’s Past and Present; Knopf Doubleday Publishing Group: New York, NY, USA, 2014; p. 347. [Google Scholar]
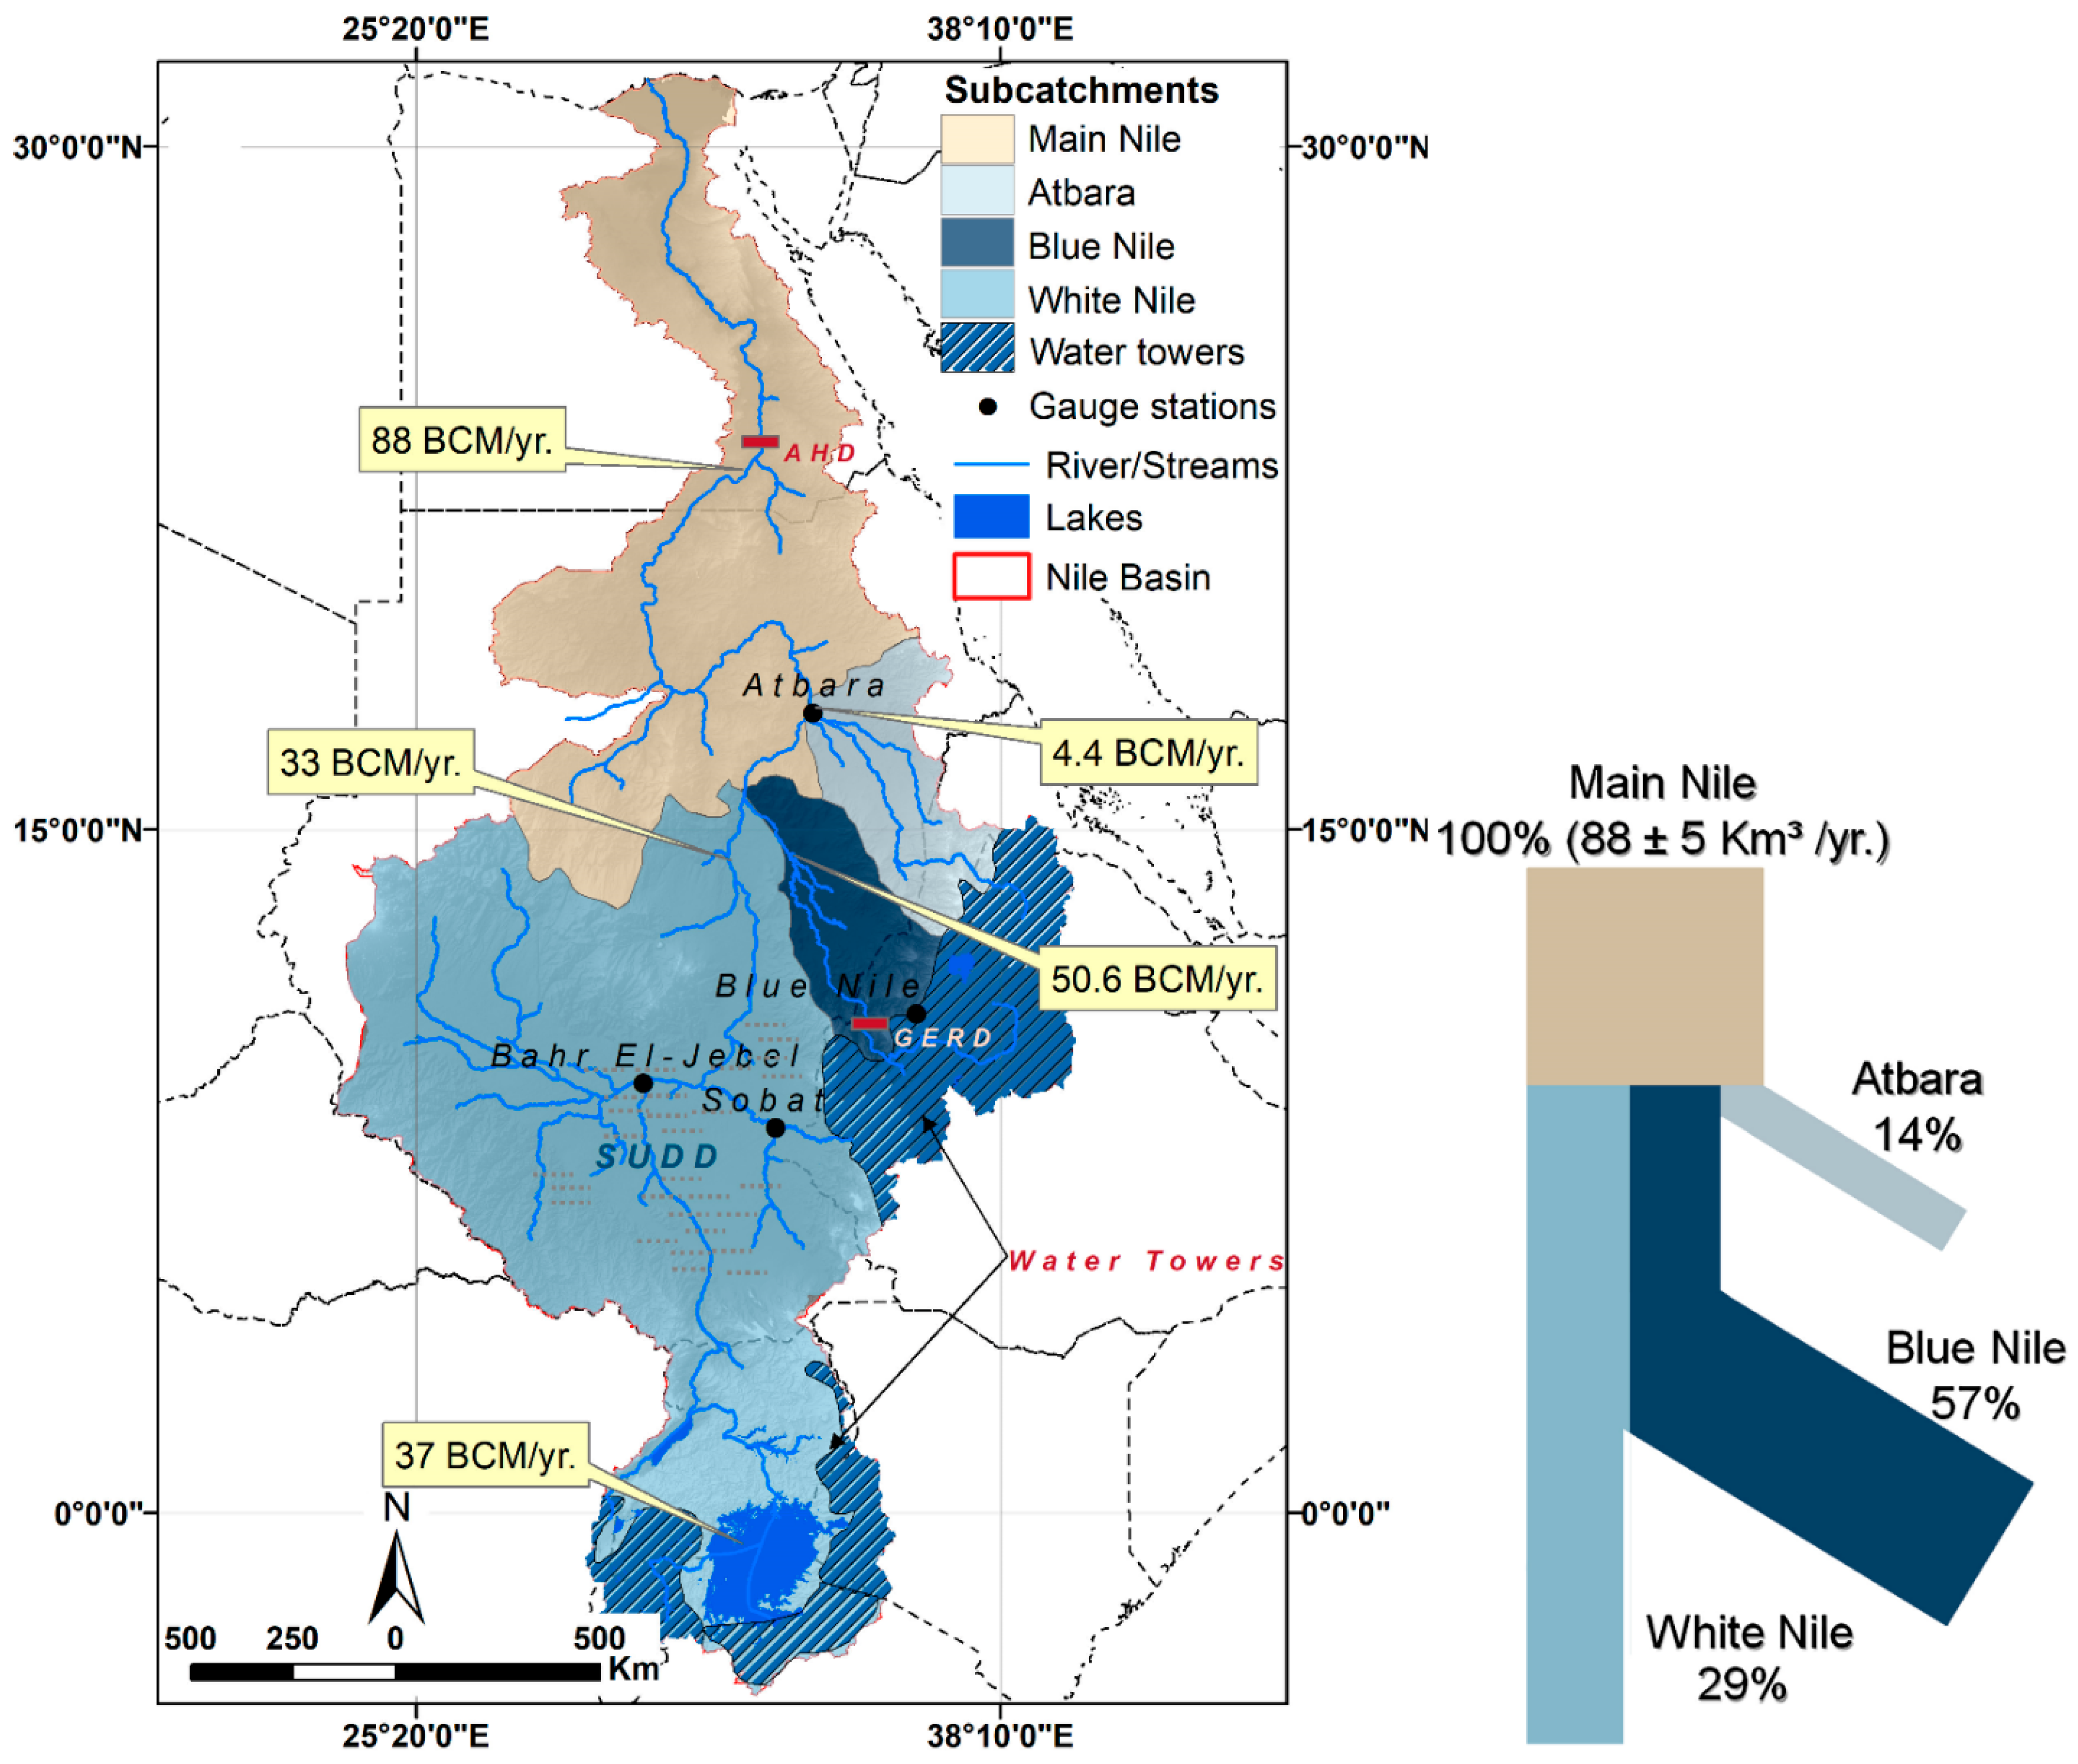
Figure 1. The annual contribution of the major tributaries to the Nile River Basin (NRB) waters. These storage values are approximations of the annual discharge figures. The storage values adapted from (Woodward et al., 2002), [63]. The shaded blue areas indicate two water tower regions, Lake Victoria in the South and Blue Nile Basin (BNB) in the East. BCM: billion cubic meters.
Remotesensing 13 00953 g001
Figure 2. The model performance of the simulated total water storage (TWS) compared to the ensemble Gravity Recovery and Climate Experiment (GRACE)-based TWS estimates (A), cumulative distribution function (CDF) (B), and Pearson coefficient (C), and historical simulated TWS anomalies (TWSA) records (D) from the generalized additive model for location, scale, and shape (GAMLSS) model between 1901 to 2010. The shaded greyscale represents the quantile ranges from Q05 to Q95. The catchment land surface model (CLSM)-based TWSA (red-line) covers the period from 1948 to 2010.
Remotesensing 13 00953 g002
Figure 3. TWSA (A) and the cycle trend component (B) over the NRB using Center for Space Research (CSR), Jet Propulsion Laboratory in California (JPL), and Ensemble (ENS) mascons solutions between 2002–2017, the red lines represent the gap-filling between 2017–2018, the shaded area represents the GRACE-FO (Follow-On) TWSA estimates between 2018–2020. The graph indicates the significant regime shift (RS) in the mean (green line).
Remotesensing 13 00953 g003
Figure 4. The total changes in TWS over NRB from 2002–2020 during the wet (A) and dry (B) seasons, plot (C) shows the total water storage during the two seasons.
Remotesensing 13 00953 g004
Figure 5. TWSA dynamics during the wet and dry seasons between 2002 to 2020 across the two main water towers in the NRB, Lake Victoria, and BNB water towers.
Remotesensing 13 00953 g005
Figure 6. TWSA dynamics during the wet and dry seasons between 2002 to 2020 across the two main water sinks in the NRB, Sudd Basin, and Main Nile.
Remotesensing 13 00953 g006
Figure 7. Mean annual average GRACE TWS (A) between 2002–2017 using ensembled SH06, CSR-M06, and JPL-M06 mascon solutions, plot (B) shows the standard deviation of each solution.
Remotesensing 13 00953 g007
Figure 8. Mean annual average GRACE-FO TWS (A) between 2018–2020 using ensembled SH06, CSR-M06, and JPL-M06 mascon solutions, plot (B) shows the standard deviation of each solution during the studied period.
Remotesensing 13 00953 g008
Figure 9. Reconstructed TWS in the NRB between 1901 to 2002 during the wet (A), dry period (B), and plot (C) shows the total water storage during the two seasons.
Remotesensing 13 00953 g009
Figure 10. The projected changes in mean TWS between 2021 to 2050 in the NRB during wet (A) and dry (B) seasons, and plot (C) shows the total water storage during the two seasons.
Remotesensing 13 00953 g010
Figure 11. The spatial pattern of the TWSD over the NRB between 2002 to 2020.
Remotesensing 13 00953 g011
Figure 12. Standardized drought indicators in the NRB compared to precipitation anomalies between 1901 to 2020.
Remotesensing 13 00953 g012
Figure 13. The dry and wet months in the NRB between 1901 to 2050.
Remotesensing 13 00953 g013
Figure 14. Drought frequency (A) recurrence (B) and flooding frequency (C) and recurrence (D) intervals between 1901–2050.
Remotesensing 13 00953 g014
Figure 15. Exceedance probabilities of hydrological extremes, drought (A) and flooding (B), from 1901–2050.
Remotesensing 13 00953 g015
Publisher’s Note: MDPI stays neutral with regard to jurisdictional claims in published maps and institutional affiliations.