Technical Note

Research on Instrument Visibility of Ozone Wind Imaging Interferometer

1
The Institute of Space Optics, Xi’an Jiaotong University, Xi’an 710049, China
2
School of Physics, Xi’an Jiaotong University, Xi’an 710049, China
*
Author to whom correspondence should be addressed.
Remote Sens. 2021, 13(6), 1062; https://doi.org/10.3390/rs13061062
Submission received: 4 February 2021 / Revised: 25 February 2021 / Accepted: 5 March 2021 / Published: 11 March 2021

Abstract

:
This paper discussed the principle of the ozone wind imaging interferometer developed by our group, which used remote sensing method to detect wind field and ozone concentration simultaneously, focused on the analysis and calculation of the instrument visibility and gave the theoretical representation of the instrument visibility. Computer simulation was used to analyze the influence of the system transmittance, compensation glass surface tilt and mirror surface accuracy on the instrument visibility. The results showed that the splitting ratio of the beam splitter and the field of view would affect the distribution of the instrument visibility; the tilt angle of the compensation glass surface can greatly affect the instrument visibility. We also gave the random error range of wind field speed and temperature at the instrument visibility U > 0.9. This research provides an important theoretical basis and practical guidance for the development and engineering of ozone wind imaging interferometers.

Graphical Abstract

1. Introduction

The atmosphere plays a vital role in the living environment of human beings. The ozone in the stratosphere absorbs ultraviolet radiation from the sun, thereby protecting creatures on the earth from ultraviolet radiation. In recent years, the study of the atmosphere has become a hot topic because of a series of environmental problems caused by the ozone hole in the north and south poles and the problem of ozone depletion. Wind is a basic parameter of atmospheric dynamics. The measurement of atmospheric wind field and ozone concentration has important scientific significance [1]; it also has great practical significance to improve the accuracy of environmental prediction and guarantee spaceflight aviation safety [2]. The development of space technology makes atmospheric wind speed field and temperature field detection no longer limited to ground-based remote sensing methods, such as Doppler radar or Raman temperature radar [3,4]. According to the atmosphere detection mode, the remote sensing detection method can be divided into active detection and passive detection. Active detection is based on transmitting information, and then receiving the echo signal after being reflected by the particles in the atmosphere, after processing the data, the distribution of the wind speed field, temperature field and pressure field can be obtained. Passive detection uses interference imaging spectroscopy and electromagnetic Doppler effect, which mainly uses airglow in the atmosphere as the detected source and obtains atmospheric wind field information by inverting the data which is obtained by detecting the fringe visibility and the frequency shift of the spectral line under the condition of large optical path difference. Because the principle of passive detection is simple, it also has high detection accuracy and no emission source, so it is more suitable for satellite-borne detection [5,6,7,8,9]. The wind imaging interferometer (WINDII) carried on the UARS (Upper Atmosphere Research Satellite) and launched by NASA in 1991 has created a precedent for passive detection of atmospheric wind field [10], which uses a moving mirror scanning system. The atmospheric wind field information obtained from four measurements at different times is inverted; therefore, errors caused by changes in the wind field, radiation field and temperature field will be introduced in the process, so this technology has certain flaws in principle. Gault et al. proposed a method that one of the Michelson mirrors is divided into four parts and each quadrant coated separately for obtaining four simultaneous phase-stepped images in 1996 [11]. Since then, in the instrument WAMI proposed by Ward et al. and Gordan G. Shepherd’s review of WINDII improvements, it is also mentioned that using this method can avoid errors caused by wind field changes [12,13]. The new type of ozone wind imaging interferometer developed by our group also uses static partition coating technology to construct a four-part reflector, which is based on the static four-intensity method and uses a pyramid prism to split light to obtain four interferograms of different phases in one measurement on CCD. The instrument developed by our group uses a single channel to observe the O 2 ( a 1 Δ g ) 1.27   μ m airglow spectrum line to obtain the earth’s middle atmosphere temperature, wind field and ozone concentration information simultaneously. Its detection range is 25 ~ 110   k m . This design greatly simplifies the instrument structure and makes the weight of the instrument is lighter and smaller, which cannot be ignored in the engineering application of spaceborne instruments. In the process of detecting the atmosphere with the ozone wind imaging interferometer, the modulation of the interferogram plays a decisive role in the inversion of wind speed field and temperature field, which is determined by the instrument visibility and the fringe visibility. The instrument visibility is affected by the system transmittance, compensation glass surface tilt, mirror surface accuracy, which is an important standard to measure the performance of the instrument. The fringe visibility is mainly related to the spectral line type and width [14]. This article used the principle of double beam interference, aiming at the ozone wind imaging interferometer developed by our group. Assuming that the spectral line source is Gaussian line, the interference intensity was calculated in detail to obtain the modulation of the interferogram including the instrument visibility. Simulate and analyze the influence of the system transmittance, compensation glass surface tilt and mirror surface accuracy on the instrument visibility. This research provides an important theoretical basis for the development of the ozone wind imaging interferometer and the practical guidance for the detection of the atmosphere wind field.

2. Principle

2.1. Principles of Atmospheric Wind Field Detection

The principle of atmospheric wind field detection is to use the airglow spectrum line frequency shift phenomenon caused by the Doppler effect which is produced by the relative movement of the airglow and the detector, retrieving the wind speed field and temperature field by detecting the airglow frequency shift. The ozone molecules in the atmosphere produce the second excited state of molecular oxygen O 2 ( a 1 Δ g ) by photolysis in the Hartley band [15]. The transition from O 2 ( a 1 Δ g ) to the ground state O 2 ( X 3 Σ g ) is an important source of molecular oxygen radiation spectrum. The transition radiation spectrum is a near-infrared spectrum composed of a series of spectral lines with very small spectral intervals, and its wavelength is about 1.27   μ m . The radiation equation can be expressed as follows: O 2 ( a 1 Δ g ) A 00 O 2 + h v ( 1.27   μ m ) . Because the airglow of this band has very high brightness, the distribution height range is 25 ~ 110   km , and the generation of airglow is related to the concentration of ozone. Detecting this spectral line can not only achieve a higher signal-to-noise ratio but also invert the ozone concentration [16]. This radiation band has been observed by a variety of instruments, such as the spacecraft instrument [17,18], the near-infrared spectrometer on the Solar Mesosphere Explorer satellite SME (Solar Mesosphere Explorer) [19], the optical spectrograph and infrared imaging system OSIRIS on the Odin satellite (Optical Spectrograph and InfraRed Imager System) [20] and the atmospheric sounding broadband radiometer SABER [21], that are used to obtain the ozone concentration of the earth’s atmosphere. It can be seen that through the observation of O 2 ( a 1 Δ g ) 1.27   μ m near-infrared airglow radiation that the wind field speed and temperature field and ozone concentration information can be obtained at the same time. The SWIFT instrument proposed by Rahnama et al. intended to use 8.8   μ m as the observation spectrum [22], but Gordon G. Shepherd and others pointed out this implementation would be more challenging because infrared-transmitting materials would have to be used and the interferometer would have to be cooled to reduce the thermal emission of the instrument to levels below that of the atmospheric signal [12]. In summary, O 2 ( a 1 Δ g ) 1.27   μ m is very suitable for detecting atmospheric wind fields. O 2 ( a 1 Δ g ) collides with the surrounding gas molecules many times before the transition and forms a thermal equilibrium with the surrounding atmosphere, forming a common temperature and overall speed which is the temperature and speed of the wind field of the atmosphere to be detected.
Suppose the instrument visibility of the ozone wind imaging interferometer is U and the fringe visibility is V , then the interference intensity can be written as follows when the light reaches the CCD [23]:
I ( Δ ) = I 0 [ 1 + U V cos ( 2 π σ 0 Δ ) ]
take Δ = Δ 0 + Δ , where Δ 0 is the reference optical path difference of the instrument, and it satisfies cos ( 2 π σ 0 Δ 0 ) = 1 , where σ 0 is the central wave number. If σ 0 corresponds to the wave number when the wind speed is zero, the Doppler effect of electromagnetic waves shows that when the relative speed between the light source and the observer is ν , the wave number becomes:
σ = σ 0 ( 1 + ν / c )
Therefore, the interference intensity can be expressed as [24]:
I ( Δ ) = J 1 + J 2 U cos φ i J 3 U sin φ i
In this formula: J 1 , J 2 and J 3 are called apparent quantities, which are specifically expressed as:
J 1 = I 0 , J 2 = V I 0 cos φ t , J 3 = V I 0 sin φ t
where φ t = 2 π σ 0 Δ 0 ν c is the phase difference caused by wind speed [25], and φ i is the phase difference caused by the step optical path difference, thus:
φ t = arctan J 3 J 2
The fringe visibility can be written as:
V = J 2 2 + J 3 2 J 1
The step optical path difference can take the following values for the four-step method:
Δ = 0 , λ 0 4 , λ 0 2 , 3 λ 0 4
Four interference intensities can be obtained: I 1 , I 2 , I 3 , and I 4 , which can be derived:
J 1 = ( I 1 + I 2 + I 3 + I 4 ) / 4 , J 2 = 1 2 U ( I 4 I 2 ) , J 3 = 1 2 U ( I 3 I 1 )
According to the basic principles of optics, the fringe visibility of Gaussian line is defined as [25]:
V = exp ( Q T Δ 2 ) = I max I min I max + I min
Therefore, the fringe visibility V and the phase difference φ t can be obtained by measuring J 1 , J 2 and J 3 . According to Formulas (9) and (5), the wind speed field and temperature field can be inverted, and it can also obtain the ozone concentration by inverting the spectral line radiance of 1.27   μ m and the oxygen molecule number density from J 1 [26]. It can be seen from Formula (8) that the instrument visibility U directly affects J 1 , J 2 and J 3 . Therefore, the instrument visibility U plays a vital role in the inversion of wind speed field and temperature field.

2.2. Principle of Ozone Concentration Inversion

In order to obtain the ozone concentration, firstly, the atmospheric temperature ( T ), pressure ( P ), the O 2 IR Atmospheric (0-0) band volume emission rates ( E ) (it can be calculated from the spectral line volume emission rates ( η ) and T ) and the number density of O 2 can be obtained through the inversion of J 1 and the established forward model; secondly, use J 2 , J 3 , T , P , E and the number density of O 2 as input parameters (the wind speed along the line of sight can be inverted, and the horizontal vector wind can be calculated from the wind speeds in two orthogonal line of sight directions); finally, by analyzing the production and quenching process of O 2 ( a 1 Δ g ) , according to the photochemical equilibrium conditions [27]:
E t ( s ) = A 00 A Δ + k 5 O 2 [ O 2 ] { ε J H 1 [ O 3 ] + k 3 O 2 [ O 2 ] + k 3 N 2 [ N 2 ] A Σ + k 3 O 2 [ O 2 ] + k 3 N 2 [ N 2 ] × ( J 4 [ O 2 ] + k 2 O 2 [ O 2 ] ε J H 1 [ O 3 ] A D + k 2 O 2 [ O 2 ] + k 2 N 2 [ N 2 ] ) }
In the formula, E t ( s ) represents the O 2 ( a 1 Δ g ) band volume emission rates at time t , unit: photons c m 3 s 1 ; s is the path of the observation point along the line of sight of the satellite, which is the functions of height, longitude and latitude; [ O 2 ] , [ O 3 ] and [ N 2 ] represent the number densities of O 2 , O 3 and N 2 , respectively, at s . [ N 2 ] can be obtained from the atmospheric model; other coefficients ( A 00 , A Δ , k 5 O 2 , ε , J H 1 , k 3 O 2 , k 3 N 2 , A Σ , J 4 , k 2 O 2 , A D , k 2 N 2 ) are the reaction coefficient of the photochemical reaction process, which is known [27]. Because E t ( s ) and [ O 2 ] can be retrieved from J 1 , according to Formula (10), the ozone concentration can be retrieved. The details about the wind speed retrieval algorithm and theory are similar to WINDII—please refer to [10,28,29]; T and O 2 retrieval algorithm is similar to SWIFT—please refer to [22,28,30]; for ozone concentration retrieval algorithm see [27].

2.3. Principle of Ozone Wind Imaging Interferometer

The ozone wind imaging interferometer developed by our group is a new type of interferometer for detecting wind temperature field and speed field. As shown in Figure 1, the instrument is mainly composed of a Fabry-Perot filter (E1), a front telescope (L1), Michelson interferometer (M1), the pyramid prism (P1), imaging lens (L2) and CCD detector (Array detector). After light passes through the Michelson interferometer (M1), due to the difference in the thickness of the coating on the four zones on the mirror, it will produce four beams of light with different phases at the same time; there are the following: 0, π / 2 , π and 3 π / 2 , then the four lights with different phases are divided into four beams after passing through the pyramid prism (P1); therefore, four interferograms with different phases can be obtained on CCD, which can be used to invert wind temperature field, speed field and ozone concentration by using the static four-intensity method.

3. Analysis and Calculation of Instrument Visibility

The main factors that affect the instrument visibility of the ozone wind imaging interferometer include instrument transmittance, compensation glass surface tilt and mirror surface accuracy. This article discusses the influence of the above three factors on the instrument visibility separately and focuses on calculating the influence of transmittance on instrument visibility.

3.1. The Influence of Transmittance on Instrument Visibility

As shown in Figure 2, when a beam of light enters the Michelson interferometer (M1) at the incident angle i 1 , it is divided into two beams at the beam splitter B, and the transmittance of the two beams can be calculated respectively. The beam passing through the arm 1 is from left to right after passing through interfaces A, B, C, D, and E, respectively, and reaching the E interface it is reflected by the four-zone total reflection mirror, and the reflected light passes through D, C, and B and then exits from the H surface; the same happens for the light of arm 2. In Figure 2, n 0 , n 1 , n 2 , n 2 are refractive indices, i 1 is the incident angle, and i 2 , i 3 , i 4 , i 2 are refraction angles respectively.
Because the transmittance of the p component and the s component of the incident light are different, the Fresnel formula must be used to calculate one by one. According to the law of refraction:
n 0 s i n i 1 = n 1 s i n i 2 = n 2 s i n i 3 = n 0 s i n i 4 ; n 1 s i n i 2 = n 2 s i n i 2
When the incident light passes through interface A, the transmittance of its two orthogonal components can be expressed as follows:
t p A = 2 n 0 cos i 1 n 1 cos i 1 + n 0 cos i 2 , t s A = 2 n 0 cos i 1 n 0 cos i 1 + n 1 cos i 2
The incident light passes through the B surface for the first time. Because the beam splitter is a split amplitude beam splitter, the transmittance of the p and s components of the transmitted beam 1 is set to be α , and the reflectivity of the p and s components of the reflected beam 2 is β . Then:
T p B = T s B = α , R p B = R s B = β
Therefore, in arm 1, the transmittance of the p and s components of the transmitted beam 1 can be expressed as:
T P 1 = t p A 2 T p B t p C 2 t p D 2 R p E t p C 2 2 t p D 2 2 R p B 2 t p H 2 , T S 1 = t s A 2 T s B t s C 2 t s D 2 R s E t s C 2 2 t s D 2 2 R s B 2 t s H 2
T P 1 =   ( 1 2 × α × R p E × α ) × ( 2 n 0 cos i 1 n 1 cos i 1 + n 0 cos i 2 ) 2 × ( 2 n 1 cos i 2 n 2 cos i 2 + n 1 cos i 3 ) 2 × ( 2 n 2 cos i 3 n 0 cos i 3 + n 2 cos i 4 ) 2 × ( 2 n 1 cos i 2 n 0 cos i 2 + n 1 cos i 1 ) 2 × ( 2 n 2 cos i 3 n 1 cos i 3 + n 2 cos i 2 ) 2 × ( 2 n 0 cos i 4 n 2 cos i 4 + n 0 cos i 3 ) 2
T S 1 =   ( 1 2 × α × R s E × α ) × ( 2 n 0 cos i 1 n 0 cos i 1 + n 1 cos i 2 ) 2 × ( 2 n 1 cos i 2 n 1 cos i 2 + n 2 cos i 3 ) 2 × ( 2 n 2 cos i 3 n 2 cos i 3 + n 0 cos i 4 ) 2 × ( 2 n 1 cos i 2 n 1 cos i 2 + n 0 cos i 1 ) 2 × ( 2 n 2 cos i 3 n 2 cos i 3 + n 1 cos i 2 ) 2 × ( 2 n 0 cos i 4 n 0 cos i 4 + n 2 cos i 3 ) 2 .
Similarly, in arm 2, the transmittance of the p component and s component of the reflected beam 2 is also expressed as follows:
T P 1 = t p A 2 R p B t p F 2 R p G t p F 2 2 t p B 2 t p H 2 , T S 1 = t s A 2 R s B t s F 2 R s G t s F 2 2 T s B 2 t s H 2
T P 1 = ( 1 2 × β × R p G × β ) × ( 2 n 0 cos i 1 n 1 cos i 1 + n 0 cos i 2 ) 2 × ( 2 n 1 cos i 2 n 1 cos i 2 + n 2 cos i 2 ) 2 × ( 2 n 2 cos i 2 n 2 cos i 2 + n 1 cos i 2 ) 2 × ( 2 n 1 cos i 2 n 0 cos i 2 + n 1 cos i 1 ) 2
T S 1 = ( 1 2 × β × R s G × β ) × ( 2 n 0 cos i 1 n 1 cos i 1 + n 0 cos i 2 ) 2 × ( 2 n 1 cos i 2 n 1 cos i 2 + n 2 cos i 2 ) 2 × ( 2 n 2 cos i 2 n 2 cos i 2 + n 1 cos i 2 ) 2 × ( 2 n 1 cos i 2 n 1 cos i 2 + n 0 cos i 1 ) 2 .
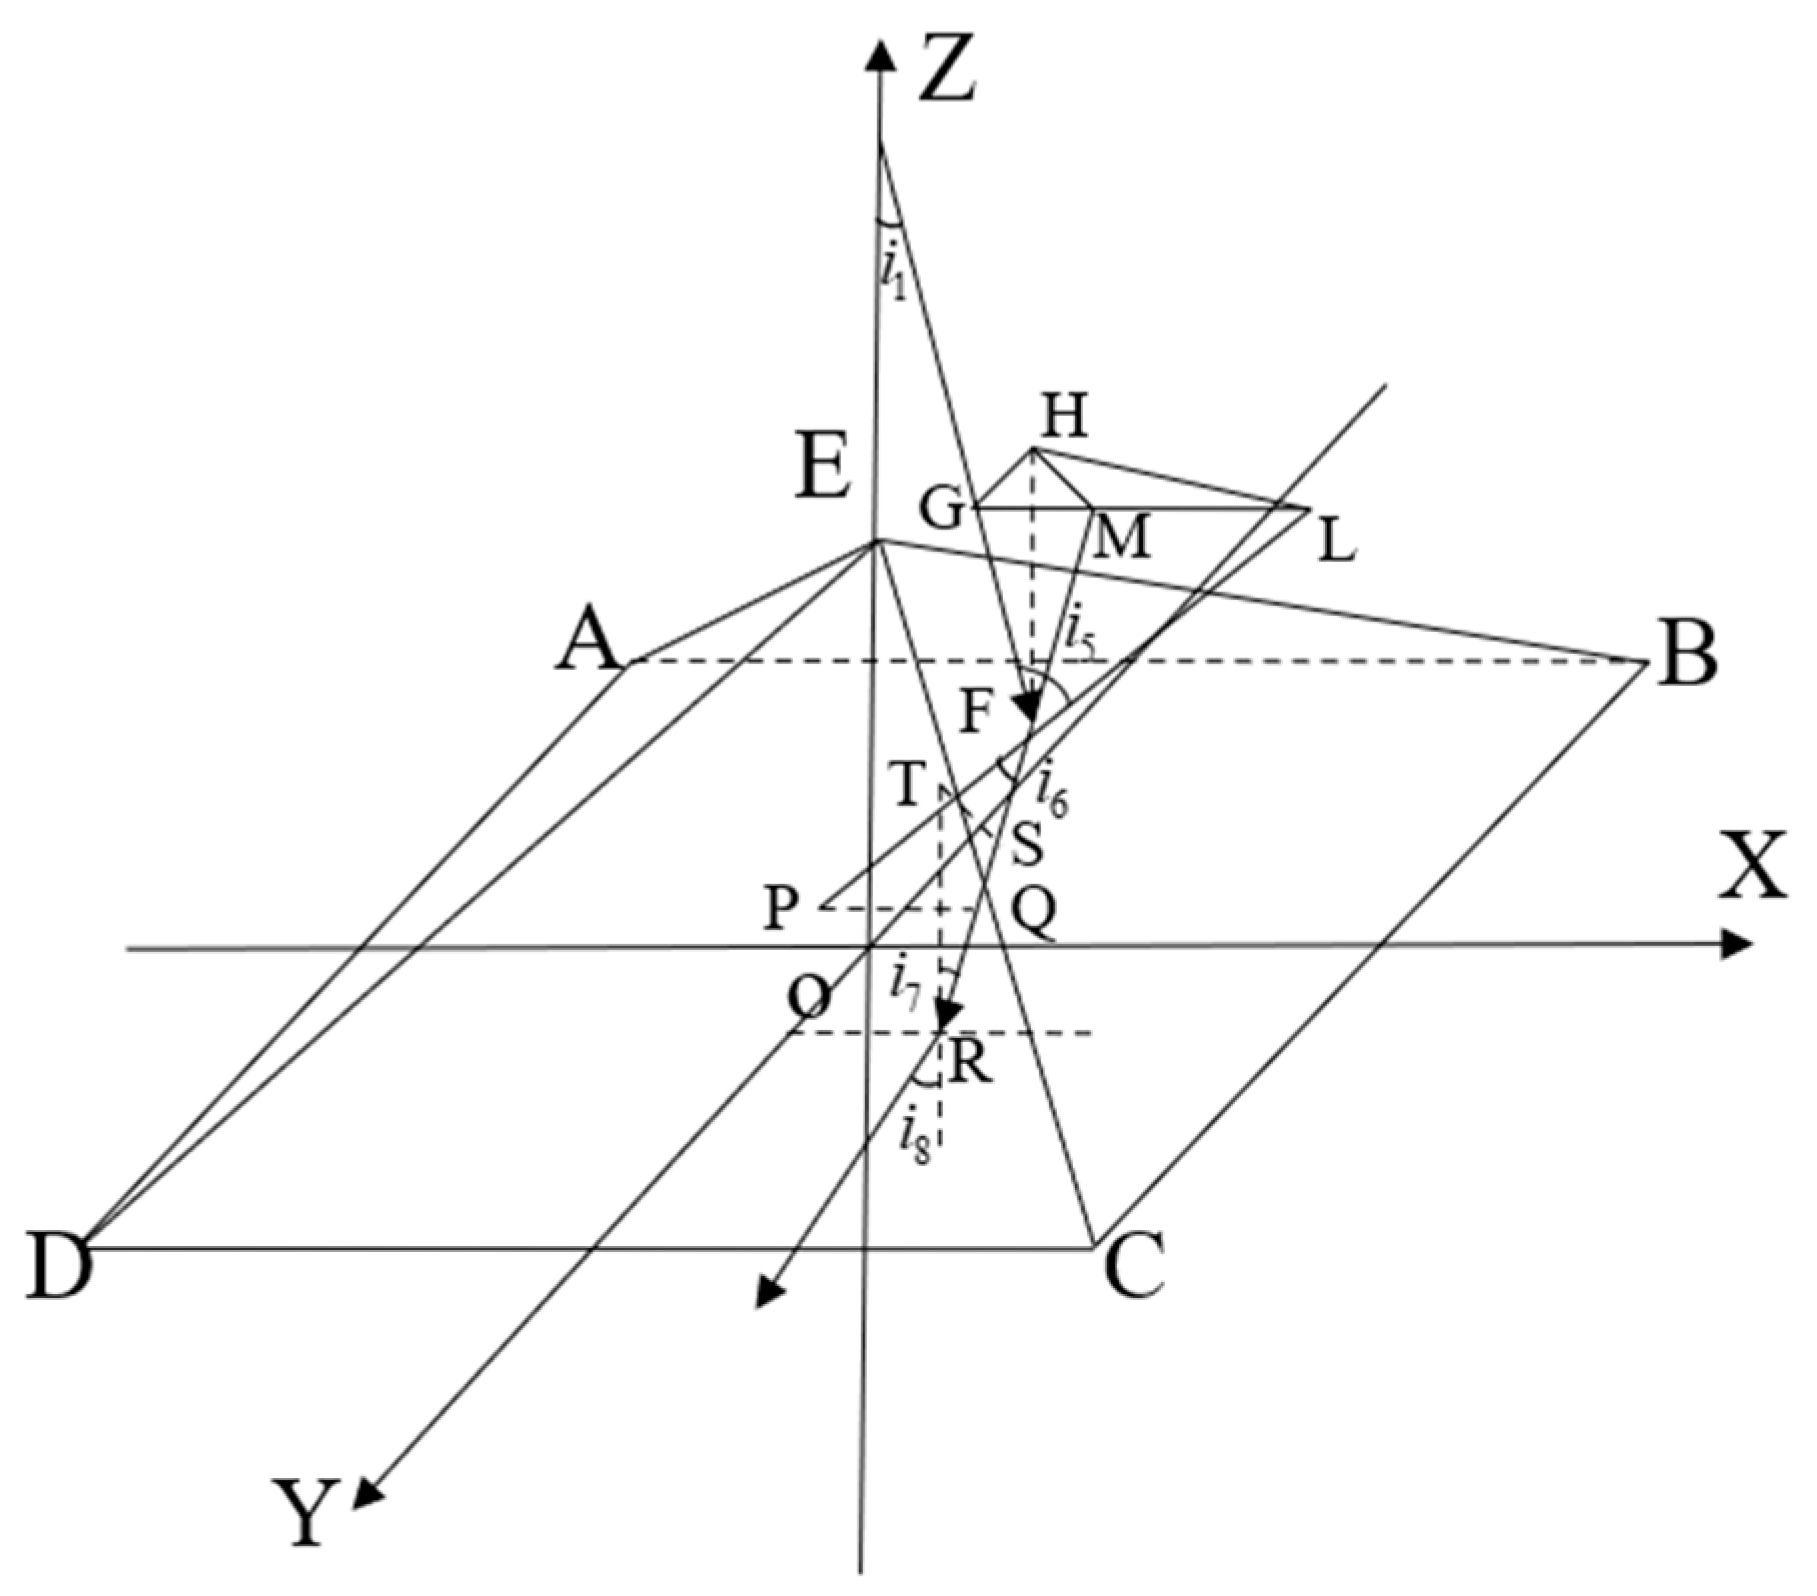
Figure 3 shows the optical path of light propagating in the pyramid prism (with a base angle of α and a refractive index of n ). When light is incident on the pyramid prism at any angle, if the transmittance of the light passing through the pyramid prism is calculated, the incident angle and exit angle of the light at each interface must be calculated.
As shown in the figure above, make the normal line PL of the incident surface EBC, and when the light is incident on the F point of pyramid prism EBC surface at i 1 with the z-axis, take the line H F = 1 parallel to the z-axis; according to the geometric relationship, there are G F H = i 1 , L F H = α , so the incident angle i 5 of the light on the EBC surface can be obtained as:
i 5 = arccos G F 2 + L F 2 G L 2 2 G F · L F
According to the law of refraction:
n 0 sin i 5 = n sin i 6
From the geometric relationship:
L M F = π i 6 G L F
From the law of cosines:
G L F = arccos G L 2 + L F 2 G F 2 2 G L · L F
From the law of sine:
M F sin M L F = L F sin L M F
From this, the length of MF can be solved, so it can be solved that the incident angle i 7 of the refracted light on the ABCD plane satisfies:
i 7 = arccos H F M F
According to the law of refraction, n sin i 7 = n 0 sin i 8 , then the exit angle i 8   of the refracted light on the ABCD plane can be solved. Therefore, the transmittance of the p component and s component of the transmitted light beam and the reflected light beam after passing through the pyramid prism can be expressed as:
T P 2 = T P 2 = ( t p 2 ) 2 = ( 2 n 0 cos i 5 n cos i 5 + n 0 cos i 6 ) 2 × ( 2 n cos i 7 n 0 cos i 7 + n cos i 8 ) 2
T S 2 = T S 2 = ( t s 2 ) 2 = ( 2 n 0 cos i 5 n 0 cos i 5 + n cos i 6 ) 2 × ( 2 n cos i 7 n 0 cos i 8 + n cos i 7 ) 2
When the beam 1 reaches the CCD, the total transmittance of its p component and s component can be written as:
T P = T P 1 T P 2 , T S = T S 1 T S 2
Similarly, for the beam 2:
T P = T P 1 T P 2 , T S = T S 1 T S 2
For the p component, the wave vector of the output light with the wave number σ of the arm 1 can be expressed as:
ε P ( z 1 , σ ) = t p ε ( σ ) e i ( ω t 2 π σ z 1 )
Similarly, for the arm 2:
ε P ( z 2 , σ ) = t P ε ( σ ) e i ( ω t 2 π σ z 2 )
where ε ( σ ) is the amplitude of incident light with wave number σ and the incident light is natural light, z 1 and z 2 are the optical path differences of the two beams of light after passing through the interferometer system respectively. From the large field of view, achromatic, and temperature compensation conditions, it can be seen that the optical path difference between the two beams of light is stable [8] and does not change due to the incident angle, wavelength, etc. The optical path difference of the two output lights can be regarded as a fixed value, that is, when the parameters of the instrument are determined, Δ = z 1 z 2 is a constant, so the amplitude of light is:
ε p ( z 1 , z 2 , σ ) = t p ε ( σ ) e i ( ω t 2 π σ z 1 ) + t P ε ( σ ) e i ( ω t 2 π σ z 2 ) = ε ( σ ) ( t P e i ( ω t 2 π σ z 1 ) + t P e i ( ω t 2 π σ z 2 ) )
The interference intensity of P light is:
I p ( σ , Δ ) = ε P * ε P = ε ( σ ) 2 [ t P 2 + t P 2 + t P ( e i 2 π σ Δ + e i 2 π σ Δ ) ] = ε ( σ ) 2 [ T P + T P + 2 T P T P cos 2 π σ Δ ]
The incident light is Gaussian line, which satisfies:
B ( σ ) = 1 2 c k 0 ε p * ε p
where c is the speed of light in vacuum, k 0 is the vacuum dielectric constant ( k 0 = 8.85 × 10 12 F / m ) , and a Gaussian line of width w centered at wave number σ 0 may be represented by:
B ( σ ) = B 0 exp [ 4 ln 2 ( σ σ 0 ) 2 / w 2 ]
where B ( σ ) is the spectral radiance of the line.
Therefore, the total interference intensity of P light in the output light may be rewritten as:
I P = + I P ( σ , Δ ) d σ = ( T P + T P ) B 0 2 c k 0 w 2 π / 4 ln 2 + T P T P B 0 c k 0 w 2 π / 4 ln 2 × exp ( w 2 4 ln 2 π 2 Δ 2 ) × cos 2 π σ 0 Δ
Similarly, for the S light:
I S = + I S ( σ , Δ ) d σ = ( T S + T S ) B 0 2 c k 0 w 2 π / 4 ln 2 + T S T S B 0 c k 0 w 2 π / 4 ln 2 × exp ( w 2 4 ln 2 π 2 Δ 2 ) × cos 2 π σ 0 Δ
The total interference intensity of the output light becomes:
I t o t a l = I P + I S   = ( T P + T P + T S + T S ) B 0 2 c k 0 w 2 π / 4 ln 2 × ( 1 + 2 T P T P + 2 T S T S T P + T P + T S + T S × exp ( w 2 4 ln 2 π 2 Δ 2 ) × cos 2 π σ 0 Δ )
Therefore, the modulation of the interferogram of the ozone wind imaging interferometer can be written as:
V G = 2 T P T P + 2 T S T S T P + T P + T S + T S × exp ( w 2 4 ln 2 π 2 Δ 2 )
The fringe visibility is:
V L = exp ( w 2 4 ln 2 π 2 Δ 2 ) = exp ( Q T Δ 2 )
therefore, the modulation of the interferogram can be rewritten as:
  V G = 2 T P T P + 2 T S T S T P + T P + T S + T S V L = U V L
where the instrument visibility becomes:
U = 2 T P T P + 2 T S T S T P + T P + T S + T S
Therefore, when only considering the influence of transmittance, the instrument visibility can be expressed as:
U = 2 ( T P 2 T P 1 T P 1 + T S 2 T S 1 T S 1 ) T P 2 ( T P 1 + T P 1 ) + T S 2 ( T S 1 + T S 1 )

3.2. The Influence of Compensation Glass Surface Tilt on Instrument Visibility

In the real instrument, in addition to the difference in transmittance of the two arms, the mirror may not be aligned, and the optical surface may not be smooth. These factors will reduce the instrument visibility, and each of these factors can be estimated an influence factor; the final instrument visibility U will be the product of each term [25]. This section discusses errors caused by the tilt of compensation glass.
As shown in Figure 4: Establish two coordinate systems x 1 O 1 y 1 and x 2 O 2 y 2 perpendicular to the optical axis z 1 and z 2 to describe the compensation of the tilt of the glass surface, where the rotation angles of the optical surface around x -axis and y -axis are γ i and ϕ i respectively. Because the rotation angle is small enough, the change in transmittance caused by the tilt of the glass surface can be ignored, and the change of interference optical path difference caused by rotation becomes the main factor affecting the instrument visibility. The incident rectangular aperture of the Michelson interferometer is D 2 . When the incident light interferes on the CCD, and only considering the influence of the tilt of the glass surface on the instrument visibility, the instrument visibility U can be expressed as [26]:
U = sin c ( B D λ 0 ) sin c ( C D λ 0 )
where:
B = 2 ϕ 1 ( n 2 n 0 ) 2 ϕ 2 n 2 .   C = 2 γ 1 ( n 2 n 0 ) 2 γ 2 n 2

3.3. The Influence of Mirror Surface Accuracy on Instrument Visibility

In the process of plane mirror processing, due to the influence of polishing and coating, the plane mirror cannot obtain the ideal surface shape, which will reduce the instrument visibility. Assuming that the mirror polishing or coating error W obeys the Gaussian probability distribution, when the plane mirror has a surface error, two coherent lights will produce additional optical path difference 2 σ W when reflected by the plane mirror, where σ W = ( W 2 ) ¯ 1 / 2 is the root mean square value of the mirror surface error. The change of the optical path difference will cause the interference phase difference to change, which is:
δ φ = 4 π λ 0 σ W
By calculating the intensity distribution of the double-beam interference, the relationship between the Gaussian distribution mirror surface error and the instrument visibility can be obtained, expressed as Equation (47), and the derivation process can be referred to [31]:
U = exp [ 8 π 2 ( σ W λ 0 ) 2 ]

3.4. Wind Speed and Temperature Measurement Accuracy

The random error of the wide-angle Michelson interferometer for wind speed and temperature measurement will be affected by many factors, as shown in Equations (48) and (49) [29,32].
The standard deviation of wind speed random error σ ν can be expressed as:
σ ν = c λ 0 2 2 π U S V Δ
where c is the speed of light, λ 0 is the reference wavelength, U is the instrument visibility, S is the signal-to-noise ratio, Δ is the optical path difference, and V is the fringe visibility which can be obtained from Equation (9).
The standard deviation of temperature random error σ T can be expressed as:
σ T = 2 + U 2 V 2 2 U S Q V Δ 2
where Q is the molecular constant, for airglow radiation of O 2 ( a 1 Δ g ) 1.27   μ m , Q = 3 . 526 × 10 6   c m 2 K 1 .

4. Computer Simulation and Analysis

4.1. Influence of Beam Splitting Ratio on Instrument Visibility

The light emitted from the pyramid prism will be divided into four beams due to the light splitting effect of the pyramid prism. When the four beams reach the CCD, the p component and s component of the four beams interfere respectively; then, four interferograms will be formed on the CCD, so the instrument visibility distribution of the four zones are different. This section simulates the change of instrument visibility when the beam splitter takes different transmittance and reflectance.
As shown in Figure 5, when the incident angle is i = 1.5 , the influence of the splitting ratio of the beam splitter on the instrument visibility is simulated. The analysis shows that when the splitting ratio of the beam splitter reaches 1:1, the instrument visibility reaches the maximum value. In engineering, U 0.9 is generally required. For example, the visibility of the WINDII instrument is 0.9 [10]. In this case, the range of the splitting ratio of the beam splitter is: 0.66 α / β 1.65 .
Figure 6 shows the distribution of instrument visibility on the CCD when the beam splitting ratio of the beam splitter takes different values. The analysis shows that the distribution of the instrument visibility of the four zones has a certain symmetry when the splitting ratio takes a certain value, which is caused by the symmetry of the light splitting of the pyramid prism. As shown in Figure 3, when a beam of light emitted from the Michelson interferometer enters the pyramid prism at the incident angle i 1 , the value of the incident angle is different for each side of the pyramid prism, so the refraction angle at each interface is different. When the light is emitted from the bottom surface of the pyramid prism, it will be divided into four beams which have different transmittance distributions; therefore, the interference intensity of four beams is different and it corresponds to the four certain points on the CCD. Thus, the parallel light at different angles will interfere on the CCD to form four interferograms within the field of view. For each partition, the field angle at the center of the CCD is 0 ° . The maximum angle of view at the diagonal is 2.93 ° . Comparing Figure 6a,b, we can find the following: when the beam splitting ratio is different, the visibility of the instrument changes in the opposite trend. This is because different beam splitting ratios will affect the transmittance of the light emitted from arm 1 and arm 2 respectively, thereby affecting the distribution of instrument visibility. However, no matter what the value of the beam splitting ratio is, the change of the field of view has little effect on the instrument visibility, but it also shows that the splitting ratio of the beam splitter and the pyramid prism play an important role in the instrument visibility.
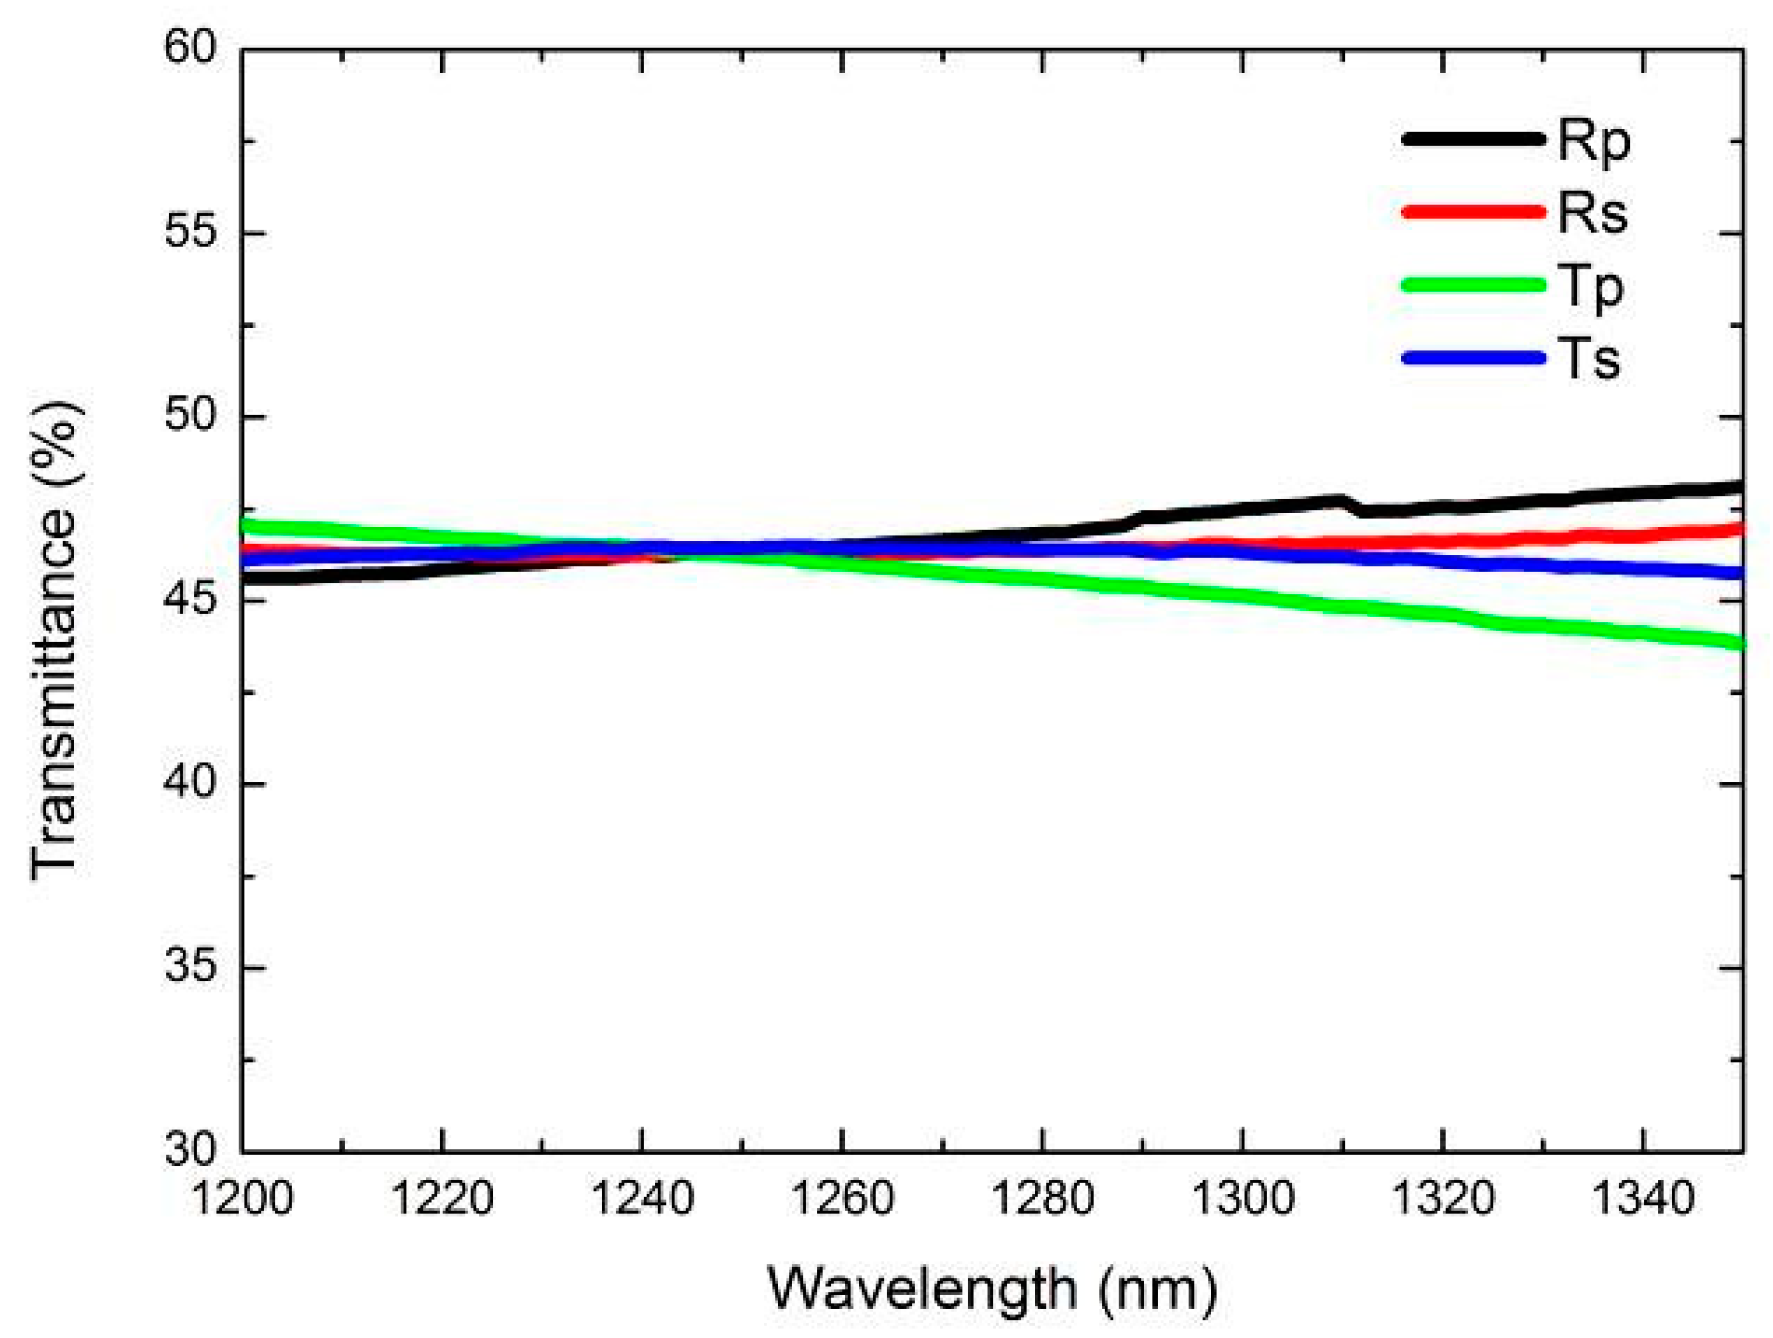
Figure 6. The instrument visibility when the beam splitter takes different transmittances. (a) The beam splitter takes α : β = 11 : 9 ; (b) The beam splitter takes α : β = 9 : 11 . In the actual measurement, although the splitting ratio of the beam splitter will affect the instrument visibility, there is also a certain difference in the transmittance of p light and s light in the beam. Figure 7 shows the transmittance of p light and s light of the beam splitter in the ozone wind imaging interferometer developed by our research group, where T represents the transmitted light, which is the light passing through the arm 1, and R represents the reflected light, which is the light passing through the arm 2.
Remotesensing 13 01062 g006
After the light passes through the pyramid prism, it is divided into four beams. The transmittance distribution of one beam is simulated, and the result is shown in Figure 8. It can be found that the transmittance of p light in the transmitted light is lower than the s light, while the reflected light is just the opposite. This is caused by the difference in the angular distribution of the transmitted light and the reflected light.
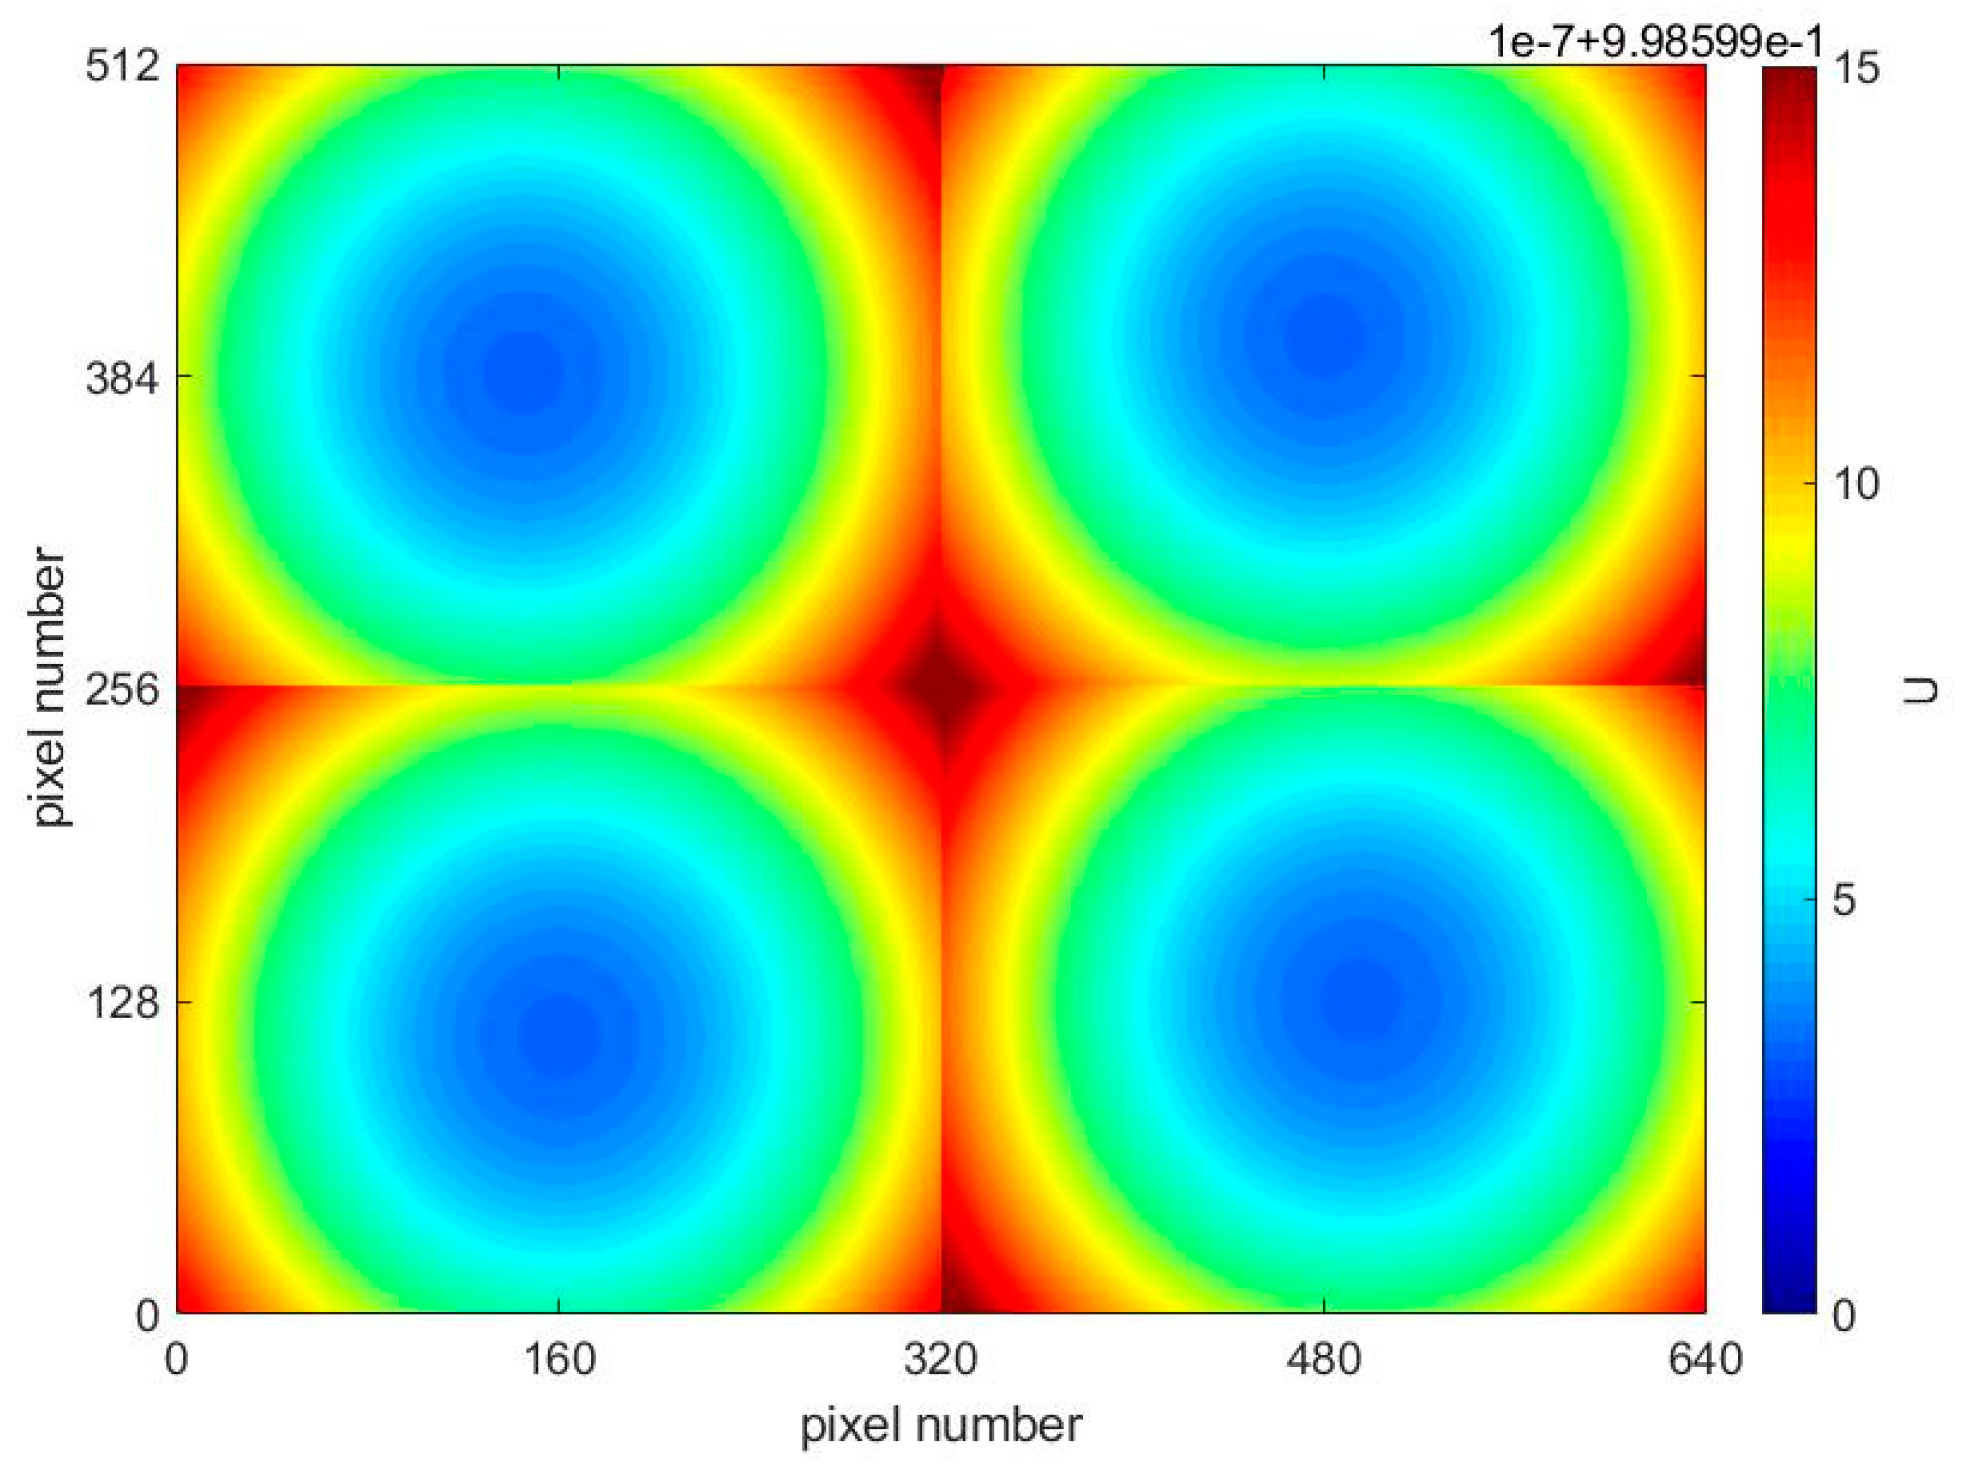
Simulate the distribution of instrument visibility on the CCD at this condition, and the result is shown in Figure 9. From Figure 8 we can know α / β 1 . Compared with the result of Figure 6b, when α / β 1 , the instrument visibility of the center is the lowest, which also verifies the influence of the beam splitting ratio on the instrument visibility distribution. Analyzing Figure 9, it can be found that the instrument visibility gradually decreases from the inside to the outside in a concentric circle, while in Figure 6b, the distribution of the instrument visibility at the edge of the CCD is not concentric rings. This is because of the beam splitting ratio of the instrument is closer to the ideal value, so the distribution of the instrument visibility on the CCD is more uniform.

4.2. The Influence of Compensation Glass Surface Tilt on Instrument Visibility

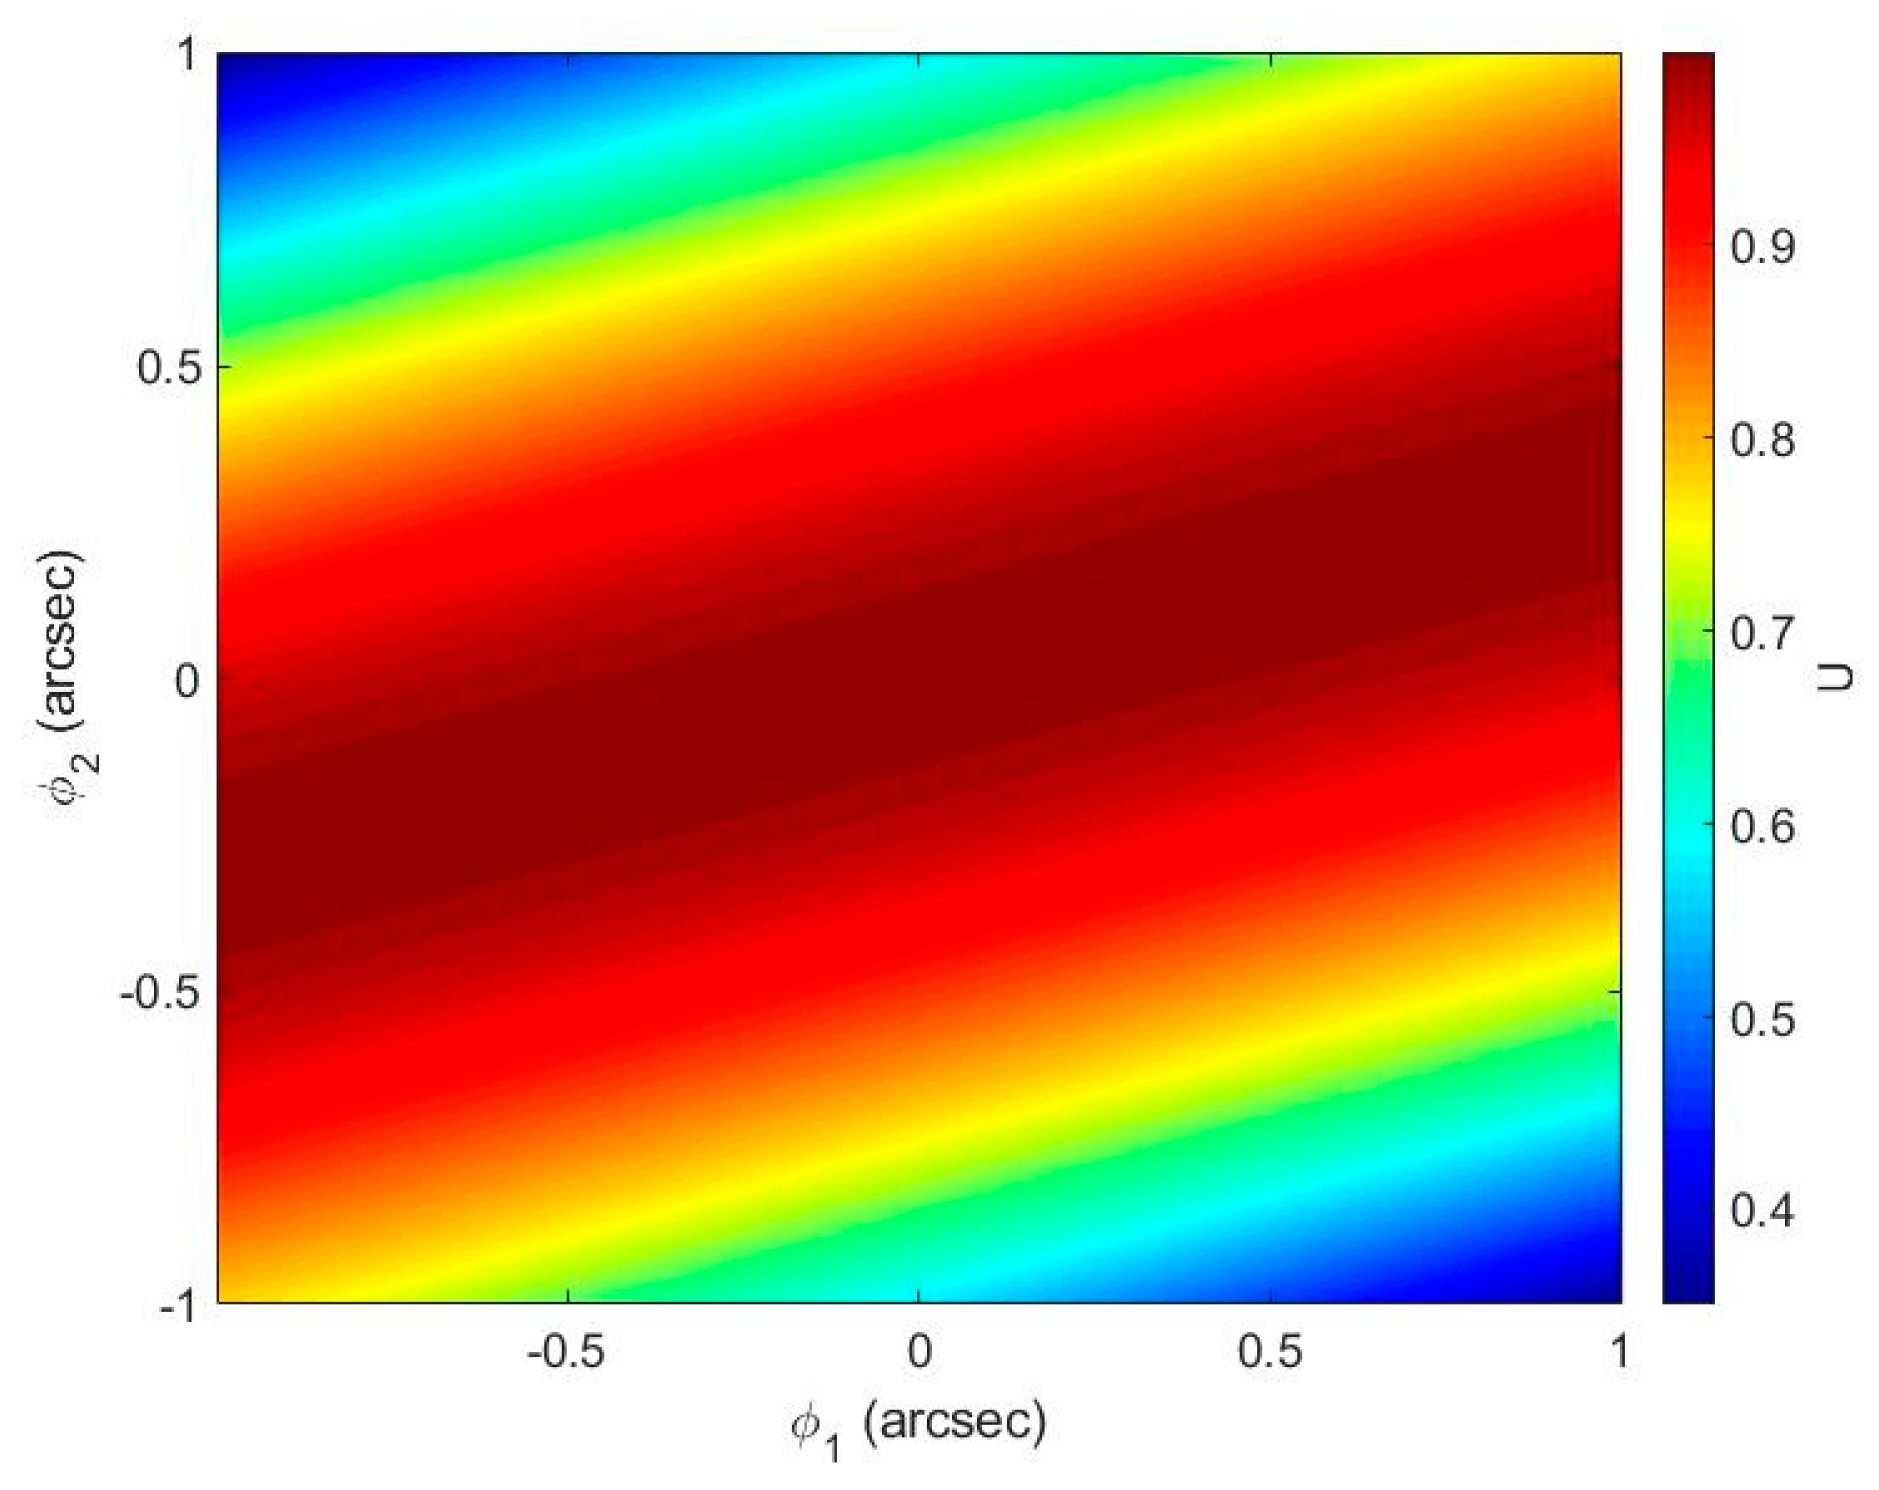
Because the compensation glass surface tilt will also affect the instrument visibility, this section simulates the influence of the compensation glass surface tilt on the instrument visibility. Because the tilt angle is small, the angle unit is arcsec ( 1 arcsec = 1 / 3600 ° ). It can be seen from Equation (44) that γ i and ϕ i have the same influence on the instrument visibility, so γ 1 = γ 2 = 0 is taken, that is, only the influence of the tilt of the glass surface around the y-axis on the instrument visibility is considered, the result is shown in Figure 10. It can be found from the analysis that the influence of ϕ 2 is greater than that of ϕ 1 , which is caused by the difference in refractive index of the two arms. When ϕ 1 and ϕ 2 are limited to - 0.35 arcsec ~ 0.35 arcsec , the instrument visibility U > 0.9 .
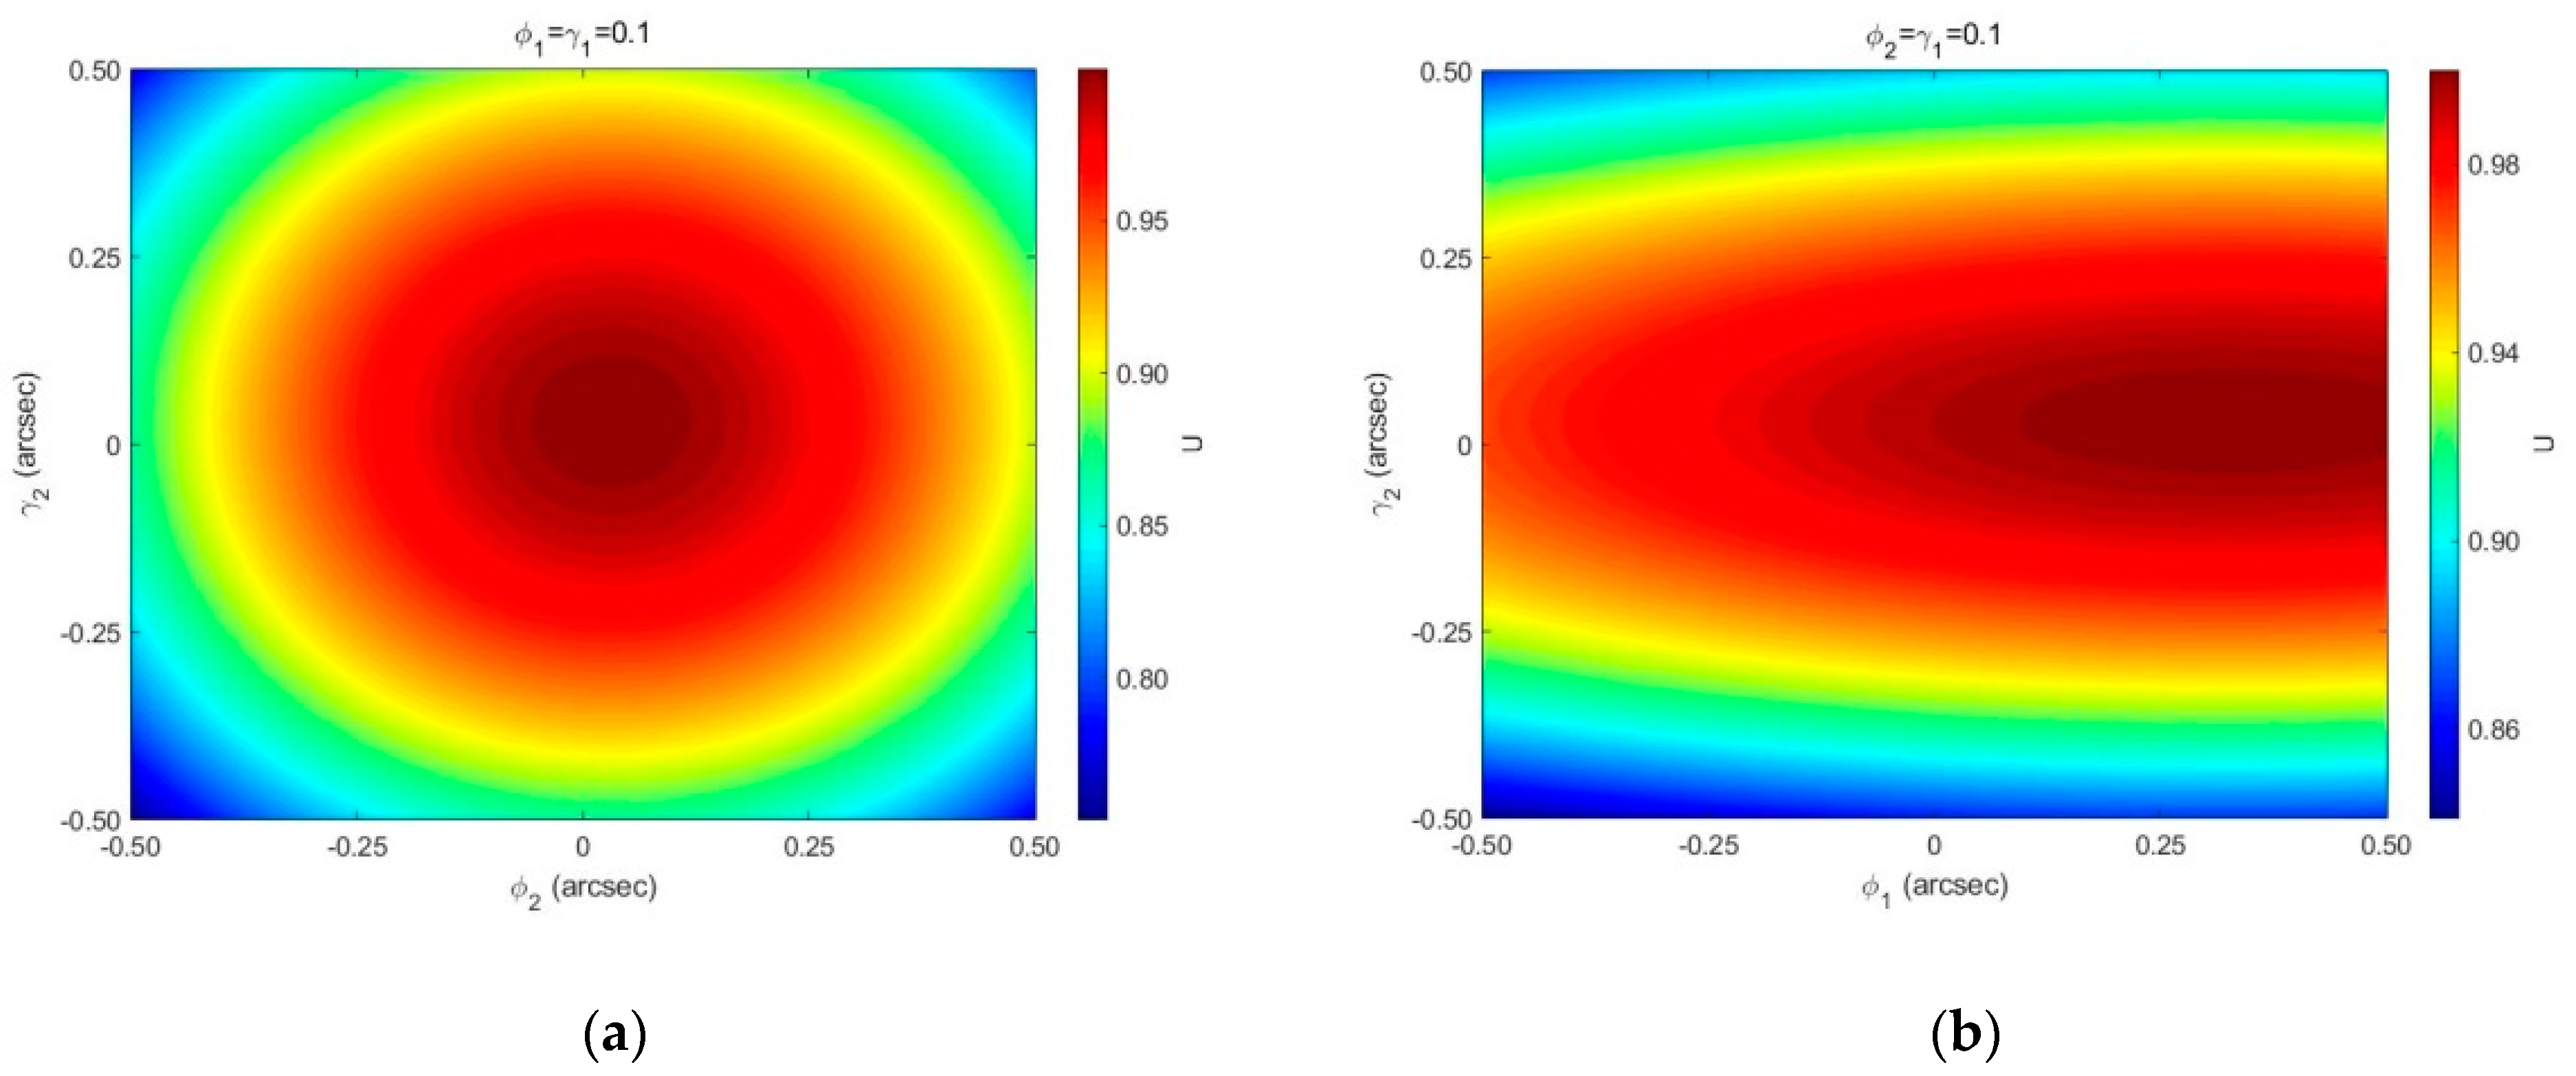
As shown in Figure 11a, it is the change of the instrument visibility when ϕ 1 = γ 1 = 0.1 . That is, only when the compensation glass surface of arm 1 has an inclination angle is the influence of the compensation glass surface tilt of arm 2 on the instrument visibility considered. It can be seen that when the compensation glass of arm 1 is tilted, the tilt angle of the glass can be compensated by adjusting arm 2 to maximize the instrument visibility; The Figure 11b is the change of the instrument visibility when two compensation glasses have tilt angles around the x-axis and y-axis when ϕ 2 = γ 1 = 0.1 . It can be seen from the figure that if the visibility of the instrument reaches the maximum, it is necessary to have a certain deflection angle for ϕ 1 and γ 2 at the same time, instead of taking ϕ 1 = γ 2 = 0 in this case. In summary, it can be found that the tilt angle has a great influence on the instrument visibility. Therefore, in practical applications, the angle of compensating the tilt of the glass surface should be controlled as much as possible to increase the instrument visibility.

4.3. The Influence of Mirror Surface Accuracy on Instrument Visibility

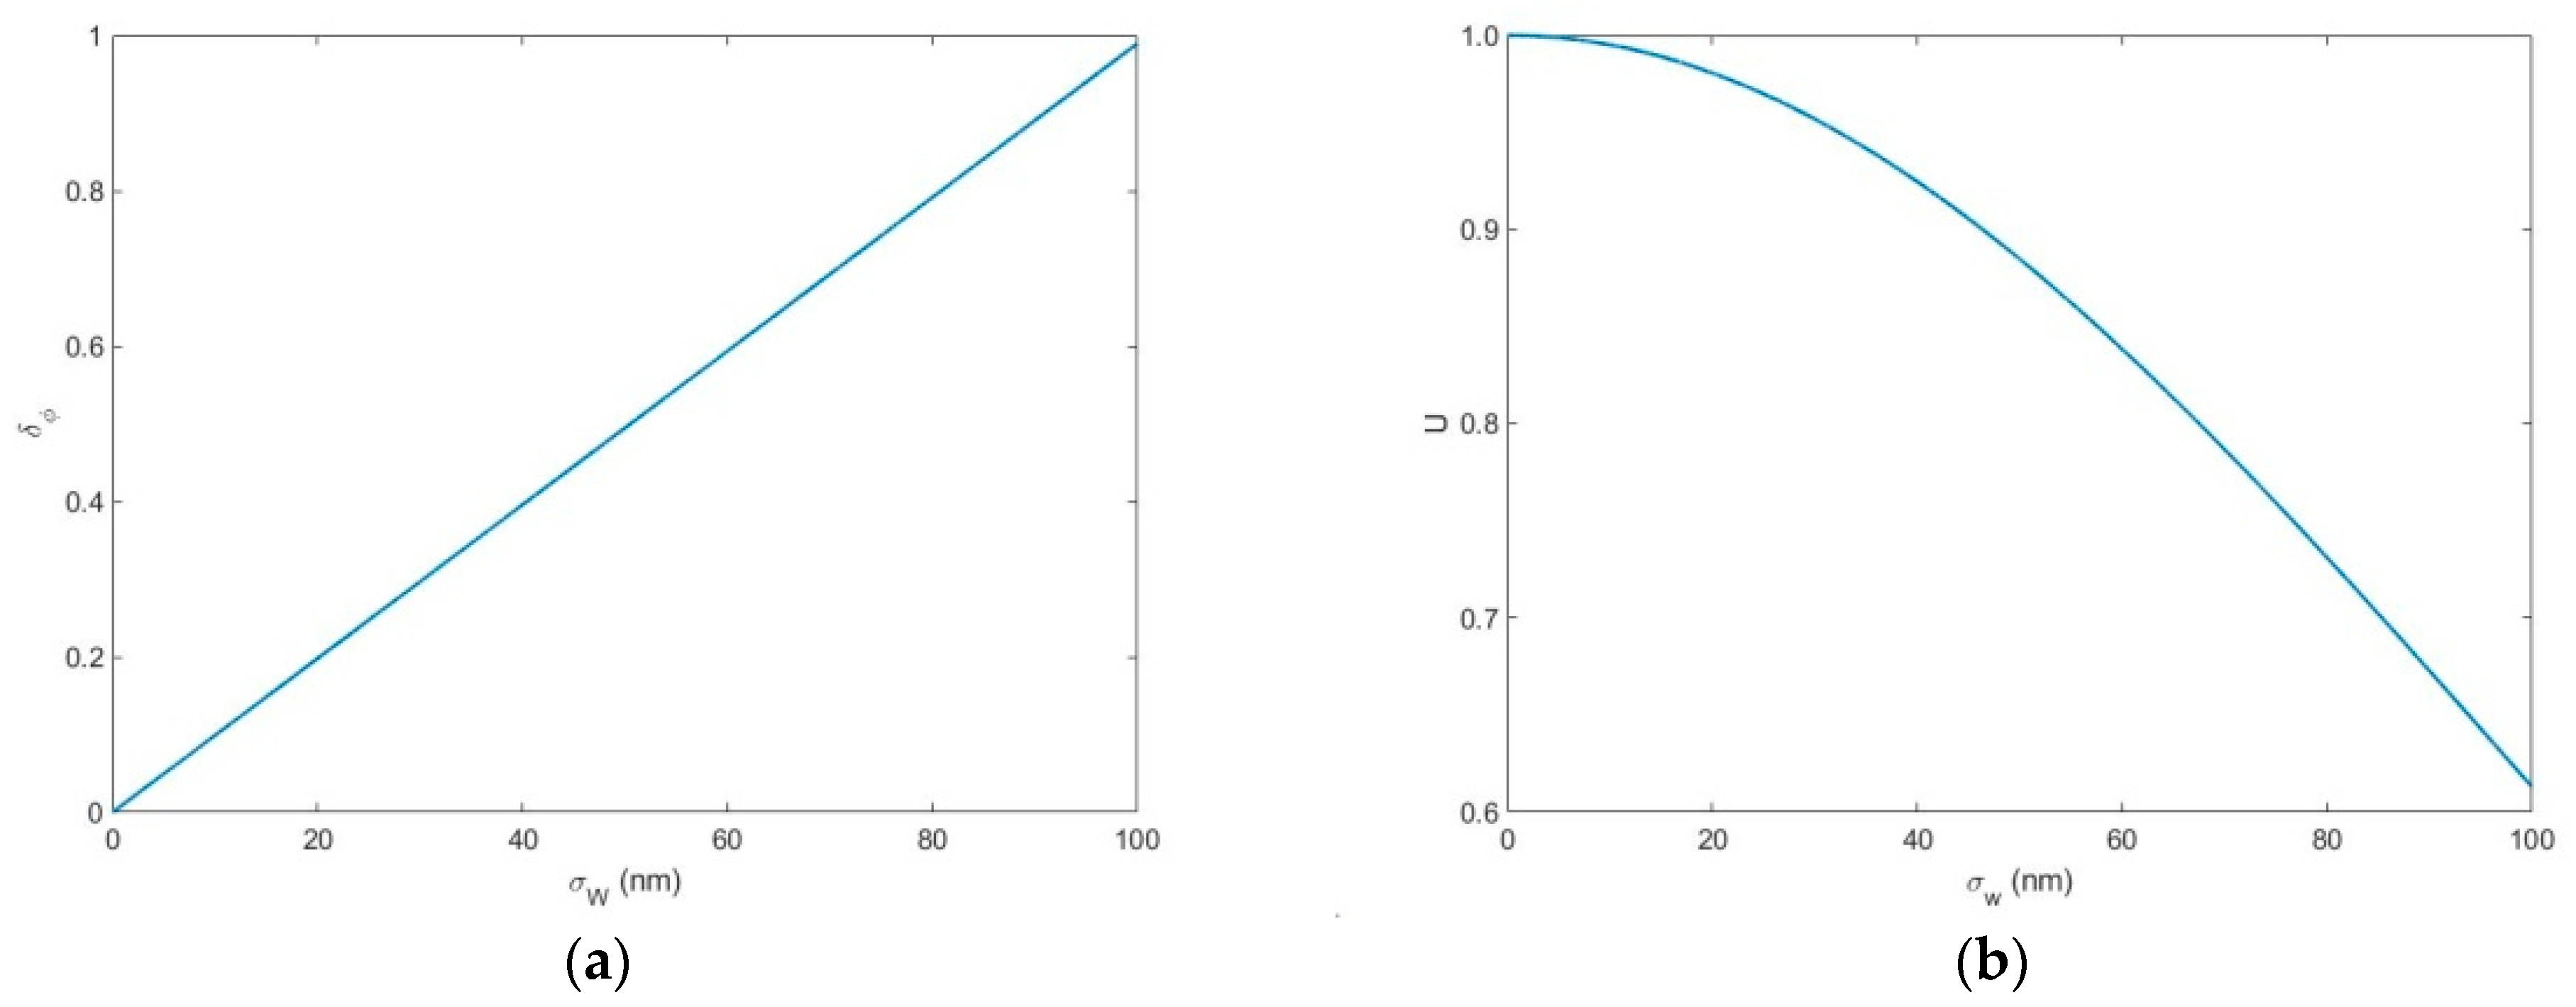
As shown in Figure 12a, when considering the mirror surface error, the phase difference change and the instrument visibility change with the surface error, what we can get from the figure is that the interference phase difference δ φ increases linearly with the increase of the root mean square value of the mirror surface error σ W . Analyzing Figure 12b, when the instrument visibility U > 0.9 , σ W should satisfy σ W 45.87   nm . In summary, σ W should be reduced as much as possible to ensure that the instrument has high visibility in practical applications.

4.4. Wind Speed and Temperature Measurement Accuracy

In the altitude range of 25 ~ 110   km , the atmospheric temperature varies from 170 K to 310 K . Therefore, this section simulates the influence of the instrument visibility on the standard deviation of wind speed and temperature random error. Figure 13 shows the relationship between wind speed and temperature random deviation with the instrument visibility. The analysis of this figure shows that when the instrument visibility U > 0.9 , in the detection range, the random deviation of wind speed is within 1.1 m / s , and the random deviation of temperature is within 5.7 K .

5. Conclusions

This paper discussed the principles and system optical path of the ozone wind imaging interferometer used in the detection of mid–low atmospheric wind speed, temperature and ozone concentration, and it focused on the analysis of instrument visibility. We concluded as follow:
  • When the splitting ratio of the beam splitter reaches 1:1, the instrument visibility reaches the maximum value. The splitting ratio should satisfy when the incident angle is i = 1.5 and U > 0.9 . The splitting ratio of the beam splitter and the pyramid prism play an important role in the distribution of instrument visibility.
  • The tilt angle of the compensation glass surface γ i and ϕ i have the same impact on the instrument visibility; for ϕ 1 and ϕ 2 , the influence of ϕ 2 is greater than that of ϕ 1 . When ϕ 1 and ϕ 2 are limited to - 0.35 arcsec ~ 0.35 arcsec , the instrument visibility U > 0.9 . In practical applications, the tilt angle of the compensation glass surface should be controlled as much as possible to increase the instrument visibility.
  • When considering the mirror surface error, σ W should satisfy σ W 45.87   nm if the instrument visibility U > 0.9 .
  • when the instrument visibility U > 0.9 , in the detection range, the random deviation of wind speed is within 1.1 m / s , and the random deviation of temperature within 5.7 K .
In the actual measurement, the instrument visibility may also be affected by the uneven refractive index of the glass and the slight tilt of other components. In addition, the accuracy of wind speed and temperature will be reduced because it will be affected by various factors such as latitude and altitude, but this calculation still has good guidance and reference significance, and it also provides important theoretical basis and experimental guidance for the development of ozone wind imaging interferometers.

Author Contributions

Conceptualization, C.Z., X.D. and G.L.; methodology, C.Z., X.D. and T.Y.; software, X.D. and T.Y.; validation, C.Z., X.D. and T.Y.; writing—original draft preparation, X.D.; writing—review and editing, C.Z., X.D., T.Y. and G.L. All authors have read and agreed to the published version of the manuscript.

Funding

This research was funded by the Major International (Regional) Joint Research Project of National Natural Science Foundation of China (Grant No. 42020104008), The Key Program of National Natural Science Foundation of China (Grant No. 41530422), National High Technology Research and Development Program of China (863 Program) (Grant No. 2012AA121101).

Institutional Review Board Statement

Not applicable.

Informed Consent Statement

Not applicable.

Data Availability Statement

Data sharing not applicable.

Conflicts of Interest

The authors declare no conflict of interest.

References

  1. Zhu, X.; Yee, J.-H.; Talaat, E.R. Diagnosis of Dynamics and Energy Balance in the Mesosphere and Lower Thermosphere. J. Atmos. Sci. 2001, 58, 2441–2454. [Google Scholar] [CrossRef]
  2. He, W.-W.; Wu, K.-J.; Wang, S.-N. Observation technology of wind and temperature by on board imaging interferometer with 1.27 μm air glow. Opt. Optoelectron. Technol. 2019, 17, 72–74. [Google Scholar]
  3. Shangguan, M.; Xia, H.; Wang, C.; Qiu, J.; Shentu, G.; Zhang, Q.; Dou, X.; Pan, J.W. All-fiber up conversion high spectral resolution wind lidar using a Fabry-Perot interferometer. Opt. Express 2016, 24, 19322–19336. [Google Scholar] [CrossRef]
  4. Liu, F.; Yi, F. Lidar-measured atmospheric N_2 vibrational-rotational Raman spectra and consequent temperature retrieval. Opt. Express 2014, 22, 27833–27844. [Google Scholar] [CrossRef] [PubMed]
  5. Xiao-Hua, J.; Chun-Min, Z.; Bao-Chang, Z. A new method for spectrum reproduction and interferogram processing. Acta Phys. Sin. 2007, 56, 824–829. [Google Scholar]
  6. Zhi-Lin, Y.; Chun-Min, Z.; Bao-Chang, Z. Study of SNR of a novel polarization interference imaging spectrometer. Acta Phys. Sin. 2007, 56, 6413–6419. [Google Scholar]
  7. Zhi-Hong, P.; Chun-Min, Z.; Bao-Chang, Z.; Ying-Cai, L.; Fu-Quan, W. The transmittance of Savart polariscope in polarization interference imaging spectrometer. Acta Phys. Sin. 2006, 55, 6374–6381. [Google Scholar]
  8. Shepherd, G.G.; Gault, W.A.; Miller, D.W.; Pasturczyk, Z.; Johnston, S.F.; Kosteniuk, P.R.; Haslett, J.W.; Kendall, D.J.W.; Wimperis, J.R. WAMDII: Wide-angle Michelson Doppler imaging interferometer for Spacelab. Appl. Opt. 1985, 24, 1571–1584. [Google Scholar] [CrossRef] [PubMed] [Green Version]
  9. Chunmin, Z. Interference image spectroscopy for upper atmospheric wind field measurement. Acta Opt. Sin. 2000, 20, 234–239. [Google Scholar]
  10. Shepherd, G.G.; Thuillier, G.; Gault, W.A.; Solheim, B.H.; Hersom, C.; Alunni, J.M.; Brun, J.-F.; Brune, S.; Charlot, P.; Cogger, L.L.; et al. WINDII, the wind imaging interferometer on the Upper Atmosphere Research Satellite. J. Geophys. Res. Space Phys. 1993, 98, 10725–10750. [Google Scholar] [CrossRef]
  11. Gault, W.A.; Sargoytchev, S.I.; Shepherd, G.G. Divided-Mirror Scanning Technique for a Small Michelson Interferometer. In Optical Spectroscopic Techniques and Instrumentation for Atmospheric and Space Research II; International Society for Optics and Photonics: Bellingham, WA, USA, 1996; Volume 2830, pp. 15–18. [Google Scholar]
  12. Shepherd, G.G.; Thuillier, G.; Cho, Y.M.; Duboin, M.L.; Evans, W.F.; Gault, W.A.; Hersom, C.; Kendall, D.J.W.; Lathuillere, C.; Lowe, R.P.; et al. The Wind Imaging Interferometer (WINDII) on the Upper Atmosphere Research Satellite: A 20 year perspective. Rev. Geophys. 2012, 50, RG2007. [Google Scholar] [CrossRef] [Green Version]
  13. Ward, W.E.; Gault, W.A.; Shepherd, G.G.; Rowlands, N. Research om theory and application of the interferogram of vogit profile. Proc. SPIE 2001, 4540. [Google Scholar] [CrossRef]
  14. He, J.; Zhang, C.M.; Zhang, Q.G. Research om theory and application of the interferogram of vogit profile. Acta Phys. Sin. 2007, 27, 423–426. [Google Scholar] [CrossRef] [Green Version]
  15. Crutzen, P.J.; Jones, I.T.N.; Wayne, R.P. Calculation of [O2(a1Δg)] in the atmosphere using new laboratory data. J. Geophys. Res. 1971, 76, 1490–1497. [Google Scholar] [CrossRef]
  16. Wu, K.; Fu, D.; Feng, Y.; Li, J.; Hao, X.; Li, F. Simulation and application of the emission line O19P18 of O-2(a(1)Delta(g)) dayglow near 1.27 μm for wind observations from limb-viewing satellites. Opt. Express 2018, 26, 16984–16999. [Google Scholar] [CrossRef]
  17. Evans, W.F.J.; Hunten, D.M.; Llewellyn, E.J.; Jones, A.V. Altitude profile of the infrared atmospheric system of oxygen in the dayglow. J. Geophys. Res. 1968, 73, 2885–2896. [Google Scholar] [CrossRef]
  18. Mlynczak, M.G.; Morgan, F.; Yee, J.H.; Espy, P.; Murtagh, D.; Marshall, B.; Schmidlin, F. Simultaneous measurements of the O2(1Δ) and O2(1∑) Airglows and ozone in the daytime mesosphere. Geophys. Res. Lett. 2001, 28, 999–1002. [Google Scholar] [CrossRef]
  19. Thomas, R.J.; Barth, C.A.; Rusch, D.W.; Sanders, R.W. Solar Mesosphere Explorer Near-Infrared Spectrometer: Measurements of 1.27 μm radiances and the inference of mesospheric ozone. J. Geophys. Res. Atmos. 1984, 89, 9569–9580. [Google Scholar] [CrossRef]
  20. Llewellyn, E.J.; Lloyd, N.D.; Degenstein, D.A.; Gattinger, R.L.; Petelina, S.V.; Bourassa, A.E.; Wiensz, J.T.; Ivanov, E.V.; McDade, I.C.; Solheim, B.H.; et al. The OSIRIS instrument on the Odin spacecraft. Can. J. Phys. 2004, 82, 411–422. [Google Scholar] [CrossRef]
  21. Mlynczak, M.G.; Marshall, B.T.; Martin-Torres, F.J.; Russell, J.M., III; Thompson, R.E.; Remsberg, E.E.; Gordley, L.L. Sounding of the Atmosphere using Broad band Emission Radiometry observations of daytime mesospheric O2(1Δ) 1.27 μm emission and derivation of ozone, atomic oxygen, and solar and chemical energy deposition rates. J. Geophys. Res. Atmos. 2007, 112, D15306. [Google Scholar] [CrossRef]
  22. Rahnama, P.; Rochon, Y.J.; McDade, I.C.; Shepherd, G.G.; Gault, W.A.; Scott, A. Satellite measurement of stratospheric winds and ozone using Doppler Michelson interferometry. Part I: Instrument model and measurement simulation. J. Atmos. Ocean. Technol. 2006, 23, 753–769. [Google Scholar] [CrossRef]
  23. Lin, Z.; Chun-Min, Z.; Xiao-Hua, J. Passive detection of upper atmospheric wind field based on the Lorentzian line shape profile. Acta Phys. Sin. 2010, 59, 899–906. [Google Scholar]
  24. Rahanma, P. Simulation and Analysis Studies of SWIFT Measurements. Master’s Thesis, York University, Toronto, ON, Canada, 2003. [Google Scholar]
  25. Shepherd, G.G. Spectral Imaging of the Atmosphere; Academic Press: Salt Lake City, UT, USA, 2002; p. 82. [Google Scholar]
  26. Piao, R. Middle Atmospheric Temperature Variation and Near-Infrared Static Wind Imaging Interferometry. Ph.D. Thesis, Xi’an Jiaotong University, Shaanxi, China, 2020. [Google Scholar]
  27. Evans, W.F.J.; McDade, I.C.; Yuen, J.; Llewellyn, E.J. A rocket measurement of the O2 Infrared Atmospheric (0–0) band emission in the dayglow and a determination of the mesospheric ozone and atomic oxygen densities. Can. J. Phys. 1988, 66, 941–946. [Google Scholar] [CrossRef]
  28. Shepherd, G.G.; McDade, I.C.; Gault, W.A.; Rochon, Y.J.; Scott, A.; Rowlands, N.; Buttner, G. The Stratospheric Wind Interferometer for Transport studies (SWIFT). In Proceedings of the 2001 IEEE International Geoscience Remote Sensing Symposium, Sydney, Australia, 9–13 July 2001. [Google Scholar]
  29. Rochon, Y.J. The retrieval of winds, Doppler temperatures, and emission rates for the WINDII experiment. Ph.D. Thesis, York University, Toronto, ON, Canada, 2000. [Google Scholar]
  30. Rahnama, P.; Rochon, Y.J.; McDade, I.C.; Shepherd, G.G.; Gault, W.A.; Scott, A. Satellite Measurement of Stratospheric Winds and Ozone Using Doppler Michelson Interferometry. Part II: Retrieval Method and Expected Performance. J. Atmos. Ocean. Technol. 2006, 23, 770–784. [Google Scholar] [CrossRef]
  31. Katti, P.K.; Singh, K. A Note on the Surface Accuracy and Alignment of the End Mirrors in a Michelson Interferometer. Appl. Opt. 1966, 5, 1962–1964. [Google Scholar] [CrossRef] [PubMed]
  32. Ward, W.E. The Design and Implementation of the Wide-Angle Michelson Interferometer to Observe Thermospheric Winds. Ph.D. Thesis, York University, Toronto, ON, Canada, 1988. [Google Scholar]
Figure 1. Schematic diagram of optical path of the ozone wind imaging interferometer.
Remotesensing 13 01062 g001
Figure 2. Schematic diagram of the light propagation plane of the Michelson interferometer (M1).
Remotesensing 13 01062 g002
Figure 3. The pyramid prism light path.
Remotesensing 13 01062 g003
Figure 4. Schematic diagram of the three-dimensional coordinate system of the Michelson interferometer (M1) system.
Remotesensing 13 01062 g004
Figure 5. The visibility of the instrument when the incident angle is 1.5 .
Remotesensing 13 01062 g005
Figure 7. Transmittance of beam splitter to different light.
Remotesensing 13 01062 g007
Figure 8. Transmittance of different light in one of the four zones. (a) T P 1 ; (b) T S 1 ; (c) T P 2 ; (d) T S 2 .
Remotesensing 13 01062 g008
Figure 9. The distribution of instrument visibility on CCD.
Remotesensing 13 01062 g009
Figure 10. The influence of ϕ i on instrument visibility.
Remotesensing 13 01062 g010
Figure 11. The influence of different tilt angles on instrument visibility. (a) ϕ 1 = γ 1 = 0.1 ; (b) ϕ 2 = γ 1 = 0.1 .
Remotesensing 13 01062 g011
Figure 12. (a) The variation of phase difference with surface error; (b) The variation of instrument visibility with surface error.
Remotesensing 13 01062 g012
Figure 13. The relationship between the wind speed and temperature random deviation and the instrument visibility. (a) Wind speed random deviation; (b) Temperature random deviation.
Remotesensing 13 01062 g013
Publisher’s Note: MDPI stays neutral with regard to jurisdictional claims in published maps and institutional affiliations.