Communication

A Machine Learning Method for Predicting Vegetation Indices in China

1
School of Atmospheric Sciences, Sun Yat-sen University, Zhuhai 519082, China
2
Key Laboratory of Tropical Atmosphere-Ocean System, Ministry of Education, Zhuhai 519082, China
3
Southern Marine Science and Engineering Guangdong Laboratory, Zhuhai 519082, China
*
Author to whom correspondence should be addressed.
These authors contributed equally to this study.
Remote Sens. 2021, 13(6), 1147; https://doi.org/10.3390/rs13061147
Submission received: 11 February 2021 / Revised: 7 March 2021 / Accepted: 15 March 2021 / Published: 17 March 2021
(This article belongs to the Special Issue Machine Learning Techniques Applied to Geosciences and Remote Sensing)

Abstract

:
To forecast the terrestrial carbon cycle and monitor food security, vegetation growth must be accurately predicted; however, current process-based ecosystem and crop-growth models are limited in their effectiveness. This study developed a machine learning model using the extreme gradient boosting method to predict vegetation growth throughout the growing season in China from 2001 to 2018. The model used satellite-derived vegetation data for the first month of each growing season, CO2 concentration, and several meteorological factors as data sources for the explanatory variables. Results showed that the model could reproduce the spatiotemporal distribution of vegetation growth as represented by the satellite-derived normalized difference vegetation index (NDVI). The predictive error for the growing season NDVI was less than 5% for more than 98% of vegetated areas in China; the model represented seasonal variations in NDVI well. The coefficient of determination (R2) between the monthly observed and predicted NDVI was 0.83, and more than 69% of vegetated areas had an R2 > 0.8. The effectiveness of the model was examined for a severe drought year (2009), and results showed that the model could reproduce the spatiotemporal distribution of NDVI even under extreme conditions. This model provides an alternative method for predicting vegetation growth and has great potential for monitoring vegetation dynamics and crop growth.

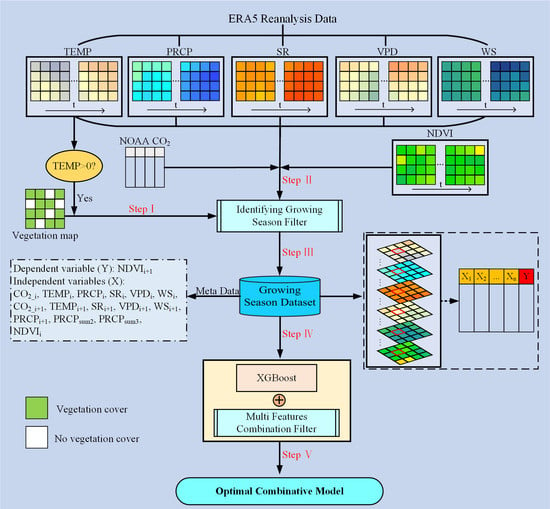
Graphical Abstract

1. Introduction

Terrestrial vegetation growth plays an important role in regulating the global carbon cycle and atmospheric CO2 concentrations [1], mitigating climate change [2], and maintaining ecosystem structure and function [3,4]. For example, a recent study revealed that seasonal changes in terrestrial vegetation growth drive the seasonality of atmospheric CO2 concentration [5]. However, rising temperatures and increased drought have impacted terrestrial vegetation, resulting in global stagnation of vegetation growth [6,7,8]. Therefore, reliable, objective, and timely information regarding vegetation growth is vital [9].
Predicting vegetation growth remains challenging [10]. While process-based ecosystem models play an important role in predicting vegetation growth [4], multiple ecosystem processes impact vegetation growth, and the current process-based models fail to accurately reproduce these critical ecosystem processes [11,12]. An accurate simulation of vegetation growth requires a more realistic representation of multiple processes, such as plant photosynthesis, respiration, and carbon allocation. However, the current process-based models fail to accurately reproduce these critical ecosystem processes. For example, a recent data comparison study found that process-based models did not capture the allocation of photosynthate to wood and leaves [11], leading to large uncertainties in simulated vegetation growth. Furthermore, a comparison of multiple models showed that process-based ecosystem models poorly represent vegetation growth [13].
Machine learning methods, which are independent of ecosystem process mechanisms, are an alternative means of predicting ecosystem structure and function [12,14,15]. Several approaches, including artificial neural networks, regression trees, support vector regression, and random forest, have been widely employed to predict vegetation growth [15]. Machine learning methods are independent of the relationships between response variables and predictive variables, especially when compared to traditional empirical models, such as linear regression, which require a Gaussian distribution for the input variables.
In this study, we develop and evaluate a machine learning model to simulate vegetation growth in China. There are diverse ecosystem types and climate zones in China, which provide a good chance to examine the applicability of the proposed model for reproducing vegetation growth. The primary objectives of this paper are as follows: (1) develop a machine learning model to simulate vegetation growth, represented by a satellite-based vegetation index, for all the vegetated regions of China; (2) evaluate the performance of the model with respect to reproducing the spatiotemporal distribution of vegetation growth; and (3) investigate the environmental factors influencing vegetation growth for various vegetation types in China.

2. Materials and Methods

2.1. Methodology

This study employed the extreme gradient boosting (XGBoost) machine learning method to predict vegetation growth as indicated by the satellite-derived normalized difference vegetation index (NDVI). XGBoost is an optimized, distributed gradient boosting algorithm designed to be highly efficient, flexible, and portable [16]. XGBoost introduces a regularized item for controlling model complexity into a loss function and uses a two-dimensional Taylor formula to explain the modified loss function. This overcomes the shortcomings of overfitting in the traditional gradient boosting model, enhancing both precision and generalization, which has often been used to investigate the structure and function of terrestrial ecosystems in China, especially in the study of vegetation mapping and biomass estimation [17,18].
This study used the satellite-based vegetation index, i.e., NDVI, to indicate vegetation growth; the same index has been widely used in previous studies [8,19]. A predictive NDVI model using the XGBoost method was developed using six explanatory environmental variables: mean air temperature, precipitation, vapor pressure deficit, wind speed, solar radiation, and atmospheric CO2 concentration. Considering the lagged effects of environmental variables on vegetation growth, we used variables from both the predicted and previous months. In terms of precipitation, accumulated precipitation for the previous two and three months and the current month was used. Because the vegetation growth of a given month is heavily dependent on the growth state of the previous month, the NDVI of the previous month was also included as an explanatory variable. Therefore, 15 explanatory variables were available to predict the NDVI in a given month. At each pixel, we used the combinatorial method to produce the optimal combination of the 15 variables. Combinations of 2 to 15 variables were examined, for a total of 32,756 outcomes. To select the best outcome, we evaluated the performance of each model based on the root-mean-square error (RMSE).
The leave-one-out cross-validation method was used to examine machine learning model performance. Monthly NDVI and environmental variables from 2001 to 2018 were used for model training and testing. In each step, the satellite-based NDVI of a given year was used as the validation set, and data from the remaining years were used as the training set. Based on the training set, models were built using all potential combinations of 2 to 15 variables and the performance of the models was evaluated using the validation data. After repeating this process for each year, all years were then selected as the validation data set. We compared the simulation errors derived from all 32,756 models through the dependent validations of the 18 years of data and selected the model with the minimum RMSE as the prediction model for a given pixel. It should be noted that we only used the satellite-derived NDVI as a model input in the first month of the growing season, and the predicted NDVI was used to drive the model for the remainder of the growing season.

2.2. Remote Sensing Data

We used NDVI data derived from the Moderate Resolution Imaging Spectroradiometer (MODIS) Vegetation Indices (VI) product (MOD13A3) to represent vegetation growth. The MOD13A3 product provides NDVI data from 2001 to 2018 at a spatial resolution of 1 × 1 km. This dataset was generated from the MODIS VI 16-day composite product (MOD13A2) using a time-weighted averaging method and has been corrected to minimize the noise from atmospheric effects, such as cloud shadows and aerosols. The MOD13A3 data are provided monthly and have been widely used to monitor vegetation conditions at regional and global scales. Additionally, to explore the key climate-driven factors influencing vegetation growth, pixels were further grouped into seven vegetation types, including evergreen needle-leaf trees (ENT), evergreen broadleaf trees (EBT), deciduous needle-leaf trees (DNT), deciduous broadleaf trees (DBT), shrubland, and grassland, based on the Plant Functional Types classification map obtained from MODIS Land Cover Type Product (MCD12Q1) (Figure 1b). Notably, the pixels with an annual mean NDVI over 18 years lower than 0.1 were excluded from this analysis to minimize the impact of bare soils and sparse vegetation pixels [20,21]. The above data can be freely downloaded from the National Aeronautics and Space Administration website (https://ladsweb.modaps.eosdis.nasa.gov/ accessed on 5 February 2021).

2.3. Meteorological Data

Meteorological data for model training and testing were from the European Centre for Medium-Range Weather Forecasts (ECMWF) version 5 reanalysis (ERA5) dataset (https://cds.climate.copernicus.eu/ accessed on 5 February 2021). As the latest generation ECWMF reanalysis data, ERA5 has an improved spatiotemporal resolution, radiative transfer model, and assimilation method compared to the previous ERA-Interim reanalysis product. These data are available from 1979 to the present with a horizontal resolution of 0.1 × 0.1°. Here, we used ERA5 data from 2001 to 2018, which was resampled to a 1 × 1 km spatial resolution to match the MOD13A3 NDVI data. The ERA5 meteorological variables used in this study include 2-m temperature (TA), total precipitation (PRCP), surface net radiation (SR), 10-m wind speed (WS), and vapor pressure deficit (VPD). Notably, the VPD was calculated on the basis of relative humidity and temperature [22]. Monthly observations of atmospheric carbon dioxide (CO2) were from the National Oceanic and Atmospheric Administration (NOAA). A monthly mean temperature above 0 °C was used as the criterion for the start of the growing season (Figure 1a).
The standardized precipitation evapotranspiration index (SPEI) [23] was used to identify drought years in China to examine the predictive performance of the model during extreme drought conditions. The SPEI is based on the principle of water balance, considering both precipitation and potential evapotranspiration, and has been widely used in detecting drought variations during the past several decades [24,25,26]. Annual SPEI data from the SPEI Global Drought Monitor website (https://spei.csic.es/ accessed on 5 February 2021) were used in this study.

2.4. Statistical Analysis

Model performance was evaluated by using the coefficient of determination (R2) to determine how much variation in the observations was explained by the model. Furthermore, RMSE was used to indicate the standard deviation of the residuals (prediction error) as follows:
R M S E = 1 n i = 1 n ( O i P i ) 2
where Oi and Pi indicate NDVI observations and predictions, respectively.
The relative predictive error (Bias) was used to quantify the difference between simulated and observed values as follows:
B i a s = i = 1 n ( O i P i ) i = 1 n O i × 100 %
The increment of mean square error (%IncMSE), reflecting the importance of the machine learning model variables for predicting the NDVI, was determined as follows [27,28]:
% IncMSE = ( M S E p e r m u t e d M S E a c t u a l ) M S E a c t u a l × 100 %
M S E = 1 n i = 1 n ( O i P i ) 2
For a given explanatory variable, the MSEpermuted refers to the averaged mean square error (MSE) when the given variable is permutated randomly 20 times, and the MSEactual refers to the model MSE without variable permutation.

3. Results

3.1. Model Evaluation

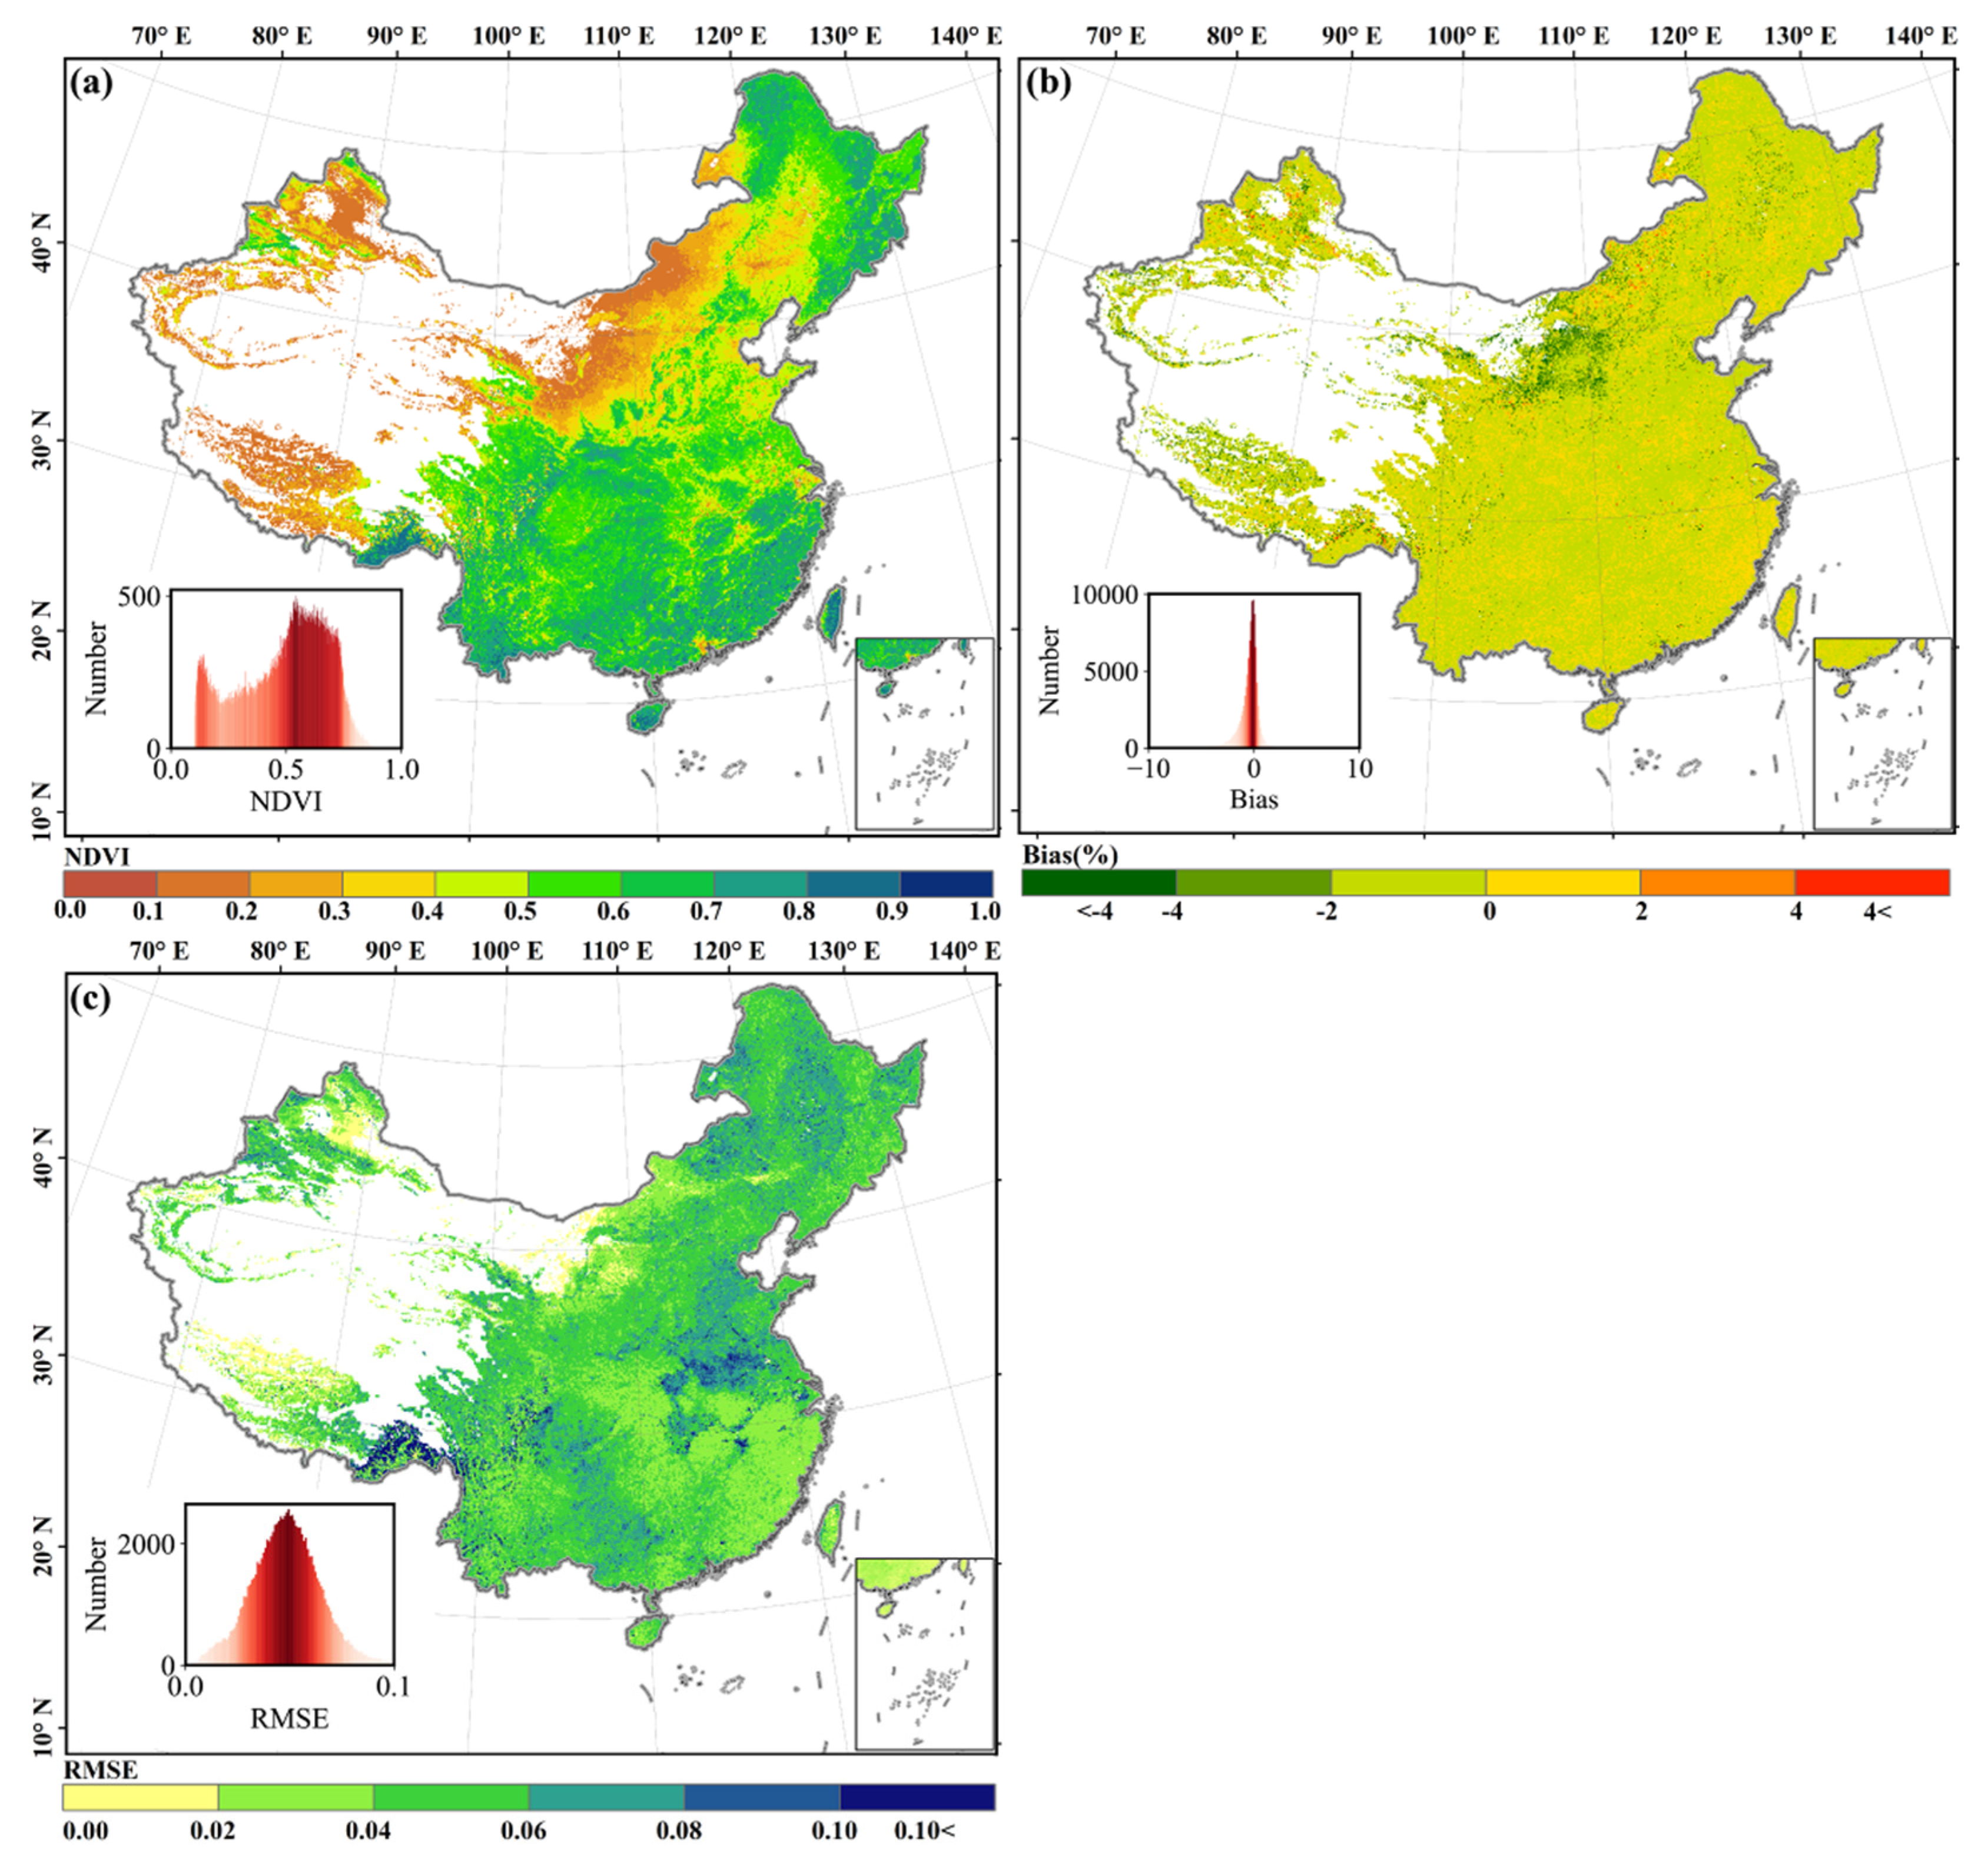
Results show that our model can predict the NDVI during the growing season using satellite-based NDVI observations for the first month of the growing season in conjunction with the meteorology dataset. Firstly, we examined the ability of the model to reproduce the spatiotemporal distribution of the NDVI in China. Figure 2 shows that the machine learning model can reproduce the spatial distribution of the satellite-based NDVI throughout China. The spatial distribution of simulated mean annual growing-season NDVI varied markedly, gradually increasing from the northwest to the southeast (Figure 2a), consistent with the observed pattern. The bias between the observed and predicted annual average NDVI is less than 5% for almost all pixels and displays a normal distribution with a mean of −0.49% and a standard deviation of 1.12% (Figure 2b). The model mean RMSE was 0.05, and RMSE was less than 0.1 over the majority (98.4%) of the study area (Figure 2c), indicating strong model performance.
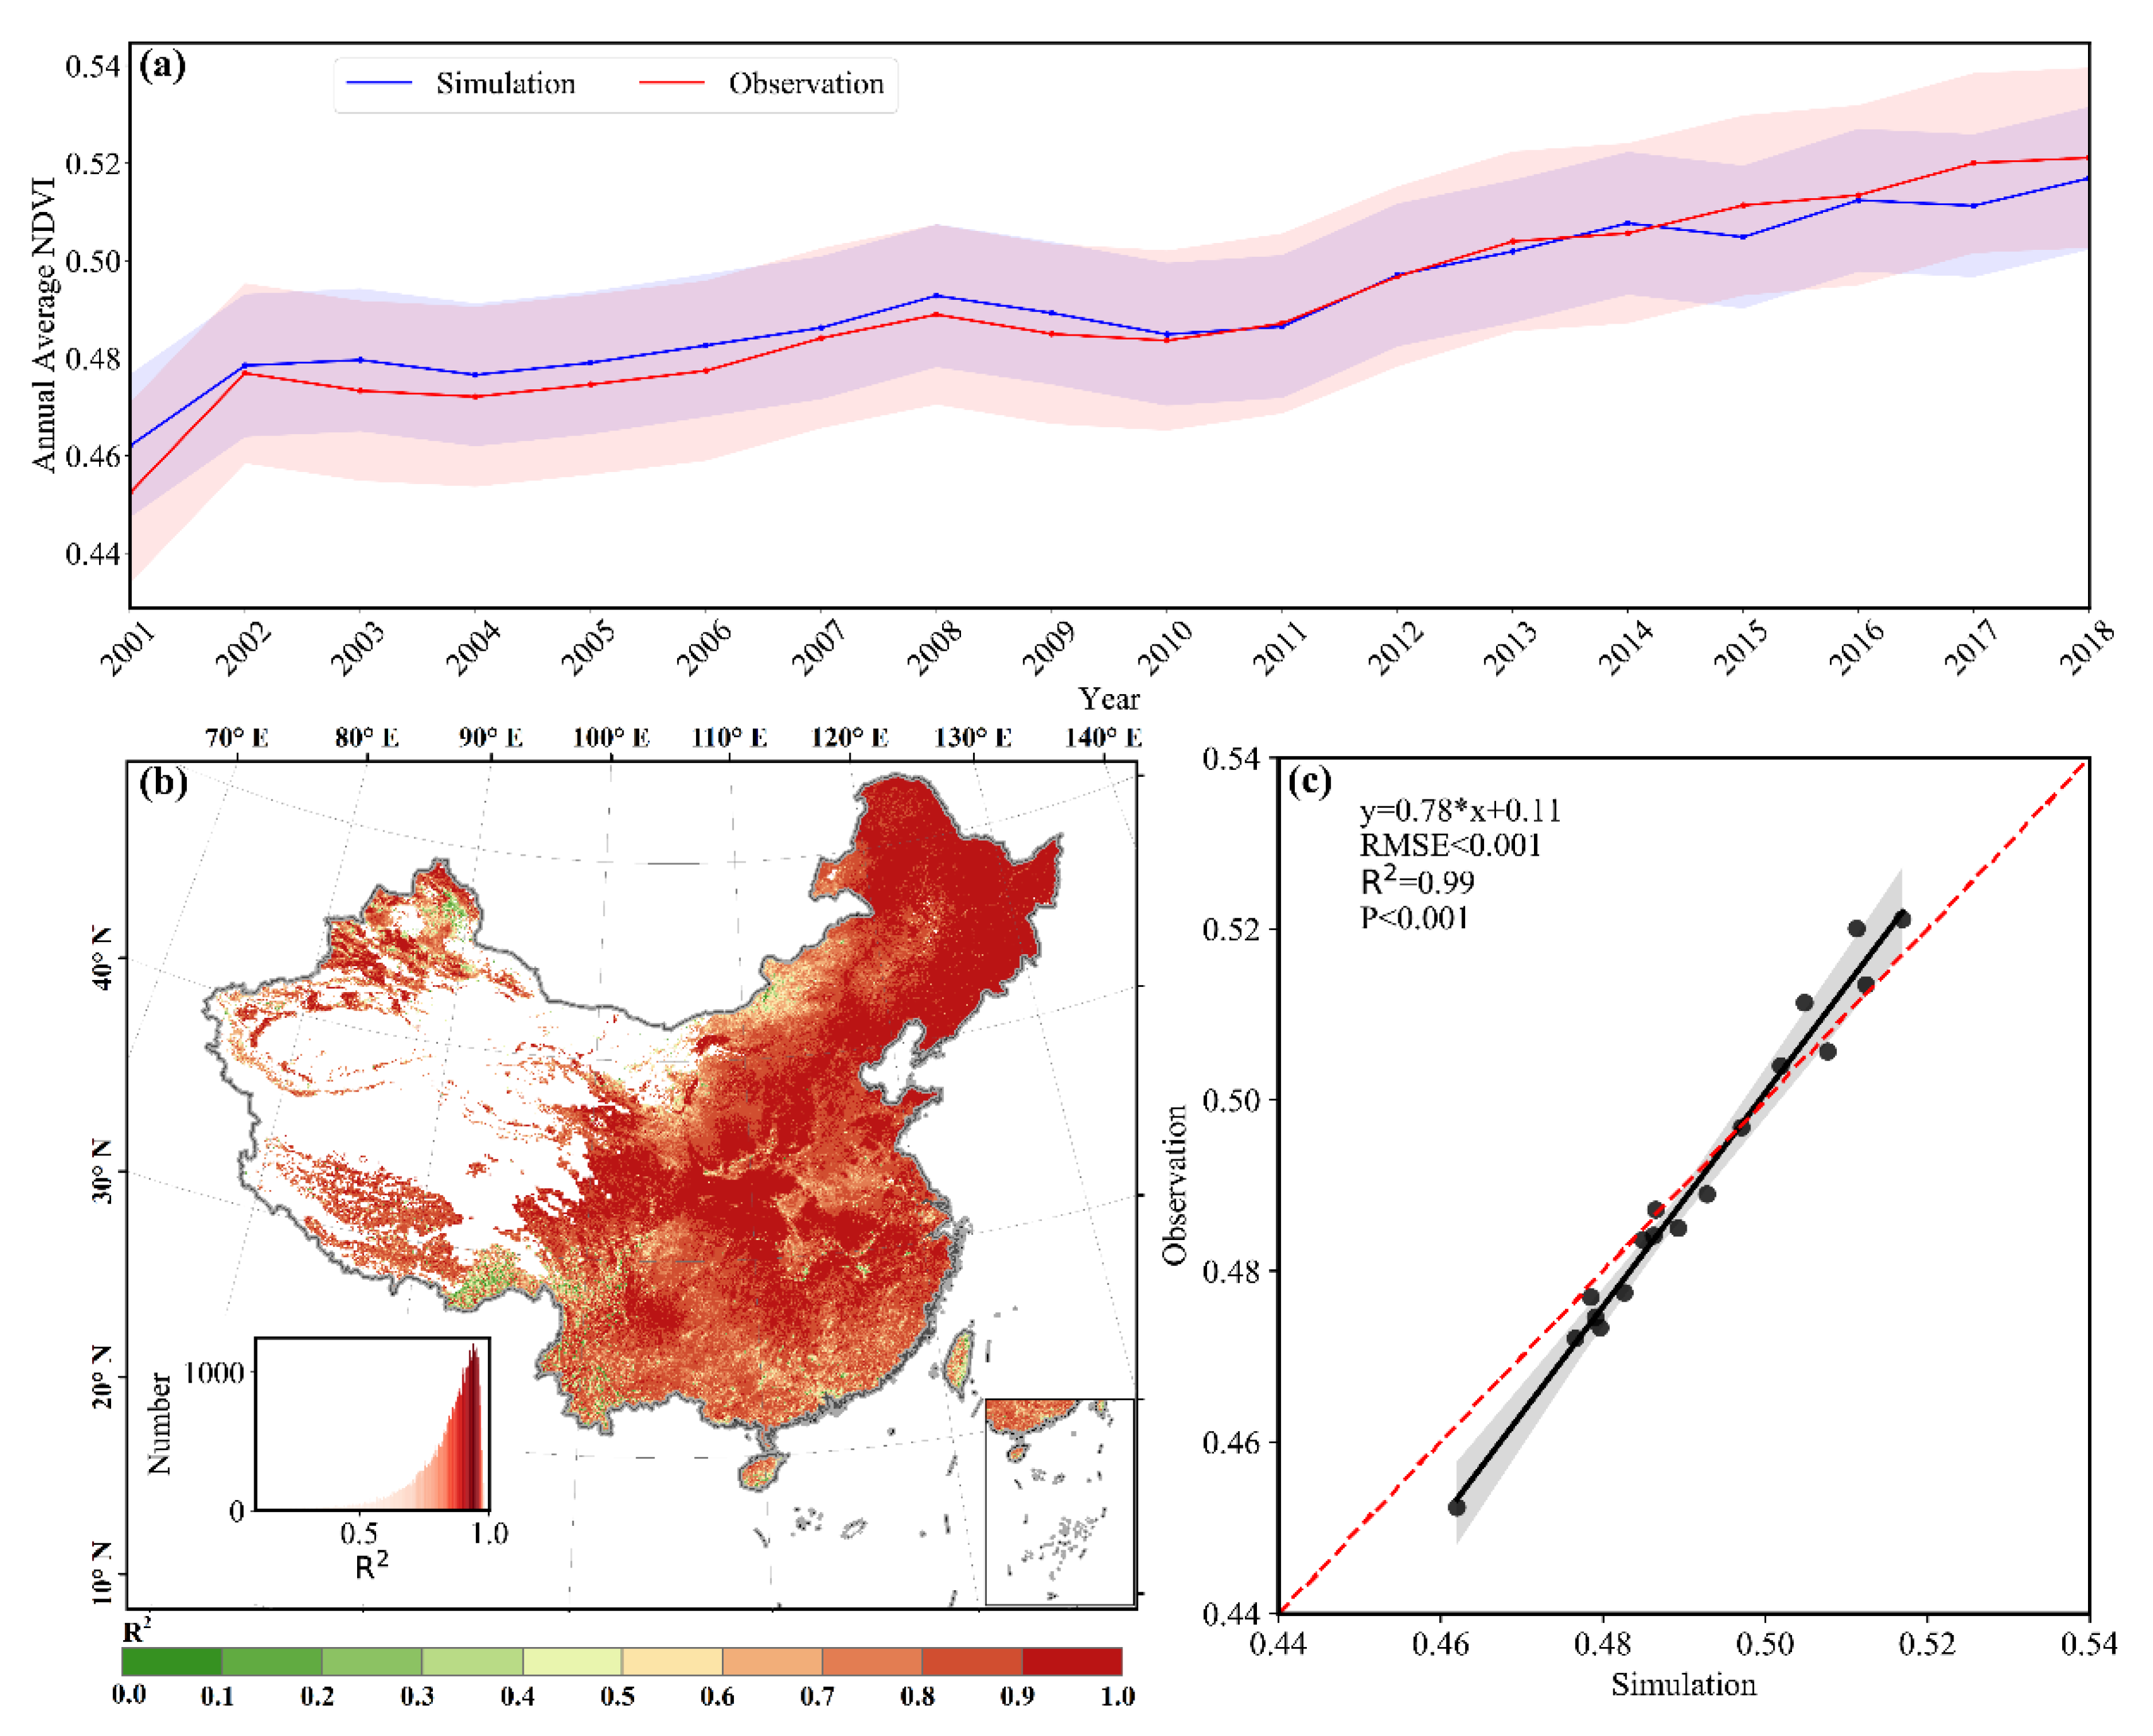
Second, we examined the ability of the model to reproduce the temporal variations of the NDVI from 2001 to 2018. Figure 3a,c shows that the model represents temporal variations in the annual mean NDVI very well. Both the simulated and observed NDVI showed a similar increasing tendency over the study period (Figure 3a). The accuracy of monthly simulated NDVI simulations throughout the growing season was assessed by calculating the R2 between the observed and simulated monthly NDVI from 2001 to 2018. The mean value of R2 was 0.83, indicating that the model can explain 83% of the seasonal variation in the NDVI (Figure 3b). Furthermore, nearly 70% of vegetated areas in China had an R2 > 0.8. Comparatively low R2 values were concentrated in the grassland regions of North China and the Qinghai–Tibet Plateau (Figure 3b).
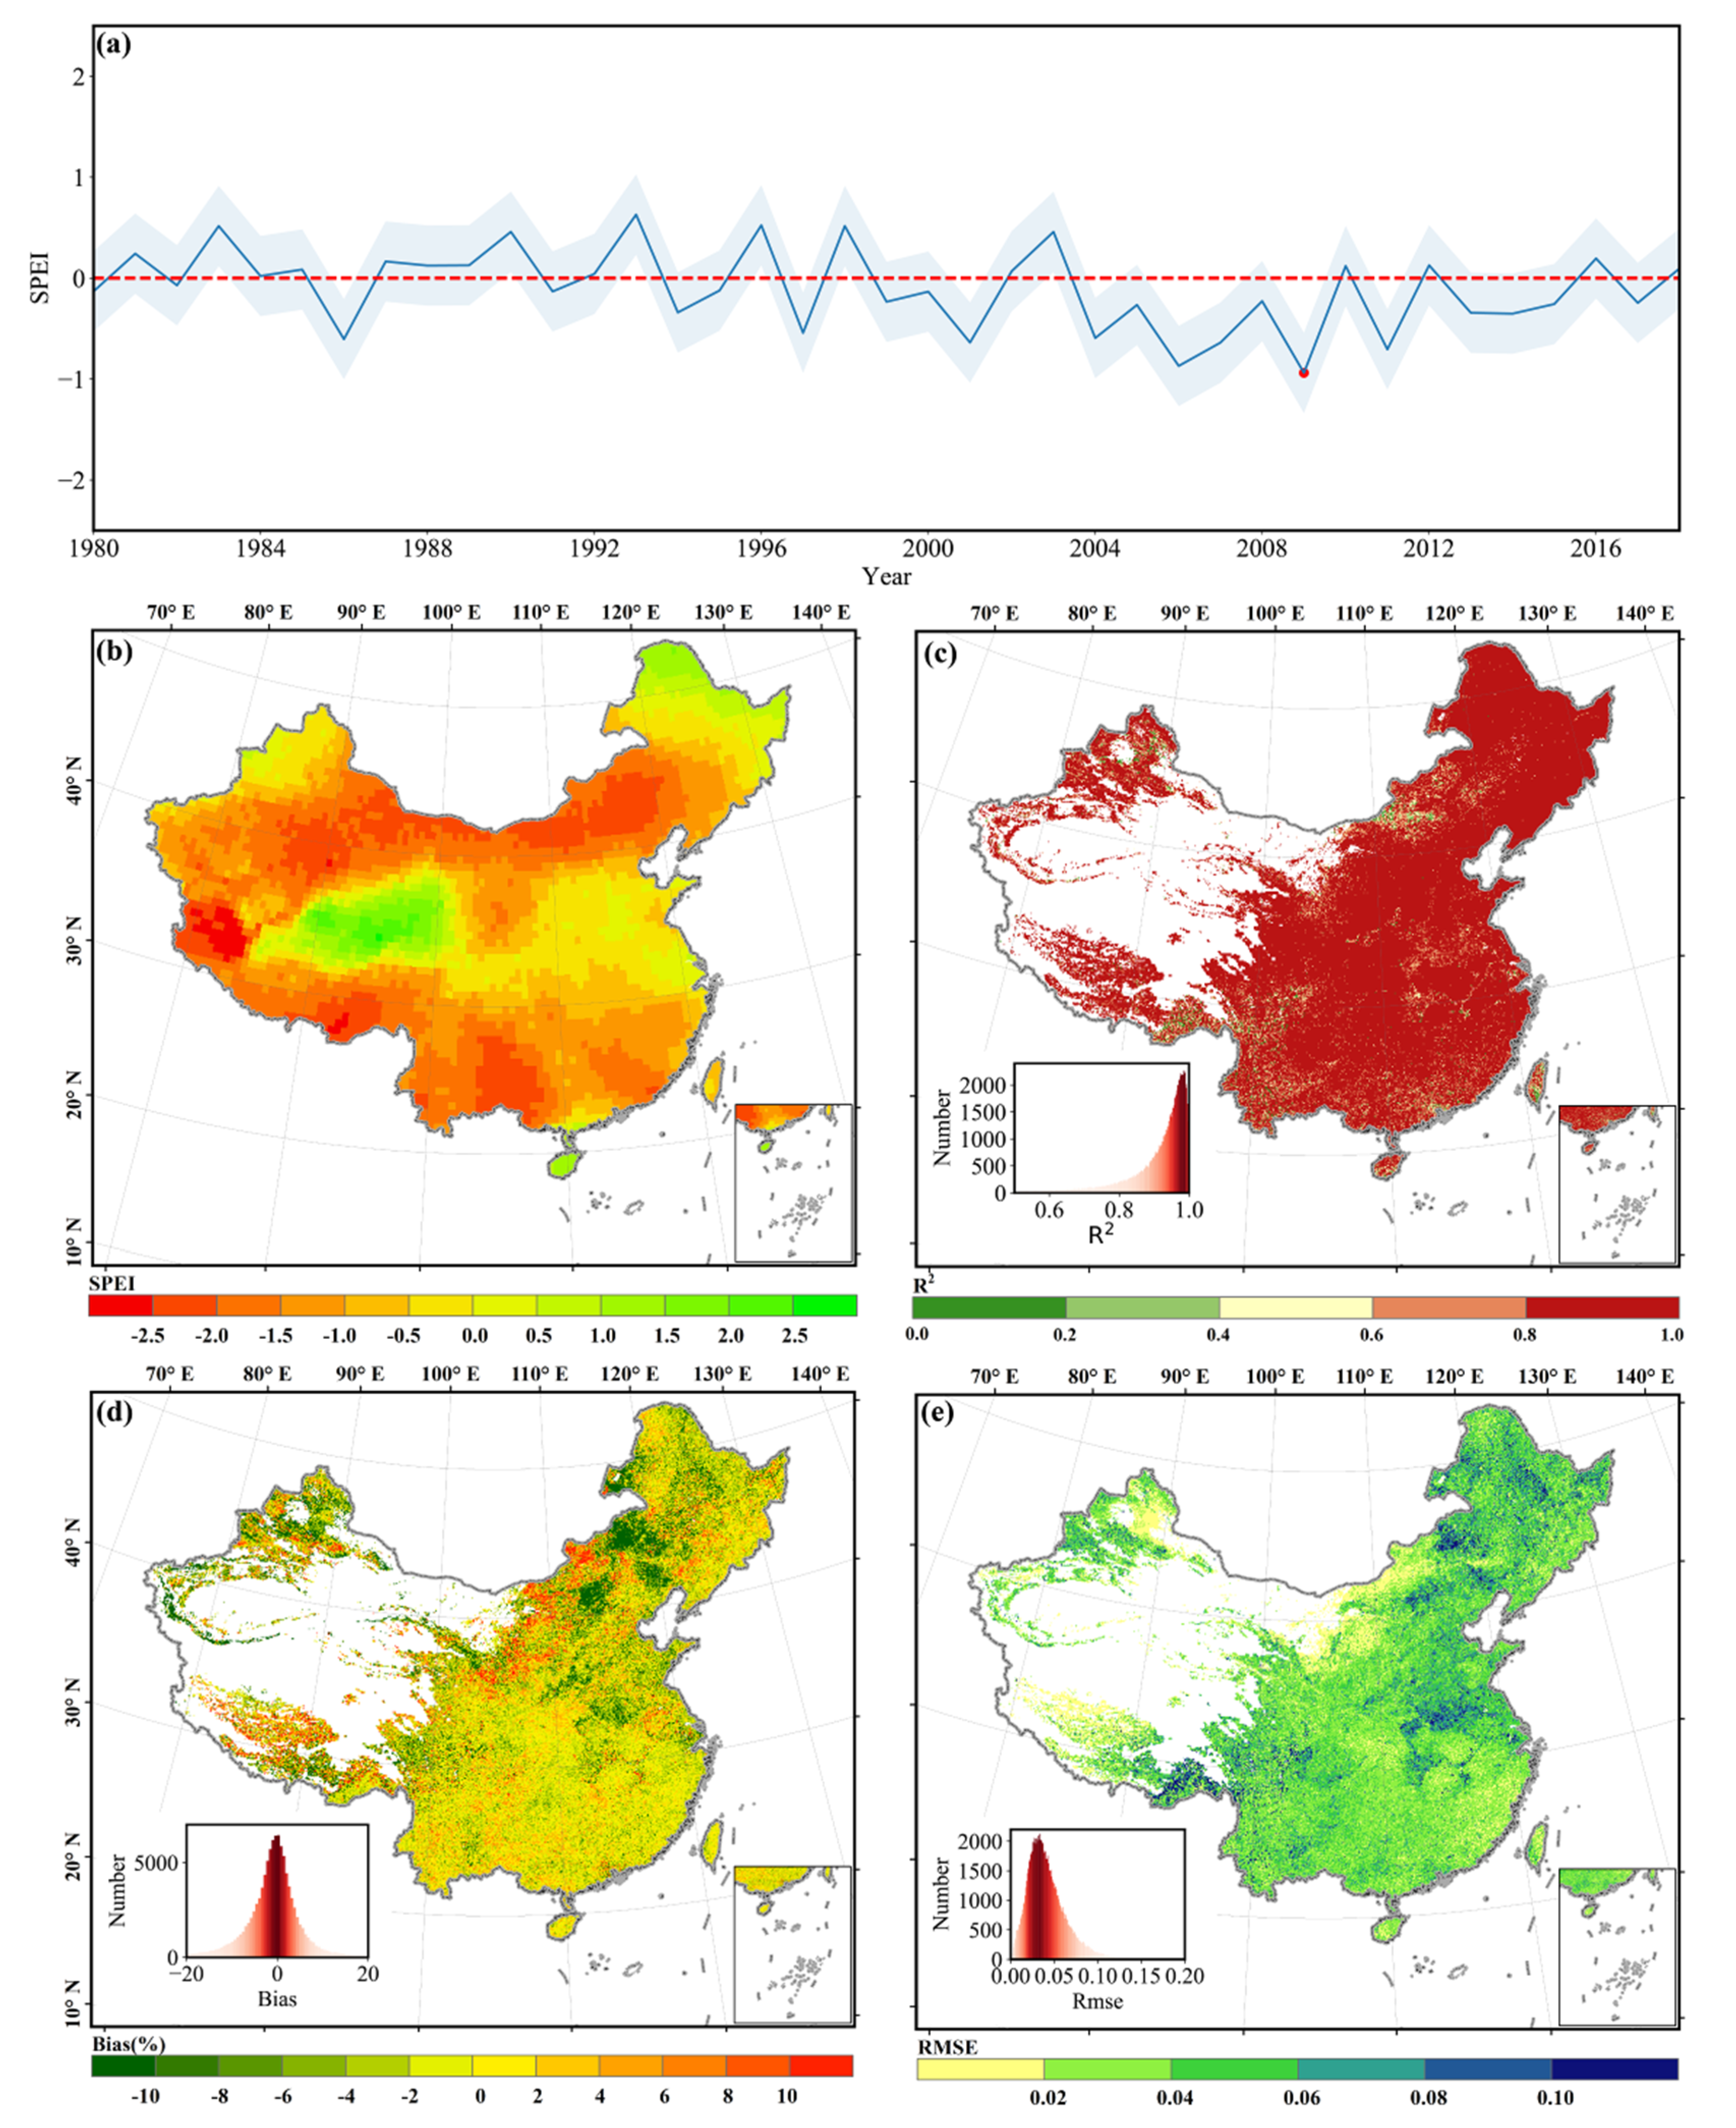
Most areas of China, except the Qinghai–Tibet Plateau and Northeast China, suffered severe drought stress in 2009, and over 11% of the nation’s vegetated areas experienced extreme drought, with an SPEI < −2.0 (Figure 4b). Figure 4c–e shows that the model could predict the seasonal and spatial variations in the NDVI during the serious drought year of 2009. Bias followed a normal distribution, with a mean value of −0.49% and a standard deviation of 1.12%, and over 69% of the investigated region had an absolute bias <5% (Figure 4d). The mean RMSE in 2009 was 0.04 (Figure 4e). Despite the extreme conditions of 2009, our model was able to reproduce the seasonal variations in the NDVI very well, with a mean R2 of 0.89 (Figure 4c).

3.2. Importance of the Explanatory Variables

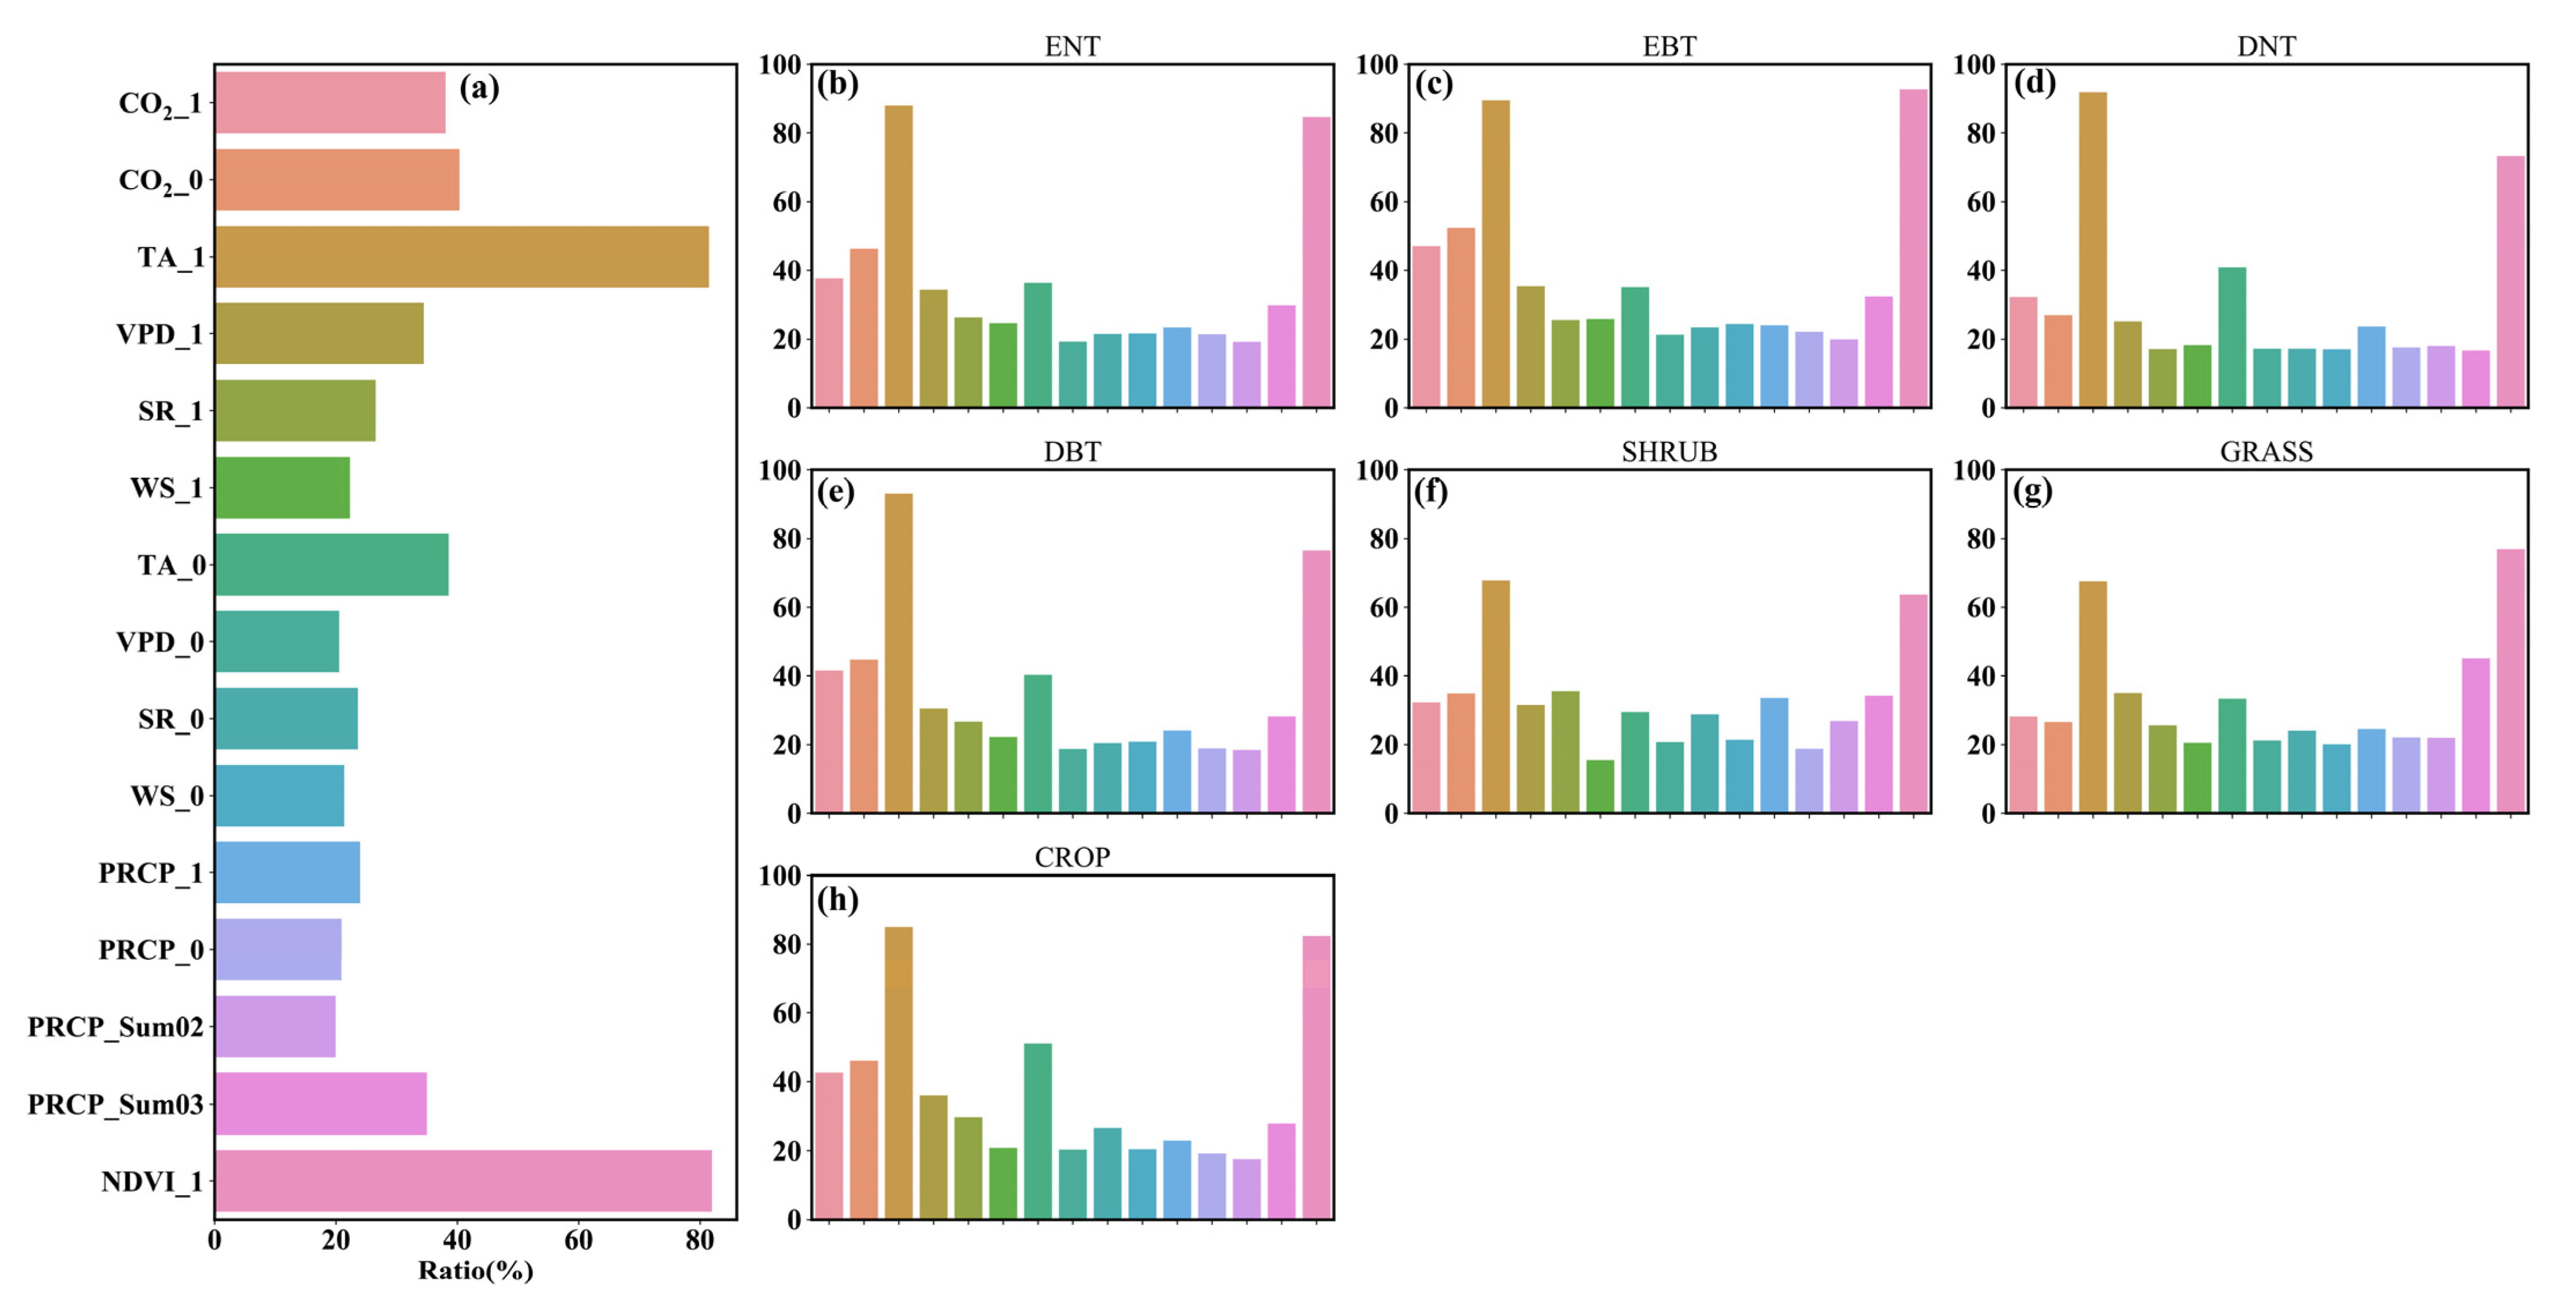
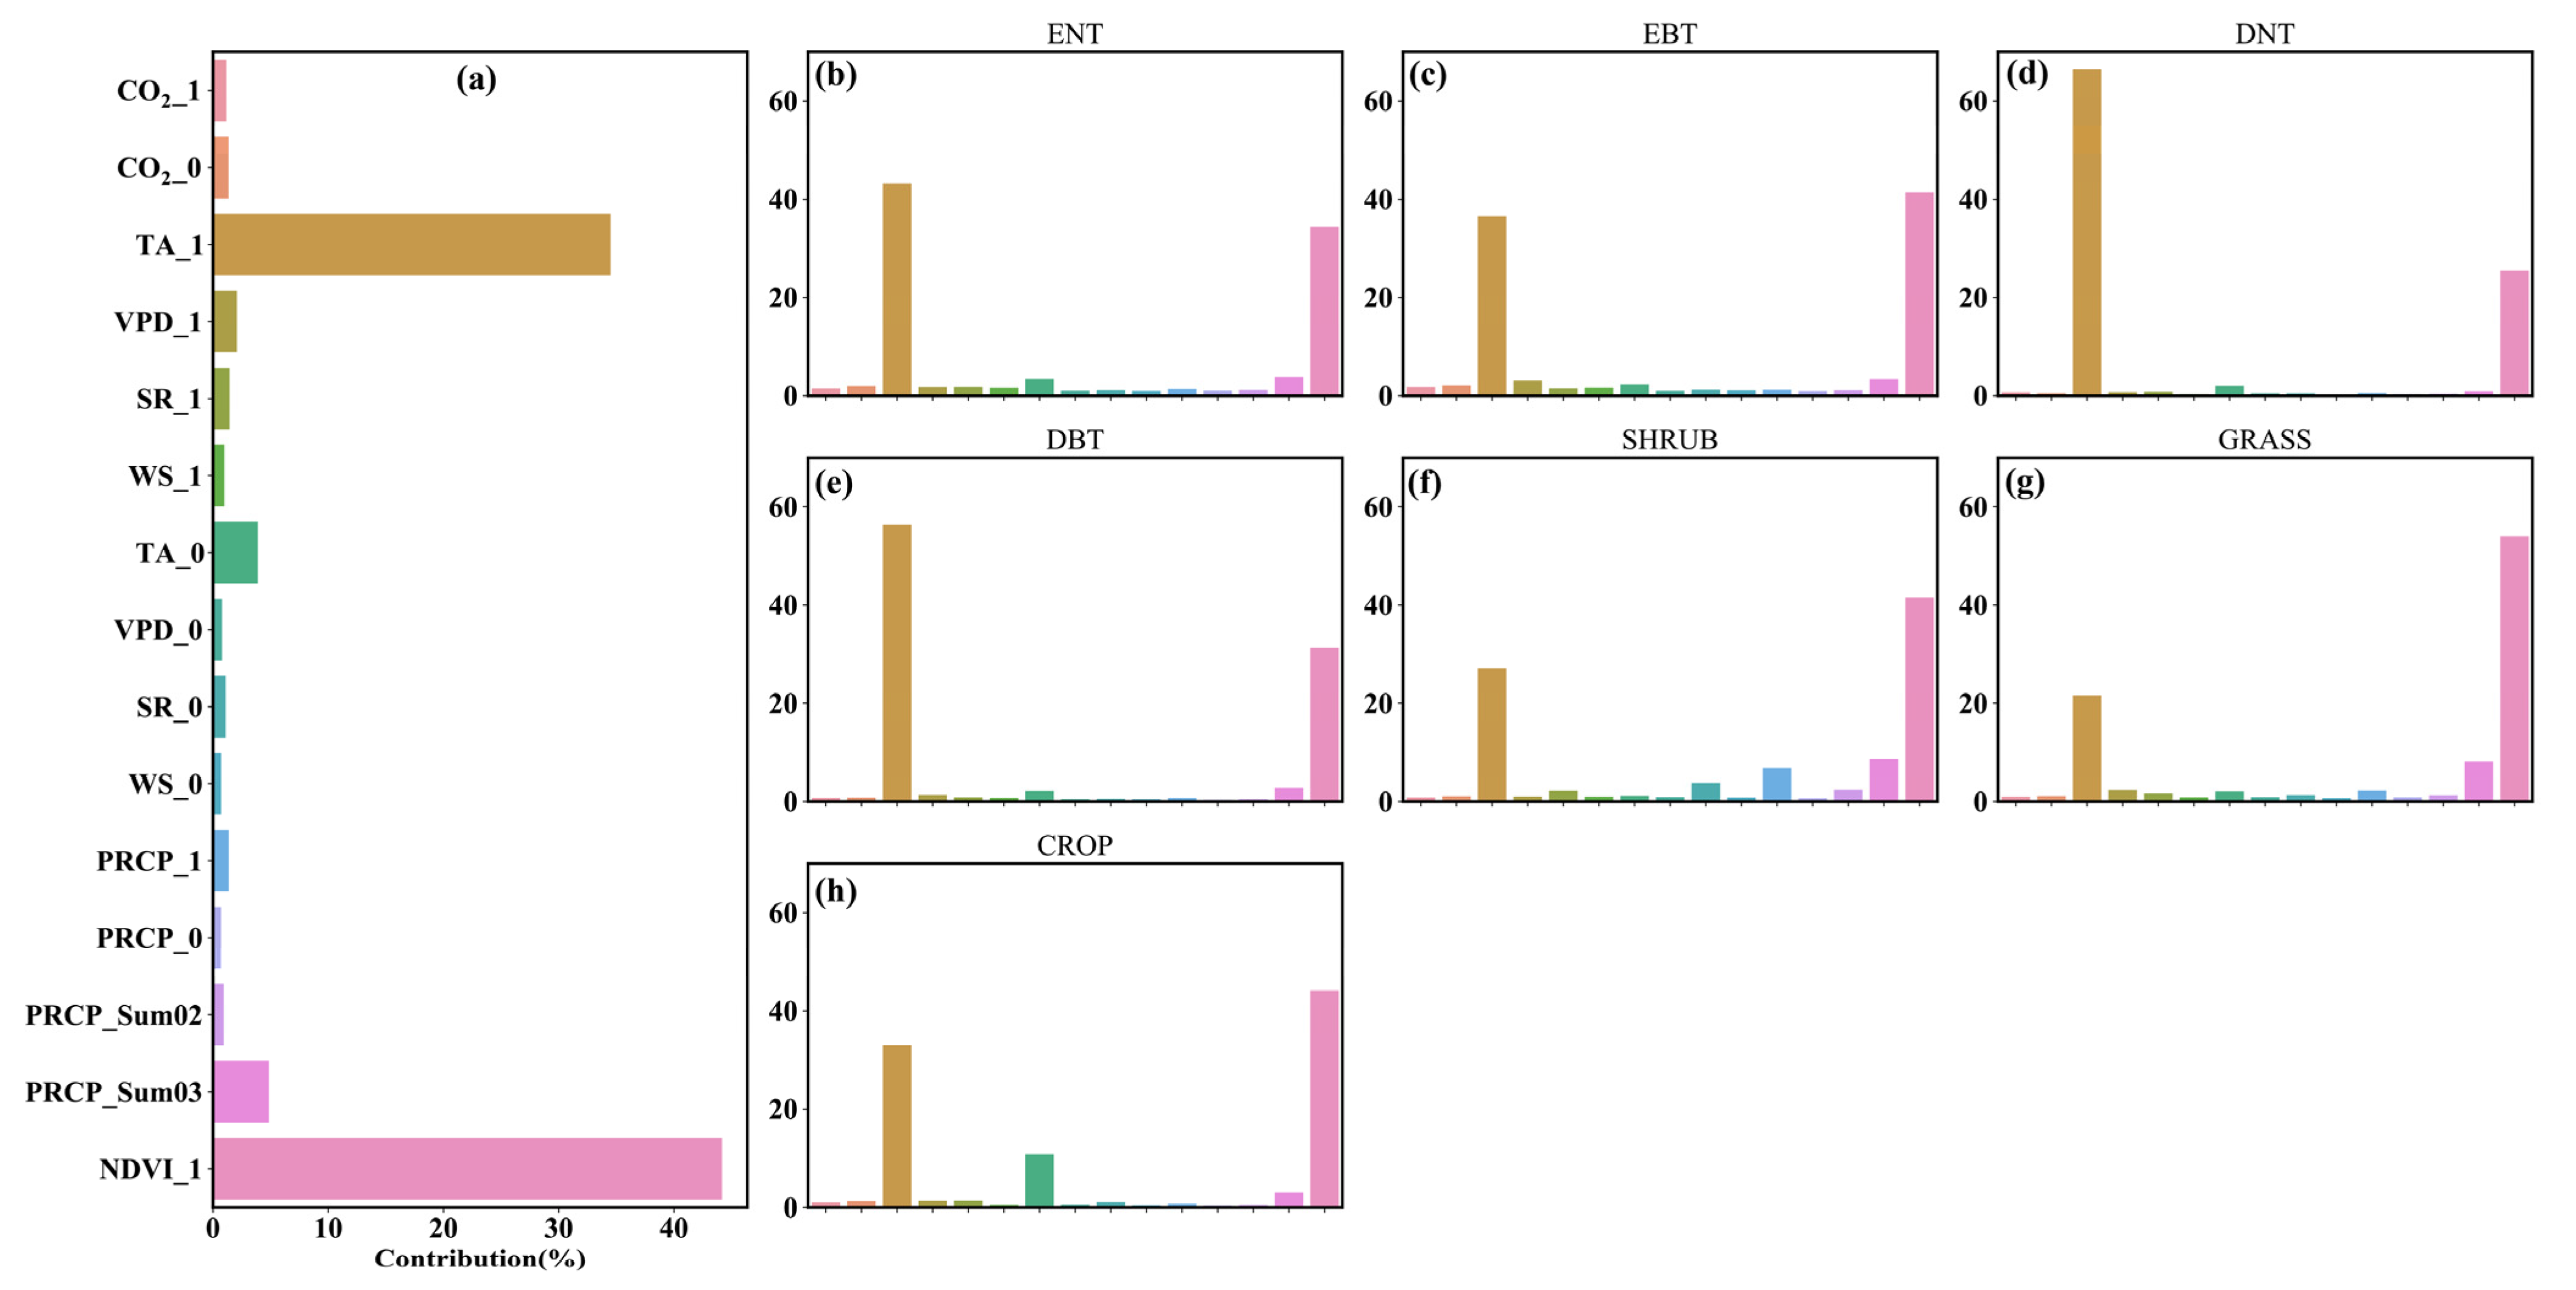
Our model optimally selected different explanatory variables to predict the NDVI at each pixel. For 81.6% of pixels, the NDVI of the previous month (NDVI_1) was selected as one of the explanatory variables. Similarly, the temperature of the previous month (TA_1) was selected as an explanatory variable for 80.5% of pixels, highlighting the importance of temperature for predicting NDVI (Figure 5a). The temperature and CO2 concentration of the current month (TA_0 and CO2_0, respectively), the CO2 concentration of the previous month (CO2_1), and the accumulated precipitation for the previous three months (PRCP_Sum03) were also important explanatory variables for predicting NDVI (Figure 5a). Notably, PRCP_Sum03 was selected as an important explanatory variable in the grassland zones by more than 40% of pixels, which was markedly higher than in the other six vegetation zones (Figure 5g).
The importance of explanatory variables for predicting the NDVI was further analyzed. Generally, the NDVI of the previous month (NDVI_1) showed the largest contribution (approximately 44%) to predicting the NDVI over the entire study area (Figure 6a). The second-largest contribution was from TA_1 (approximately 31%). Furthermore, the contributions of CO2 (CO2_0 and CO2_1) and rainfall (PRCP_0, PRCP_1, PRCP_Sum02, and PRCP_Sum03) factors were approximately 3 and 11%, respectively. Notably, temperature variables (especially TA_1) showed large contributions for predicting the NDVI in forest zones (Figure 6b–e). In particular, TA_1 demonstrated a larger contribution compared to NDVI_1 in the ENT, DNT, and DBT zones. Precipitation was important for predicting the NDVI over arid regions (Figure 6f,g). While CO2_0 and CO2_1 were selected as explanatory variables for predicting the NDVI, their contributions were quite low, ranging from 0.5% to 2.1% over all vegetation zones (Figure 6c,d).

4. Discussion

Climate change and extreme weather events have been found to substantially impact crop yield [5]. Consequently, predicting vegetation growth over the short- and long-term is an urgent requirement [29]. However, the current ecosystem and crop-growth models have failed to predict crop growth, limiting our capacity for monitoring crop yield and evaluating food security [30]. This study evaluated and revealed the strong performance of a machine learning model with respect to reproducing spatial and seasonal variations in the satellite-derived NDVI throughout China. In particular, the model can predict vegetation growth throughout the growing season using satellite-derived NDVI for the first month only, indicating the excellent capabilities of the machine learning method in predicting vegetation growth.
Analysis of the explanatory variables contributing to the predictive model at each pixel further highlights the reliability of the machine learning model for predicting NDVI. For example, temperature and precipitation were revealed to be important contributors to the NDVI in forest and grassland zones, respectively (Figure 6), in accordance with environmental regulators on vegetation growth in the terrestrial ecosystem [3,4]. Generally, the limiting environmental variable for ecosystems in cold (arid) climate zones is the temperature (precipitation) [31].
This study used the ERA5 dataset to drive the machine learning model for predicting vegetation growth. Model validation showed strong performance with respect to reproducing the NDVI throughout the growing season, using a satellite-derived NDVI for the first month of the growing season in conjunction with meteorological data (Figure 2, Figure 3 and Figure 4). However, we note that the machine learning model developed in this study will be more beneficial for the real-time prediction of vegetation growth if driven by a climate forecast dataset. There are several global climate forecast datasets currently available which provide long-range forecasts for multiple land surface climate variables, including temperature, precipitation, and relative humidity [32]. Future studies will evaluate the performance of the machine learning model driven by a climate forecast dataset for predicting vegetation growth.

5. Conclusions

This study developed a machine learning model using the XGBoost method to predict monthly NDVI, as an indicator of vegetation growth. Validation showed that the model could reproduce the spatial and seasonal variations of satellite-derived NDVI over the entire vegetated region of China. The overall bias between the predicted and observed annual average NDVI values was less than 5%, and the mean RMSE was 0.05, which was less than 0.1% for 98.4% of pixels, highlighting the excellent performance of the model. The machine learning model could explain up to 83% of the corresponding seasonal variation in the NDVI for all pixels. A contribution analysis of the explanatory variables revealed that the NDVI and temperature of the previous month were the most important explanatory variables for predicting the subsequent NDVI.

Author Contributions

Conceptualization, X.L. and W.Y.; formal analysis, X.L.; funding acquisition, W.Y. and W.D.; methodology, X.L.; project administration, W.Y.; software, X.L.; visualization, X.L.; writing—original draft, X.L.; writing—review and editing, W.Y. and W.D. All authors have read and agreed to the published version of the manuscript.

Funding

This research was funded by the National Basic Research Program of China (2016YFA0602703), National Natural Science Foundation of China (31870459), and Key Project of Sun Yat-sen University (19lgjc02).

Data Availability Statement

All datasets presented in this study are available upon request from the corresponding author.

Conflicts of Interest

The authors declare no conflict of interest.

References

  1. Zhao, M.; Running, S.W. Drought-induced reduction in global terrestrial net primary production from 2000 through 2009. Science 2010, 329, 940–943. [Google Scholar] [CrossRef] [Green Version]
  2. Vicente-Serrano, S.M.; Nieto, R.; Gimeno, L.; Azorin-Molina, C.; Drumond, A.; El Kenawy, A.; Dominguez-Castro, F.; Tomas-Burguera, M.; Peña-Gallardo, M. Recent changes in relative humidity: Regional connections with land and ocean processes. Earth Syst. Dyn. 2018, 9, 915–937. [Google Scholar] [CrossRef] [Green Version]
  3. Chapin, F.S.; Matson, P.A.; Vitousek, P.M. Principles of Terrestrial Ecosystem Ecology; Springer Science & Business Media: Berlin/Heidelberg, Germany, 2012. [Google Scholar] [CrossRef]
  4. Bonan, G. Climate Change and Terrestrial Ecosystem Modeling; Cambridge University Press: Cambridge, UK, 2019. [Google Scholar] [CrossRef] [Green Version]
  5. Yuan, W.; Piao, S.; Qin, D.; Dong, W.; Xia, J.; Lin, H.; Chen, M. Influence of Vegetation Growth on the Enhanced Seasonality of Atmospheric CO2. Glob. Biogeochem. Cycles 2018, 32, 32–41. [Google Scholar] [CrossRef]
  6. Ray, D.K.; Ramankutty, N.; Mueller, N.D.; West, P.C.; Foley, J.A. Recent patterns of crop yield growth and stagnation. Nat. Commun. 2012, 3. [Google Scholar] [CrossRef] [PubMed] [Green Version]
  7. Liu, Y.Y.; Van Dijk, A.I.J.M.; De Jeu, R.A.M.; Canadell, J.G.; McCabe, M.F.; Evans, J.P.; Wang, G. Recent reversal in loss of global terrestrial biomass. Nat. Clim. Chang. 2015, 5, 470–474. [Google Scholar] [CrossRef]
  8. Yuan, W.; Zheng, Y.; Piao, S.; Ciais, P.; Lombardozzi, D.; Wang, Y.; Ryu, Y.; Chen, G.; Dong, W.; Hu, Z.; et al. Increased atmospheric vapor pressure deficit reduces global vegetation growth. Sci. Adv. 2019, 5. [Google Scholar] [CrossRef] [PubMed] [Green Version]
  9. Becker-Reshef, I.; Vermote, E.; Lindeman, M.; Justice, C. A generalized regression-based model for forecasting winter wheat yields in Kansas and Ukraine using MODIS data. Remote Sens. Environ. 2010, 114, 1312–1323. [Google Scholar] [CrossRef]
  10. Friedlingstein, P.; O’Sullivan, M.; Jones, M.; Andrew, R.; Hauck, J.; Olsen, A.; Peters, G.; Peters, W.; Pongratz, J.; Sitch, S.; et al. Global Carbon Budget 2020. Earth Syst. Sci. Data 2020, 3269–3340. [Google Scholar] [CrossRef]
  11. Xia, J.; Yuan, W.; Lienert, S.; Joos, F.; Ciais, P.; Viovy, N.; Wang, Y.P.; Wang, X.; Zhang, H.; Chen, Y.; et al. Global Patterns in Net Primary Production Allocation Regulated by Environmental Conditions and Forest Stand Age: A Model-Data Comparison. J. Geophys. Res. Biogeosciences 2019, 124, 2039–2059. [Google Scholar] [CrossRef] [Green Version]
  12. Li, S.; Yuan, W.; Ciais, P.; Viovy, N.; Ito, A.; Jia, B.; Zhu, D. Benchmark estimates for aboveground litterfall data derived from ecosystem models. Environ. Res. Lett. 2019, 14. [Google Scholar] [CrossRef]
  13. Anav, A.; Friedlingstein, P.; Beer, C.; Ciais, P.; Harper, A.; Jones, C.; Murray-Tortarolo, G.; Papale, D.; Parazoo, N.C.; Peylin, P.; et al. Spatiotemporal patterns of terrestrial gross primary production: A review. Rev. Geophys. 2015, 53, 785–818. [Google Scholar] [CrossRef] [Green Version]
  14. Jung, N.C.; Popescu, I.; Kelderman, P.; Solomatine, D.P.; Price, R.K. Application of model trees and other machine learning techniques for algal growth prediction in yongdam reservoir, Republic of Korea. J. Hydroinform. 2010, 12, 262–274. [Google Scholar] [CrossRef] [Green Version]
  15. Xia, J.; Ma, M.; Liang, T.; Wu, C.; Yang, Y.; Zhang, L.; Zhang, Y.; Yuan, W. Estimates of grassland biomass and turnover time on the Tibetan Plateau. Environ. Res. Lett. 2018, 13. [Google Scholar] [CrossRef]
  16. Chen, T.; Guestrin, C. XGBoost: A scalable tree boosting system. In Proceedings of the ACM SIGKDD International Conference on Knowledge Discovery and Data Mining, Association for Computing Machinery, New York, NY, USA, 13–17 August 2016; pp. 785–794. [Google Scholar]
  17. Zhang, H.; Eziz, A.; Xiao, J.; Tao, S.; Wang, S.; Tang, Z.; Zhu, J.; Fang, J. High-resolution vegetation mapping using eXtreme gradient boosting based on extensive features. Remote Sens. 2019, 11, 1505. [Google Scholar] [CrossRef] [Green Version]
  18. Li, Y.; Li, M.; Li, C.; Liu, Z. Forest aboveground biomass estimation using Landsat 8 and Sentinel-1A data with machine learning algorithms. Sci. Rep. 2020, 10, 1–12. [Google Scholar] [CrossRef]
  19. Fang, J.; Piao, S.; Tang, Z.; Peng, C.; Ji, W. Interannual variability in net primary production and precipitation. Science 2001, 293, 1723. [Google Scholar] [CrossRef] [Green Version]
  20. Wu, X.C.; Liu, H.Y. Consistent shifts in spring vegetation green-up date across temperate biomes in China, 1982–2006. Glob. Chang. Biol. 2013, 19, 870–880. [Google Scholar] [CrossRef]
  21. Zhou, L.; Tucker, C.J.; Kaufmann, R.K.; Slayback, D.; Shabanov, N.V.; Myneni, R.B. Variations in northern vegetation activity inferred from satellite data of vegetation index during 1982–1999. J. Geophys. Res. 2001, 106, 20069–20083. [Google Scholar] [CrossRef]
  22. Allen, R.G.; Pereira, L.S.; Raes, D.; Smith, M. Crop evapotranspiration-Guidelines for computing crop water requirements-FAO Irrigation and drainage paper 56. Fao Rome 1998, 300, D05109. [Google Scholar]
  23. Vicente-Serrano, S.M.; Beguería, S.; López-Moreno, J.I. A multiscalar drought index sensitive to global warming: The standardized precipitation evapotranspiration index. J. Clim. 2010, 23, 1696–1718. [Google Scholar] [CrossRef] [Green Version]
  24. Ault, T.R. Erratum: On the essentials of drought in a changing climate. Science 2020, 368, 256–260. [Google Scholar] [CrossRef] [PubMed]
  25. Babst, F.; Bouriaud, O.; Poulter, B.; Trouet, V.; Girardin, M.P.; Frank, D.C. Twentieth century redistribution in climatic drivers of global tree growth. Sci. Adv. 2019, 5, 1–10. [Google Scholar] [CrossRef] [Green Version]
  26. Zhu, X.; Zhang, S.; Liu, T.; Liu, Y. Impacts of Heat and Drought on Gross Primary Productivity in China. Remote Sens. 2021, 13, 378. [Google Scholar] [CrossRef]
  27. Ishwaran, H. Variable importance in binary regression trees and forests. Electron. J. Stat. 2007, 1, 519–537. [Google Scholar] [CrossRef]
  28. Grömping, U. Variable importance assessment in regression: Linear regression versus random forest. Am. Stat. 2009, 63, 308–319. [Google Scholar] [CrossRef]
  29. Weiss, M.; Jacob, F.; Duveiller, G. Remote sensing for agricultural applications: A meta-review. Remote Sens. Environ. 2020, 236. [Google Scholar] [CrossRef]
  30. Buermann, W.; Forkel, M.; O’Sullivan, M.; Sitch, S.; Friedlingstein, P.; Haverd, V.; Jain, A.K.; Kato, E.; Kautz, M.; Lienert, S.; et al. Widespread seasonal compensation effects of spring warming on northern plant productivity. Nature 2018, 562, 110–114. [Google Scholar] [CrossRef] [Green Version]
  31. Cai, W.; Yuan, W.; Liang, S.; Liu, S.; Dong, W.; Chen, Y.; Liu, D.; Zhang, H. Large differences in terrestrial vegetation production derived from satellite-based light use efficiency models. Remote Sens. 2014, 6, 8945–8965. [Google Scholar] [CrossRef] [Green Version]
  32. Saha, S.; Moorthi, S.; Wu, X.; Wang, J.; Nadiga, S.; Tripp, P.; Behringer, D.; Hou, Y.T.; Chuang, H.Y.; Iredell, M.; et al. The NCEP climate forecast system version 2. J. Clim. 2014, 27, 2185–2208. [Google Scholar] [CrossRef]
Figure 1. The spatial distribution of vegetation growing season duration (a) and the corresponding vegetation distribution (b) in China. The colors in (a) show the duration of the growing season in months, and the colors in (b) show the vegetation types based on the Plant Functional Types classification, including evergreen needle-leaf trees (ENT), evergreen broadleaf trees (EBT), deciduous needle-leaf trees (DNT), deciduous broadleaf trees (DBT), shrubland, and grassland. The pixels with an annual mean normalized difference vegetation index (NDVI) over 18 years lower than 0.1 are in black.
Remotesensing 13 01147 g001
Figure 2. Spatial distribution of the simulated annual mean normalized difference vegetation index (NDVI; (a)), relative predictive error (bias; (b)), and root-mean-square error (RMSE; (c)).
Remotesensing 13 01147 g002
Figure 3. Comparisons between the predicted and satellite-derived NDVI showing the (a) interannual variability over the entire study area, (b) coefficient of determination (R2), and (c) the relationship between predicted and satellite-derived NDVI.
Remotesensing 13 01147 g003
Figure 4. Model performance during the drought year 2009 showing (a) the temporal evolution of drought in China from 1980 to 2018 based on the standardized precipitation evapotranspiration index (SPEI; negative values indicate drought conditions) and the spatial distribution of (b) SPEI, (c) R2, (d) bias, and (e) RMSE between the predicted and satellite-derived monthly NDVI in 2009.
Remotesensing 13 01147 g004
Figure 5. Relative importance of the selected explanatory variables for predicting the NDVI for (a) the entire study area and (bh) the individual vegetation zones.
Remotesensing 13 01147 g005
Figure 6. Contributions of the selected explanatory variables for predicting the NDVI for (a) the entire study area and (bh) the individual vegetation zones.
Remotesensing 13 01147 g006
Publisher’s Note: MDPI stays neutral with regard to jurisdictional claims in published maps and institutional affiliations.