Article

A New Method for Extracting Individual Plant Bio-Characteristics from High-Resolution Digital Images

1
School of Applied Systems Biology, La Trobe University, Bundoora 3083, Australia
2
Agriculture Victoria, AgriBio, Centre for AgriBioscience, Bundoora 3083, Australia
3
Agriculture Victoria, Victoria, Grain Innovation Park, Horsham 3400, Australia
4
Agriculture Victoria, Hamilton Centre, Hamilton 3300, Australia
5
Department of Computer Science and Information Technology, La Trobe University, Bundoora 3083, Australia
*
Author to whom correspondence should be addressed.
Remote Sens. 2021, 13(6), 1212; https://doi.org/10.3390/rs13061212
Submission received: 20 January 2021 / Revised: 18 March 2021 / Accepted: 19 March 2021 / Published: 23 March 2021

Abstract

:
The extraction of automated plant phenomics from digital images has advanced in recent years. However, the accuracy of extracted phenomics, especially for individual plants in a field environment, requires improvement. In this paper, a new and efficient method of extracting individual plant areas and their mean normalized difference vegetation index from high-resolution digital images is proposed. The algorithm was applied on perennial ryegrass row field data multispectral images taken from the top view. First, the center points of individual plants from digital images were located to exclude plant positions without plants. Second, the accurate area of each plant was extracted using its center point and radius. Third, the accurate mean normalized difference vegetation index of each plant was extracted and adjusted for overlapping plants. The correlation between the extracted individual plant phenomics and fresh weight ranged between 0.63 and 0.75 across four time points. The methods proposed are applicable to other crops where individual plant phenotypes are of interest.

Graphical Abstract

1. Introduction

Due to the exponentially increasing consumption of food, fuel, and feed by the burgeoning population of the world, global agricultural demand is growing. Global cereal grain production must increase by 70% by 2050 to meet food demands [1,2]. Forages are also an important feed source for animals that produce dairy, meat, and fiber products, and they play a crucial role in maintaining a good natural environment. In parallel, growing climate unpredictability is shifting crop production onto marginal lands, leading to the intensification of existing agricultural practices, and displacement of natural ecosystems [3]. Conventional methods for plant breeding, such as phenotypic and pedigree selection, have significantly increased crop yields worldwide [4]. Nevertheless, these methods alone will not be enough to meet the projected global food demands [5,6]. Moreover, these traditional methods are costly, require intensive labor resources, have a lower throughput and are time consuming. Genomic breeding approaches (e.g., genomic selection) will assist in increasing crop and pasture production [7,8] and a wealth of plant genomic knowledge has been accumulated over the last decade [9,10,11,12]. However, genomic selection requires large training sets of lines that are well characterized with both genomics and phenotypes. Traditional phenotyping methods are often too laborious and costly for large plant collections, leading to a significant gap between genomic knowledge and its connection to phenotypes. These problems can be rectified to some extent by the accurate and precise phenotyping of germplasm with novel technologies.
The phenotyping of organisms [13,14,15,16] can be defined as a set of protocols or methodologies applied to measure physical characteristics, such as architecture, growth and composition, with a certain accuracy and precision. For plants, phenotyping is based on morphological, physiological, biochemical, and molecular structures. Current phenotyping methods in plants are considered slow, expensive, are sometimes destructive and can cause variations between observations due to human operator variability. This has led to a growth in automated phenotyping technologies, which overcome these shortcomings. One such automated method relies on digital imaging, containing two main steps: image acquisition and image analysis. Image acquisition is a process where a digital representation (image) of the crop field is obtained using an imaging sensor. Image acquisition can generally be classified into seven groups with respect to plant phenotyping [16]: mono-red green blue (RGB) vision, multi and hyperspectral cameras, stereo vision, Light Detection and Ranging (LiDAR) technology, fluorescence imaging, tomography imaging and thermography, in addition to time of flight cameras. Image analysis, on the other hand, deals with the extraction of useful information—in regard to plants—from digital images, involving pre-processing, segmentation, and feature extraction [17]. The pre-processing step can include operations such as image cropping, image rotation, contrast improvement, color mapping, image smoothing, and edge detection [18]. The application of these methods for phenotyping depends upon the output requirements and several other factors. The main goal of image segmentation is to differentiate between the irrelevant or background objects and objects (segments) of interest by using color, texture and statistical measures. For example, Otsu binary thresholding [19] is a segmentation algorithm that is used to automatically perform clustering-based image segmentation, returning a value of threshold. The threshold can then be used to discriminate between the background and foreground of a digital image using methods such as watershed transformation [20]. Feature extraction is also an important factor in automated phenotyping using digital images. The measurements extracted from the image segments, such as area and normalized difference vegetation index (NDVI), are placed into feature vectors which summarize the physical characteristics of each identified plant or plant region. The digital information extracted from the images in the form of NDVI, surface area, width, height, and circular shape, can be linked to the degree of greenness, fresh weight, and biomass of the plant. Phenomic bio-characteristics, such as NDVI or plant area, can be correlated or used to predict plant biomass yield, which is the main production phenotype in forage species and is a characteristic that contributes to grain yield in other crops [21,22]. Bio-characteristics, if sufficiently correlated, can then be used as proxy phenotypes for biomass in genomic selection to select the best populations and generate genetic gain over generations. Furthermore, as image derived bio-characteristics are non-destructive, they can be collected at multiple time-points during the growth cycle of crops, giving rise to novel phenotypes for genomic selection and breeding purposes (e.g., change in biomass over time, growth, or senescence rate).
Most plant breeding applications focus on plot or row phenotypes consisting of multiple plants, which is often sufficient. However, individual plant phenotypes are of interest for investigating family or population uniformity in both in- and outbred species. Uniformity is important because growers desire high forage biomass with even growth throughout a paddock, while additionally, it is also a characteristic for determining plant breeder’s rights. Furthermore, in outbred species, it may be of interest to understand the effect of individual plants on other plants in close proximity—so called, competition effects [23]—as each plant is genetically unique. If plants in a forage cultivar are overly competitive, the overall biomass yield and uniformity is expected be suboptimal in the paddock. The manual collection of individual plant characteristics is especially laborious and automated phenomic solutions are required.
We propose a new method for extracting the area of individual plants from digital field trial images. The method focuses on both the extraction of these regions from a multispectral image taken by an uncrewed aerial vehicle (UAV) and the linking of these regions with the biomass of individual plants. The utility of the approach is evaluated by correlating individual plant phenomic bio-characteristics and plant biomass, as estimated by fresh weight at harvest. The study is organized as follows: Section 2 provides the work problem statements, Section 3 describes the proposed algorithm in detail, Section 4 explains the experimental results and presents a comparative analysis on perennial ryegrass field data, and Section 5 outlines the conclusions.

2. Problem Statements

The proposed algorithm was applied to perennial ryegrass row field data for which images were taken from the top view. The field trial contained 50 perennial ryegrass cultivars, grown in replicated rows of 32 plants per row. Perennial ryegrass is a diploid outbred species, where each individual plant is genetically unique and each cultivar has at least four parental cultivars, making them genetically diverse. Each replication was considered as a plot and contained three rows of 32 spaced plants each (i.e., 96 plants/plot). The experimental unit was, therefore, a plot of 8 × 1.8 m. The expected spacing between plants was 25 cm and 60 cm between rows. The field trial contained a total of 48,000 individual plants in 10 blocks. The total area of the field experiment was 8100 m2. In part, the aims of these field trials were to develop phenomics processing pipelines to define novel traits for the estimation and prediction of plant performance (e.g., biomass yield, flowering time). Images were taken with a Parrot Sequoia (Parrot Drones S.A.S., Paris, France) multispectral camera, deployed on a 3DR Solo quadcopter. The camera captures images simultaneously at four bands, including green (530–570 nm), red (640–680 nm), red edge (730–740 nm), and near-infrared (770–810 nm). It also has a GPS and sensor and incident light sensors. The flight mission was planned by Tower Beta software. Aerial images were collected using the UAV on a weekly basis over the GS trial site, and data from four flight dates in 2017 were used for this analysis. Imaging dates were synchronized with each harvest. Flight operations were conducted under bright, sunny weather conditions to minimize noise from environmental variation. The UAV flight altitude was set at 20 m above ground level and the flight speed was 6 m/s, with 75% side and forward overlap of images. At this flight altitude and speed, the spatial resolution of the images was 2 cm/pixel. The same flight path was followed on each date. Image reflectance was corrected using Airinov calibration plates with known reflectance values (MicaSense Inc., Seattle, WA, USA). An example color image of the field trial is shown in Figure 1a and a grey scale image of the field trial area is shown in Figure 1b. The white pixels (NDVI TIFF image) in Figure 1b mostly represent greenness in the trial image and black pixels represent the background. In Figure 1b, there are 10 blocks, and in each block, there are 150 plant rows equaling a total of 1500 crop rows. Furthermore, in each plant row, there are 32 plants, resulting in 48,000 plants in each field-trial image.
The goal was to automatically extract phenomic traits, such as area and the NDVI value of each plant, from each field trial’s TIFF file image. In principle, other vegetation indexes such as the green normalized difference vegetation index, red edge normalized difference vegetation index, soil adjusted vegetation index and the enhanced vegetation index could also be used. The extraction of these traits utilizes the experimental field trial design, specifying the layout of plant-rows and the plants within each row to help define the boundary or bounding boxes for plant rows and initial estimates of the individual plant regions. The row polygons of row plants were identified using projection methods, as outlined in [22], followed by the identification of center-points of individual plants. These center-points then assisted in identifying the individual plant polygons. Figure 2a shows the layout of bounding boxes for several row polygons and Figure 2b shows the bounding boxes for individual plant polygons. These bounding boxes assist in extracting phenomics traits of interest. For instance, the bounding box region can be cropped, and the area can be calculated by multiplying the number of non-zero pixels with the area of one pixel in cm2. Furthermore, the mean NDVI value is calculated by taking the mean of NDVI values of all non-zero pixels within that region.
In images where there is moderate amount of plant growth (Figure 2), the extraction of phenomics is relatively simple. The plants are almost entirely confined in their individual bounding boxes, referred to as plant boxes, and therefore, the area and mean NDVI value can be calculated easily. However, there are bounding boxes where plants have not grown at all, but due to encroachment of adjacent plants, their bounding boxes contain some image pixels that show NDVI signals, as shown in Figure 3.
These NDVI values can be mistaken for a plant in the box which has either died or not grown at all, when it was in fact the neighboring plant. Additionally, the plants can overgrow and overlap into adjacent plants (Figure 4a). In such cases, calculating the area by counting the number of non-zero pixels in that bounding box (Figure 4b) will not be accurate. Therefore, a potentially more accurate area is hypothesized in Figure 4c of the same plant, by highlighting a circular plant region. In summary, these problems are the main objectives of our work, aimed at identifying the accurate area of individual plants, and includes the following sub-objectives:
  • to identify bounding boxes with no plants;
  • to calculate accurate individual plant areas, despite overlapping adjacent plants;
  • to calculate accurate individual plant NDVI values, despite overlapping adjacent plants;
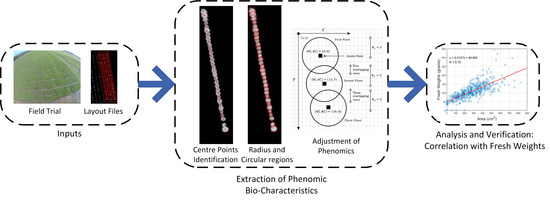
3. Methods

The use of machine vision in phenotyping started almost three decades ago, for the extraction of NDVI values [24]. Since then, there has been huge progress in monitoring large fields using sensor technologies. However, the applications involve simple digital data, which are usually extracted in controlled environments. In the previous proposals [25,26,27,28,29,30,31], the examined plants were captured in very controlled and simplistic environments; either there was only one plant per digital image, or the plants did not overlap.
To detect circles in images, Circular Hough Transform (CHT) [32] and its variants [33] have become common methods in numerous image processing applications. CHT is very effective in detecting circles in digital images, even with somewhat irregular circular shapes. However, it performs poorly when circles are merged and overlap with each other, just as in the case of our research problem.
These existing studies do not provide solutions that are relevant to our mentioned problems; therefore, we have developed a new and effective image-based phenotyping method. The proposed algorithm was developed and implemented on a field trial image dataset, in which images were taken from the top view. A sample of a single crop row image from the field trial, taken at four time points, is shown in Figure 5a–d. We employed MATLAB version R2019a for the simulations and analyses of our work. In the next subsections, the proposed algorithm is explained, and images are shown to aid the reader’s understanding.

3.1. Background Correction

Let I be the two-dimensional matrix for a single plant box image with size r ,   c , where r is the total number of image rows and c is the total number of image columns. It should be noted that the plants are at a specific angle, but we did not rotate them for the analysis. As the plant’s geometry is somewhat circular, the rotation will not affect the extraction of the center point and radius, as explained below. I is considered for one individual plant and there are 32 such plants in one crop row, as shown in Figure 5a. Moreover, let I ( i , j ) represent the NDVI value of the image pixel at the i t h row and j t h column of I , and I ( i , j ) [ 1 ,   1 ] . The first step was to remove any background values, which did not contain plant pixels. To remove the unnecessary background, Otsu binary thresholding [19] was employed to automatically perform clustering-based image thresholding, returning a threshold value of t h O t s u . The background corrected image of a single plant, I b is obtained using the following:
I b ( i , j ) =   { I ( i , j )               i f       I ( i , j ) > t h O t s u , 0                                 o t h e r w i s e .
The Otsu image thresholding for background correction was applied in Figure 5a–d and the results are shown in Figure 6a–d.

3.2. Center Point Calculation

Whether a rectangular plant bounding box contained a plant or not was determined by identifying the center point of the plant. If there was a center point in a bounding box, then it was determined as containing a plant and vice-versa. As mentioned in the problem statement, bounding boxes were defined based on row layouts and the expected plant number and spacing per row, following [22]. The distribution of greenness or NDVI values in an individual plant, assists in finding the plant centers (Figure 7). The greenness is likely to be at a maximum in the center of plant and gradually decreases towards the plant’s edges. Therefore, the center point should correspond to, or near, a location of an image pixel with the maximum NDVI value. However, there can be more than one pixel whose values correspond to the maximum NDVI and they can be in different places. Another solution could consider the middle point of the bounding box as the plant centers. However, this assumption is not always justified, as plant locations could deviate from bounding box centers. Our approach combines these two methods. This allows for the correction of NDVI maxima that are at bounding box edges but have false values due to encroaching neighboring plants. The centered positions of a plant image are determined as follows:
{ ( i ,   j )   |   I b ( i , j )     0.6 I m a x ;   i   ϵ   [ 0.2 r ,   0.8 r ] ;   j   ϵ   [ 1 ,   c ] }
where I m a x is the maximum value of I b . Without loss of generality, the above equation specifies a set of image positions within a given plant-box, as shown in Figure 4b, with its origin specified at (1,1) and with r rows and c columns that have intensity values that satisfy I b ( i , j )     0.6 I m a x . The optimization value of 0.6 is based on trial and error and was chosen based on visual inspection. Increasing the value beyond 0.6 will result in more centered image pixels and vice-versa. We recommend investigating this threshold when applying the algorithm to new datasets. This set will be empty if there is no center point, otherwise the average i , Θ r and average j , Θ c , location ( Θ r ,   Θ c ) is used to define a plant’s center point within its corresponding plant-box. The goal is to locate a center point of the plant which cannot be at the top or bottom of the image. Therefore, the search row domain in each plant-box is constrained to not include the top and bottom 20% of the rows. In our study, plants were generally planted at equal distances, justifying this assumption. In field data where this is not the case, further development of the algorithm may be needed. This process was then applied to all plant-boxes within each field image.
The results of this step, applied to the images shown in Figure 6a–d, are shown in Figure 8a–d. The center points are represented by a red plus symbol. The algorithm correctly identified the number of plants in a crop row. For instance, Figure 8a has only 31 plants with center points labelled and Figure 8b only has 30 plants. The identification of center points indicates that the first research problem has been solved, that is, the bounding boxes with no plants have been identified.

3.3. Extraction of Plant Areas

The next goal is to extract the individual plant areas. The distribution of plant pixels is somewhat circular and symmetrical (Figure 7). To define the circular plant region associated with each plant-box containing a plant requires only a center point and a corresponding radius. The center points were calculated in the previous step and the radius was calculated by measuring the distance in terms of number of non-zero image pixels from the center point to the horizontal extreme. Figure 9 shows the same plant illustrated in Figure 7, with labelling of the center point, center row and horizontal distances from the center point to the horizontal extremes. These horizontal distances give the possible radius of the plant. The vertical distances are not taken into consideration, as the adjacent plants may overlap at the vertical (at both top and bottom; except the 1st and 32nd plant of the row) positions. For each center pixel defined above ( Θ r ,   Θ c ) , let its corresponding radius be defined by:
r a d i u s = max { abs ( Θ c j ) |   I b ( Θ r ,   j )   0.6 I m a x }
Using the radii and center points, the circular plant regions of each plant were extracted (Figure 10a–d). The extraction of radii and the circular plant regions resulted in the second research problem being solved, that is, the accurate area of the individual plants has been calculated, despite the overlapping of adjacent plants. Furthermore, the area is calculated by taking the product of the number of non-zero pixels with the area of one pixel in cm2 within that region.

3.4. Extraction of NDVI Values

As mentioned earlier, due to the overlapping of the adjacent plants, the NDVI values can be inflated at the top and bottom positions, as depicted in Figure 10c,d. Therefore, the overlapping pixels rows at top and bottom positions must be identified and adjusted.

3.4.1. Finding the Overlapping Pixel Rows

Considering a single crop row (32 plants), the overlapping pixels rows for each plant can be extracted using the center points and radii calculated earlier. Let P x ,   x   ϵ   [ 1 , 2 , ,   32 ] be a plant whose overlapping rows are to be extracted. The center point and radius for P x are calculated earlier and let be denoted as ( Θ r x ,   Θ c x ) and R x , respectively. The number of overlapping rows at the bottom position ρ b o t t o m x of the plant P x are extracted as:
ρ b o t t o m x =   ( Θ r x +   R x )   ( Θ r x + 1   R x + 1 ) 1
Similarly, the number of overlapping rows at the top position ρ t o p x of the plant P x is extracted as:
ρ t o p x =   ( Θ r x 1 +   R x 1 )   ( Θ r x   R x ) 1
It should be noted that ρ b o t t o m x for P x at the bottom position is the same as ρ t o p x for P x + 1 at the top position.
This is illustrated in Figure 11, with three plants and their center points and radii. Moreover, the first plant is overlapping with the second plant at the bottom position and the reverse is true for the second plant. Similarly, the second plant overlaps with the third plant at the bottom position and vice-versa. Using Equations (4) and (5), it can be calculated that ρ b o t t o m 1 = ρ t o p 2 = 2 and ρ b o t t o m 2 = ρ t o p 3 = 3 . These are the number of pixel rows where the NDVI values are likely inflated and should be adjusted before consideration. Note: that ρ x > 0 , if there is overlap, otherwise there is no overlap and, therefore, no adjustment needed.

3.4.2. Adjusting NDVI Values at Overlapping Pixel Rows

The symmetrical distribution of plant NDVI values with center maxima and a gradual decrease towards the boundary of plant informs the adjustment procedure for overlapping pixel rows (Figure 7).
Care must be taken to exclude overlapping areas from the determination of maximum and minimum NDVI values. The use of the center row avoids overlapping areas and increases the accuracy of maxima and minima. There are three steps described as follows:
  • the maximum and minimum NDVI values of the plant are first calculated, labelled as I m a x b and I m i n b ; respectively;
  • the whole center row is updated and will be used as a reference for the adjustment of plant pixels at overlapping rows. The step size, which is the difference of NDVI values between two adjacent pixels, is calculated as:
    I s t e p =   I m a x b I m i n b R 1
The center row is then updated with the following values:
I b ( Θ r , : ) = [ I min b , I min b + I step , I min b + 2 I step , , I max b , , I min b + 2 I step , I min b + I step , I min b ] 1 × ( 2 R 1 ) .
  • Let us take a symmetric reference vector, V sym , such that V sym = [ 1 ,   2 , 3 ,   , R 2 , R 1 ,   R ,   R 2 , R 1 ,   , 3 ,   2 , 1 ] . The NDVI values are adjusted as following:
    I b ( i , j ) = { I b ( Θ r , i + j R )   if   [ ( V sym ( i ) + V sym ( j ) ) > R + 1 ]   &   [ i   is   an   overlapping   row ] , I b ( Θ r , 1 )   if   [ ( V sym ( i ) + V sym ( j ) ) R + 1 ]   &   [ i   is   an   overlapping   row ] , I b ( i , j )   otherwise ,     i   ϵ   [ 1 , r ] ,     j   ϵ   [ 1 , c ] .
As an example, after adjustment, the plant matrix I b will look similar to the following two-dimensional matrix if each pixel of I b is adjusted, considering the plant has seven rows and seven columns.
I b = [ I min b I min b I min b I min b I min b I min b I min b I min b I min b I min b I min b + I step I min b I min b I min b I min b I min b I min b + I step I min b + 2 I step I min b + I step I min b I min b I min b I min b + I step I min b + 2 I step I max b I min b + 2 I step I min b + I step I min b I min b I min b I min b + I step I min b + 2 I step I min b + I step I min b I min b I min b I min b I min b I min b + I step I min b I min b I min b I min b I min b I min b I min b I min b I min b I min b ] 7 × 7
To validate the results obtained from the digital adjusted plants, the phenomics of these plants were correlated with the manually harvested fresh weights. The higher value of correlation confirms the accuracy of extracted phenomics of the adjusted plants. The results were obtained by considering two phenomic bio-characteristics: (1) area and (2) mean NDVI values of adjusted plants.
After the adjustment of NDVI values and the extraction of circular plant regions, the next aim was to extract the area and mean NDVI value of each plant for each field trial image. The individual plant area was calculated as the product of number of non-zero pixels with the area of one pixel in cm2 within the circular plant region. Mean NDVI was tabulated by calculating the mean NDVI values of non-zero pixels with the bounding box. The area provides information about the size of the plant and the mean NDVI value indicates how dense the plant canopy is. Note that the area and mean NDVI values may not be correlated, e.g., a plant with small area can have a similar mean NDVI value as a plant occupying a large area.

3.5. Testing of the Algorithm

Fresh biomass weights were collected for a subset of 480 perennial ryegrass plants to measure their individual biomass yield. The field trial was located and operated by Agriculture Victoria Research, Hamilton, Victoria, Australia (37.8464°S, 142.0737°E). The Hamilton region is in the Victorian high rainfall zone, generally receiving >600 mm per year of rain. Fresh weights were available for four harvesting dates (9 May 2017, 5 July 2017, 11 September 2017 and 20 November 2017) in different seasons of 2017 [34]. Harvest dates were determined by the growth stage of the individual plants, in which the two to three leaf stage was considered as a standard simulated grazing stage. The above-ground biomass was harvested manually at 5 cm height.
The following phenomics metrics were compared via Pearson correlations ( ř ) [35]: mean NDVI of rectangular bounding boxes, area of rectangular bounding boxes, unadjusted mean NDVI of circular plant regions, adjusted mean NDVI of circular plant regions and area of circular plant regions.

4. Results and Discussions

The robustness of the proposed algorithm was tested by correlating extracted phenomics metrics with harvest fresh weights. Metrics included the area calculated from rectangular bounding boxes and their mean unadjusted and adjusted NDVI. The fresh biomass weight value per individually harvested plant (82.48–127.18 g) varied across seasons in 2017. Moreover, measured seasonal fresh biomass weight in 2017 indicated a wide variability of biomass values (~1.41–428 g) for each measurement season for the individual plants [34]. This suggests that biomass yield had sufficient variation to use to correlate the NDVI and plant phenomics.
The Pearson correlation coefficients ( ř ) between the area of circular plant regions and fresh weights for four field trial images from four timepoints are shown in Table 1 and Figure 12a–d. The values of ř for these four images demonstrate a good relationship between fresh weight and circular area (0.63–0.75). The correlation could likely be further improved by including height measures [22]. Areas extracted from the circular plant regions were more closely correlated with fresh weights than those from rectangular boxes (Table 1). The advantage of the circular areas was less pronounced at the May 2017 time point, which also had the lowest number of plants overlapping across boxes. However, for the other timepoints with higher degrees of plant overlap, the correlation for circular plant regions was substantially higher than the rectangular boxes. There are two main reasons for this: (1) most plants in these three field trial images had overgrown across bounding boxes and merged with adjacent plants, thus, rectangular bounding boxes will not provide an accurate measure of the area; (2) rectangular boxes may show an area that is entirely due to the overlapping of neighboring plants, leading to an area or NDVI being attributed to missing plants. These factors erode the accuracy of rectangular bounding boxes, especially when there is substantial biomass.
To see the trends of individual plant’s values of fresh weight and extracted phenomics, the ranges of fresh weight and area were normalized to a single range of [0, 100] and plotted as a comparison, shown in Figure 13, which shows that plant fresh weight and area follow a very similar pattern on 9 May 2017. This pattern is consistent with the other time points (Supplementary Material, Figure S1–S3).
We further compared the mean adjusted and unadjusted plant NDVI of circular plant regions and unadjusted NDVI of rectangular boxes to fresh weights (Table 2). The correlations were moderate for rectangular boxes and ranged between 0.51 and 0.56. Circular plant regions slightly improved in terms of correlations to 0.53 and 0.58. The relatively low level of improvement is due to NDVI values being similar for both types of bounding boxes, despite large differences in area. Further small correlation improvements (range 0.55–0.59) were achieved by adjusting NDVI values for circular plant regions by accounting for plant overlap. While the improvement observed from adjusting NDVI, here, was minor, the adjustment methods applied could be useful for other trials, crops or even data types (e.g., point clouds).
The multi-spectral images used in this study had a pixel size of approximately 2cm. This was sufficient to distinguish single perennial ryegrass plants. The successful application of our algorithm to other image datasets depends on their relative pixel and plant size. Furthermore, we set a numerical threshold for NDVI intensity and the search space within the bounding box to detect plant centers. In part, these values are expected to be dataset specific and could depend on achieving relatively uniform plant spacing, and, therefore, should be revisited during application. Finally, further improvements may be needed to the determination of radii, especially when plants are large and overlap substantially (Table 1, timepoints three and four), which adds noise and causes some overestimation.
The correlation of our phenomic bio-characteristics (plant areas and adjusted NDVI) found in our study is at a level that is useful to provide proxy phenotypes of individual biomass in the field. Plant breeding, with or without genomics, requires the phenotypic screening of many breeding lines to select the best for commercialization or as parents for the next breeding cycle. Furthermore, methods such as genomic selection require a large training population of phenotype lines with genome-wide DNA markers [36]. The advantage of sensor-based methods is that they are non-destructive and take less time to be conducted, which makes them suitable to be used at multiple time points during the growing season. In pasture grasses, growth rate and recovery after harvest are key properties that only non-destructive sensor-based methods can investigate at a sufficient scale to be useful for plant breeding. Further, as pasture grasses are generally outbreeding (i.e., they cannot self-pollinate making each plant genetically unique), it can be of importance to measure single plants for research and selection purposes. Of particular interest, is the genetic predisposition of individual plants to compete with plants in close proximity in the field because highly competitive plants will lead to non-uniform growth patterns in the paddock, which is undesirable. The bio-characteristics defined in our study provide crucial information at the individual plant level to better understand the phenome-to-genome relationships of biomass production and other important traits.

5. Conclusions

Here, we present an efficient and effective solution to develop a machine-vision mathematical model that can extract plant phenomic bio-characteristics with sufficient accuracy, despite the overlapping of adjacent plants. The estimation of plant areas when plants are very large and overlap substantially could potentially be improved in future studies. The mathematical model consisted of three parts: locating center points, extracting the area by means of radius and center point, and extracting of mean NDVI via adjustment of overlapping plant regions. Overall, correlations of phenomic metrics with fresh weights were moderate, with plant areas derived from circular plant regions being more strongly correlated than the NDVI derived measures. The proposed NDVI adjustment for overlapping plant portions increased correlations with fresh weights slightly. As is the case with all new proposals, we strongly encourage the evaluation of the algorithm performance before deployment. The algorithms presented in this study can be applied to a wide variety of crops and to other field trial designs.

Supplementary Materials

The following are available online at https://www.mdpi.com/2072-4292/13/6/1212/s1, Figure S1: Comparisons between the individual plant values of normalized values of fresh weights and areas for first 100 plants in a same range of [0, 100] for the field trial image taken on 9 May 2017, Figure S2: Comparisons between the individual plant values of normalized values of fresh weights and areas for first 100 plants in a same range of [0, 100] for the field trial image taken on 11 September 2017,Figure S3: Comparisons between the individual plant values of normalized values of fresh weights and areas for first 100 plants in a same range of [0, 100] for the field trial image taken on 20 November 2017.

Author Contributions

Conceptualization, S.R., H.D.D. and Y.-P.P.C.; methodology, S.R. and H.D.D.; software, S.R., E.B., F.S., P.B., and H.D; validation, H.D.D., E.B. and F.S.; formal analysis, S.R., H.D.D., E.B. and F.S.; investigation, S.R., H.D.D., E.B. and F.S.; resources, A.G. and P.B.; data curation, A.G., F.S.; and P.B.; writing—S.R. and H.D.D.; writing—review and editing, S.R., H.D.D. and E.B.; visualization, S.R. and H.D.D.; supervision, H.D.D. and Y.-P.P.C.; project administration, H.D.D.; funding acquisition, H.D.D. All authors have read and agreed to the published version of the manuscript.

Funding

The authors acknowledge financial support from Agriculture Victoria, Dairy Australia, and The Gardiner Foundation through the DairyBio initiative and La Trobe University.

Institutional Review Board Statement

Not Applicable.

Informed Consent Statement

Not Applicable.

Data Availability Statement

The data presented in this study are available on request from the corresponding author for research purposes.

Acknowledgments

We thank the team at Agriculture Victoria, Hamilton for managing the field trial and data collection.

Conflicts of Interest

The authors declare no conflict of interest.

References

  1. Tester, M.; Langridge, P. Breeding Technologies to Increase Crop Production in a Changing World. Science 2010, 327, 818–822. [Google Scholar] [CrossRef]
  2. Long, S.P.; Marshall-Colon, A.; Zhu, X.-G. Meeting the Global Food Demand of the Future by Engineering Crop Photosynthesis and Yield Potential. Cell 2015, 161, 56–66. [Google Scholar] [CrossRef] [Green Version]
  3. Brown, T.B.; Cheng, R.; Sirault, X.R.R.; Rungrat, T.; Murray, K.D.; Trtilek, M.; Furbank, R.T.; Badger, M.; Pogson, B.J.; O Borevitz, J. TraitCapture: Genomic and environment modelling of plant phenomic data. Curr. Opin. Plant Biol. 2014, 18, 73–79. [Google Scholar] [CrossRef] [Green Version]
  4. Kumar, J.; Pratap, A.; Kumar, S. Plant Phenomics: An Overview. In Phenomics in Crop Plants: Trends, Options and Limitations; Springer: New Delhi, India, 2015; pp. 1–10. [Google Scholar]
  5. Sticklen, M.B. Feedstock Crop Genetic Engineering for Alcohol Fuels. Crop. Sci. 2007, 47, 2238–2248. [Google Scholar] [CrossRef] [Green Version]
  6. Van der Kooi, C.J.; Reich, M.; Löw, M.; De Kok, L.J.; Tausz, M. Growth and yield stimulation under elevated CO2 and drought: A meta-analysis on crops. Environ. Exp. Bot. 2017, 122, 150–157. [Google Scholar] [CrossRef]
  7. O’Malley, R.C.; Ecker, J.R. Linking genotype to phenotype using the Arabidopsis unimutant collection. Plant J. 2010, 61, 928–940. [Google Scholar] [CrossRef]
  8. Weigel, D.; Richard, M. The 1001 Genomes Project for Arabidopsis thaliana. Genome Biol. 2009, 10, 1–5. [Google Scholar] [CrossRef] [Green Version]
  9. Cannon, S.B.; May, G.D.; Jackson, S.A. Three Sequenced Legume Genomes and Many Crop Species: Rich Opportunities for Translational Genomics. Plant Physiol. 2009, 151, 970–977. [Google Scholar] [CrossRef] [Green Version]
  10. International Brachypodium Initiative. Genome sequencing and analysis of the model grass Brachypodium distachyon. Nature 2011, 463, 763–770. [Google Scholar]
  11. Atwell, S.; Huang, Y.S.; Vilhjálmsson, B.J.; Willems, G.; Horton, M.W.; Li, Y.; Meng, D.; Platt, A.; Tarone, A.M.; Hu, T.T.; et al. Genome-wide association study of 107 phenotypes in Arabidopsis thaliana inbred lines. Nat. Cell Biol. 2010, 465, 627–631. [Google Scholar] [CrossRef]
  12. Wang, M.; Jiang, N.; Jia, T.; Leach, L.; Cockram, J.; Comadran, J.; Shaw, P.; Waugh, R.; Luo, Z. Genome-wide association mapping of agronomic and morphologic traits in highly structured populations of barley cultivars. Theor. Appl. Genet. 2012, 124, 233–246. [Google Scholar] [CrossRef] [PubMed]
  13. Lucocq, J.M. Efficient quantitative morphological phenotyping of genetically altered organisms using stereology. Transgenic Res. 2007, 16, 133–145. [Google Scholar] [CrossRef] [PubMed]
  14. Chung, K.; Crane, M.M.; Lu, H. Automated on-chip rapid microscopy, phenotyping and sorting of C. elegans. Nat. Methods 2008, 5, 637–643. [Google Scholar] [CrossRef] [PubMed]
  15. Sozzani, R.; Benfey, P.N. High-throughput phenotyping of multicellular organisms: Finding the link between genotype and phenotype. Genome Biol. 2011, 12, 219. [Google Scholar] [CrossRef] [PubMed] [Green Version]
  16. De Souza, N. High-throughput phenotyping. Nat. Methods 2010, 7, 1. [Google Scholar] [CrossRef]
  17. P-Sanz, F.; Navarro, P.J.; E-Cortines, M. Plant phenomics: An overview of image acquisition technologies and image data analysis algorithms. Gigascience 2017, 6, 1–18. [Google Scholar]
  18. Badrinarayanan, V.; Kendall, A.; Cipolla, R. SegNet: A Deep Convolutional Encoder-Decoder Architecture for Image Segmentation. IEEE Trans. Pattern Anal. Mach. Intell. 2017, 39, 2481–2495. [Google Scholar] [CrossRef] [PubMed]
  19. Otsu, N. A threshold selection method from gray-level histograms. IEEE Trans. Syst. Man, Cybern. 1979, 9, 62–66. [Google Scholar] [CrossRef] [Green Version]
  20. Vincent, L.; Soille, P. Watersheds in digital spaces: An efficient algorithm based on immersion simulations. IEEE Trans. Pattern Anal. Mach. Intell. 1991, 13, 583–598. [Google Scholar] [CrossRef] [Green Version]
  21. Banerjee, B.P.; Spangenberg, G.; Kant, S. Fusion of Spectral and Structural Information from Aerial Images for Improved Biomass Estimation. Remote Sens. 2020, 12, 3164. [Google Scholar] [CrossRef]
  22. Gebremedhin, A.; Badenhorst, P.; Wang, J.; Shi, F.; Breen, E.; Giri, K.; Spangenberg, G.C.; Smith, K. Development and Validation of a Phenotyping Computational Workflow to Predict the Biomass Yield of a Large Perennial Ryegrass Breeding Field Trial. Front. Plant Sci. 2020, 11. [Google Scholar] [CrossRef]
  23. Silva, J.C.E.; Kerr, R.J. Accounting for competition in genetic analysis, with particular emphasis on forest genetic trials. Tree Genet. Genomes 2012, 9, 1–17. [Google Scholar] [CrossRef]
  24. Tucker, C.J. Red and photographic infrared linear combinations for monitoring vegetation. Remote Sens. Environ. 1979, 8, 127–150. [Google Scholar] [CrossRef] [Green Version]
  25. Neumann, K.; Klukas, C.; Friedel, S.; Rischbeck, P.; Chen, D.; Entzian, A.; Stein, N.; Graner, A.; Kilian, B. Dissecting spatiotemporal biomass accumulation in barley under different water regimes using high-throughput image analysis. Plant Cell Environ. 2015, 38, 1980–1996. [Google Scholar] [CrossRef]
  26. Tackenberg, O. A New Method for Non-destructive Measurement of Biomass, Growth Rates, Vertical Biomass Distribution and Dry Matter Content Based on Digital Image Analysis. Ann. Bot. 2006, 99, 777–783. [Google Scholar] [CrossRef]
  27. Chen, D.; Neumann, K.; Friedel, S.; Kilian, B.; Chen, M.; Altmann, T.; Klukas, C. Dissecting the Phenotypic Components of Crop Plant Growth and Drought Responses Based on High-Throughput Image Analysis. Plant Cell 2014, 26, 4636–4655. [Google Scholar] [CrossRef] [Green Version]
  28. Hartmann, A.; Czauderna, T.; Hoffmann, R.; Stein, N.; Schreiber, F. HTPheno: An image analysis pipeline for high-throughput plant phenotyping. BMC Bioinform. 2011, 12, 148. [Google Scholar] [CrossRef] [PubMed] [Green Version]
  29. Subramanian, R.; Spalding, E.P.; Ferrier, N.J. A high throughput robot system for machine vision based plant phenotype studies. Mach. Vis. Appl. 2012, 24, 619–636. [Google Scholar] [CrossRef] [Green Version]
  30. Miller, N.D.; Parks, B.M.; Spalding, E.P. Computer-vision analysis of seedling responses to light and gravity. Plant J. 2007, 52, 374–381. [Google Scholar] [CrossRef]
  31. Clark, R.T.; MacCurdy, R.B.; Jung, J.K.; Shaff, J.E.; McCouch, S.R.; Aneshansley, D.J.; Kochian, L.V. Three-Dimensional Root Phenotyping with a Novel Imaging and Software Platform. Plant Physiol. 2011, 156, 455–465. [Google Scholar] [CrossRef] [PubMed] [Green Version]
  32. Atherton, T.; Kerbyson, D. Size invariant circle detection. Image Vis. Comput. 1999, 17, 795–803. [Google Scholar] [CrossRef]
  33. Yuen, H.K.; Princen, J.; Dlingworth, J.; Kittler, J. A Comparative Study of Hough Transform Methods for Circle Finding. Image Vis. Comput. 1989, 8, 71–77. [Google Scholar] [CrossRef] [Green Version]
  34. Gebremedhin, A.; Badenhorst, P.; Wang, J.; Giri, K.; Spangenberg, G.; Smith, K. Development and Validation of a Model to Combine NDVI and Plant Height for High-Throughput Phenotyping of Herbage Yield in a Perennial Ryegrass Breeding Program. Remote Sens. 2019, 11, 2494. [Google Scholar] [CrossRef] [Green Version]
  35. Rodgers, J.L.; Nicewander, W.A. Thirteen Ways to Look at the Correlation Coefficient. Am. Stat. 1988, 42, 59. [Google Scholar] [CrossRef]
  36. Daetwyler, H.D.; Villanueva, B.; Woolliams, J.A. Accuracy of Predicting the Genetic Risk of Disease Using a Genome-Wide Approach. PLoS ONE 2008, 3, e3395. [Google Scholar] [CrossRef] [PubMed] [Green Version]
Figure 1. (a) An example of field trial in RGB form and (b) a grey scale image of the perennial ryegrass field trial stitched together from aerial images.
Remotesensing 13 01212 g001
Figure 2. Bounding Boxes of (a) 3 plant-row boxes and (b) their individual plant boxes.
Remotesensing 13 01212 g002
Figure 3. A bounding box without a plant, but due to the overlapping of the top plant, the bounding box contains some image pixels that are erroneously classified as plants.
Remotesensing 13 01212 g003
Figure 4. (a) Plants overgrow from their bounding boxes and overlapping with adjacent plants. (b) Rectangular bounding box of a plant; the area equal to the bounding box is not accurate as plant is overgrown from the bounding box. (c) A potentially more accurate representation of the area is illustrated with the circular plant region.
Remotesensing 13 01212 g004
Figure 5. (ad) A small set of different crop rows extracted from four field trial images taken on (a) 9 May 2017, (b) 5 July 2017, (c) 11 September 2017 and (d) 20 November 2017. Note: that the rows at different time points are not exactly the same length as pixel size varied slightly from expected 2 cm. Values were converted to metric units to standardize between capture dates.
Remotesensing 13 01212 g005
Figure 6. (ad) Background corrected images obtained from applying Otsu thresholding on images shown in Figure 5a–d, respectively. Grey pixels represent normalized difference vegetation index (NDVI) intensity and black pixels represent the background.
Remotesensing 13 01212 g006
Figure 7. Distribution of image pixels in terms of greenness or NDVI values in an individual plant.
Remotesensing 13 01212 g007
Figure 8. (ad) Identification of center points using Algorithm 1.
Remotesensing 13 01212 g008
Figure 9. Distribution of image pixels with labelling of center point, center row and horizontal distances from center point to the horizontal extremes.
Remotesensing 13 01212 g009
Figure 10. (ad) Extraction of circular plant regions and accurate area of individual plants from Figure 8 using Algorithm 2.
Remotesensing 13 01212 g010
Figure 11. Three plants in a crop row overlapping at top and bottom positions. The center points and radii are also mentioned, which assist in extracting overlapping rows.
Remotesensing 13 01212 g011
Figure 12. Correlation coefficients between fresh weight of subset of 480 perennial ryegrass plants and circular area for field trial images taken on (a) 9 May 2017, (b) 5 July 2017, (c) 11 September 2017 and (d) 20 November 2017.
Remotesensing 13 01212 g012
Figure 13. Comparisons between the individual plant values of normalized values of fresh weights and areas for first 100 plants in a same range of [0, 100] for the field trial image taken on 5 July 2017.
Remotesensing 13 01212 g013
Table 1. Values of ř calculated for the area extracted from rectangular and circular plant regions with the fresh weights of subset of 480 perennial ryegrass plants.
Image Time PointCorrelation
Area of Rectangular Bounding BoxesArea of Circular Plant Regions
9 May 20170.740.75
5 July 20170.300.74
11 September 20170.280.63
20 November 20170.300.66
Table 2. Correlations of mean NDVI and fresh weights of subset of 480 perennial ryegrass plants for rectangular boxes and proposed circular plant regions: with unadjusted and adjusted NDVI values.
Image Time PointCorrelation
Unadjusted NDVI from Rectangular BoxesUnadjusted NDVI from Circular Plant RegionsAdjusted NDVI from Circular Plant Regions
9 May 20170.560.560.57
5 July 20170.550.580.59
11 September 20170.520.540.55
20 November 20170.510.530.56
Publisher’s Note: MDPI stays neutral with regard to jurisdictional claims in published maps and institutional affiliations.

