Article

The Estimation of Magnetite Prospective Resources Based on Aeromagnetic Data: A Case Study of Qihe Area, Shandong Province, China

1
China Aero Geophysical Survey and Remote Sensing Center for Natural Resources, Beijing 100083, China
2
Key Laboratory of Airborne Geophysics and Remote Sensing Geology, Ministry of Natural Resources, Beijing 100083, China
3
School of Geophysics and Information Technology, China University of Geosciences (Beijing), Beijing 100029, China
*
Author to whom correspondence should be addressed.
Remote Sens. 2021, 13(6), 1216; https://doi.org/10.3390/rs13061216
Submission received: 5 February 2021 / Revised: 20 March 2021 / Accepted: 21 March 2021 / Published: 23 March 2021
(This article belongs to the Section Remote Sensing in Geology, Geomorphology and Hydrology)

Abstract

:
In the Qihe area, the magnetic anomalies caused by deep and concealed magnetite are weak and compared with ground surveys, airborne surveys further weaken the signals. Moreover, the magnetite in the Qihe area belongs to a contact-metasomatic deposit, and the magnetic anomalies caused by the magnetite and its mother rock overlap and interweave. Therefore, it is difficult to directly delineate the target areas of magnetite according to the measured aeromagnetic maps in Qihe or similar areas, let alone estimate prospective magnetite resources. This study tried to extract magnetite-caused anomalies from aeromagnetic data by using high-pass filtering. Then, a preliminary estimation of magnetite prospective resources was realized by the 3D inversion of the extracted anomalies. In order to improve the resolution and accuracy of the inversion results, a combined model-weighting function was proposed for the inversion. Meanwhile, the upper and lower bounds and positive and negative constraints were imposed on the model parameters to further improve the rationality of the inversion results. A theoretical model with deep and concealed magnetite was established. It demonstrated the feasibility of magnetite-caused anomaly extraction and magnetite prospective resource estimation. Finally, the magnetite-caused anomalies were extracted from the measured aeromagnetic data and were consistent with known drilling information. The distribution of underground magnetic bodies was obtained by the 3D inversion of extracted anomalies, and the existing drilling data were used to delineate the volume of magnetite. In this way, the prospective resources of magnetite in Qihe area were estimated.

1. Introduction

Deep structures and minerals have long been a focus of geophysical exploration [1,2,3,4,5]. Due to the difficulties of deep geological exploration and the collection of geological data, exploration of the deep earth mainly relies on large-scale geophysical exploration. Airborne geophysical techniques are suitable for deep-earth exploration since it is characterized by high efficiency and low cost and is suitable for large-scale geophysical exploration [6,7,8,9].
Deep mineral exploration, especially the delineation of mineral target areas and the estimation of prospective mineral resources, is one of the most important tasks in deep exploration. Among them, the estimation of prospective mineral resources is important but difficult. For open-pit deposits or shallow-buried deposits, the conventional methods of mineral resource estimation mainly rely on geological methods, such as the geometry method, the Krige method, the SD method, etc. [10,11,12]. For deep-buried deposits, geological methods are unsuitable since it is difficult to collect data. In this context, research on how to use geophysical methods to estimate the prospective resources of deep-buried ore deposits is meaningful.
Magnetotelluric, seismic, gravity, and magnetic explorations are considered effective methods in the deep earth, and these methods have been widely used in prospecting for deep ore deposits [13,14,15,16]. In terms of the airborne geophysics of ore deposits, airborne electromagnetics is mainly used for near-surface prospecting [17,18,19,20], while airborne gravity and magnetics perform well in deep earth [21,22,23]. Moreover, machine learning shows great potential in the exploration of ore deposits and so has become a research hotspot in recent years [24,25,26,27,28]. For the deep and concealed magnetite deposits in the Qihe area of Shandong, aerial magnetic measurement is the most cost-effective method. However, the magnetic anomalies measured are not only caused by the magnetite body but also by the mother rock masses. This has brought about greater challenges in the delineation of the magnetite target areas and the estimation of the prospective magnetite resources.
In order to estimate the prospective resources in the Qihe area using aeromagnetic data, it is necessary to study the technology used to extract magnetite-caused anomalies and the technology for 3D inversion modeling. The extraction of magnetite-caused anomalies is preprocessing for inversion in most conditions. High-pass filtering is a commonly used extraction method of magnetite-caused anomalies in the frequency domain [29]. It is easy to implement, and the key to the success of this filtering is the selection of appropriate parameters.
Three-dimensional inversion technology plays a major part in the estimation of prospective resources. Commonly used 3D inversion methods include those based on L2 norm, L1 norm, and L0 norm regularization [30,31,32]. Among them, the inversion methods based on L1 norm and L0 norm regularization can obtain high-resolution inversion results. However, compared with the inversion method based on L2 norm regularization, they may need more iteration time until the objective function is minimized. Although the inversion method based on L2 norm regularization has a lower resolution, it has a high convergence speed [33]. In this paper, the inversion method based on L2 norm regularization was adopted, and the resolution of the inversion results was improved. In the inversion process of the magnetic data, a model-weighting function is generally introduced to overcome the skin effect of the inversion results [34]. In order to give full play to the model-weighting function, various forms of model-weighting functions have been proposed [34,35,36,37]. It is convenient to obtain different model structures by optimizing different model-weighting functions since there is no need to change the main program, and it will not increase the number of calculations. Therefore, this paper proposed combined model-weighting with multiple functions. In addition, some reasonable constraints on model parameters can also improve the resolution of the inversion results [38], among which the most commonly used are the constraints on upper and lower bounds [39]. This paper further proposed constraints on the consistency of the model parameter and data being positive and negative, which can improve the resolution of the inversion results to a certain extent. After obtaining the inversion results through 3D inversion, the prospective magnetite resources were further calculated in combination with the density of the measured magnetite samples.

2. Theory and Methods

2.1. Extraction Method for Magnetite-Caused Magnetic Anomaly

Aerial surveys weaken the magnetic anomalies caused by the magnetite compared with ground surveys, and the deep and concealed deposits in Qihe make it worse. On the other hand, the magnetite in this area belongs to contact-metasomatic deposits, and the magnetic anomalies caused by magnetite and its mother rock overlap and interweave. Therefore, it was difficult to directly delineate the target areas of the magnetite from the observed aeromagnetic map, let alone estimate the prospective resources of the magnetite. In order to estimate the prospective resources of magnetite in the study area, it was necessary to extract the magnetite-caused anomalies from the observed magnetic data. In theory and in practice, it was easier to extract magnetite-caused anomalies when there was a lower observation surface; the greater the volume difference between magnetite and rock, the greater the magnetism difference between magnetite and rock and the greater the distance between magnetite and rock.
In this paper, a high-pass filtering method was used to extract magnetite-caused anomalies. The method assumed that the background field is mainly distributed in the low-frequency part, while the target magnetite-caused anomalies were mainly distributed in the high-frequency part. In order to suppress the low-frequency background field and extract the high-frequency magnetite-caused anomalies, the low-frequency and high-frequency gains were set to 0 and 1, respectively, and a half-period cosine function was selected to connect the transition zone smoothly [40,41]. Therefore, the response function of the high-pass filtering in the frequency domain was:
H k = 0 k w c e / 2 1 2 1 + cos π e k w c + e / 2 w c e / 2 k w c + e / 2 1 k > w c + e / 2 ,
where w c is the central frequency and e is the transition bandwidth. The central frequency w c whose effect equals that of the cutoff frequency is the dominant parameter. The larger the w c , the smoother the background field and the larger the residual magnetite-caused amplitude. In practice, the value of w c depends on the wavelength of the magnetite-caused anomalies, i.e., the width of the magnetite-caused anomalies. The transition bandwidth e can adjust the smoothness of the transition zone. In order to avoid the ringing effect, the value of e should not be too small since a filter with a very small e will tend to an ideal filter. The frequency-domain response function shown in Figure 1 had a central frequency w c =   0 . 5 and a transition bandwidth e = 0.6.

2.2. Regularization Inversion Method

Aeromagnetic measurement collected N discrete observation data. The underground space was divided into M cuboid-shaped cells with a constant magnetic susceptibility within each cell. Then the relationship between the observed data and the underground magnetic susceptibility was as follows:
d = Am,
where d is an N-dimensional vector of the observed data (the extracted magnetite-caused anomalies in this paper) that will be input into the inversion program; m is an M-dimensional vector of the magnetization (or magnetic susceptibility). A represents an N × M-dimensional matrix of the forward operators connecting d and m. Since m is much larger than d, the solution of inversion problem is non-uniqueness. By using Tikhonov regularization method [42] to improve the non-uniqueness problem, a regularization term based on L2 norm is added into inversion function:
ϕ = ϕ d + α ϕ m = A m d 2 2 + α m 2 2 = A m d T A m d + α m T m ,
where ϕ d represents an L2 norm of the difference between the observed and predicted data and ϕ m represents an L2 norm of magnetization. Then, a combined model-weighting function W m containing a new depth weighting and horizontal weighting was introduced to improve the resolution of the inversion results. The objective function is rewritten as follows:
ϕ = ϕ d + α ϕ m = A m d T A m d + α W m m T W m m .
In order to speed up the convergence, we solve the above objective function in the weighted model parameter domain [43]. Set A W = A W m 1 and m W = W m m , and the objective function in the weighted parameter domain can be summarized as
ϕ = ϕ d + α ϕ m = A W m W d T A W m W d + α m W T m W .
The derivative of the above objective function is
ϕ m W = A W T A W m W d + α m W = A W T A W + α I m W A W T d .
After the optimal solution m W is obtained in the weighted model parameter domain by the conjugate gradient algorithm, m can be calculated by
m = W m 1 m W .
Finally, the magnetization vector m is obtained, and the distribution characteristics of underground anomalies can be displayed.

2.3. Combined Model Weighting Function

The model-weighting function is indispensable in the process of the 3D inversion of gravity and potential magnetic data. The conventional model-weighting functions, based on depth [34,35] and a Jacobian matrix [37], can effectively overcome the skin effect to find the appropriate results for inversion. Both of these functions are widely used in gravity and magnetic inversions. In the study area of this paper, the information includes a large burial depth of the magnetite and relatively compact distribution. Although some focusing inversion methods have been well developed [37,44,45,46], this paper tried to obtain relatively high-resolution results using L2 norm regularization by selecting a more suitable model-weighting function and imposing appropriate constraints. The strategy of introducing the suitable model-weighting function has the following advantages: no change in the main inversion program and no increase in the calculation amount.
The depth-based model-weighting function W z [34,35] was adopted in the inversion process. W z is a diagonal matrix whose diagonal elements are as follows:
w z ( x , y , z ) = 1 ( z + z 0 ) β / 2 ,
where z denotes the depth of the cell center, z0 is the absolute value of the height of the observation plane and β represents the weighting strength. Its main effect is to overcome the “skin effect.” With the conventional depth-based model-weighting function, the inversion results are based on L2 norm regularization diverge at the bottom (as shown in Figure 2), which is called the “tailing phenomenon” in this paper. In addition, around the main anomalies, there are some associated anomalies with weak and opposite amplitude, which are called the “opposite anomalies accompanying phenomenon” in this paper. Therefore, in order to improve the resolution of the inversion results, it is necessary to overcome the “skin effect” as well as the “tailing phenomenon” and the “opposite anomalies accompanying phenomenon.” These two phenomena become more obvious when the underground anomalies are deeply buried. The diagonal elements of the modified depth weighting function W z are:
w z ( x , y , z ) = 1 ( H z z 0 ) β / 2 1 ( z + z 0 ) β / 2 ,
where the three parameters z, z0, and β have the same meaning as in Equation (8), and H is the distance between the observation plane and the bottom of the underground inversion space. It is obvious that H > z + z0. In other words, only one parameter, H, is new here. Its value was not arbitrarily set but fixed under the given inversion conditions. Compared with Equation (8), the adjustment coefficient item 1 ( H z z 0 ) β / 2 is added into Equation (9) based on practical experience. Its main effect is to overcome the inversion results’ divergence at the bottom. The modified depth weighting function W z will improve the resolution in the vertical direction, as shown in Figure 2.
In order to improve the horizontal resolution of the inversion results, the horizontal weighting function W h was imposed, and its diagonal elements are:
w h ( x , y , z ) = e - M o x , y τ ,
where e is the natural constant and Mo is the modulus of magnetite-caused magnetic anomalies. Only parameter τ needs setting; its value must be larger than 0, and it is suggested to be 1/2. It is used to adjust the intensity of the horizontal weighting function. In detail, the greater the value of τ , the stronger the intensity. When Mo(x, y) = 0 at a certain observed position, w h ( x , y , z ) = 1 ; the larger Mo(x, y) is, the smaller w h ( x , y , z ) is—that is, the model-weighting is reduced. It can be seen that the elements of W h are equal to each other at the same horizontal position. Therefore, the main effect of W h is to “push” the inverted targets towards the direction of a smaller w h ( x , y , z ) , i.e., a larger Mo(x, y) along the horizontal direction. This horizontal weighting function can improve the lateral resolution while suppressing the “opposite anomalies accompanying phenomenon.”
The combined model-weighting function W m used in this paper consists of the modified depth weighting function W z and the horizontal weighting function W h :
W m = W z W h .
The function not only overcomes the “skin effect”, but also suppresses the “tailing phenomenon” and the “opposite anomalies accompanying phenomenon,” thereby improving the inversion results. A synthetic example demonstrating the effectiveness of the combined model-weighting function is shown in Figure 2.

2.4. Constraints on Model Parameters

Constraints on model parameters had a great impact on the inversion resulted. Appropriate model constraints could reduce the nonuniqueness and improve the resolution of the inversion resulted [47,48,49]. This was especially important for the inversion of deep-buried models. The model constraints on the upper and lower bounds were commonly used in the inversion process [50,51,52]; reasonable upper and lower bounds had a positive impact on the inversion resulted. In practice, the upper and lower bounds of model parameters were usually determined by geological and drilling data. The upper and lower bounds restrict the ranges of model parameters after each iteration [50,53]:
m i = m u p ( m i > m u p ) m i = m l o w ( m i < m l o w ) ,
where m u p is the upper bound and m low is the lower. The constraints on the upper and lower bounds can significantly improve the vertical resolution of the inversion results, especially at the bottom of the results, as shown in Figure 3.
For a separate inversion of potential field data, the underground anomalies were generally treated as a simple model without multilayer features. On this premise, whether each observed magnetic RTP anomaly was positive or negative was generally consistent with the corresponding underground anomaly when two conditions were met: the effects of remnant magnetization could be ignored, and the underground anomalies were relatively deeply buried. Therefore, this rule was used in this paper to detect whether the positive and negative nature of each cell’s parameter was consistent with its corresponding observation data. If the attribute was inconsistent for a certain cell, the model parameter was set to 0, i.e.,
m ( x , y , z ) = 0             m ( x , y , z ) d ( x , y ) < 0 ,
where d(x,y) represents the magnetic RTP data. Equation (13) is also referred to as the “attribute consistency constraints” in this paper. In practice, only the cells in the transitional zone between the positive and negative zones will be modified by Equation (13). Similar to the constraints on the upper and lower bounds, these were implemented after each iteration. They can not only make the distribution of the inversion results more reasonable but also improve the horizontal resolution of the inversion results, as shown in Figure 3.

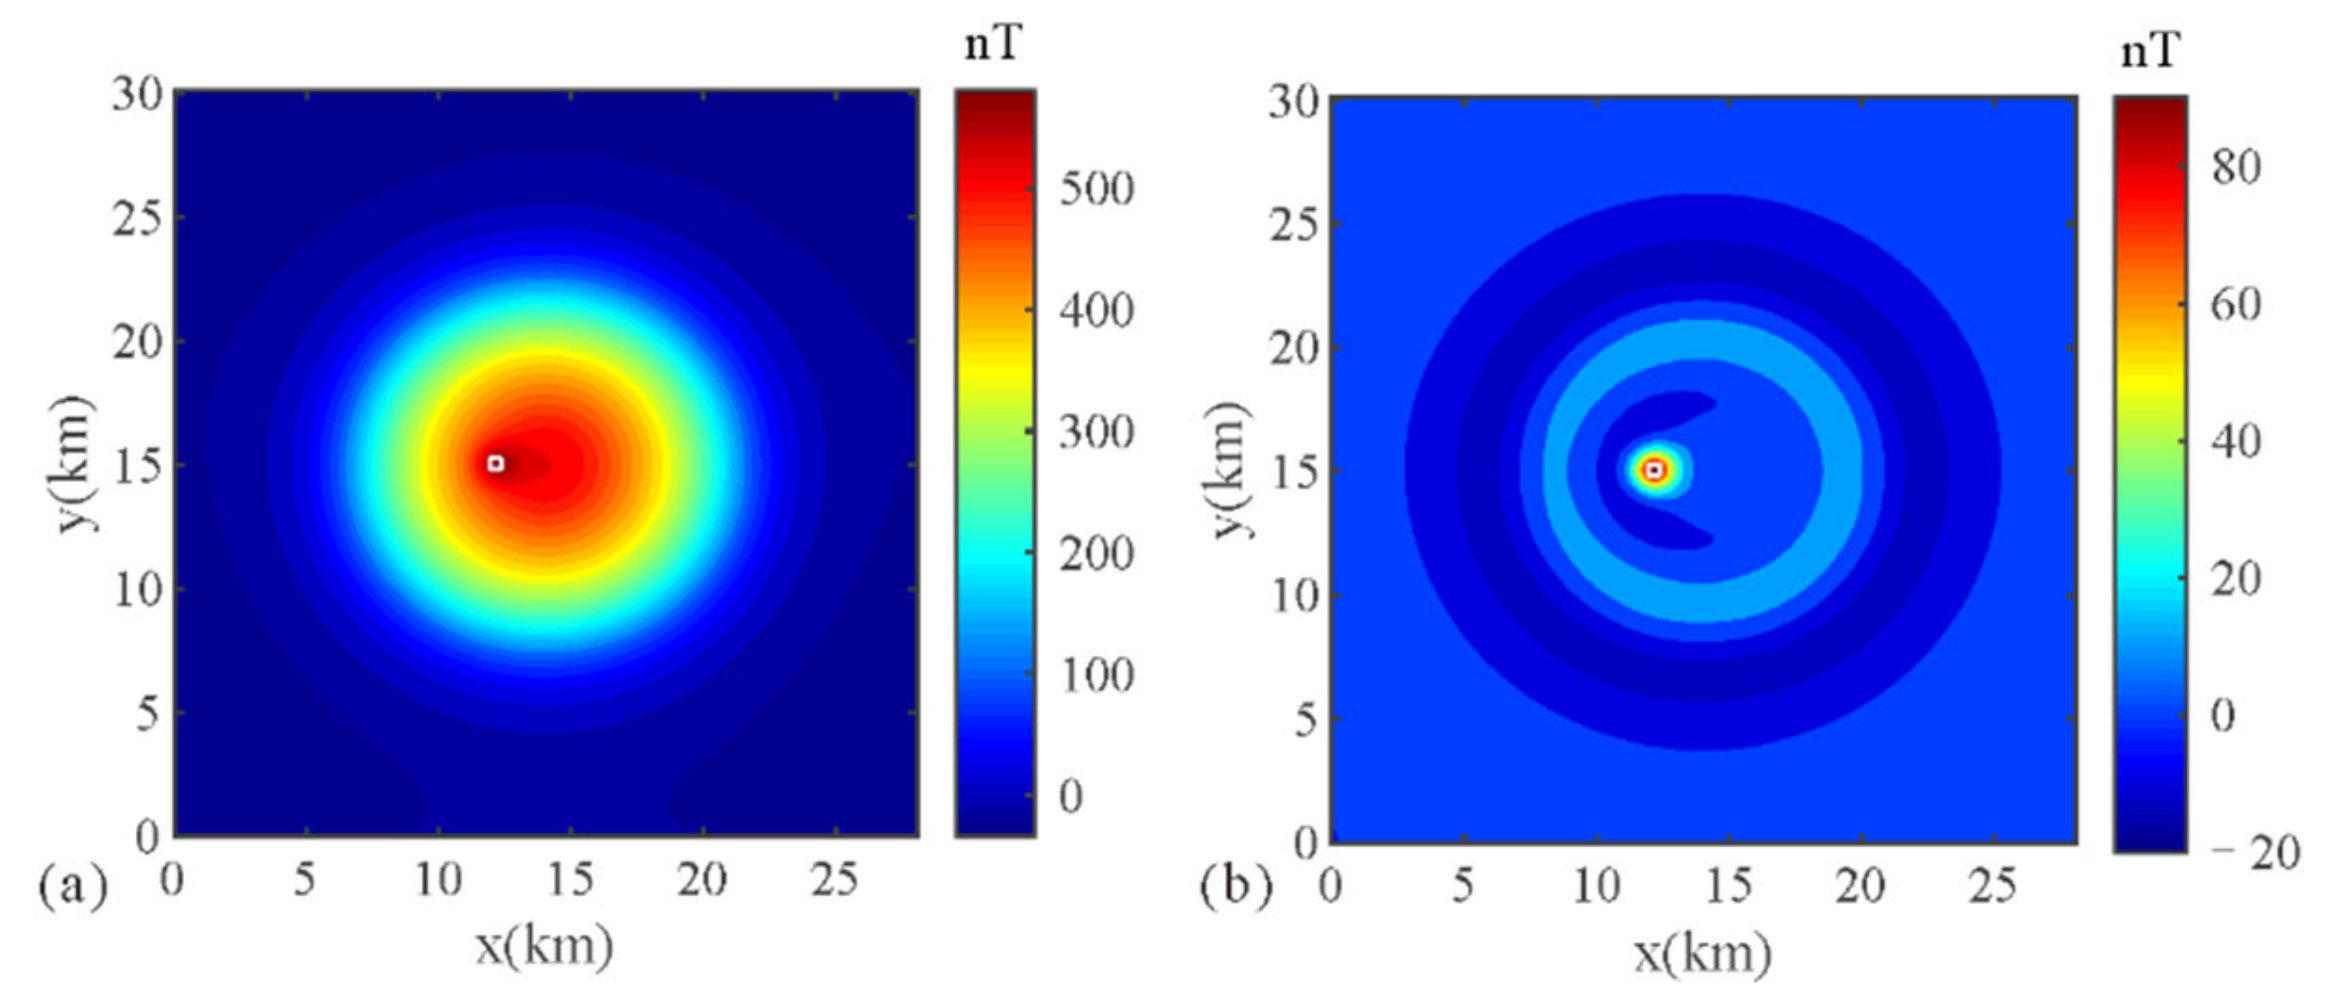
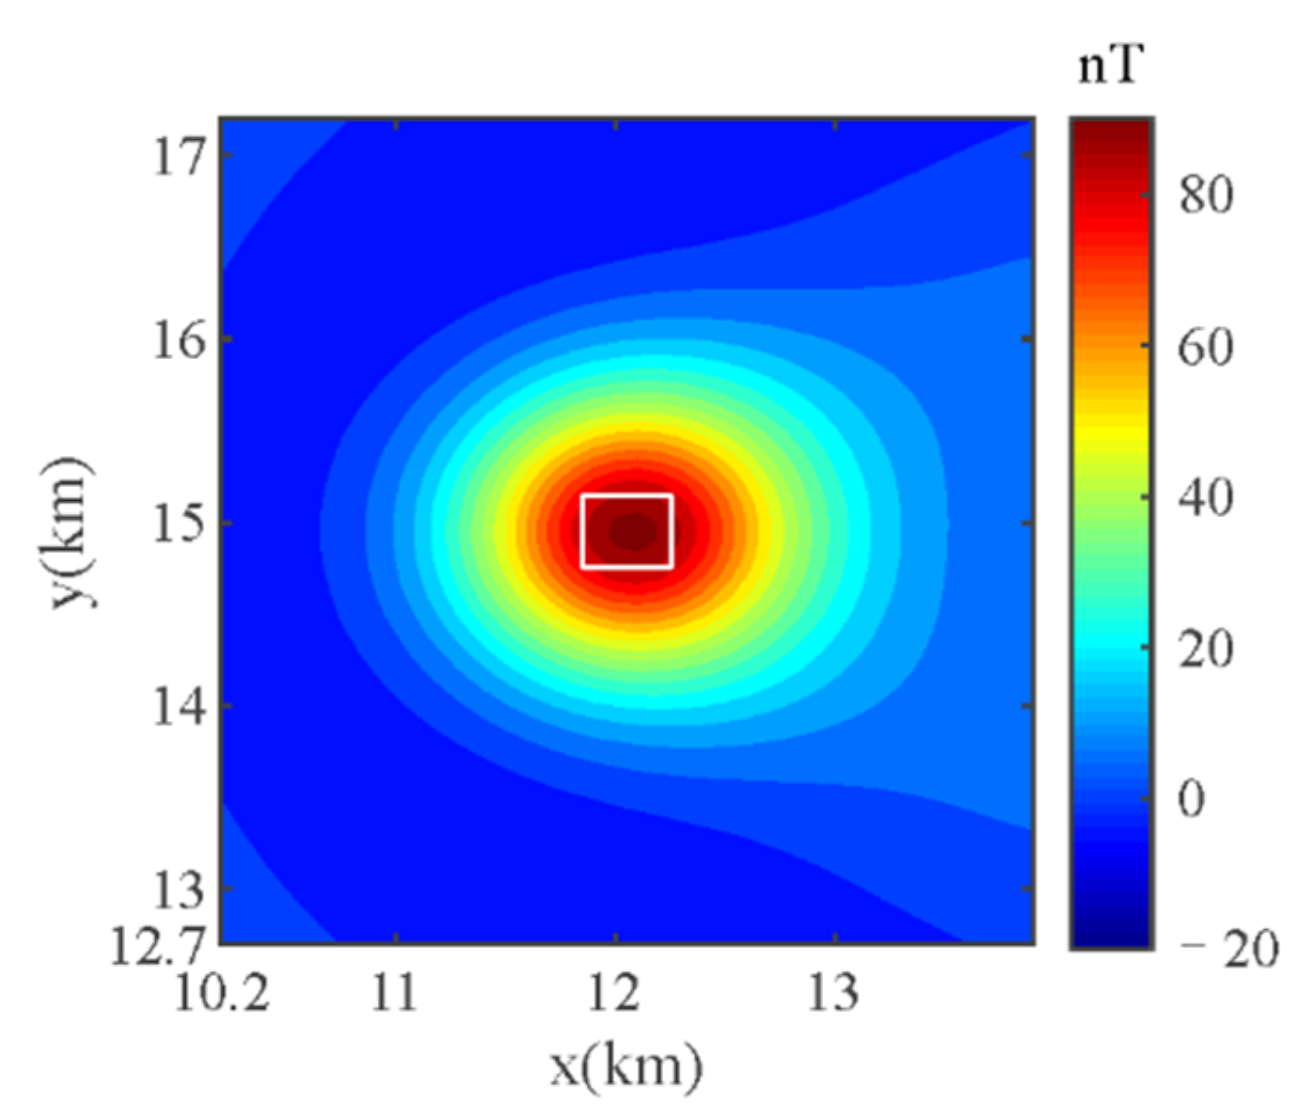
3. Synthetic Model Test

The deposits in the Qihe area have the typical characteristics of deep and concealed magnetite deposits since the magnetite bodies are buried deeply and are in contact with their mother rock masses. Meanwhile, there are large magnetism and volume differences between the magnetite and the mother rock, which makes the extraction of magnetite-caused anomalies theoretically feasible. Accordingly, it was also feasible to estimate the prospective magnetite resources from the extracted magnetite-caused anomalies. In this Section, a theoretical model was designed according to the actual state of the magnetite and rock masses in the Qihe area, as well as the measured magnetism of rock masses and magnetite and the amplitude and width of aeromagnetic anomalies. The horizontal and vertical slices of the theoretical model are shown in Figure 4a–c. In the synthetic model, the yellow represents the mother rock masses with a magnetization of 1 A/m and a burial depth of 1 km. These rock masses consist of two parts: the main body is a cylinder, and the upper body is a truncated cone. The thickness of the truncated cone is 1.1 km. Its top diameter is 3.2 km, and the bottom diameter is 14.2 km. The cylinder is 18 km tall and 14.2 km in diameter. The dotted circle in Figure 4a represents the bottom border of the truncated cone and the border of the cylinder. The red represents the magnetite body with a magnetization of 60 A/m and a burial depth of 1 km. Its shape is a cube with dimensions of 400 m × 400 m × 100 m in x, y, and z directions. The blue represents the nonmagnetic host strata, such as the Neogene stratum with a thickness of 900 m near the ground. Assuming that the magnetite density ρ = 4 g/cm3, the simulated magnetite mass is 64,000,000 tons. In the simulation, the declination angle and inclination angle of the geomagnetic field were set as −6.16° and 55.23°, which were the same as the geomagnetic field in the Qihe area. The magnetization direction of the model was the same as the direction of the geomagnetic field. The flight height of the simulated aeromagnetic measurement was 200 m. The total magnetic intensity data caused by the rock and magnetite are shown in Figure 4d, and the vertical magnetic anomalies in the case of vertical magnetization caused by the magnetite are shown in Figure 4e.
In actual aeromagnetic surveys, what can be obtained is the total magnetic intensity data shown in Figure 4d, rather than the magnetite-caused anomaly data shown in Figure 4e. In the model, the magnetite was buried deep and small in volume, and the magnetization direction was not vertically downward. Therefore, it was difficult to directly estimate the prospective resources from the observation data shown in Figure 4d. Therefore, it was necessary to extract the magnetite-caused anomalies (Figure 4e) from Figure 4d.
Figure 5a was obtained from Figure 4d by reducing to the pole, and then, a high-pass filter was used in Figure 5a to obtain the magnetite-caused anomalies shown in Figure 5b. According to the comparison between Figure 4e and Figure 5b, the location, amplitude, and width of the main anomalies in the two figures were consistent, indicating that the extraction resulted were reasonable. However, there was a slight “ringing effect” in Figure 5b. Moreover, due to the influence of the background field caused by the rock mass, the extracted magnetite-caused anomalies migrate slightly towards the east (the direction of the rock mass anomaly center).
Then, the 3D inversion method was adopted to invert the extracted magnetite-caused anomalies. First, the high-value subregion shown in Figure 6 was intercepted from the magnetite-caused anomaly map shown in Figure 5b for 3D inversion. The advantages of this strategy were as follows: When there are multiple high-value subregions, the best calculation conditions could be set according to the individual geological characteristics of each high-value subregion, such as the inversion range, the model-weighting function, the upper and lower bounds, etc. Moreover, this could reduce the memory requirements and save computing time.
The number of data points in the high-value subregion is N = 46 × 38. It was supposed that the thickness of the nonmagnetic Neogene stratum was 900 m. In order to reduce the number of inversion cells, the nonmagnetic stratum was not divided, which could reduce the ambiguity and improve the resolution of the inversion results. The space below the Neogene stratum was divided into M = 46 × 38 × 15 cuboid cells with a size of 100 m × 100 m × 20 m. Then, the intercepted observation data were input into the inversion program to solve the optimal solution of the objective function ϕ = ϕ d + α ϕ m = A m d T A m d + α W m m T W m m . Because the magnetite target is buried deep and there is a large distance between the aerial observation data and the target, the inversion results will be severely blurred and have low-resolution when the conventional depth weighting function is introduced into the inversion. Therefore, the combined model-weighting function W m   =   W z W h proposed in this paper was used, where the diagonal elements of W z are expressed as w z ( x , y , z ) = 1 ( H z z 0 ) β / 2 1 ( z + z 0 ) β / 2 , with β = 3, z0 = 200 m, H = 1400 m, and the diagonal elements of W h are expressed as w h ( x , y , z ) = e - M o τ with τ = 1/2. The initial m was set to m0 = 0, and constraints were introduced in the iterative process, including constraints on the upper and lower bounds (0, 60 A/m) and attribute consistency constraints. Then, the conjugate gradient algorithm was used to iteratively find the optimal solution in the weighted parameter domain. After this, the inversion results were obtained by the formula m = W m 1 m W as shown in Figure 7. It can be seen that the distribution of the inverted magnetic materials was consistent with the actual locations of the theoretical magnetite. The volume of the magnetic materials enclosed by the 30 A/m isosurface was 16,800,000 m3, which was in good agreement with the theoretical volume of the magnetite. Finally, according to the density of the magnetite of 4 g/cm3, the mass of the magnetite was estimated to be 67,200,000 tons, which was consistent with the theoretical mass of 64,000,000 tons. This test verified the feasibility of prospective resource estimation of deep and concealed magnetite.

4. Real Data Application

The study area is located in Qihe County, Shandong Province, China, with geographical coordinates of 36.50‒36.83° N and 116.25–116.75° E. In terms of the geotectonic position, it falls in the North China Plate [54]. The ground and aerial magnetic measurement data show that there are obvious magnetic anomalies in this area. Combined with the geological data and drilling information, it can be inferred that there are three main magnetic plutons in the deep part, namely Litun, Pandian, and Dazhang [55,56]. The magnetite deposits in the study area exist on these three plutons. The magnetite deposits have the same genesis, ore-controlling structure, and ore-controlling strata as the magnetite deposits in the Jinan and Laiwu areas, Shandong Province, China. All of them are contact-metasomatic deposits, and the magnetite bodies all occur in the contact zones between the Late Yanshan intermediate complex and the Ordovician Majiagou carbonate rock [57,58]. The difference between them is that the magnetite bodies in Jinan and Laiwu are shallowly buried, while the magnetite bodies in the study area are buried deep, making it difficult to carry out a geological survey and mineral prospecting. Therefore, it was necessary to used geophysical exploration technology in this area, and magnetic exploration was the most suitable technique for detecting magnetite.
With the support of the National Key Research and Development Project of China, China Aero Geophysical Survey and Remote Sensing Center for Natural Resources carried out aeromagnetic surveys in the study area in 2017 and obtained high-precision aeromagnetic data, as shown in Figure 8a. According to the measurement time and measurement location, the average magnetic inclination and declination of the geomagnetic field are 55.23° and −6.16°, respectively. During the implementation of this project, some drilled cores were collected, and their susceptibility and remnant magnetization were measured, some of which came from the mother rock masses and some from the magnetite bodies. Compared with the magnetite bodies, the mother rock masses are much larger in volume and more widely distributed. In this case, the aeromagnetic anomalies are dominated by the mother rock masses. Therefore, the magnetic characteristics of the magnetite were ignored in the data processing. The remnant magnetization of the rock masses is about 1–50 × 10−3 A/m, and the induced susceptibility of the rock masses is about 2000 × 105 SI, which is about 1 A/m when converted into induced magnetization. Compared with induced magnetization, the remnant magnetization of the rock masses can be ignored. That is to say, the induced magnetization of the rock masses is dominant in the aeromagnetic data. For the above reasons, the magnetization direction of the underground magnetic bodies is considered to be the same as the direction of the geomagnetic field. The reduction-to-the-pole (RTP) data are shown in Figure 8b and were obtained by processing the aeromagnetic data. In order to extract the magnetite-caused anomalies, the high-pass filter shown in Equation (1) was adopted to process the RTP data, where the central frequency w c , and transition bandwidth, e, were 0.0205 and 0.039, respectively. The magnetite-caused anomalies and the background field are shown in Figure 8c,d, respectively. It can be seen that the magnetite-caused anomalies better highlight the local RTP data, while the background field is smooth and reflects the overall characteristics of the RTP data. In order to show the extraction results of magnetite-caused anomalies more clearly, a profile was extracted whose position is shown by the white line in Figure 8c. The background field and magnetite-caused anomalies on the profile are shown in Figure 9a,b, respectively. The background field reflects the overall change trend of the RTP data, and the amplitude and width of the magnetite-caused anomalies are appropriate, indicating that the extraction results of the magnetite-caused anomalies are reasonable.
There are some drilled boreholes in the Litun Pluton subregion; in order to show the relationship between the boreholes and the extracted magnetite-caused anomalies, the magnetite-caused anomaly map of the Litun Pluton subregion was zoomed into, as shown in Figure 10. The locations of the boreholes that encounter magnetite are shown in the small crosshair circles in Figure 10. It can be seen that these boreholes are all located inside the high-value area. The locations of the boreholes that did not encounter magnetite are shown in the small hollow circles in Figure 10. It can be seen that the boreholes at the edge and outside of the high-value area are all empty. The above drilling data indicate that the magnetite-caused anomalies extracted in this paper have a strong correlation with the real magnetite-caused anomalies.
From the known geological information, one can see that the geological and metallogenic conditions are different in the different subregions in the study area [55,56]. We divided the survey area into three subregions—Litun Pluton subregion (Figure 11a), Pandian Pluton subregion and Dazhang Pluton subregion—according to the existing geological data and magnetic RTP data. In this way, Inversion parameters can be set more specifically according to the characteristics of different subregions.
The magnetite-caused anomalies in Litun Pluton subregion are shown in Figure 11a. There are a total of 125 × 140 data points in this subregion. The thickness of the Neogene strata in this subregion is about 900 m, so the subsurface space with a depth of 0‒900 m was not divided for inversion. It is also known that the burial depth of the magnetite is about 1200 m with a thickness of about 100 m. Therefore, the vertical range of the subsurface divided space was set to 900–1400 m, and space was divided into 125 × 140 × 25 rectangular cells with a size of 100 m × 100 m × 20 m. Meanwhile, the strength of the combined model-weighting function was set and adjusted for the inversion according to the burial depth of the magnetite. According to the measurement of lots of magnetite samples, the maximum magnetic susceptibility of the magnetite is 161,000 × 10−5 SI, which is approximately equivalent to 67 A/m in terms of magnetization. Therefore, the upper and lower bounds of the model parameters were set as (0, 67) A/m. In addition, the attribute consistency constraints (Equation (13)) were introduced to further improve the resolution of the inversion results. The magnetite-caused anomalies shown in Figure 11a were input into the inversion program, and the conjugate gradient algorithm was used to iteratively solve the optimal solution m W of the objective function ϕ = A m d T A m d + α W m m T W m m = A W m W d W T A W m W d W + α m W T m W in the weighted parameter domain. Finally, it was converted to m by m = W m 1 m W , and the inversion results are shown in Figure 12. The predicted data and the data difference obtained from the inversion results are shown in Figure 11b,c. It can be seen that the predicted data map is highly consistent with the observed data map, and the difference map shows primarily small fluctuations. Figure 12a–d shows the magnetic material distribution with magnetization greater than or equal to 20 A/m, 30 A/m, 40 A/m, and 50 A/m, respectively. Based on the existing drilling information, it is believed that magnetic material with magnetization greater than or equal to 30 A/m corresponds well to the range of the magnetite. There are 201 cells with magnetization greater than or equal to 30 A/m. Since the size of a single-cell is 100 m × 100 m × 20 m, the total volume is 40,200,000 m3. According to the measurement and statistics of magnetite samples, the average density of the magnetite in this area is 4.2 g/cm3. Therefore, the total mass of the magnetite is 168,840,000 tons, which is about 170 million tons in the Litun Pluton subregion.
The magnetite-caused anomalies in the Pandian Pluton subregion are shown in Figure 13a. There are a total of 70 × 110 data points of this subregion. The thickness of the Neogene strata in this subregion is about 900 m. It is also known that the burial depth of the magnetite is about 1400 m with a thickness of about 50 m. Therefore, the vertical range of the subsurface divided space was 900–1900 m, and space was divided into 70 × 110 × 100 rectangular cells with a size of 100 m × 100 m × 10 m. Meanwhile, the strength of the combined model-weighting function was set and adjusted for the inversion according to the burial depth of the magnetite. According to the measurement of a large number of magnetite samples, the maximum magnetic susceptibility of the magnetite is 183,000 × 10−5 SI, which is approximately equivalent to 77 A/m in terms of magnetization. Therefore, the upper and lower bounds were set as (0, 77) A/m. At the same time, attribute consistency constraints were introduced to further improve the resolution of the inversion results; the results are shown in Figure 14. The predicted data and the data difference obtained from the inversion results are shown in Figure 13b,c. It can be seen that the predicted data map is highly consistent with the observed data map, and the difference map shows primarily small fluctuations. Figure 14a–d shows the magnetic material distribution with magnetization greater than or equal to 20 A/m, 30 A/m, 40 A/m, and 50 A/m, respectively. Owing to the lack of drilling information in this subregion, it is difficult to select a suitable isosurface to determine the range of the magnetite. Therefore, by referring to the Litun Pluton subregion, the volume of the magnetite determined by the 30 A/m isosurface is 22,200,000 m3, which is about 93 million tons.
The magnetite-caused anomalies in the Dazhang Pluton subregion are shown in Figure 15a. There are a total of 80 × 95 data points in this subregion. The thickness of the Neogene strata is about 600 m. It is also known that the burial depth of the magnetite in this subregion is about 750 m with a thickness of about 25 m. Therefore, the vertical range of the subsurface divided space was selected as 600‒850 m. The subsurface space was divided into 80 × 95 × 50 rectangular cells with a size of 100 m × 100 m × 5 m. Meanwhile, the strength of the combined model-weighting function was set and adjusted for the inversion process according to the burial depth of the magnetite. According to the measurement of many magnetite samples, the maximum magnetic susceptibility of the magnetite is 161,000 × 10−5 SI, which is approximately equivalent to 67 A/m in terms of magnetization. Therefore, the upper and lower bounds of model parameters were set as (0, 67) A/m. At the same time, attribute consistency constraints were introduced to further improve the resolution of the results; the results are shown in Figure 16. The predicted data and the data difference obtained from the inversion results are shown in Figure 15b,c. It can be seen that the predicted data map is highly consistent with the observed data map, and the difference map shows primarily small fluctuations with an average of nearly zero. Figure 16a–d shows the magnetic material distribution with magnetization greater than or equal to 20 A/m, 30 A/m, 40 A/m, and 50 A/m, respectively. Similar to the Pandian Pluton subregion, the Dazhang Pluton subregion also lacks drilling information and the volume of the magnetite in this subregion was also determined based on the 30 A/m isosurface by referring to the Litun Pluton subregion. As a result, the volume of the magnetite was determined to be 5,800,000 m3, which is about 24.36 million tons.

5. Conclusions

It is difficult to estimate the prospective resources of deep and concealed deposits, such as the magnetite deposits in the Qihe area. This paper presents a viable solution. First, the magnetite-caused anomalies were extracted from the aeromagnetic data using a high-pass filter. To obtain reliable magnetite-caused anomalies, information on the drilled boreholes was used to control and adjust the parameters of the high-pass filter. Second, the 3D regularization inversion method was applied to invert the extracted magnetite-caused anomalies. Then, high-resolution inversion results were obtained by introducing the combined model-weighting function, upper and lower bounds, and attribute consistency constraints into the inversion program. Finally, according to the information of drilled boreholes, the magnetite boundary was delineated according to the isosurface of magnetization 30 A/m; thus, the volume of magnetite can be calculated. Combined with the average density of the magnetite samples, the mass of the magnetite was calculated. As a result, the prospective resources are about 170 million tons, 93 million tons, and 24.36 million tons in Litun Pluton, Pandian Pluton, Dazhang subregions of the Qihe area Shandong Province, China. The method of estimating the prospective resources of deep and concealed magnetite in this paper is new and has great significance for the mineral exploration and quantitative interpretation of deep deposits.

Author Contributions

Conceptualization, X.G. and S.X.; methodology, X.G., S.X. and C.Y.; validation, X.G., S.X. and C.Y.; investigation and visualization, C.Y., D.Z. and C.W.; writing—original draft preparation, X.G.; writing—review and editing, X.G. and D.Z.; supervision, S.X. and C.W.; project administration, S.X. All authors have read and agreed to the published version of the manuscript.

Funding

This research was funded by the Basic Scientific Research Funds of the Key Laboratory of Airborne Geophysics and Remote Sensing Geology, Ministry of Nature and Resources (2020YFL11); the National Key Research and Development Project (2017YFC0602201); and the China Postdoctoral Science Foundation (2020M670601).

Institutional Review Board Statement

Not applicable.

Informed Consent Statement

Not applicable.

Data Availability Statement

With the support of the National Key Research and Development Project, China Aero Geophysical Survey and Remote Sensing Center for Natural Resources carried out aeromagnetic surveys and obtained the aeromagnetic data.

Conflicts of Interest

The authors declare no conflict of interest.

References

  1. Xiong, S.Q. Innovation and application of airborne geophysical exploration technology. J. Geomech. 2020, 26, 791–818. [Google Scholar] [CrossRef]
  2. Schmid, S.M.; Kissling, E. The arc of the western Alps in the light of geophysical data on deep crustal structure. Tectonics 2000, 19, 62–85. [Google Scholar] [CrossRef]
  3. Etgen, J.; Gray, S.H.; Zhang, Y. An overview of depth imaging in exploration geophysics. Geophysics 2009, 74, WCA5–WCA17. [Google Scholar] [CrossRef]
  4. Malehmir, A.; Juhlin, C.; Wijns, C.; Urosevic, M.; Valasti, P.; Koivisto, E. 3D reflection seismic imaging for open-pit mine planning and deep exploration in the Kevitsa Ni-Cu-PGE deposit, northern Finland. Geophysics 2012, 77, WC95–WC108. [Google Scholar] [CrossRef] [Green Version]
  5. Dzikunoo, E.A.; Vignoli, G.; Jørgensen, F.; Yidana, S.M.; Banoeng-Yakubo, B. New regional stratigraphic insights from a 3D geological model of the Nasia sub-basin, Ghana, developed for hydrogeological purposes and based on reprocessed B-field data originally collected for mineral exploration. Solid Earth 2020, 11, 349–361. [Google Scholar] [CrossRef] [Green Version]
  6. Zaher, M.A.; Saibi, H.; Mansour, K.; Khalil, A.; Soliman, M. Geothermal exploration using airborne gravity and magnetic data at Siwa Oasis, Western Desert, Egypt. Renew. Sustain. Energy Rev. 2018, 82, 3824–3832. [Google Scholar] [CrossRef]
  7. Smith, R.S.; O’Connell, M.D.; Poulsen, L.H. Using airborne electromagnetics surveys to investigate the hydrogeology of an area near Nyborg, Denmark. Near Surf. Geophys. 2004, 2, 123–130. [Google Scholar] [CrossRef]
  8. Murphy, B.S. Airborne geophysics and the Indian scenario. J. Indian Geophyiscal Union 2007, 11, 1–28. [Google Scholar]
  9. Soengkono, S. Deep interpretation of gravity and airborne magnetic data of the central Taupo Volcanic Zone. In Proceedings of the 33rd New Zealand Geothermal Workshop, Auckland, New Zealand, 21–23 November 2011. [Google Scholar]
  10. Battalgazy, N.; Madani, N. Categorization of mineral resources based on different geoatatistical simulation algorithms: A case study from an iron ore deposit. Nat. Resour. Res. 2019, 28, 1329–1351. [Google Scholar] [CrossRef]
  11. Matheron, G. Principles of geostatistics. Econ. Geol. 1963, 58, 1246–1266. [Google Scholar] [CrossRef]
  12. Zhu, Z.X.; Yan, J.D. The application of SD method in mineral resources reserves calculation in the Jiguanzi Copper-gold deposit, Daye, Hubei province. Geol. Prospect. 2004, 40, 82. [Google Scholar]
  13. Ars, J.M.; Tarits, P.; Hautot, S.; Bellanger, M.; Coutant, O.; Maia, M. Joint inversion of gravity and surface wave data constrained by magnetotelluric: Application to deep geothermal exploration of crustal fault zone in felsic basement. Geothermics 2019, 80, 56–68. [Google Scholar] [CrossRef]
  14. Jiang, W.; Korsch, R.J.; Doublier, M.P.; Duan, J.; Costelloe, R. Mapping Deep Electrical Conductivity Structure in the Mount Isa region, Northern Australia: Implications for Mineral Prospectivity. J. Geophys. Res. Solid Earth 2019, 124, 10655–10671. [Google Scholar] [CrossRef] [Green Version]
  15. Heinonen, S.; Malinowski, M.; Hloušek, F.; Gislason, G.; Buske, S.; Koivisto, E.; Wojdyla, M. Cost-effective seismic exploration: 2D reflection imaging at the Kylylahti massive sulfide deposit, Finland. Minerals 2019, 9, 263. [Google Scholar] [CrossRef] [Green Version]
  16. McCafferty, A.E.; Phillips, J.D.; Driscoll, R.L. Magnetic and gravity gradiometry framework for mesoproterozoic iron oxide-apatite and iron oxide-copper-gold deposits, southeast Missouri. Econ. Geol. 2016, 111, 1859–1882. [Google Scholar] [CrossRef]
  17. Yang, D.; Oldenburg, D.W. Three-dimensional inversion of airborne time-domain electromagnetic data with applications to a porphyry deposit. Geophysics 2012, 77, B23–B34. [Google Scholar] [CrossRef]
  18. Koné, A.Y.; Nasr, I.H.; Traoré, B.; Amiri, A.; Inoubli, M.H.; Sangaré, S.; Qaysi, S. Geophysical Contributions to Gold Exploration in Western Mali According to Airborne Electromagnetic Data Interpretations. Minerals 2021, 11, 126. [Google Scholar] [CrossRef]
  19. Zhdanov, M.S.; Alfouzan, F.A.; Cox, L.; Alotaibi, A.; Alyousif, M.; Sunwall, D.; Endo, M. Large-scale 3D modeling and inversion of multiphysics airborne geophysical data: A case study from the Arabian Shield, Saudi Arabia. Minerals 2018, 8, 271. [Google Scholar] [CrossRef] [Green Version]
  20. Liang, S.; Sun, S.; Lu, H. Application of Airborne Electromagnetics and Magnetics for Mineral Exploration in the Baishiquan–Hongliujing Area, Northwest China. Remote Sens. 2021, 13, 903. [Google Scholar] [CrossRef]
  21. Martinez, C.; Li, Y. Lithologic characterization using airborne gravity gradient and aeromagnetic data for mineral exploration: A case study in the Quadrilátero Ferrífero, Brazil. Interpretation 2015, 3, SL1–SL13. [Google Scholar] [CrossRef]
  22. Airo, M.L.; Loukola-Ruskeeniemi, K. Characterization of sulfide deposits by airborne magnetic and gamma-ray responses in eastern Finland. Ore Geol. Rev. 2004, 24, 7–84. [Google Scholar] [CrossRef]
  23. Forsberg, R.; Olesen, A.V.; Ferraccioli, F.; Jordan, T.A.; Matsuoka, K.; Zakrajsek, A.; Ghidella, M.; Greenbaum, J.S. Exploring the Recovery Lakes region and interior Dronning Maud Land, East Antarctica, with airborne gravity, magnetic and radar measurements. Geol. Soc. Lond. Spec. Publ. 2018, 461, 23–34. [Google Scholar] [CrossRef]
  24. Ghezelbash, R.; Maghsoudi, A.; Carranza, E.J.M. Performance evaluation of RBF-and SVM-based machine learning algorithms for predictive mineral prospectivity modeling: Integration of SA multifractal model and mineralization controls. Earth Sci. Inform. 2019, 12, 277–293. [Google Scholar] [CrossRef]
  25. Granek, J. Application of Machine Learning Algorithms to Mineral Prospectivity Mapping. Ph.D. Thesis, University of British Columbia, Vancouver, BC, Canada, 2016. [Google Scholar]
  26. Melo, A.T.; Li, Y. September. Geology differentiation of geophysical inversions using machine learning. In Proceedings of the International Workshop on Gravity, Electrical & Magnetic Methods and Their Applications, Xi’an, China, 19–22 May 2019. [Google Scholar]
  27. Kim, D.; Choi, J.; Kim, D.; Byun, J. Predicting mineralogy using a deep neural network and fancy PCA. SEG Tech. Program Expand. Abstr. 2020. [Google Scholar] [CrossRef]
  28. Bai, P.; Vignoli, G.; Viezzoli, A.; Nevalainen, J.; Vacca, G. (Quasi-) Real-Time Inversion of Airborne Time-Domain Electromagnetic Data via Artificial Neural Network. Remote Sens. 2020, 12, 3440. [Google Scholar] [CrossRef]
  29. Zahra, H.S.; Oweis, H.T. Application of high-pass filtering techniques on gravity and magnetic data of the eastern Qattara Depression area, Western Desert, Egypt. NRIAG J. Astron. Geophys. 2016, 5, 106–123. [Google Scholar] [CrossRef] [Green Version]
  30. Utsugi, M. 3-D inversion of magnetic data based on the L1-L2 norm regularization. Earth Planets Space 2019, 71, 73. [Google Scholar] [CrossRef] [Green Version]
  31. Sun, J.J.; Li, Y.G. Adaptive Lp inversion for simultaneous recovery of both blocky and smooth features in a geophysical model. Geophys. J. Int. 2014, 197, 882–899. [Google Scholar] [CrossRef] [Green Version]
  32. Portniaguine, O.; Zhdanov, M.S. Focusing geophysical inversion images. Geophysics 1999, 64, 874–887. [Google Scholar] [CrossRef] [Green Version]
  33. Fournier, D.; Oldenburg, D.; David, K. Robust and flexible mixed-norm inversion. SEG Tech. Program Expand. Abstr. 2016, 1542–1547. [Google Scholar] [CrossRef]
  34. Li, Y.G.; Oldenburg, D.W. 3-D inversion of magnetic data. Geophysics 1996, 61, 394–408. [Google Scholar] [CrossRef]
  35. Li, Y.G.; Oldenburg, D.W. 3-D inversion of gravity data. Geophysics 1998, 63, 109–119. [Google Scholar] [CrossRef]
  36. Commer, M. Three-dimensional gravity modelling and focusing inversion using rectangular meshes. Geophys. Prospect. 2011, 59, 966–979. [Google Scholar] [CrossRef]
  37. Zhdanov, M.S. Geophysical Inverse Theory and Regularization Problems; Elsevier: Amsterdam, The Netherlands, 2002; Volume 36. [Google Scholar]
  38. Silva, J.B.; Medeiros, W.E.; Barbosa, V.C. Gravity inversion using convexity constraint. Geophysics 2000, 65, 102–112. [Google Scholar] [CrossRef]
  39. Gao, X.H. The Study and Application of 3D Inversion Methods of Gravity & Magnetic and Their Gradient Tensor Data; Jilin University: Changchun, China, 2019. [Google Scholar]
  40. Gomez-Ortiz, D.; Agarwal, B.N.P. 3DINVER. M: A MATLAB program to invert the gravity anomaly over a 3D horizontal density interface by Parker-Oldenburg’s algorithm. Comput. Geosci. 2005, 31, 513–520. [Google Scholar] [CrossRef]
  41. Gao, X.H.; Sun, S.Y. Comment on “3DINVER.M: A MATLAB program to invert the gravity anomaly over a 3D horizontal density interface by Parker-Oldenburg’s algorithm”. Comput. Geosci. 2018, 127, 133–137. [Google Scholar] [CrossRef]
  42. Tikhonov, A.N.; Arsenin, V.Y. Solution of Ill-Posed Problem; Wiley: New York, NY, USA, 1977. [Google Scholar]
  43. Portniaguine, O.; Zhdanov, M.S. 3-D magnetic inversion with data compression and image focusing. Geophysics 2002, 67, 1532–1541. [Google Scholar] [CrossRef] [Green Version]
  44. Last, B.J.; Kubik, K. Compact gravity inversion. Geophysics 1983, 48, 713–721. [Google Scholar] [CrossRef]
  45. Vignoli, G.; Deiana, R.; Cassiani, G. Focused inversion of vertical radar profile (VRP) traveltime data. Geophysics 2012, 77, H9–H18. [Google Scholar] [CrossRef]
  46. Vignoli, G.; Sapia, V.; Menghini, A.; Viezzoli, A. Examples of improved inversion of different airborne electromagnetic datasets via sharp regularization. J. Environ. Eng. Geophys. 2017, 22, 51–61. [Google Scholar] [CrossRef]
  47. Sun, J.J.; Li, Y.G. Geophysical inversion using petrophysical constraints with application to lithology differentiation. SEG Tech. Program Expand. Abstr. 2011. [Google Scholar] [CrossRef] [Green Version]
  48. Rezaie, M.; Moradzadeh, A.; Kalate, A.N. 3D gravity data-space inversion with sparseness and bound constraints. J. Min. Environ. 2017, 8, 227–235. [Google Scholar] [CrossRef]
  49. Zhang, Y.; Yan, J.G.; Li, F.; Chen, C.; Mei, B.; Jin, S.G.; Dohm, J.H. A new bound constraints method for 3-D potential field data inversion using Lagrangian multipliers. Geophys. J. Int. 2015, 201, 267–275. [Google Scholar] [CrossRef]
  50. Guillen, A.; Menichetti, V. Gravity and magnetic inversion with minimization of a specific functional. Geophysics 1984, 49, 1354–1360. [Google Scholar] [CrossRef]
  51. Zhdanov, M.; Tolstaya, E. Minimum support nonlinear parametrization in the solution of a 3D magnetotelluric inverse problem. Inverse Probl. 2004, 20, 937. [Google Scholar] [CrossRef]
  52. Commer, M.; Newman, G.A. New advances in three-dimensional controlled-source electromagnetic inversion. Geophys. J. Int. 2008, 172, 513–535. [Google Scholar] [CrossRef]
  53. Barbosa, V.C.F.; Silva, J.B.C. Generalized compact gravity inversion. Geophysics 1994, 59, 57–68. [Google Scholar] [CrossRef]
  54. Hao, X.Z.; Yang, Y.H.; Li, Y.P.; Gao, L.H.; Chen, L. Ore-controlling Characteristics and Prospecting criteria of iron deposits in Qihe area of Western Shandong. J. Jilin Univ. Earth Sci. Ed. 2019, 49, 982–991. [Google Scholar]
  55. Wu, C.P.; Yu, C.C.; Wang, W.P.; Ma, X.B.; Fan, Z.G.; Zhu, H.W. Physical characteristics of rocks and ores and their application in Qihe area, Western Shandong. Adv. Earth Sci. 2019, 34, 1099–1107. [Google Scholar]
  56. Wu, C.P.; Yu, C.C.; Zhou, M.L.; Wang, W.P.; Ma, X.B.; Li, S.Q. Residual calculation of airborne and ground magnetic field and its prospecting application in heavily covered plain area. Prog. Geophys. 2020, 35, 0663–0668. [Google Scholar] [CrossRef]
  57. Zhu, Y.Z.; Zhou, M.L.; Gao, Z.J.; Zhang, X.B. The discovery of the Qihe-Yucheng skarn type rich iron deposit in Shandong and its exploration significance. Geol. Bull. China 2018, 37, 938–944. [Google Scholar]
  58. Wang, W.P.; Wu, C.P.; Ma, X.B. Aeromagnetic field feature and iron ore target prospecting in deep coverage area of Qihe in Shandong Province. Geol. Surv. China 2020, 7, 23–29. [Google Scholar] [CrossRef]
Figure 1. The frequency-domain response function of a high-pass filter.
Remotesensing 13 01216 g001
Figure 2. Vertical slices of the inversion results obtained by applying different model-weighting functions: (a) without depth weighting function; (b) with conventional depth weighting function W z ; (c) with modified depth weighting function W z ; (d) with the combined model-weighting function W m (The white rectangles represent the actual positions of the synthetic models. The magnetization of the two prisms on the left is 1 A/m, and the magnetization of the two prisms on the right is −1 A/m).
Remotesensing 13 01216 g002
Figure 3. Vertical slices of the inversion results obtained by applying different constraints: (a) without constraints; (b) with constraints on the upper and lower bounds; (c) with constraints on the attribute of positive or negative; (d) with constraints on both upper and lower bounds and the attribute of positive or negative (The white rectangles represent the actual positions of the synthetic models and the magnetization of the two prisms is 1 A/m).
Remotesensing 13 01216 g003
Figure 4. Theoretical model consisting of the mother rock (magnetization: 1 A/m) and the magnetite (magnetization: 60 A/m), and the magnetic anomalies at a flight height of 200 m obtained by forward calculation of this theoretical model: (a) a horizontal slice of the model at z = 1.1 km; (b) a vertical slice of the model at y = 15 km; (c) a vertical slice of the model at x = 14.1 km; (d) the total magnetic intensity ΔT caused by the rock and magnetite; (e) the vertical magnetic anomalies in the case of vertical magnetization caused by the magnetite.
Remotesensing 13 01216 g004
Figure 5. Extraction results of magnetite-caused anomalies based on Figure 4d: (a) magnetic reduction-to-pole (RTP) data obtained from Figure 4d; (b) magnetite-caused anomalies extracted from Figure 5a.
Remotesensing 13 01216 g005
Figure 6. High-value subregion of magnetite-caused anomalies (the white box denotes the actual scope of the magnetite body).
Remotesensing 13 01216 g006
Figure 7. Inversion results of extracted magnetite-caused anomalies (the white box represents the actual scope of the magnetite body): (a) a horizontal slice at z = 1050 m, (b) a vertical slice at x = 12.1 km, (c) a vertical slice at y = 14.8 km, and (d) a volume-rendered image of the 3D model with magnetization less than 30 A/m being removed.
Remotesensing 13 01216 g007
Figure 8. Measured aeromagnetic data of Qihe area: (a) measured total magnetization intensity data ΔT; (b) magnetic reduction to the pole (RTP) data; (c) the magnetite-caused data extracted from RTP data by high-pass filtering; (d) the regional data removed from RTP data by high-pass filtering.
Remotesensing 13 01216 g008
Figure 9. A profile at y = 16 km in the west‒east direction in the magnetic RTP data of Qihe area: (a) the black and yellow lines represent the RTP data and the background field data; (b) the yellow line represents the magnetite-caused data.
Remotesensing 13 01216 g009
Figure 10. Locations of the boreholes and magnetite-caused anomalies in Litun Pluton subregion.
Remotesensing 13 01216 g010
Figure 11. High-value area of magnetite-caused RTP anomaly maps in Litun Pluton subregion: (a) observed data; (b) predicted data from the inversion model; (c) difference between the observed and predicted data.
Remotesensing 13 01216 g011
Figure 12. Inversion results of magnetite-caused anomalies in Litun Pluton subregion: (a) magnetization less than 20 A/m removed; (b) magnetization less than 30 A/m removed; (c) magnetization less than 40 A/m removed; (d) magnetization less than 50 A/m removed.
Remotesensing 13 01216 g012
Figure 13. High-value area of magnetite-caused RTP anomaly maps in Pandian Pluton subregion: (a) observed data; (b) predicted data from the inversion model; (c) difference between the observed and predicted data.
Remotesensing 13 01216 g013
Figure 14. Inversion results of a magnetite-caused anomaly in Pandian Pluton subregion: (a) magnetization less than 20 A/m removed; (b) magnetization less than 30 A/m removed; (c) magnetization less than 40 A/m removed; (d) magnetization less than 50 A/m removed.
Remotesensing 13 01216 g014
Figure 15. High-value area of magnetite-caused RTP anomaly maps in Dazhang Pluton subregion: (a) observed data; (b) predicted data from the inversion model; (c) difference between the observed and predicted data.
Remotesensing 13 01216 g015
Figure 16. Inversion results of a magnetite-caused anomaly in Dazhang Pluton subregion: (a) magnetization less than 20 A/m removed; (b) magnetization less than 30 A/m removed; (c) magnetization less than 40 A/m removed; (d) magnetization less than 50 A/m removed.
Remotesensing 13 01216 g016
Publisher’s Note: MDPI stays neutral with regard to jurisdictional claims in published maps and institutional affiliations.

