Article

Modelling the Diameter Distribution of Savanna Trees with Drone-Based LiDAR

by
Mitchel L. M. Rudge
1,*,
Shaun R. Levick
2,
Renee E. Bartolo
3 and
Peter D. Erskine
1
1
Centre for Mined Land Rehabilitation, Sustainable Minerals Institute, The University of Queensland, Brisbane, QLD 4067, Australia
2
CSIRO Land and Water, PMB 44, Winnellie, NT 0822, Australia
3
Department of Agriculture, Water and the Environment, Supervising Scientist, Darwin, NT 0820, Australia
*
Author to whom correspondence should be addressed.
Remote Sens. 2021, 13(7), 1266; https://doi.org/10.3390/rs13071266
Submission received: 5 March 2021 / Revised: 22 March 2021 / Accepted: 24 March 2021 / Published: 26 March 2021
(This article belongs to the Section Forest Remote Sensing)

Abstract

:
The diameter distribution of savanna tree populations is a valuable indicator of savanna health because changes in the number and size of trees can signal a shift from savanna to grassland or forest. Savanna diameter distributions have traditionally been monitored with forestry techniques, where stem diameter at breast height (DBH) is measured in the field within defined sub-hectare plots. However, because the spatial scale of these plots is often misaligned with the scale of variability in tree populations, there is a need for techniques that can scale-up diameter distribution surveys. Dense point clouds collected from uncrewed aerial vehicle laser scanners (UAV-LS), also known as drone-based LiDAR (Light Detection and Ranging), can be segmented into individual tree crowns then related to stem diameter with the application of allometric scaling equations. Here, we sought to test the potential of UAV-LS tree segmentation and allometric scaling to model the diameter distributions of savanna trees. We collected both UAV-LS and field-survey data from five one-hectare savanna woodland plots in northern Australia, which were divided into two calibration and three validation plots. Within the two calibration plots, allometric scaling equations were developed by linking field-surveyed DBH to the tree metrics of manually delineated tree crowns, where the best performing model had a bias of 1.8% and the relatively high RMSE of 39.2%. A segmentation algorithm was then applied to segment individual tree crowns from UAV-LS derived point clouds, and individual tree level segmentation accuracy was assessed against the manually delineated crowns. 47% of crowns were accurately segmented within the calibration plots and 68% within the validation plots. Using the site-specific allometry, DBH was modelled from crown metrics within all five plots, and these modelled results were compared to field-surveyed diameter distributions. In all plots, there were significant differences between field-surveyed and UAV-LS modelled diameter distributions, which became similar at two of the plots when smaller trees (<10 cm DBH) were excluded. Although the modelled diameter distributions followed the overall trend of field surveys, the non-significant result demonstrates a need for the adoption of remotely detectable proxies of tree size which could replace DBH, as well as more accurate tree detection and segmentation methods for savanna ecosystems.

Graphical Abstract

1. Introduction

Savannas are a globally important biome that cover around one-fifth of the earths land surface [1,2]. Defined by a discontinuous tree layer with a grassy understorey, savanna structure sits on the continuum between forests and grasslands [3,4], and changes to disturbance regimes and biophysical conditions can alter tree populations to the extent that they switch to a different vegetation type entirely [5,6]. For example, long-term savanna fire exclusion has led to increases in stem density, often causing vegetation to shift to forests [7]. Likewise, persistent high-intensity fires can limit the growth of trees to larger size-classes, reducing canopy cover and shifting vegetation toward more open grasslands [8]. The fact that changes in the size and density of savanna trees can signal a shift to different vegetation types demonstrates the value of these attributes as indicators of savanna health.
The size and density of savanna trees have often been assessed with field-based inventory of diameter distribution, where the diameter at breast height (DBH, generally at 1.3 m above ground level) and frequency of trees are measured within defined sub-hectare plots [9,10,11]. Field-surveyed diameter distributions can provide insight into processes such as recruitment rates and demographic bottlenecks [12], and allow for an inference as to which disturbance regimes or biophysical conditions are driving these processes. However, there is a growing argument that small plots are incompatible with the scale of variability in savanna tree populations. Staver [13], for example, reasoned that sub-hectare plots are too small to adequately monitor savanna tree populations, which are structured by processes that operate over tens to thousands of hectares. The mismatch in spatial scale between the processes that shape savanna tree populations and the scale of field inventory surveys raises questions about the validity of conclusions drawn from small-scale plots. As such, to improve the reliability of savanna structure monitoring, there is a recognized need to develop tools and techniques that can rapidly, reliably and cost-effectively monitor the diameter distribution of savanna tree populations over large spatial extents.
As field-based census surveys are slow, labor-intensive, and cover a limited spatial extent, remote sensing may provide a more feasible means to measure the diameter distributions of savanna structure at the landscape scale. The production of accurate three-dimensional point clouds makes Light Detection and Ranging (LiDAR) a well-suited technology for the remote detection of diameter distributions. While ground-based LiDAR produces very precise models, aircraft laser scanners (ALS) and uncrewed aerial vehicle laser scanners (UAV-LS, also known as drone-based LiDAR) can efficiently scan large areas, making them well-positioned to capture savanna structure over large spatial extents. There have been efforts to model diameter distribution by parameterizing probability density functions, such as Weibull models, with ALS data [14]. However, these approaches operate at the stand level, and ignore individual tree level detail. The delineation of individual tree crowns from LiDAR point clouds has recently been made possible by the development of tree segmentation algorithms, many of which are accessible within open-source software. For example, the algorithms of Dalponte [15], Silva [16], and Li [17] are available within the lidR [18] R package, and the AMS3D algorithm [19] is available within the MeanShiftR [20] R package. The fact that allometric scaling relationships often exist between tree crown metrics such as crown diameter, height, and the compound variable of height multiplied by crown diameter (HCD) and DBH [21] presents a framework for the individual tree level assessment of diameter distribution from the air.
Despite the prospect of applying airborne LiDAR to assess diameter distributions at the individual tree level, attempts to do so have generally resulted in a low agreement between remotely sensed and field-based surveys, with diameter distributions modelled from ALS or UAV-LS often under-representing the frequency of smaller trees. For example, Dalponte’s [22] segmentation of an ALS derived canopy height model and subsequent calculation of DBH from tree crown allometry led to around 10% of small (<10 cm DBH) trees being accurately detected in boreal and temperate forests in Europe. Additionally, using ALS, Goldbergs et al. [23] were unable to satisfactorily detect young trees (<10 m tall) in an Australian tropical savanna, which was attributed to the low point density of ALS point clouds. The under-detection of small trees has also been observed when using high-density UAV-LS point-clouds in settings where large overstorey trees occlude smaller understorey trees. For example, Torresan et al. [24] applied a dense UAV-LS point cloud collected in a dense mixed forest in Italy, and showed the under-segmentation of small understorey trees. However, Camarretta et al. [25] used UAV-LS data to model DBH across all size-classes in a restored Eucalypt forest in Tasmania, Australia. Using crown diameter and height as predictor variables, they observed an R2 of 0.8 between measured and modelled DBH, demonstrating the potential of UAV-LS to produce accurate individual tree level DBH predictions. As savannas are relatively open systems, and UAV-LS can collect hundreds or even thousands of points per m2 [26], the application of these data in savanna woodlands could result in high rates of segmentation accuracy, particularly for smaller trees, when compared to studies that have relied on ALS data or have studied dense forests. Additionally, strong relationships between crown metrics and DBH have been demonstrated in savannas [21,27,28], paving the way for the modelling of diameter distribution with UAV-LS in savannas.
The segmentation of individual trees from UAV-LS point clouds and subsequent application of crown-DBH allometry presents a promising framework to scale-up inventory surveys of diameter distribution, yet this approach remains untested in savannas. The objective of this study was to assess the potential of UAV-LS derived point-clouds to provide rapid and cost-effective estimates of diameter distribution in savannas through the use of crown segmentation and the development of crown-DBH allometric scaling models. We developed a UAV-LS model of diameter distribution in a savanna woodland in northern Australia, and compared the modelled results to those collected by field-surveys. Given the high density of UAV-LS point clouds, open nature of savannas, and the previously demonstrated allometric scaling relationships between savanna crowns and DBH, we hypothesized that the UAV-LS model would successfully predict diameter distributions at the plot level.

2. Materials and Methods

2.1. Study Site

The study site consisted of five one-hectare plots within Kakadu National Park in northern Australia (Figure 1a). These plots were established as part of efforts to guide the restoration of the Ranger Uranium mine, which sits on Aboriginal land (Mirarr country). Sites were selected using randomized points generated within previously mapped land unit polygon of “undulating upland terrain” [29]. These points were then visited by field teams, and one-hectare plots were established following the AusPlots rangeland survey protocol [30]. More details on the establishment of these plots can be found in Hernandez-Santin et al. [31]. Vegetation in the plots is typical of the Eucalyptus savanna woodland of northern Australia, with an overstorey characterized by E. miniata, E. tetrodonta, and Erythrophleum chlorostachys, and an understorey characterized by annual grasses, primarily Sorgum spp. A suite of drone-based remote sensing and field-survey data were collected to assess the vegetation within these plots. For this study, field inventory of DBH, species and location (Figure 1c), and drone-based LiDAR data (Figure 1b) were collected from all five one-hectare plots, with two plots used for calibration and model development (C1 and C2) and three further plots used for validation (V1, V2 and V3). The validation plots were withheld from both the allometry development and parametrization of the segmentation algorithm, allowing for the independent assessment of model accuracy.

2.2. Remote Sensing Data Collection

UAV-LS point clouds were collected using the nextcore® system (https://www.nextcore.co/ (accessed on 1 March 2021)) which relies on a Quanergy M8 discreet return LiDAR sensor integrated with a DJI Matrice 600 pro UAV. Data were collected between April 2019 and July of 2020, and because tree structure does not change rapidly in the absence of severe disturbance, data from different collections and field surveys are considered to be equivalent. The drone was flown at speeds of 4–5 m s−1 at approximately 40 m above ground level with line spacing of between 16 and 23 m. The sensor pulse rate was 1.2 M points s−1, which resulted in average point densities of between 1423 and 747 points per m2 within the one-hectare plots. Points were geo-registered using the proprietary Nextcore® software.
The lidR [18] package was used to clean the point clouds and generate canopy height models (CHM) as follows. First, outliers caused by sensor error or physical interference (birds, for example), were removed using a noise filter that removed the top and bottom 1% of points within 10 m2 grids. Then, to ensure consistency among plots flown with slightly different flight parameters, point clouds were decimated to the 25th quantile of point density for the plot with the lowest point density, which gave a final point density of 438 points per m2 for all five plots. Figure A1 (Appendix A) shows the point densities of each plot prior to decimation.
After decimation, ground points were classified using a cloth simulation filter with a resolution of 0.2 m, with these ground points then used to normalise all points relative to ground level. The normalised point cloud was then rasterised to form a canopy height model (CHM) with a resolution of 0.2 m using the pit free algorithm [32], where the highest elevation values for different height thresholds are selected to avoid “pitting” within the canopy. Given the maximum heights did not exceed 20 m in these plots, we used thresholds of 0, 4, 8, 12, 16 and 20 m.

2.3. Field Data Collection

Spatially resolved DBH data were required to develop allometric equations relating UAV-LS derived crown metrics to DBH, and to compare field surveyed with UAV-LS modelled diameter distribution at the plot level. Field DBH data were collected for trees >3 cm DBH using a Leica Viva GS16 GNSS with the Leica CS20 Controller (dGPS), with location saved when the recorded accuracy was below 1 m. The DBH, species and location of all trees within the five one-hectare plots were recorded during field surveys in May and June of 2020. Data were imported into ArcGIS Pro 2.5 (ESRI, Redlands, CA, USA), where all multi-stemmed trees (which were recorded on the same data point), were combined into a single tree DBH value by taking the square root of the sum of the squares of individual stem DBH values, as has been done in previous forestry studies (e.g., [33]). Across the five plots, the DBH, species and location of 2619 trees was recorded, with 522 and 696 from within the two calibration plots C1 and C2, respectively, and 385, 402 and 614 from within the three validation plots, V1 and V2 and V3, respectively.

2.4. Data Analysis Overview

There were three main steps in the workflow to model plot level diameter distributions with UAV-LS derived point clouds; (1) modelling, (2) estimation and (3) validation, which are summarised in Figure 2. To model DBH from remotely sensed data, crown polygons were traced from tree crowns which were clearly visible in the canopy height model, then allometric scaling equations were developed to relate crown metrics from these polygons to the associated field-surveyed DBH. To automatically estimate individual tree crown statistics from the LiDAR point clouds, the point-cloud based segmentation algorithm AMS3D [19] was applied to delineate the tree crowns within the plot, then the best performing allometric equation was applied. For validation, segmentations were compared with manually delineated crowns, and the plot-level diameter distributions were assessed against field derived DBH census surveys.

2.5. Modelling

2.5.1. Manual Delineation of Individual Tree Crowns (mITC)

Manually delineated individual tree crown polygons (mITCs) were required to develop allometric equations between crown metrics and DBH. To generate crown polygons, we overlaid the spatially resolved field-survey data with the canopy height model (CHM) within ArcGIS Pro 2.5 (ESRI, Redlands, CA, USA). Then, we matched trees surveyed in the field with those which were clearly visible within the CHM. Crown outlines were manually traced from the CHM, and each polygon was associated with a corresponding field surveyed DBH value. A height value for each mITC was calculated by extracting the maximum CHM height covered by the crown polygon. As only a sub-set of crowns could be visually separated from surrounding trees, a total of 205 trees crowns from within the two calibration plots (C1 and C2), and a further 98 crowns from the three validation plots (V1, V2 and V3), were manually delineated. Crown diameter and crown radius were then approximated from crown area.

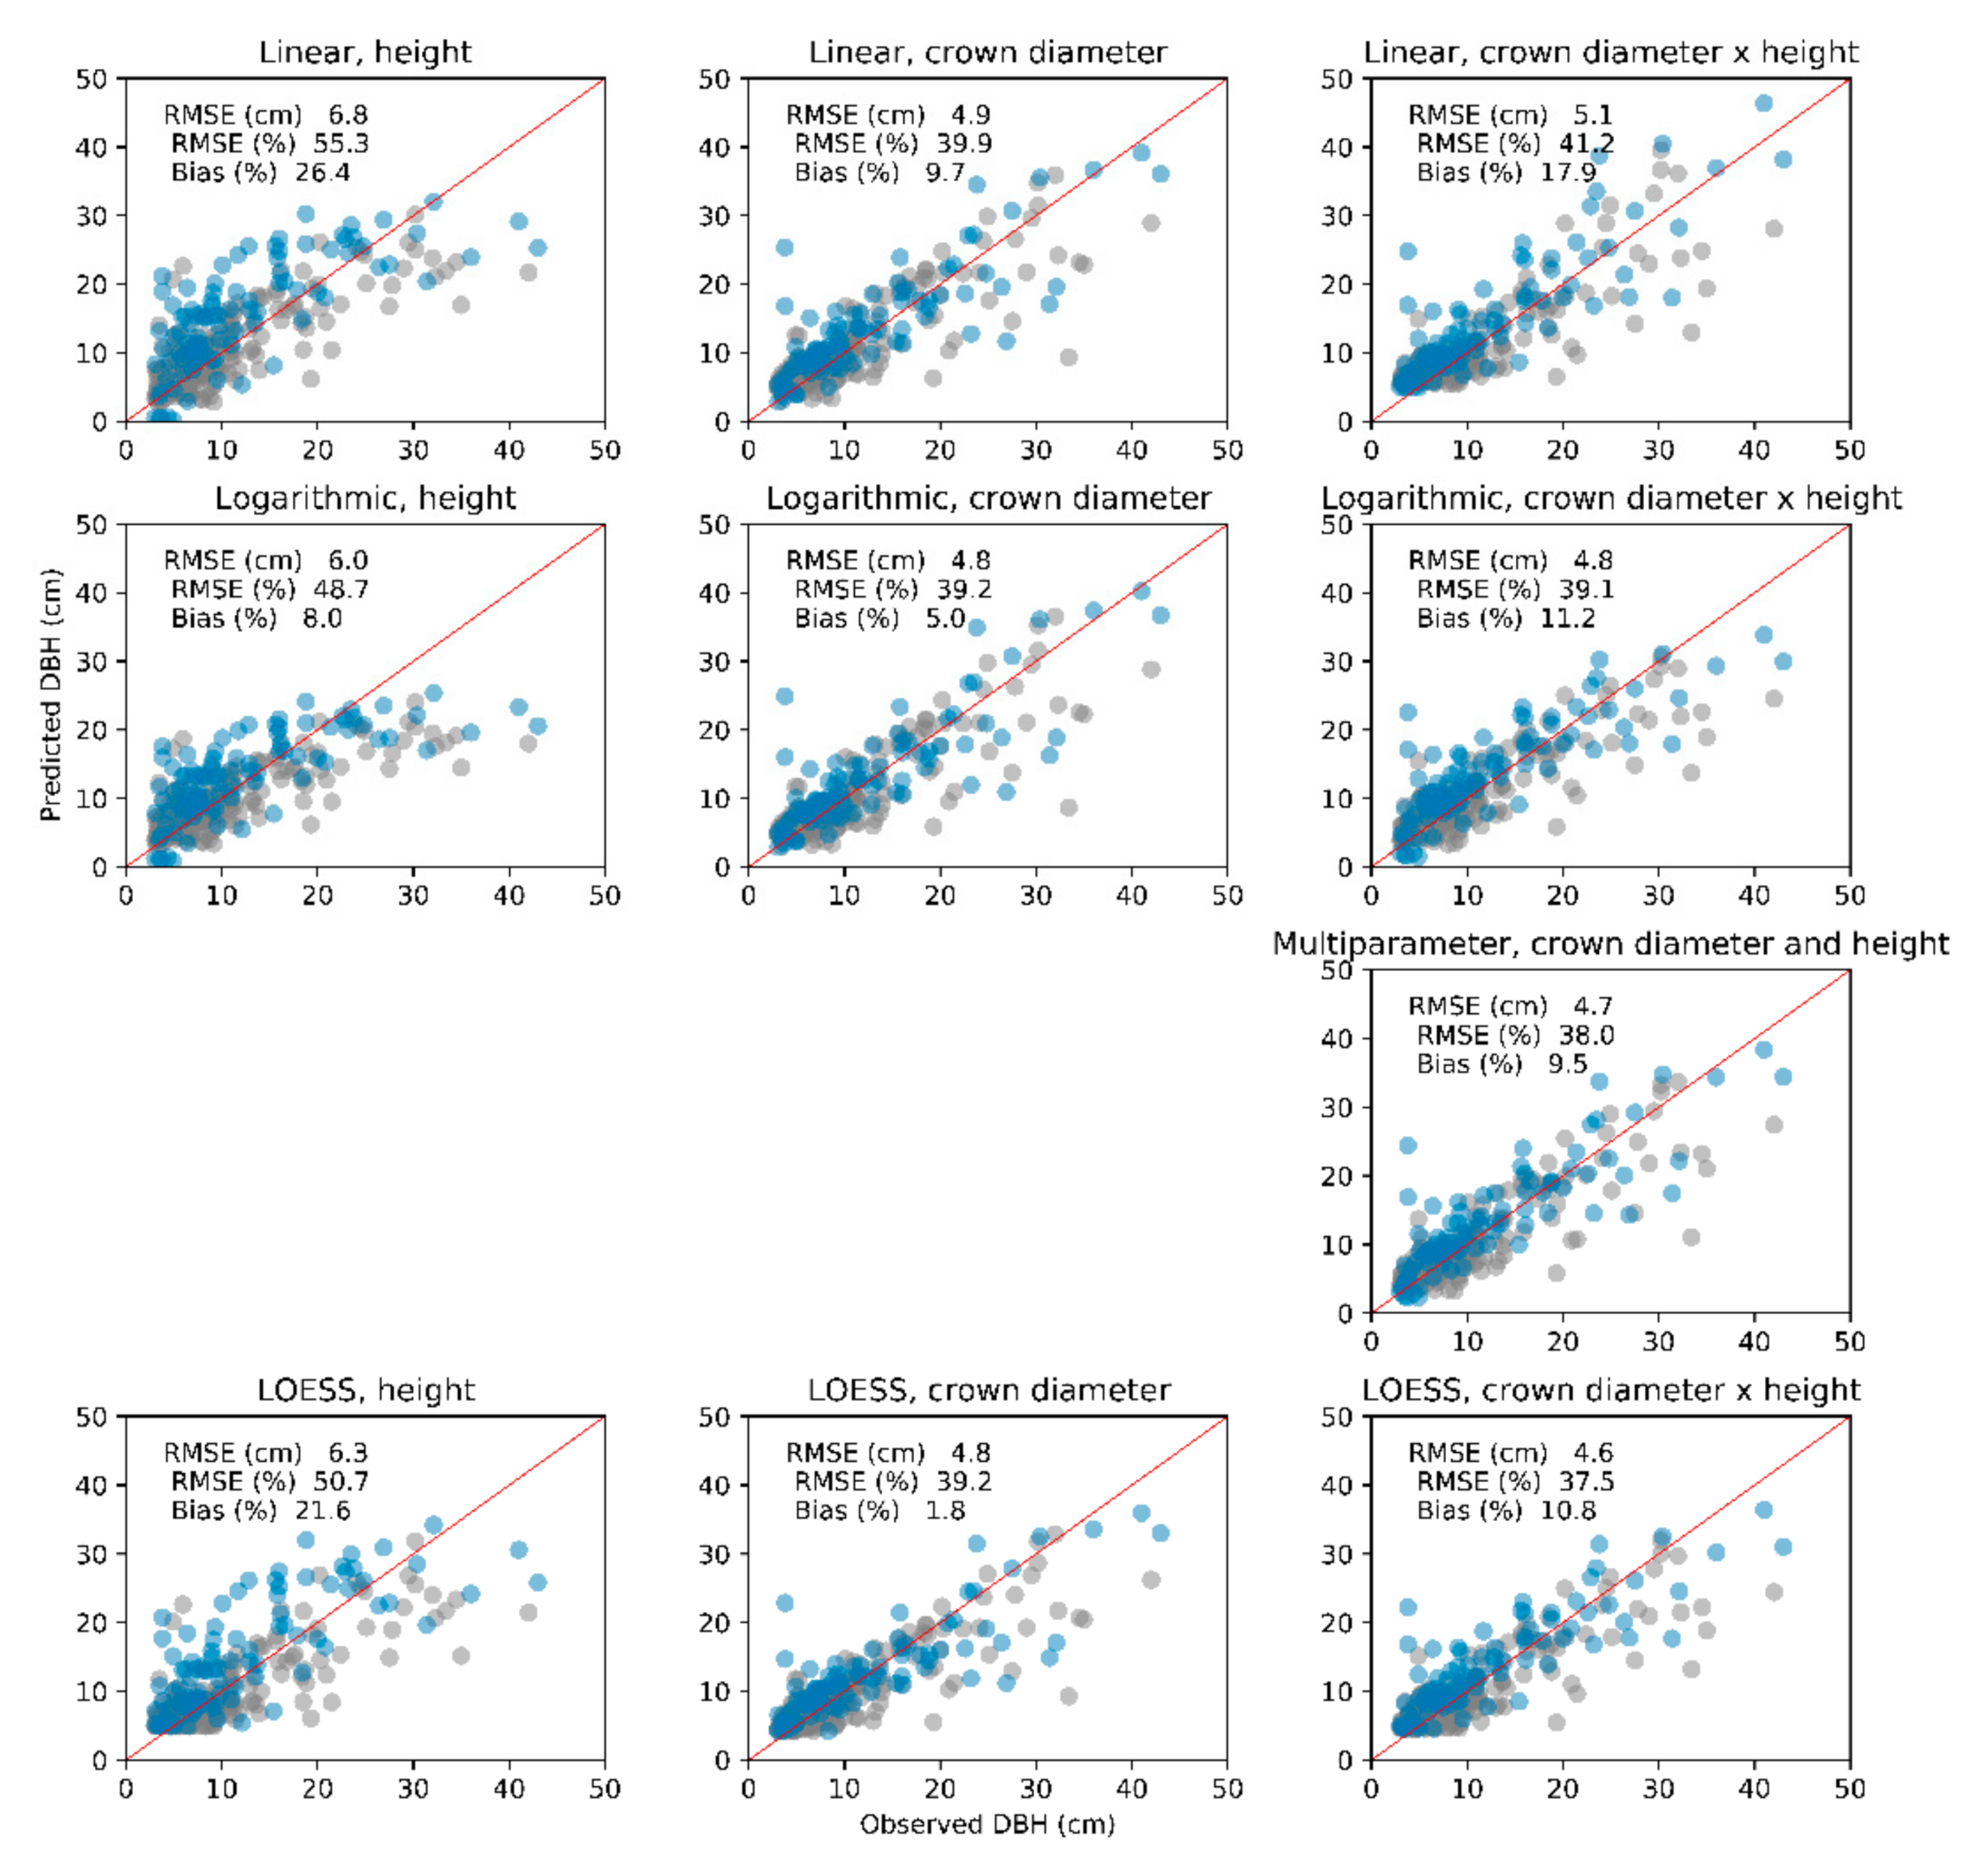
2.5.2. Development of Site-Specific Allometric Scaling Equations Linking Crown Metrics to Field Derived DBH

Hand annotated mITCs and associated field-surveyed DBH from the two calibration plots were used to develop allometric scaling relationships to predict DBH from crown statistics. To explore the suitability of different model forms and predictor variables, crown diameter (CD), crown height (H), and the compound variable of height multiplied by crown diameter (HCD) were applied in three parametric and one non-parametric model forms. Single parameter linear regressions were tested using all three predictors separately (Equation (1)), single parametric logarithmic models were tested with all three predictor variable separately, (Equation (2)), and a multi-parameter logarithmic model (Equation (3)) was tested using H and CD as the predictors. These models were applied using the ordinary least squares function within Python statsmodels [34] module.
DBH =   0 + 1 ×   H , CD , CDH
ln DBH   =   0 + 1 × ln H , CD , CDH
ln DBH   =   0 + 1 × ln H   + 1 × ln CD
In addition to the above parametric regression models, the non-parametric local weighted polynomial (LOESS [35]) model was applied using all three predictor variables separately. The LOESS smoothing function was fitted using the Python statsmodels [34] LOWESS function, with the frac variable (fraction of dataset used in locally weighted smoothing), set at 0.3. The SciPy [36] interpolation function was then applied to predict DBH with the LOESS model. To assess the accuracy of these models, we applied each model to the independent validation dataset and calculated root mean square error (RMSE) and bias. The model with the lowest bias and RMSE was used in the proceeding analysis.

2.6. Estimation

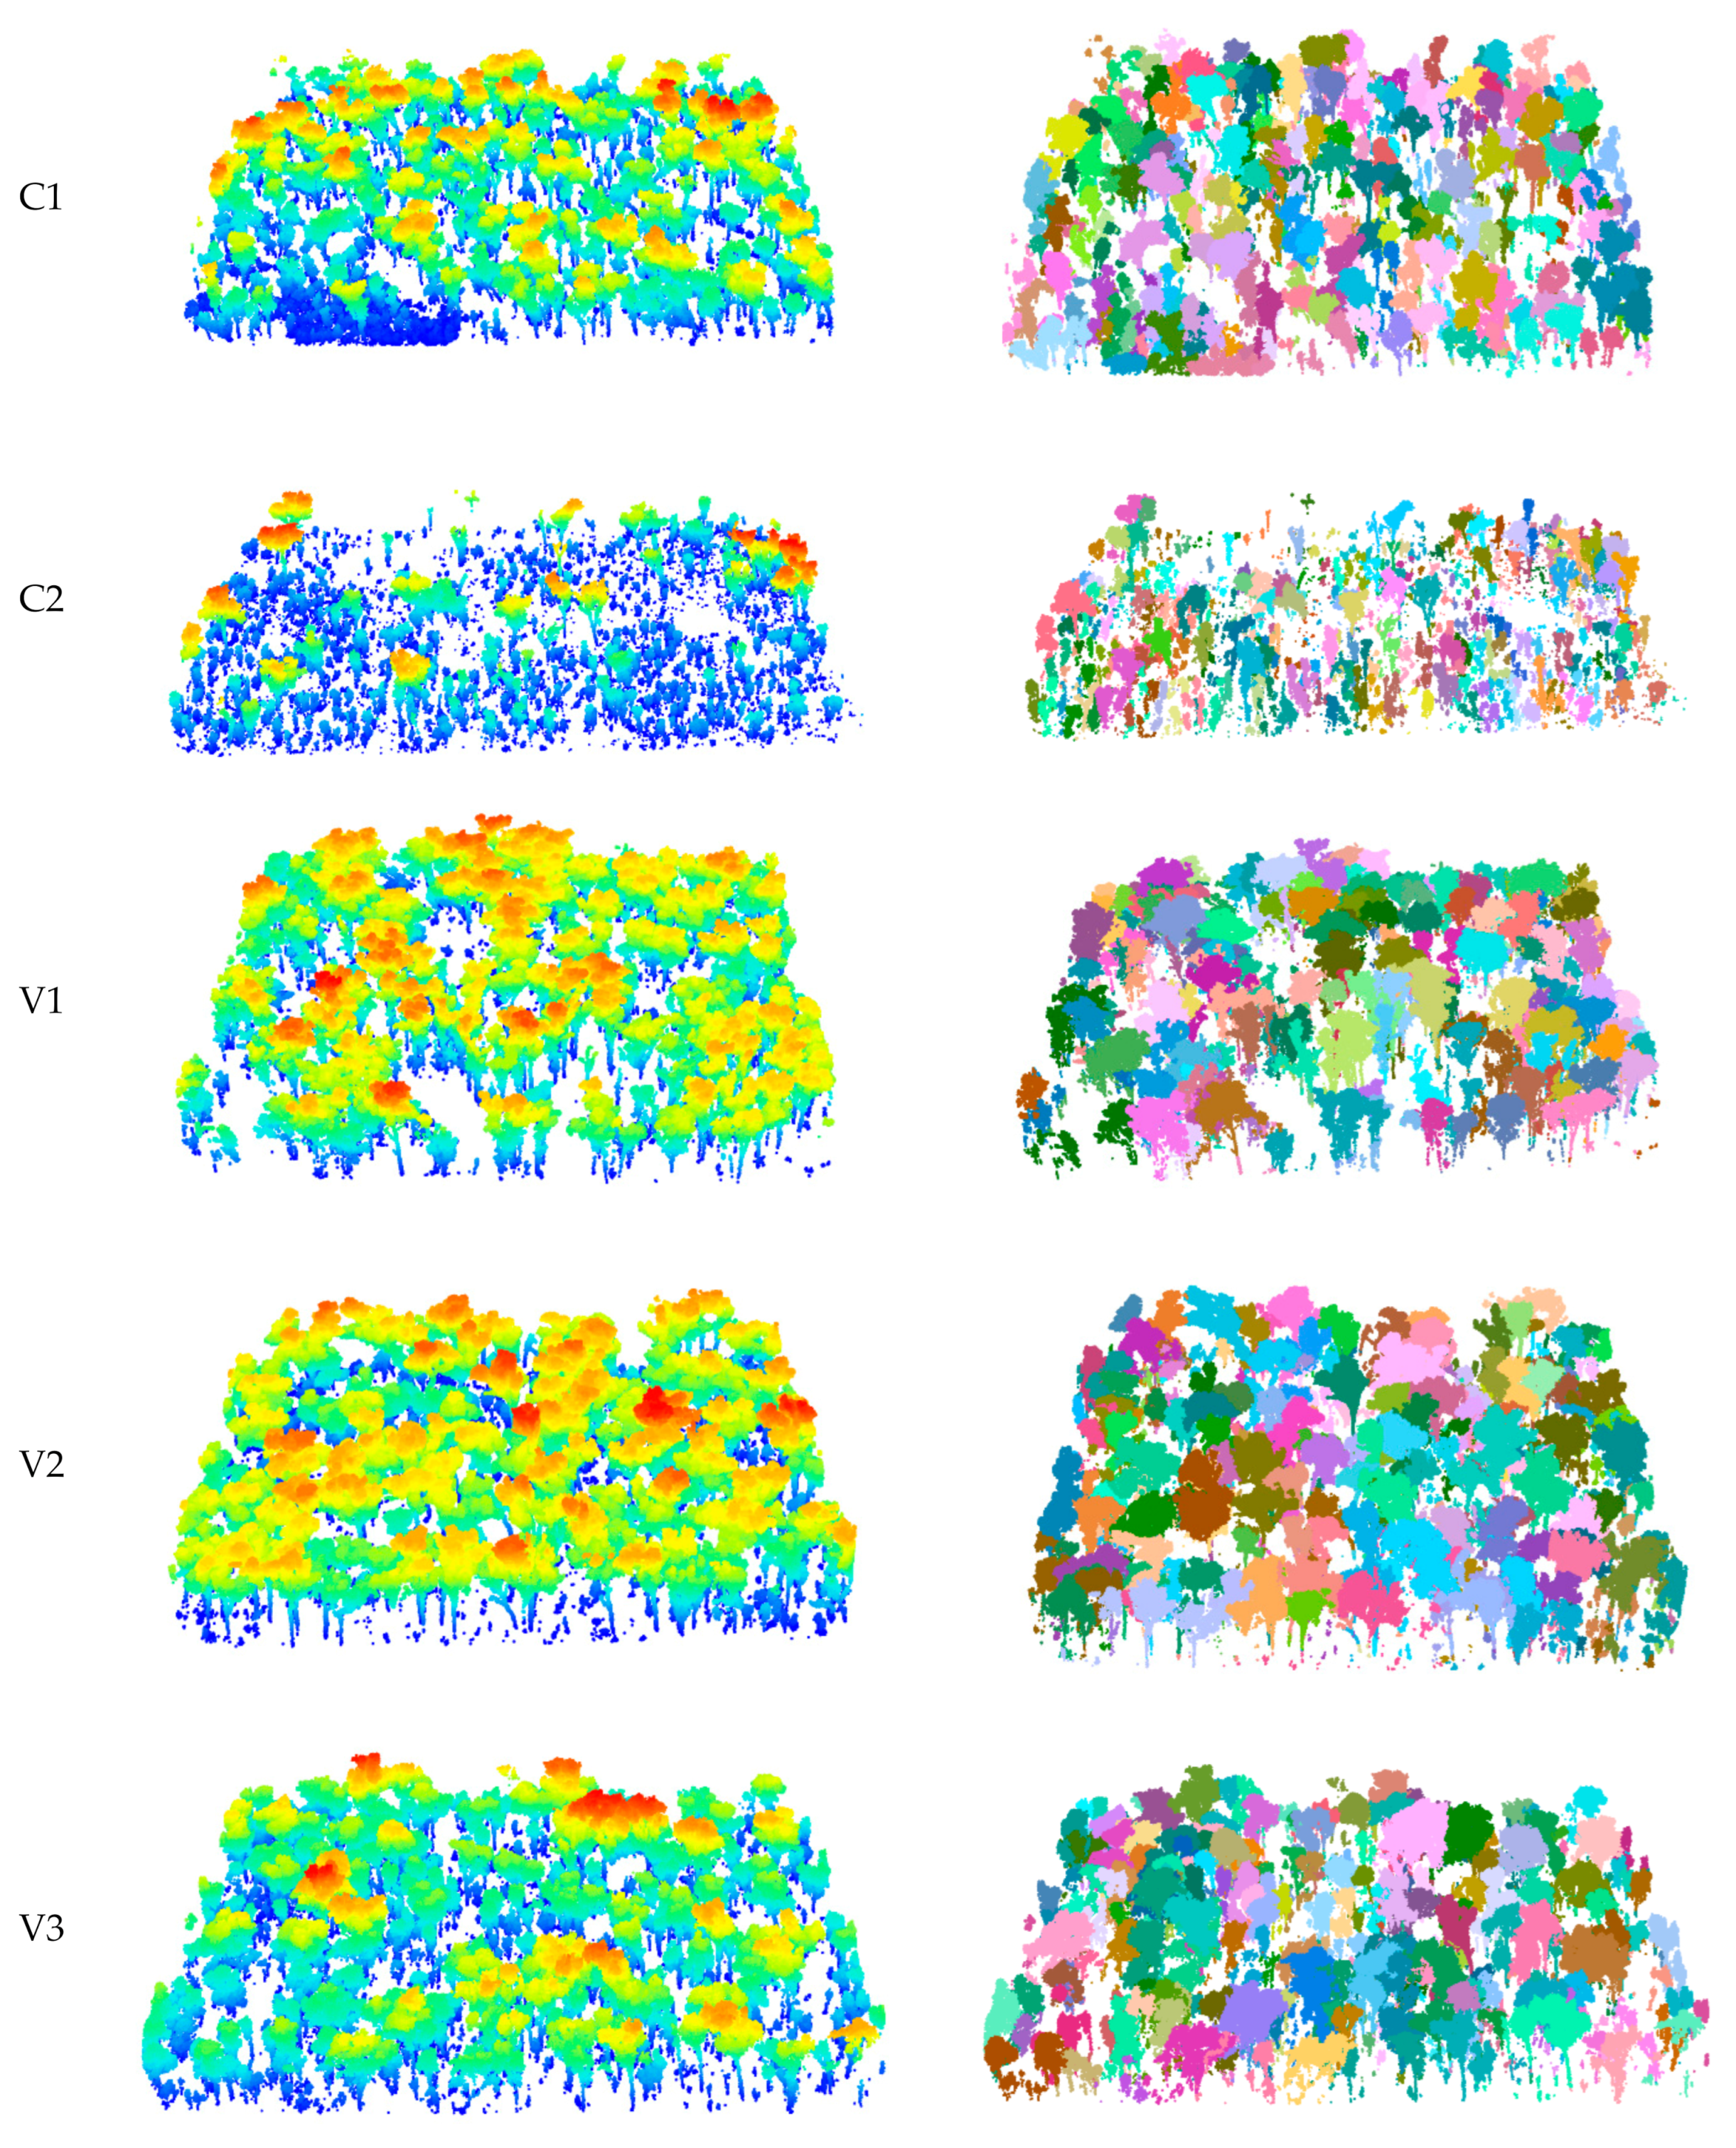
2.6.1. Automatic Segmentation of Individual Tree Crowns (aITCs)

In order to automatically delineate individual tree crowns from the point clouds, we applied the adaptive mean shift 3D (AMS3D [19]) segmentation algorithm, which had the highest accuracy in a recent comparison of segmentation methods [37]. The AMS3D algorithm, which decomposes point clouds into clusters representing individual tree crowns, was applied within the R package MeanShiftR [20]. This model requires two input parameters; the ratio of tree height to both crown length (H2CL) and crown diameter (H2CD). To calculate H2CL, we clipped the point clouds of individual trees using mITC polygons from the two calibration plots within the lidR R package [18]. Then, we applied a similar approach to [38,39] to calculate crown basal height from the quantiles of the heights of the point clouds. Briefly, all points below 2 m high were removed, then crown basal height (CBH) was approximated by dividing the elevation values of each point within the mITC polygons into 5% height quantiles. The upper quantile of the largest gap in point frequencies was assigned as the crown basal height (Figure 3a), excluding quantiles over 80%. Finally, crown length was calculated by subtracting CBH from the maximum crown height as extracted from the CHM. Crown width was then calculated from crown area. To calculate the height to crown width and crown length ratios required, linear regression models were developed relating both crown length and diameter to tree height, with the origin forced through zero (Figure 3b,c).
The AMS3D algorithm was then applied in “classic” point cloud mode using normalized point clouds. In order to improve computation speed, all ground points were removed, and the algorithm applied to each plot. Once points were segmented into individual trees, the delineate_trees function within lidR [18] was applied to fit polygons around each ITC. Further filtering was required, as the segmentation resulted in the classification of small clusters of points as individual trees. To remove these polygons, the total number of points as well as the ratio of number of points to crown height and area were used to filter out polygons incorrectly assigned as trees. All polygons with a point number to crown area ratio of less than 60, a height to number of points ratio of greater than 0.05, and a total number of points of less than 50 were removed, with these parameters developed through a process of trial and error. The center of each crown was then calculated, and all crowns whose central points did not originate within the one-hectare plot were removed, which allowed for tree crowns to extend beyond the plot boundary when their central point was within the plot.

2.6.2. Application of Allometric Scaling to Predict DBH

Automatically segmented crown polygons were exported from R to ArcGIS Pro 2.5 (ESRI, Redlands, CA, USA), where crown diameter was calculated from area, and height was calculated using the highest value of the underlying canopy height model. Then, the best performing allometric equation was applied to predict DBH from crown statistics across all five plots.

2.7. Validation

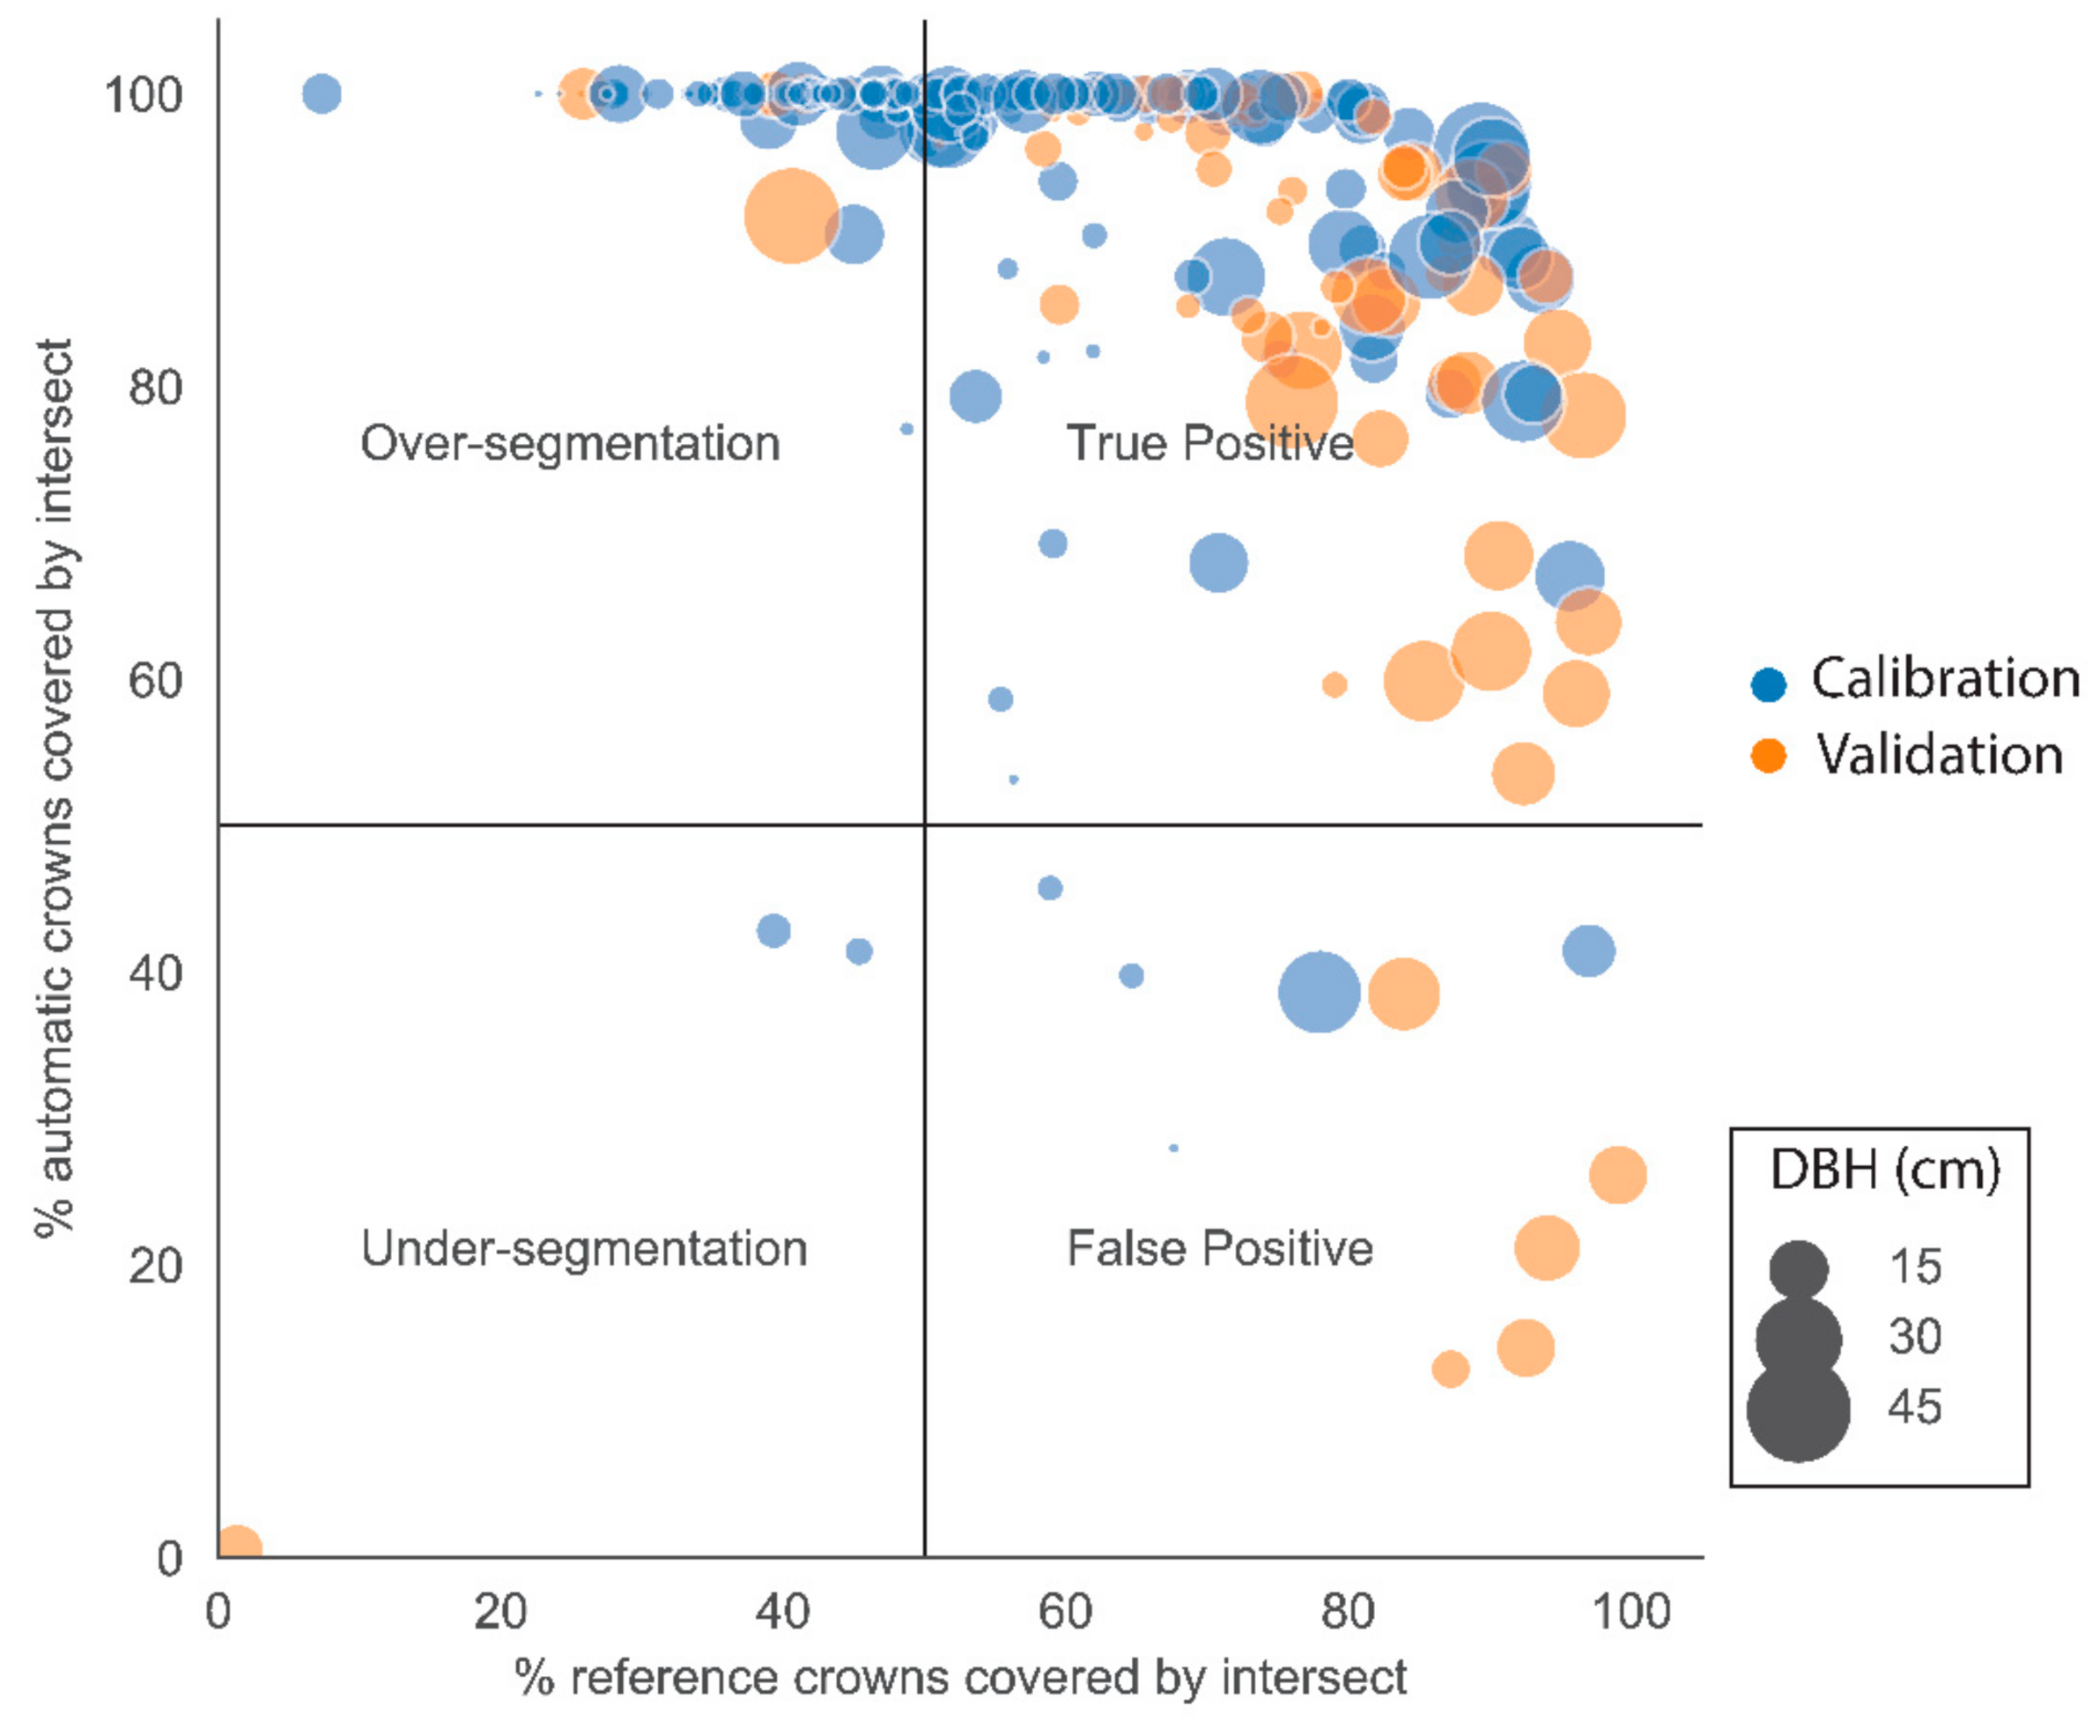
2.7.1. Individual Tree Segmentation Accuracy Assessment

Automatically segmented crown polygons were imported into ArcGIS Pro 2.5 (ESRI, Redlands, CA, USA), where the overlap between automatically and manually segmented crowns was classified as either over-segmentation, under-segmentation, false positive or true positive, following Hastings et al. [40]. As the mITCs from the calibration plots were used to parametrize the segmentation model, the accuracy assessment was also applied to the mITCs from the validation plots to allow for independent validation. In cases where there was more than one automatically segmented crown for a single manually segmented tree (i.e., with over-segmentation), the automatically segmented crown which covered the largest fraction of the manually segmented crown was used in proceeding analysis. Individual tree level tree detection rates were then calculated as the percentage of manually delineated crown which were overlaid with an automatically delineated crown. Where the segmentation overlap was >50% for both automatically and manually segmented crowns, the segmentation was considered a true positive, and the overall detection accuracy of the crown segmentation was scored using the formula:
A = n TP N
where A is segmentation accuracy, nTP is the number of true positives and N is the total number of manually segmented crowns [41].
In order to assess the segmentation accuracies among different tree sizes, accuracies were also calculated for <10 cm, 10–20 cm, and >20 cm DBH size classes.

2.7.2. Plot Level Diameter Distribution Validation

At the plot level, the proportion of field surveyed DBH correctly predicted with the UAV-LS model was calculated for the DBH size classes of <10 cm, 10–20 cm and >20 cm. The measured and modelled density distributions were also compared visually by dividing the data into 5 cm bin sizes, and plotting both measured and modelled diameter distributions for each plot. These diameter distributions were then compared using two-way Kolmogorov–Smirnov tests [42], with the ks_2samp function available in the scipy Python package [36]. When the p value was less than 0.05, the measured and modelled diameter distributions were considered to be significantly different. To investigate the impact of excluding smaller size classes on the results, these tests were first applied to all size classes, then the >10 cm and >20 cm size classes.

3. Results

3.1. Development of Allometry to Predict DBH from Crown Metrics

The performance of the models relating field-surveyed DBH to the crown diameter, tree height, and the compound variable of height x crown diameter (HCD) (derived from crown polygons which could be manually delineated from the CHM) is shown in Figure 4, with derived regression parameters for the parametric models shown in equations Appendix B (Equations (A1)–(A7)). Models that relied on height alone tended to perform poorly for larger trees, and resulted in higher RMSE and bias. Overall, error was relatively high, with RMSE of between 37.5% and 55.3%. Although the RMSE of the LOESS crown diameter model was slightly higher than the LOESS model relying on crown diameter and height, the bias of the LOESS crown diameter model was considerably lower (1.8%). As such, this was considered the best performing model overall and was used in proceeding analyses.

3.2. Individual Tree Level Segmentation Accuracy Assessment

Of the manually delineated crowns which could be distinguished from the CHM, detection rates were high, with 89% of the manually delineated crowns in both the validation and calibration plots overlapping with automatically delineated crown. When the accuracy assessment was conducted, a total of 47% of crowns within the two calibration plots were accurately detected (>50% overlap between calibration and validation crowns), with 68% within the validation plots (Table 1). Segmentation accuracy was generally lower for smaller stems, with the accuracies for the largest trees exceeding 80% for both the calibration and validation plots. Of the errors, the majority were caused by the apparent over-segmentation of smaller trees (Figure 5).

3.3. Plot Level Tree Detection and Diameter Distribution Accuracy Assessment

The difference in the number of surveyed and modelled trees varied among plots, and there was no clear trend of over or under-detection. Likewise, for the different size classes, the percentage of trees accurately modelled for each size class varied among plots, with no clear trend evident (Table 2).
The diameter distributions of UAV-LS modelled DBH appeared similar to field-surveyed DBH across all five plots (Figure 6c), although results of the KS test showed that at the plot level, UAV-LS and field-surveyed DBH were significantly different at all plots when all size-classes were included (Table 3). When trees with DBH <10 cm were excluded from these tests, there was no significant difference between UAV-LS and field-surveyed DBH at C1 and V3, and for DBH sizes over 20 cm, there was no significant difference between UAV-LS and field-surveyed DBH for C1, V2 and V3. The point clouds of all five plots both before and after segmentation are displayed in Figure A2 (Appendix A).

4. Discussion

Savannas are heterogeneous ecosystems, and monitoring savanna structure requires techniques that can capture tree populations over ecologically relevant spatial scales. In this study, we set out to test the application of high-density UAV-LS derived point clouds to predict the diameter distribution of savanna trees. Despite the development of site-specific allometric equations and the segmentation of dense, accurate point clouds, we were unable to accurately emulate field surveyed diameter distributions with the application of a UAV-LS model. The prediction of diameter distributions with UAV-LS point clouds is a complex task and errors propagate at each step, with the main steps being the allometry linking crown metrics to DBH and the tree detection and segmentation algorithms.
Allometric scaling equations that relate tree height and crown size to DBH are an important component of models that predict diameter distribution from UAV-LS data. We found that models relying on height alone consistently failed to accurately estimate the DBH of larger trees, demonstrating that diameter continues to increase once a maximum height is reached. Models that relied on crown diameter tended to result in the lowest bias and error, although it is worth noting that RMSE was high (>37%) for all of the models tested, demonstrating the instability of the relationship between crown dimensions and DBH. This finding is contrary to global syntheses [21], where crown statistics were found to be strong predictors of DBH across global biomes including savannas. At the plot level, however, variability in the relationship between crown size and DBH was recently demonstrated through the use of TLS in a north Australian savanna [43]. Such inconsistent allometry is likely to be driven by a combination of wind, lightning, termite and fire damage, all of which are persistent disturbances in north Australian savannas [44]. While this variability limits our ability to predict DBH from UAV-LS data, it also exposes a shortcoming in the use of field-derived DBH as a proxy for tree size. Rather than predicting tree DBH from crown statistics, tree size frequency distributions could be derived using height or crown area as proxies for tree size (Figure 7). Similarly, tree size can be accurately derived with the use of quantitative structure models [45], which have been developed for TLS datasets. By providing more comprehensive assessments of tree size, these alternatives to diameter distributions could provide a more robust approach to remotely measuring size class distribution which is not reliant on allometric scaling.
As well as allometric scaling, accurate detection and segmentation of tree crowns is also required to predict DBH from UAV-LS point clouds. If a model under or over detects the number of individual trees, this will inevitably flow through to errors in the modelled diameter distribution. Likewise, under or over segmentation of crowns, even when correctly detected, will result in the assignment of trees to incorrect diameter categories after allometric scaling is applied. At the individual tree level, we found that tree detection rates were high with the application of the AMS3D algorithm (89% of the manually delineated crowns clearly visible from the CHM overlapped with automatically detected crowns in both calibration and validation plots), although when the tree level segmentation accuracy assessment was conducted, the model was less accurate (average of 47 and 68% accurately segmented for calibration and validation plots, respectively). This was primarily the result of over-segmentation, which leads to the under-estimation of crowns size. This was mainly observed in smaller trees, where for the larger size classes of 10–20 cm and >20 cm, accuracies were all between 60% and 86%. The pattern of under-segmentation of small trees was reflected in the plot level comparison, with the exclusion of smaller trees resulting in significant similarities between UAV-LS modelled and field surveyed diameter distributions.
The accurate segmentation of small trees is notoriously difficult with airborne LiDAR data, with smaller size classes routinely excluded from analysis and accuracy assessments. For example, ref. [37] excluded all stems with a DBH of below 10 cm in an individual tree level comparison of performance amongst algorithms, where they found accuracies of 73.8% using AMS3D. Likewise, ref. [40] excluded understorey trees to find segmentation accuracies of between 51% and 59% using a range of segmentation methods. Plot level comparisons of diameter distribution have similarly suffered from low accuracy for small trees, with [22] showing that small stems were drastically underestimated by a raster-based segmentation model. While the removal of small stems did improve both individual tree and plot level model accuracy, understanding the dynamics of small trees is crucial to monitoring savanna trends such as recruitment bottlenecks. Even if alternative measures of tree size, such as crown area or wood volume, were adopted, the accurate segmentation of individual trees is critical to assessing vegetation structure and remains an important challenge.
Savannas cover a large proportion of the earth’s land surface, and proper management of these ecosystems will be required to meet global initiatives such as the United Nations sustainable development goals. In particular, goal fifteen seeks to “protect, restore and promote sustainable use of terrestrial ecosystems, sustainably manage forests, combat desertification, and halt and reverse land degradation and halt biodiversity loss” [46]. As savannas are patchy, monitoring and generalizing their structure is challenging using established techniques, presenting a need for the development of improved methods. While the UAV-LS models differed significantly from field surveyed diameter distributions, modelled data still offers useful insights into the tree population structure. For example, it is clear from the modelled data that there is a high frequency of small trees in plot C2 relative to the other plots. Such interpretation could facilitate an improved understanding of the impact of management actions on savanna vegetation. Importantly, this could be assessed over large spatial scales, allowing for direct monitoring of ecosystem heterogeneity. As technology improves, the spatial scale of measurement and the accuracy of tree segmentation will inevitably improve, which could make these techniques an important tool in monitoring progress toward sustainable development goals [46].
Overall, we consider the priorities for improving drone-based surveys of savanna diameter distribution to be the refinement of segmentation algorithms, improvements to allometric scaling, and the adoption of new proxies for tree size. Refined segmentation algorithms are required because, despite the high-density point-clouds and relatively open savanna, we observed both over and under-segmentation of trees. Segmenting individual trees from point-clouds is an active area of research, with the development of three-dimensional deep learning architecture offering a promising option [47]. Improved allometric relationships are also required, because none of the scaling models used here reliably predicted DBH. The use of TLS as a calibration tool for drone-LiDAR [48] would allow the exploitation of three-dimensional LiDAR data rather than relying on two dimensional crown statistics, providing one approach to improve allometry. As savanna tree allometry is known to vary among species [49], further improvements could be achieved by first classifying species, for example through the application of deep learning techniques such as mask regional convolutional neural networks (mask R-CNN), see [50], then developing species-specific allometric models. While more accurate allometry would improve the relationship between modelled and field-derived DBH, an argument can also be made for moving away from DBH altogether. DBH has long been used as a proxy for tree size due to its convenience for field surveys, but other measures, such as crown area or tree volume, are better suited to remote measurement. The adoption of these measures would likely provide a more accurate proxy for tree size, while circumventing the need for allometry linking crown metrics to DBH. Nevertheless, these alternative measures of tree size still require accurate segmentation, which should remain a research priority.

5. Conclusions

This study set out to assess whether UAV-LS point clouds could be used to model the diameter distribution of savanna trees at the plot level. The process consisted of detecting and segmenting individual trees from high-density point clouds, before developing an allometric scaling relationship to relate manually segmented crowns to field measured DBH. This scaling model was then applied to segmented trees at the plot level. We reported relatively high error for all models linking DBH to crown size and height metrics, which was attributed to disturbance driven variability in savanna tree allometry. We reported relatively high tree detection and segmentation rates at the individual tree level, with most manually delineated crowns visible from the CHM segmented with the AMS3D model, although small trees were a challenge. When applied at the plot level, we found that there were significant differences between the modelled and field-survey results for all five plots when all size classes were included. We attribute this finding partly to the inconsistent scaling relationships between crown size and DBH, and partly to the under-segmentation or under-detection of smaller trees. The exclusion of smaller sized trees from the data set did result in significant similarities between modelled and measured diameter distributions, but not across all plots. While this work demonstrates the ability of UAV-LS to model the diameter distribution of larger trees, we also show the inability of these methods to emulate plot level diameter distributions. An important improvement in the assessment of savanna structure could involve replacing DBH measures with more comprehensive assessments of tree size, such as the application of quantitative structure models. Segmentation accuracy is likely to improve with the development of more sophisticated segmentation algorithms. Overall, these relatively minor developments would result in UAV-LS methods becoming a practical tool for the assessment of savanna tree population structure over ecologically relevant spatial scales.

Author Contributions

Conceptualization, M.L.M.R., S.R.L., R.E.B. and P.D.E.; methodology M.L.M.R.; software, M.L.M.R.; validation, M.L.M.R.; formal analysis, M.L.M.R.; investigation, M.L.M.R.; resources, R.E.B. and P.D.E.; data curation, M.L.M.R.; writing—original draft preparation, M.L.M.R.; writing—review and editing, M.L.M.R., S.R.L., R.E.B. and P.D.E.; visualization, M.L.M.R.; supervision, S.R.L., R.E.B. and P.D.E.; project administration, R.E.B. and P.D.E.; funding acquisition, R.E.B. and P.D.E. All authors have read and agreed to the published version of the manuscript.

Funding

This research was supported by the Australian Government, Department of Agriculture, Water and the Environment.

Data Availability Statement

The data generated in this study are available on request from the corresponding author. The data are not publicly available for ethical reasons.

Acknowledgments

We pay our respects to the Traditional Owners of Kakadu National Park and the Darwin and Brisbane regions where we conduct research and monitoring, and acknowledge Elders past, present and emerging. We also thank Jay Nicholson, Tim Whiteside and Dave Loewensteiner for assistance with data collection.

Conflicts of Interest

The authors declare no conflict of interest.

Appendix A

Figure A1. Boxplots of the point density within the five one-hectare plots prior to decimation.
Remotesensing 13 01266 g0a1
Figure A2. LiDAR point clouds of all five plots prior to segmentation (left) and after segmentation (right). In the left column, color represents height above ground level, and on the right column, colors represent individual trees.
Remotesensing 13 01266 g0a2

Appendix B

Results of the parametric models.
DBH = 0.6335 + 1.7532 H
DBH = 1.1322 + 3.9237 CD
DBH = 4.760 + 0.2385 HCD
ln ( DBH ) = 0.5902 + 0.9038 ln ( H )
ln ( DBH ) = 1.0391 + 1.1397 ln ( CD )
ln ( DBH ) = 0.6588 + 0.5546 ln ( HCD )
ln ( DBH ) = 0.8121 + 0.2896 ln ( H ) + 0.8653 ln ( CD )
where DBH is modelled DBH (cm), H is tree height (m), CD is crown diameter (m) and HCD is maximum crown height (m) multiplied by crown diameter (m).

References

  1. Scholes, R.J.; Archer, S.R. Tree-Grass Interactions in Savannas. Annu. Rev. Ecol. Syst. 1997, 28, 517–544. [Google Scholar] [CrossRef]
  2. Grace, J.; José, J.S.; Meir, P.; Miranda, H.S.; Montes, R.A. Productivity and Carbon Fluxes of Tropical Savannas. J. Biogeogr. 2006, 33, 387–400. [Google Scholar] [CrossRef]
  3. Sankaran, M.; Ratnam, J.; Hanan, N.P. Tree-Grass Coexistence in Savannas Revisited—Insights from an Examination of Assumptions and Mechanisms Invoked in Existing Models. Ecol. Lett. 2004, 7, 480–490. [Google Scholar] [CrossRef]
  4. Scheiter, S.; Higgins, S.I. Impacts of Climate Change on the Vegetation of Africa: An Adaptive Dynamic Vegetation Modelling Approach. Glob. Chang. Biol. 2009, 15, 2224–2246. [Google Scholar] [CrossRef]
  5. Lehmann, C.E.R.; Archibald, S.A.; Hoffmann, W.A.; Bond, W.J. Deciphering the Distribution of the Savanna Biome. New Phytol. 2011, 191, 197–209. [Google Scholar] [CrossRef]
  6. Murphy, B.P.; Bowman, D.M.J.S. What Controls the Distribution of Tropical Forest and Savanna? Ecol. Lett. 2012, 15, 748–758. [Google Scholar] [CrossRef]
  7. Woinarski, J.C.Z.; Risler, J.; Kean, L. Response of Vegetation and Vertebrate Fauna to 23 Years of Fire Exclusion in a Tropical Eucalyptus Open Forest, Northern Territory, Australia. Austral. Ecol. 2004, 29, 156–176. [Google Scholar] [CrossRef]
  8. Murphy, B.P.; Russell-Smith, J.; Prior, L.D. Frequent Fires Reduce Tree Growth in Northern Australian Savannas: Implications for Tree Demography and Carbon Sequestration. Glob. Chang. Biol. 2010, 16, 331–343. [Google Scholar] [CrossRef]
  9. Lykke, A.M. Assessment of Species Composition Change in Savanna Vegetation by Means of Woody Plants’ Size Class Distributions and Local Information. Biodivers. Conserv. 1998, 7, 1261–1275. [Google Scholar] [CrossRef]
  10. Holdo, R.M.; Anderson, T.M.; Morrison, T. Precipitation, Fire and Demographic Bottleneck Dynamics in Serengeti Tree Populations. Landsc. Ecol. 2014, 29, 1613–1623. [Google Scholar] [CrossRef]
  11. Roitman, I.; Felfili, J.M.; Rezende, A.V. Tree Dynamics of a Fire-Protected Cerrado Sensu Stricto Surrounded by Forest Plantations, over a 13-Year Period (1991–2004) in Bahia, Brazil. Plant Ecol. 2008, 197, 255–267. [Google Scholar] [CrossRef]
  12. Levick, S.R.; Baldeck, C.A.; Asner, G.P. Demographic Legacies of Fire History in an African Savanna. Funct. Ecol. 2015, 29, 131–139. [Google Scholar] [CrossRef]
  13. Staver, C. Prediction and Scale in Savanna Ecosystems. New Phytol. 2018, 219, 52–57. [Google Scholar] [CrossRef] [PubMed] [Green Version]
  14. Maltamo, M.; Gobakken, T. Predicting Tree Diameter Distributions. In Forestry Applications of Airborne Laser Scanning: Concepts and Case Studies; Maltamo, M., Næsset, E., Vauhkonen, J., Eds.; Springer: Heidelberg, Germany, 2014; pp. 177–191. [Google Scholar] [CrossRef]
  15. Dalponte, M.; Coomes, D.A. Tree-Centric Mapping of Forest Carbon Density from Airborne Laser Scanning and Hyperspectral Data. Methods Ecol. Evol. 2016, 7, 1236–1245. [Google Scholar] [CrossRef] [Green Version]
  16. Silva, C.A.; Hudak, A.T.; Vierling, L.A.; Loudermilk, E.L.; O’Brien, J.J.; Hiers, J.K.; Jack, S.B.; Gonzalez-Benecke, C.; Lee, H.; Falkowski, M.J.; et al. Imputation of Individual Longleaf Pine (Pinus Palustris Mill.) Tree Attributes from Field and LiDAR Data. Can. J. Remote Sens. 2016, 42, 554–573. [Google Scholar] [CrossRef]
  17. Li, W.; Guo, Q.; Jakubowski, M.K.; Kelly, M. A New Method for Segmenting Individual Trees from the Lidar Point Cloud. Photogramm. Eng. Remote Sens. 2012, 78, 75–84. [Google Scholar] [CrossRef] [Green Version]
  18. Roussel, J.R.; Auty, D.; Coops, N.C.; Tompalski, P.; Goodbody, T.R.H.; Meador, A.S.; Bourdon, J.F.; de Boissieu, F.; Achim, A. LidR: An R Package for Analysis of Airborne Laser Scanning (ALS) Data. Remote Sens. Environ. 2020, 251, 112061. [Google Scholar] [CrossRef]
  19. Ferraz, A.; Saatchi, S.; Mallet, C.; Meyer, V. Lidar Detection of Individual Tree Size in Tropical Forests. Remote Sens. Environ. 2016, 183, 318–333. [Google Scholar] [CrossRef]
  20. Knapp, N. MeanShiftR. Available online: https://github.com/niknap/MeanShiftR (accessed on 15 November 2020).
  21. Jucker, T.; Caspersen, J.; Chave, J.; Antin, C.; Barbier, N.; Bongers, F.; Dalponte, M.; van Ewijk, K.Y.; Forrester, D.I.; Haeni, M.; et al. Allometric Equations for Integrating Remote Sensing Imagery into Forest Monitoring Programmes. Glob. Chang. Biol. 2017, 23, 177–190. [Google Scholar] [CrossRef] [PubMed]
  22. Dalponte, M.; Frizzera, L.; Ørka, H.O.; Gobakken, T.; Næsset, E.; Gianelle, D. Predicting Stem Diameters and Aboveground Biomass of Individual Trees Using Remote Sensing Data. Ecol. Indic. 2018, 85, 367–376. [Google Scholar] [CrossRef]
  23. Goldbergs, G.; Maier, S.; Levick, S.; Edwards, A.; Goldbergs, G.; Maier, S.W.; Levick, S.R.; Edwards, A. Efficiency of Individual Tree Detection Approaches Based on Light-Weight and Low-Cost UAS Imagery in Australian Savannas. Remote Sens. 2018, 10, 161. [Google Scholar] [CrossRef] [Green Version]
  24. Torresan, C.; Carotenuto, F.; Chiavetta, U.; Miglietta, F.; Zaldei, A.; Gioli, B. Individual Tree Crown Segmentation in Two-Layered Dense Mixed Forests from UAV LiDAR Data. Drones 2020, 4, 10. [Google Scholar] [CrossRef] [Green Version]
  25. Camarretta, N.; Harrison, P.A.; Lucieer, A.; Potts, B.M.; Davidson, N.; Hunt, M. From Drones to Phenotype: Using UAV-LiDAR to Detect Species and Provenance Variation in Tree Productivity and Structure. Remote Sens. 2020, 12, 3184. [Google Scholar] [CrossRef]
  26. Puliti, S.; Breidenbach, J.; Astrup, R. Estimation of Forest Growing Stock Volume with UAV Laser Scanning Data: Can It Be Done without Field Data? Remote Sens. 2020, 12, 1245. [Google Scholar] [CrossRef] [Green Version]
  27. Moncrieff, G.R.; Lehmann, C.E.R.; Schnitzler, J.; Gambiza, J.; Hiernaux, P.; Ryan, C.M.; Shackleton, C.M.; Williams, R.J.; Higgins, S.I. Contrasting Architecture of Key African and Australian Savanna Tree Taxa Drives Intercontinental Structural Divergence. Glob. Ecol. Biogeogr. 2014, 23, 1235–1244. [Google Scholar] [CrossRef]
  28. Arzai, A.; Aliyu, B. The Relationship between Canopy Width, Height and Trunk Size in Some Tree Species Growing in the Savana Zone of Nigeria. Bayero J. Pure Appl. Sci. 2010, 3. [Google Scholar] [CrossRef] [Green Version]
  29. Wells, M. Soil Studies in the Magela Creek Catchment 1978: Part 1; Land Conservation Unit, Territory Parks and Wildlife Commission: Darwin, NT, USA, 1979.
  30. White, A.; Sparrow, B.; Leitch, E.; Foulkes, J.; Flitton, R.; Lowe, A.J.; Caddy-Retalic, S. AUSPLOTS Rangelands Survey Protocols Manual; University of Adelaide Press: Adelaide, Australia, 2012. [Google Scholar]
  31. Hernandez-Santin, L.; Rudge, M.L.; Bartolo, R.E.; Whiteside, T.G.; Erskine, P.D. Reference Site Selection Protocols for Mine Site Ecosystem Restoration. Restor. Ecol. 2020. [Google Scholar] [CrossRef]
  32. Khosravipour, A.; Skidmore, A.K.; Isenburg, M.; Wang, T.; Hussin, Y.A. Generating Pit-Free Canopy Height Models from Airborne Lidar. Photogramm. Eng. Remote Sens. 2014, 80, 863–872. [Google Scholar] [CrossRef]
  33. Awang, K.; Venkateswarlu, P.; Nor Aini, A.S.; Adjers, G.; Bhumibhamon, S.; Kietvuttinon, B.; Pan, F.J.; Pitpreecha, K.; Simsiri, A. Three Year Performance of International Provenance Trials of Acacia Auriculiformis. For. Ecol. Manag. 1994, 70, 147–158. [Google Scholar] [CrossRef]
  34. Seabold, S.; Perktold, J. Statsmodels: Econometric and Statistical Modeling with Python. In Proceedings of the 9th Python in Science Conference, Austin, TX, USA, 28 June–3 July 2010; Volume 57, p. 61. [Google Scholar]
  35. Cleveland, W.S. Robust Locally Weighted Regression and Smoothing Scatterplots. J. Am. Stat. Assoc. 1979, 74, 829–836. [Google Scholar] [CrossRef]
  36. Virtanen, P.; Gommers, R.; Oliphant, T.E.; Haberland, M.; Reddy, T.; Cournapeau, D.; Burovski, E.; Peterson, P.; Weckesser, W.; Bright, J.; et al. SciPy 1.0: Fundamental Algorithms for Scientific Computing in Python. Nat. Methods 2020, 17, 261–272. [Google Scholar] [CrossRef] [PubMed] [Green Version]
  37. Aubry-Kientz, M.; Dutrieux, R.; Ferraz, A.; Saatchi, S.; Hamraz, H.; Williams, J.; Coomes, D.; Piboule, A.; Vincent, G. A Comparative Assessment of the Performance of Individual Tree Crowns Delineation Algorithms from ALS Data in Tropical Forests. Remote Sens. 2019, 11, 1086. [Google Scholar] [CrossRef] [Green Version]
  38. Solberg, S.; Naesset, E.; Bollandsas, O.M. Single Tree Segmentation Using Airborne Laser Scanner Data in a Structurally Heterogeneous Spruce Forest. Photogramm. Eng. Remote Sens. 2006, 72, 1369–1378. [Google Scholar] [CrossRef]
  39. Chamberlain, C.P.; Sánchez Meador, A.J.; Thode, A.E. Airborne Lidar Provides Reliable Estimates of Canopy Base Height and Canopy Bulk Density in Southwestern Ponderosa Pine Forests. For. Ecol. Manag. 2021, 481. [Google Scholar] [CrossRef]
  40. Hastings, J.H.; Ollinger, S.V.; Ouimette, A.P.; Sanders-DeMott, R.; Palace, M.W.; Ducey, M.J.; Sullivan, F.B.; Basler, D.; Orwig, D.A. Tree Species Traits Determine the Success of LiDAR-Based Crown Mapping in a Mixed Temperate Forest. Remote Sens. 2020, 12, 309. [Google Scholar] [CrossRef] [Green Version]
  41. Yin, D.; Wang, L. How to Assess the Accuracy of the Individual Tree-Based Forest Inventory Derived from Remotely Sensed Data: A Review. Int. J. Remote Sens. 2016, 37, 4521–4553. [Google Scholar] [CrossRef]
  42. Hodges, J.L. The Significance Probability of the Smirnov Two-Sample Test. Ark. För Mat. 1958, 3, 469–486. [Google Scholar] [CrossRef]
  43. Luck, L.; Hutley, L.B.; Calders, K.; Levick, S.R. Exploring the Variability of Tropical Savanna Tree Structural Allometry with Terrestrial Laser Scanning. Remote Sens. 2020, 12, 3893. [Google Scholar] [CrossRef]
  44. Hutley, L.; Beringer, J. Disturbance and Climatic Drivers of Carbon Dynamics of a North Australian Tropical Savanna. Ecosyst. Funct. Savannas 2010, 2014, 57–75. [Google Scholar] [CrossRef]
  45. Brede, B.; Calders, K.; Lau, A.; Raumonen, P.; Bartholomeus, H.M.; Herold, M.; Kooistra, L. Non-Destructive Tree Volume Estimation through Quantitative Structure Modelling: Comparing UAV Laser Scanning with Terrestrial LIDAR. Remote Sens. Environ. 2019, 233, 111355. [Google Scholar] [CrossRef]
  46. The United Nations Department of Economic and Social Affairs. Sustainable Development Goals. Available online: https://sdgs.un.org/goals (accessed on 20 October 2020).
  47. Windrim, L.; Bryson, M. Detection, Segmentation, and Model Fitting of Individual Tree Stems from Airborne Laser Scanning of Forests Using Deep Learning. Remote Sens. 2020, 12, 1469. [Google Scholar] [CrossRef]
  48. Levick, S.R.; Whiteside, T.; Loewensteiner, D.A.; Rudge, M.; Bartolo, R. Leveraging TlS as a Calibration and Validation Tool for MlS and UlS Mapping of Savanna Structure and Biomass at Landscape-Scales. Remote Sens. 2021, 13, 257. [Google Scholar] [CrossRef]
  49. Williams, R.J.; Zerihun, A.; Montagu, K.D.; Hoffman, M.; Hutley, L.B.; Chen, X. Allometry for Estimating Aboveground Tree Biomass in Tropical and Subtropical Eucalypt Woodlands: Towards General Predictive Equations. Aust. J. Bot. 2005, 53, 607–619. [Google Scholar] [CrossRef]
  50. Ocer, N.E.; Kaplan, G.; Erdem, F.; Kucuk Matci, D.; Avdan, U. Tree Extraction from Multi-Scale UAV Images Using Mask R-CNN with FPN. Remote Sens. Lett. 2020, 11, 847–856. [Google Scholar] [CrossRef]
Figure 1. Summary of the sites and the primary datasets used in this study: (a) Location of the study site, showing calibration plots C1 and C2, and validation plots V1, V2 and V3. Coordinate system is GDA 1994 MGA Zone 53; (b) Example of drone derived LiDAR point cloud, colored according to height above ground level (m); (c) Example of field surveyed DBH, with point scaled according to DBH. The inner polygon shows the one-hectare plot and the outer polygon shows the 10m buffer used in analysis. Data shown in (b,c) refer to plot C1, although these data were collected at all five plots.
Remotesensing 13 01266 g001
Figure 2. Overview of the methods workflow, with numbers referring to the relevant methods sections.
Remotesensing 13 01266 g002
Figure 3. Input parameters for the AMS3D algorithm. (a) Crown basal height (red horizontal line) predicted as the upper quantile of the largest gap between 5% quantiles of height. Points from individual crowns were clipped using manually delineated crowns. CBH was subtracted from the highest value to generate crown length. (b,c) show the linear models used to derive the AMS3D algorithm parameters; H2CL and H2CW.
Remotesensing 13 01266 g003
Figure 4. Scatter plots showing the relationship between DBH measured in field-surveys and DBH predicted using crown height, diameter, and height multiplied by crown diameter (HCD). Grey points represent the calibration dataset and blue points represent the validation dataset. RMSE and bias values relate to the validation dataset. The red line represents a 1:1 relationship between predicted and observed values.
Remotesensing 13 01266 g004
Figure 5. Scatter plot showing the percentage of intersection between manually and automatically delineated crowns. Point sizes are proportional to field measured DBH. Note that when more than one automatically segmented crown overlapped with a manually delineated crown, the automatic crown with the largest percentage cover was used in the analysis.
Remotesensing 13 01266 g005
Figure 6. Plot level figures showing maps of (a) Field census survey, with points sized according to DBH (b) crown polygons fitted to point cloud segmentation with the AMS3D algorithm. (c) displays the diameter distribution of field-surveyed and UAV-LS modelled DBH, derived from polygons using the LOESS crown diameter allometry. The number of trees was calculated using 5 cm DBH bin sizes, and all data below 3 cm DBH was removed from both datasets to allow comparisons between field-surveyed and UAV-LS diameter distributions.
Remotesensing 13 01266 g006
Figure 7. Size frequency distributions using both maximum crown height (m) and crown area (m2) as proxies for tree size. Field surveys are unable to capture these comprehensive measures of tree size.
Remotesensing 13 01266 g007
Table 1. Segmentation accuracy results for the different DBH size classes of manually segmented tree crowns. Numbers in brackets represent the total number of manually segmented crowns per size class.
Calibration PlotsValidation Plots
DBH size class (cm)Number crowns accurately segmentedAccuracy %Number of accurately segmented crownsAccuracy %
<1041 (137)3038 (56)68
10–2037 (47)7915 (25)60
>2018 (21)8614 (17)82
All sizes96 (205)4767 (98)68
Table 2. Comparisons of field-surveyed with UAV-LS modelled number of trees in three broad size categories, <10 cm, 10–20 cm and >20 cm DBH.
Plot IDDBH Size Class<10 cm10–20 cm>20 cmTotal
C1No. field survey26818764519
No. UAV-LS segmentation39717856631
% segmented1489588122
C2No. field survey6075136694
No. UAV-LS segmentation531516588
% segmented871001785
V1No. field survey12816293383
No. UAV-LS segmentation15483101338
% segmented1205110988
V2No. field survey2486093401
No. UAV-LS segmentation269117111497
% segmented108195119124
V3No. field survey40713571613
No. UAV-LS segmentation28011469463
% segmented69849776
Table 3. Results of the plot level KS-tests comparing field-surveyed with UAV-LS modelled DBH. D represents the KS test statistic, and the p value is the p value result of the KS test. Bold p values show when there was no significant difference between field measured and UAV-LS modelled diameter distributions.
All Size Classes>10 cm DBH>20 cm DBH
PlotDp valueDp valueDp value
C10.170<0.0010.0650.6510.2340.063
C20.251<0.0010.3440.0010.5830.041
V10.198<0.0010.221<0.0010.2490.004
V20.180<0.0010.1600.0160.1060.569
V30.246<0.0010.1010.2520.1630.272
Publisher’s Note: MDPI stays neutral with regard to jurisdictional claims in published maps and institutional affiliations.

