Abstract
High Mountain Asia (HMA) hosts the largest glacier concentration outside of polar regions. It is also distinct glaciologically as it forms one of two major surge clusters globally, and many glaciers there contradict the globally observed glacier recession trend. Surging glaciers are critical to our understanding of HMA glacier dynamics, threshold behaviour and flow instability, and hence have been the subject of extensive research, yet many dynamical uncertainties remain. Using the cloud-based geospatial data platform, Google Earth Engine (GEE) and GEE-developed tool, GEEDiT, to identify and quantify trends in the distribution and phenomenological characteristics of surging glaciers synoptically across HMA, we identified 137 glaciers as surging between 1987–2019. Of these, 55 were newly identified, 15 glaciers underwent repeat surges, and 18 were identified with enhanced glaciological hazard potential, most notably from Glacier Lake Outburst Floods (GLOFs). Terminus position time series analysis from 1987–2019 facilitated the development of a six-part phenomenological classification of glacier behaviour, as well as quantification of surge variables including active phase duration, terminus advance distance and rate, and surge periodicity. This research demonstrates the application of remote sensing techniques and the GEE platform to develop our understanding of surging glacier distribution and terminus phenomenology across large areas, as well as their ability to highlight potential geohazard locations, which can subsequently be used to focus monitoring efforts.
1. Introduction
High Mountain Asia (HMA) constitutes the third major global cryospheric hub, hosting the largest glacier concentration outside polar regions, and hence aptly termed the ‘third pole’ [1,2,3]. These glacierised catchments significantly influence streamflow into major populated regions, emphasising the necessity to understand HMA glacier dynamics. HMA forms one of two major glacier surge clusters globally, with the ‘Arctic Ring’, stretching through the Arctic and Sub-Arctic from Alaska to Novaya Zemlya, forming the second major cluster [4]. Glacier surges are quasi-periodic, internally driven oscillations between slow-flow (quiescent phase) and fast-flow (active surge phase) [5,6]. During a surge, glacier mass is redistributed from a reservoir area to a receiving area. This is often, but not always, accompanied by a terminus advance (Figure 1) [7]. Although surging glaciers represent a small percentage of global glacier populations (about 1%, [8]), they are of critical importance to our understanding of glacier dynamics, threshold behaviour, flow instability, and glaciological hazards. Since being highlighted as one of the ‘outstanding unsolved problems in glacier mechanics’ [9] surging glaciers have been the subject of extensive research, yet many aspects of their behaviour remain uncertain [10,11,12,13,14]. Surging glaciers also represent a glaciological hazard [15,16]. Glaciers that surge have the potential to inundate land, advancing across glacier valleys, blocking proglacial streams, facilitating glacier lake formation, and increasing the Glacier Lake Outburst Flood (GLOF) hazard potential. This highlights the further importance in understanding their distribution and behaviour.
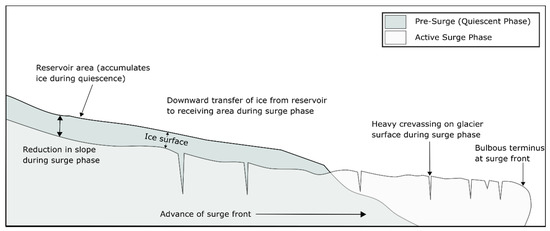
Figure 1.
Schematic diagram showing generalised glacier response pre-surge (quiescent phase) and during an active surge phase.
With the paradigm shift facilitated through the development and application of remote imaging systems, the study and understanding of glacier surging has been transformed, [17,18]. Remote imaging systems and cloud-based data catalog and processing platforms such as Google Earth Engine (GEE) provide the potential for rapid visualisation and analysis of geospatial data without the need to download, process, visualise and analyse data locally. Use of the cloud alleviates requirements at the user’s end for high processing powers and extensive disc space - a problem previously inherent to large-scale geospatial studies. GEE is a cloud-based platform launched in 2010 for planetary-scale geospatial analysis [19]. GEE has collated multi-petabyte satellite imagery archives from widely used geospatial datasets including the entire Landsat collection, extending back over 40 years, and the complete Sentinel -1 and -2 archives. The combination of this continually updated archive, and an entirely cloud-based user interface makes GEE an appropriate platform for this synoptic study of glacier surging.
This study can be divided into two principal aims. The first aim was to identify and digitise surge-related glacier terminus position change through time, using remotely sensed imagery, utilising within GEE the Google Earth Engine Digitisation Tool (GEEDiT, [20]), a tool that enables rapid digitisation and downloading of glacier extent data through time. The second aim was to quantify trends in the distribution and phenomenological characteristics of surging glacier termini across HMA using these digitised terminus positions.
2. High Mountain Asia
The study area encompasses the entirety of HMA, extending from around 25°–45° N to 70°–100° E. This study focusses on five sub-regions (Tian Shan, Pamir, Karakoram, (West) Kunlun Shan, and Himalaya) simplified from the Randolph Glacier Inventory (RGI) v6.0 second-order regions. The RGI v6.0 sub-divides HMA into three first-order regions -Central Asia, South Asia (West), and South Asia (East), which encompass the broader regions in Asia, and 15 second-order regions (sub-divisions of the three stated first-order regions, encompassing mountain ranges across HMA). The RGI is a global inventory of glacier outlines and is supplemental to the Global Land Ice Measurement from Space (GLIMS) glacier database, which contains digital glacier outlines and related metadata extracted from satellite data [21].
Glaciers are found on all HMA mountain ranges greater than 4000 m a.s.l., adjacent to the Tibetan Plateau, but predominantly to the south and west, where steep elevation gradients emerging from the Indian plains act as a barrier for moisture advected by the Indian Monsoon and Winter Westerly Disturbances (WWDs) (Figure 2) [22]. The glacierised area of HMA comprises 16% of the global glacierised area in the RGI [21]. The mountains of HMA are characterised by complex topographic gradients; consequently, glacier behaviour and response to climate is heterogeneous throughout the region [23]. In addition to this, despite glaciers being one of the most sensitive and visible responders to climate change, the relative contribution to Sea Level Rise (SLR) from HMA glaciers remains poorly constrained in models. Digital Elevation Model (DEM) differencing covering 92% of HMA glacierised area was used between 2000 and 2016 to assess glacier volume changes across HMA. This study revealed glaciers in HMA underwent a mass change of −16.3 ± 3.5 Gt a−1, equating to −0.18 ± 0.04 m we−1 [24]. This estimate is significantly lower than previous estimates for the period 2003–2009 (−26 ± 12 Gt a−1) [25], demonstrating uncertainty of model outputs. This uncertainty is partly related to the heterogeneous glacier behaviour and response to climate observed across HMA.
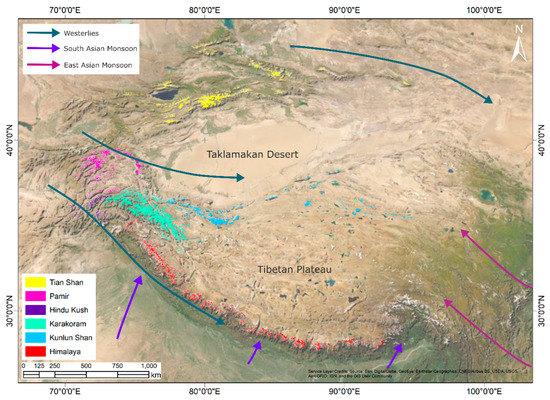
Figure 2.
Map of HMA sub-regions using RGI v6.0. Coloured areas correspond to simplified sub-regional glacier data exported from RGI v6.0, a supplemental inventory to the GLIMS glacier database. Arrows indicate air mass influences across HMA.
The interaction between atmospheric circulation and the world’s tallest mountains produce strong horizontal and vertical gradients in both temperature and precipitation due to orographic forcing [26]. The climate of HMA is influenced by both East Asian and Indian Monsoon systems delivering the bulk of precipitation in Central and Eastern Himalaya, and Karakoram between June and September, with precipitation totals up to 3000 mm a−1 [27,28]. In Western HMA, including Tian Shan, Pamir and Karakoram, WWDs account for greater than 80% precipitation rates of 1000–2000 mm a−1 (Figure 2) [29,30].
A balanced to slightly positive glacier mass budget is observed along a northwest-southeast transect stretching from Eastern Pamir to West Kunlun Shan through the Karakoram, in contrast to the rest of HMA, characterised by a negative mass budget [31]. In line with this slightly positive mass budget (120 ± 140 kg m2 a−1, [32]), ice flow velocities and surge occurrence have increased. This region of anomalous behaviour has been termed the Karakoram Anomaly [33]. The Karakoram Anomaly is partly attributed to increased regional precipitation and decreasing summer temperatures since the 1960s, causing the observed localised mass gain since the late 1990s, and enhanced regional surging [1,34,35]. More recently, changes in glacier accumulation and ablation patterns due to enhanced irrigation and evaporation, weakening of the monsoon, and enhanced westerlies have been proposed in conjunction with previous observations [31,36,37].
Surging Glaciers in HMA
Surging is heterogeneously distributed across HMA sub-regions. Previous research has investigated surging at both individual sub-region and glacier scale. In Tian Shan, surge studies are limited, although the most comprehensive study by Mukherjee et al. (2017) [38] identified 39 potentially surging glaciers using literature and time series satellite imagery analysis, with nine confirmed as surging, seven of which surged within the timeframe of this study, although not all glaciers underwent a terminus advance.
In Pamir, surging is extensive. Kotlyakov et al. (2008) [17] identified 215 glaciers with a dynamically unstable regime, and 51 actively surging glaciers between 1973–2006. They used a combination of satellite imagery time series analysis and photogrammetry to identify and monitor surging glaciers. More recently, Sevestre and Benn (2015) [4] applied species distribution model, MAXTENT, to constrain global surge distribution. They identified 90 confirmed surge-type glacier, 355 probable and 375 possible surging glaciers in Pamir. Observations of repeat short-lived surge cycles at several Pamir glaciers, e.g., Medvezhiy Glacier (1963, 1973, 1989, 2001, 2011) and Bivachny Glacier (1958, 1976, 1991, 2011), are indicative of a hydrologically regulated surge mechanism in this HMA sub-region [39,40].
Surging has been widely studied across the Karakoram, typically at a sub-regional scale. Recently, Bhambri et al. (2017) [18] produced an inventory of surging in the Karakoram, identifying 220 surge-type and surge-like glaciers via compilation of extensive literature searches, ground-based observations and satellite imagery. Reports of surging indicate both thermal and hydrological mechanisms operate in the Karakoram, suggesting surging in this region represents a spectrum of flow instability, where processes that control surge evolution may vary on an individual glacier basis [10,41,42].
By contrast, only two satellite-based surge-related studies have been conducted in West Kunlun Shan [43,44]. Yasuda and Furuya (2015) [43] identified nine surge-type glaciers, two likely surge-type and six possible surge-type. Chudley and Willis (2019) [44] identified a further nine surging glaciers in West Kunlun Shan. Surge incidence in the Himalaya is isolated and has only been recorded on an individual basis. Lovell et al. (2018) [45] studied Sabche Glacier, Nepal, which surged several times over the last 50 years.
Glacier surging in HMA can represent a major glaciological hazard. Terminus advance associated with surging can inundate land and block glacier valleys [16,38,46,47]. This can result in damming of proglacial streams leading to glacier lake formation and/or expansion, increasing likelihood of GLOFs and inundation of the proglacial area, e.g., Lake Merzbacher, Inylchek Glacier, Tian Shan [48,49]. This also occurred in the Karakoram where Khurdopin Glacier advanced, inundating the valley to the far headwall, blocking the Vijerab River. This resulted in rapid lake growth in late April 2017 from 72,000 m3 to 1 × 10⁶ m3 at the end of May, peaking at 2 × 10⁶ m3 at the end of June 2017 [50].
3. Data and Methods
3.1. Data
The principal data used in this study were optical satellite imagery accessed via cloud-based GEE archives. This study used Landsat imagery, using data from the Landsat 5 Thematic mapper (TM) (1984–2013) and Landsat 8 Operational Land Imager (OLI) (2013- Present), with most surge time series obtained in this study for the period 1987–2018. Landsat 5 imagery has a spatial resolution of 30 m, whilst Landsat 8 imagery has a resolution up to 15 m when using pan-sharpened imagery (panchromatic band 8). All satellite images used in this research were Level 1T (terrain corrected), meaning data were radiometrically calibrated and orthorectified using ground control points and DEMs to correct for relief displacement [51]. This ensured high quality data, suitable for pixel-level time series analysis. No further image correction was required.
Due to the recurrent issue of Scan Line Corrector Failure (SLF) in Landsat 7 imagery, this dataset was omitted. Fortunately, the overlap of data collection between sensors meant that data availability of Landsat sensors 5 and 8 was sufficient to minimise the impact of the lack of Landsat 7 data.
The availability of satellite imagery was further restricted by snow/cloud detection issues, topographic effects and debris mantling on termini. Snow/cloud detection issues occur because snow and clouds share similar spectral properties in visible wavebands. Furthermore, clouds can prevent the receipt of information from land to optical sensors. Snow/cloud detection issues were a recurring limitation during image acquisition and processing because cloud-cover is very common in high elevation regions characterised by complex topography, such as HMA [52]. The ability to filter and view satellite images with a customised cloud-cover percentage within GEEDiT [20] minimised cloud-cover effects, except for a few images. This feature uses the metadata from the cloud detection algorithm applied to Landsat data. This study applied a fixed cloud percentage cover filter of 20%. Although applying a cloud percentage cover filter reduced the number of satellite images overall, it minimised time spent looking at unusable imagery, and enhanced the usability and quality of imagery available for this study.
Terrain shadow affects are also limiting in topographically complex areas. In HMA, images acquired through winter months are typically affected more by terrain shadow due to the solar zenith angle. Additionally, many HMA glaciers are debris-mantled resulting from avalanches, landslides and rockfall from adjacent mountains, melt-out of englacial debris and thrusting from the glacier bed. This debris cover is often thicker in the ablation zone [53], limiting the ability to distinguish between the glacier termini and the pro-glacial landscape in satellite imagery. This restricted surge identification in the early stages of surge-related terminus advance. Once surge-related advance was well-underway, advancing debris-covered termini became more readily identifiable in the imagery.
Glacier identifications, coordinates, and variables, including area, length, minimum and maximum elevation, slope, and aspect were obtained from RGI v6.0 [21]. The alphanumeric identifiers created for use in this study represent a concatenation of the region identifier and an arbitrary glacier index number for that region. The gaps in index numbers represent glaciers which were studied but determined to be not surging. The study glacier identifications and their associated RGI identifications are available in the Supplementary Information Section S2 (doi.org/10.17863/CAM.66426 (accessed on 5 January 2021)).
3.2. Methods
3.2.1. Surge Identification and Validation
A preliminary search for possible surge-type behaviour was undertaken by manually identifying surge-indicative features in Google Earth (Figure 3). These surge-indicative features include bulbous termini and enhanced crevassing due to bulge and surge-front propagation by transfer of mass from a glacier’s reservoir area to its receiving area and glacier extension during an active surge phase. Looped and unstable moraines are also indicative of surging and form due to glacier flow instability and by advance of a glacier tributary into another glacier [18,41]. In total, 305 glaciers were identified as likely surging and shortlisted for terminus change examination. Of the 305 glaciers examined within GEEDiT, 137 exhibited some form of terminus advance, and thus were classified as surging. As such this dataset does not represent a comprehensive study of every glacier in HMA, but rather a subset that was deemed a suitable size and scope for this study.
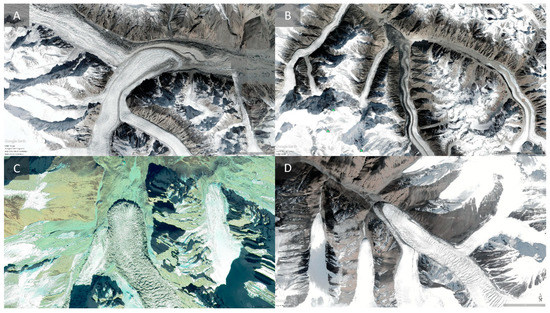
Figure 3.
Examples of surge-indicative features from Google Earth Satellite Imagery. (A) Looped moraine at Glacier K13, Sugatyanatjilga Glacier, (B) Unstable moraine at Khurdopin Glacier, (C) Bulbous terminus at Glacier WKS4, RGI60-13.38961, (D) Enhanced crevasses at Glacier K53, RGI60-14.02215.
These 137 were validated using glaciers marked in the RGI v6.0 as confirmed surging (category 3) [4], and by collating sub-regional confirmed surge literature post-2015. From this validation, it was possible to calculate the number of newly identified surging glaciers based on those not reported in RGI v6.0 as category 3 or in post-2015 literature [18,38,43,44,45].
3.2.2. Terminus Change Delimitation
Terminus change was tracked and digitised using GEEDiT [20]. This tool allows for rapid collation and visualisation of data within a standard browser, digitisation and export of vector data in GeoJSON, KML, KMZ or SHP formats. Shapefiles of glacier termini digitised in this study (S1) and terminus change time series graphs (S3) are available in the Supplementary Information (doi.org/10.17863/CAM.66426 (accessed on 5 January 2021)). Uncertainty associated with terminus positions stems from two sources of error [54]. The first is georeferencing accuracy. This is in the order of half a pixel for Landsat 4–5 TM, and Landsat 8 OLI [55,56,57]. The second source of error is associated with the precision of manual digitisation of terminus positions. This error was minimised by maintaining consistency in the method and interpretation of glacier termini by using the same manual digitiser for all glacier termini. Despite this, manual digitisation error is estimated to be between 10–30 m based on the previous study [45].
Around ten images were delimited for each glacier during the study timeframe. Where possible temporal resolution was increased around behaviour of interest or for glaciers exhibiting multiple surge events.
3.2.3. Terminus Change Quantification
Terminus data was exported from GEEDiT into QGIS [58]. Terminus change through time was quantified for each glacier using the QGIS distance matrix tool to measure the distance between the intersections of delimited termini with the glacier centreline over chronologically successive images. A standard single centreline approach was adopted where termini were uniformly advancing or retreating [59]. A shortcoming of the single centreline approach is that this provides a one-dimensional measure of change and only accounts for behaviour of the terminus at the centreline intersection, rather than providing an accurate width-averaged value of change. For most glaciers in the study its application was sufficient.
For each glacier, terminus position was plotted as a time series. From these data we quantify: surge initiation and termination dates, surge active phase duration (herein referred to as surge duration), terminus change distance, surge periodicity, and surge terminus advance rates. Where the time interval between image acquisition dates was short, quantifications of margin change rate were better resolved and thus more accurate. From absolute terminus advance distance plots, daily and maximum-averaged terminus advance rates were calculated to obtain approximated surge velocity values, which could be used for comparison between quiescent and active surge phase velocities, or to make inferences regarding surge dynamical processes and mechanisms. Daily averaged advance rates were calculated by dividing total surge distance (m) by surge duration (days), and maximum-averaged advance rates represent the greatest advance rate observed between consecutive image pairs.
For the purposes of this study “surge duration” has been defined as the total observed period of any positive terminus advance which includes surge characteristics. Consequently, surge duration is inclusive of the initiation and termination phases. Some glacier analyses will also overpredict duration due to lack of definition around the advance rate inflection during initiation and termination, however interpolation of terminus position in imagery gaps to better define the duration in these cases was not deemed appropriate. Future implementation of this method should, where possible, include more temporal resolution between image pairs around inflection points to better resolve surge duration. Some glacier analyses will underpredict duration as the initiation or termination did not fall within the study period. This definition could also be inclusive of non-surge related advance, however it is widely acknowledged that distinction between these phases is subjective and difficult [38,60]. Overall, the selection of this definition likely results in a moderate uncertainty of surge duration in many specific cases, which are identifiable by the features discussed above. However, this approach was considered the most consistent and rigorous to apply across the entire dataset.
3.2.4. Classification of Surge Phenomenology
Surging glaciers were identified by the presence of surge-indicative features in combination with observed terminus advance, or a clearly surge-indicative terminus advance time series. For descriptive purposes of these surging glaciers, an analysis of terminus change graphs revealed several glacier behavioural trends, facilitating the development of a six-part phenomenological classification in this study. This classification scheme differs from conventionally adopted surge index classifications which are based on strength of surge evidence and therefore likelihood of surging, e.g., [4,41,61,62,63]. The novel surge classification presented here was developed to facilitate clear inferences on broad surge behaviour, and to identify and cluster trends in surging based solely upon terminus change.
Surge-Type 1: Glaciers are generally stable but may show a small degree of oscillation in terminus position over time. Terminus position deviation ranged between 0–5% glacier length, arguably an insufficient deviation to classify them as surging.
Surge-Type 2: Glaciers exhibit gradual advance over several years/decades. Over these extended time periods glacier termini advance between 5–30% their length.
Surge-Type 3: Glaciers are characterised by abrupt terminus advance. This is exhibited by their steep gradients on terminus change time series graphs. Glaciers characterised by type 3 phenomenology typically advance a greater proportion of their length (up to 60%) over months to years.
Surge-Type 4: Glaciers are characterised by multiple phases of advance or retreat.
Surge-Type 5: Glaciers are characterised by gradual retreat, with just brief periods of advance. These glaciers typically retreat between 0–15% their length over extended periods of years to decades.
Surge-Type 6: Glaciers are characterised by abrupt retreat of around 10–20% glacier length. Terminus change time series characterised by this abrupt retreat are often preceded or followed by a period of relative terminus advance or stability. Despite exhibiting some degree of terminus advance or stability, retreat appears to be the dominant behaviour observed in these terminus change time series.
The glacier surge distance was normalized with respect to glacier length to capture the effect of catchment size on the extent of the surge and make results from glaciers of different magnitude sizes comparable. This does however have the effect of suppressing visualisation and ability to classify some surges at the largest glaciers.
The six behaviour types identified were evaluated by asking five researchers at the Scott Polar Research Institute to independently classify the 137 surge-type glaciers identified. Good agreement between the classifications made was found, with researchers agreeing on 133 of the 137 (97%) surging glaciers. The classification outlined here is likely to be applicable in other regions characterised by surging or glacier flow instability.
4. Results
In total, 137 glaciers were identified as surging during the study timeframe (1987–2019). Surge occurrence was heterogeneous across sub-regions, with the highest surging frequency occurring in the Karakoram, and lowest frequency in the Himalaya. Four glaciers were identified as surging in Tian Shan, 22 in Pamir, 83 in the Karakoram, 26 in West Kunlun Shan, and three in the Himalaya (Table 1, Figure 4). Of the 137 surging glaciers identified, 55 were newly identified at the time of the study, with 82 appearing in either the RGI or post-2015 surge literature [18,38,43,44,45]. Among the newly identified surge-type glaciers one was in Tian Shan, nine in Pamir, 28 in the Karakoram, 15 in West Kunlun Shan, and two in the Himalaya.

Table 1.
Total numbers of glaciers identified as surging in this study and their respective phenomenological classifications. Newly identified glacier totals also noted.
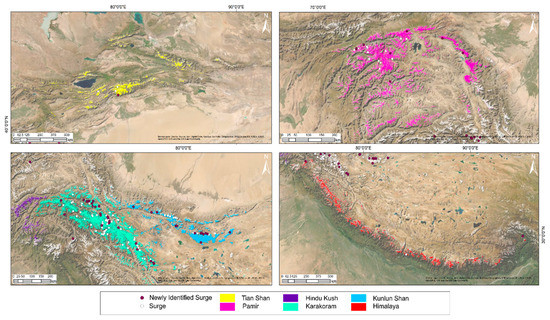
Figure 4.
Glacier surges identified and digitised using GEEDiT. Tian Shan (top left), Pamir (top right), Karakoram and West Kunlun Shan (bottom left), and Himalaya (bottom right). Glacier outlines taken from RGI, v6.0 (RGI Consortium, 2017).
4.1. Surge Phenomenology
Table 1 and Figure 5 show the sub-regional distribution of surge phenomenologies, and Figure 6 highlights example glaciers demonstrating the observed phenomenologies. Glaciers characterised by Type 1 behaviour were observed across all sub-regions, totalling 20 of 137 study glaciers (15%). Type 2 behaviour was the most frequently observed across HMA, representing 69 of 137 study glaciers (50%), 45 glaciers of which were in the Karakoram. In total, 26 of 137 study glaciers (19%) were characterised by Type 3 behaviour. Type 4 behaviour was observed in 15 of 137 study glaciers (11%). In these glaciers, advance was typically abrupt, nominally advancing 10–50% glacier length over 0–5 years. Subsequent retreat was typically gradual. Two phases of advance or retreat was most typical throughout the study period for this surge-type, however H16 (Sabche Glacier) underwent three repeat surge cycles over the 30-year study period. In total, 5 (4%) of the study glaciers exhibited Type 5 behaviour. Type 6 behaviour was observed for two study glaciers (1%), making it the most infrequently occurring class.
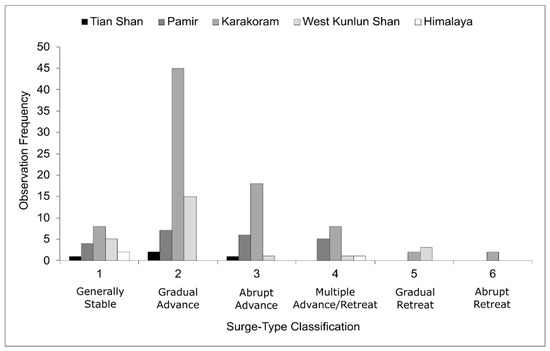
Figure 5.
Sub-regional frequency of observations in each surge-type class.
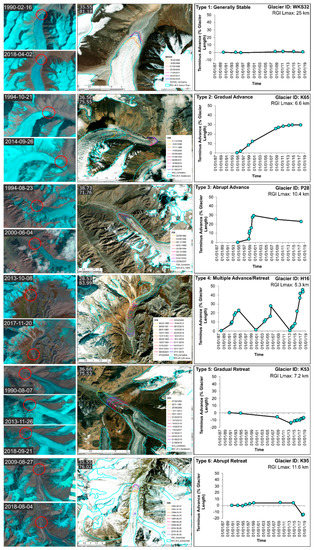
Figure 6.
Study examples of surge phenomenology classification. Composite figure includes terminus change time series in graph and map form, and imagery pre- and post- surge. *NB. Red circle indicates terminus position.
4.2. Surge Characteristics
Terminus change records revealed regional variations in the derived surge characteristics, including surge duration, distance, terminus advance rate and surge periodicity (where two or more surges were observed at any individual glacier during the study timeframe), (Figure 7).
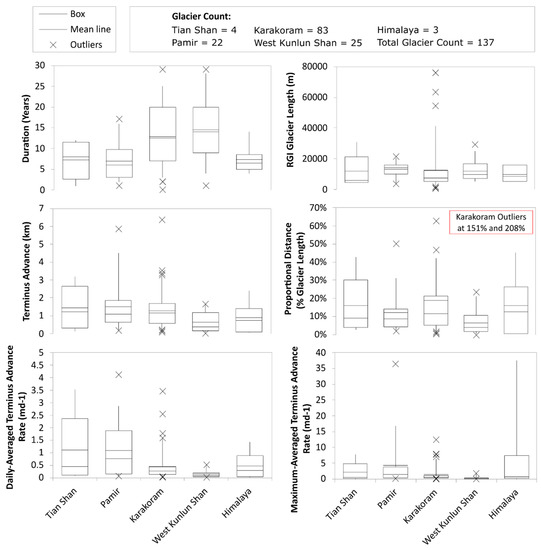
Figure 7.
Boxplots showing surge variables at the sub-regional scale: surge duration (top left), RGI v6.0 glacier length (top right), surge terminus advance distance (middle left), surge proportional distance (middle right), daily averaged and maximum-averaged terminus advance rate (bottom left and right).
Surge duration in the Karakoram and West Kunlun Shan was greater than in adjacent sub-regions. Maximum duration (29 years) and range of surge durations (28 years) were also greatest for these sub-regions. The lowest surge durations were observed in Pamir and Himalayan sub-regions, where around 75% of surges lasted less than ten years. The sub-regions with least variation were the Himalaya and Tian Shan, although this is partly attributable to their small sample sizes.
On average Tian Shan glaciers showed a greater proportional advance, relative to their length, compared with adjacent sub-regions. Pamir and Karakoram glaciers had the greatest ranges in proportional surge distance, surging between 2–50% and 0.5–208%, of the total length, respectively.
Establishing daily and maximum-averaged terminus advance rates without using conventional techniques such as feature tracking was difficult due to non-uniformity of image acquisition dates and quality. However, the greatest terminus advance rates were observed in Pamir, and the lowest were observed in West Kunlun Shan.
Of the 137 study glaciers, 15 glaciers surged multiple times, five in Pamir, eight in the Karakoram, one in West Kunlun Shan, and one in the Himalaya. H16 surged three times, while the remaining 14 surged twice. Surge periodicity ranged from six to 20 years.
5. Discussion
5.1. Glacier Surging across High Mountain Asia
In this study, 137 glaciers across HMA were identified as surging over the 32-year time series (1987–2019) based on changes in glacier terminus position. The total value is likely to be an underestimation of surging glacier frequency across HMA due to the synoptic scale (100,000 km2) of this study, probable overlooking of smaller ice masses, and satellite coverage being constrained both temporally and by quality of overpasses. Many glaciers, despite exhibiting geomorphic and glaciological evidence of surging, did not always display evidence of surging according to our terminus change criteria. Additionally, surging termini that were heavily debris- mantled, a common feature of HMA glaciers, were difficult to identify.
Surge incidence across HMA is heterogeneously distributed: the Pamir, Karakoram and West Kunlun Shan sub-regions have significantly higher rates of surge occurrence, in contrast to adjacent Tian Shan and Himalaya, which are characterised by isolated surge incidence. Several studies have similarly acknowledged enhanced surge frequency in these HMA sub-regions, e.g., [44]. These observations are proportionately supported by literature, whereby the majority of HMA surge studies focus around these sub-regions, most notably the Karakoram. This heterogeneous distribution of surging is likely linked to localised mass gain in the area since the late 1990s, in line with increased precipitation and declining summer temperatures from 1960s onwards [34], and the Karakoram Anomaly [33].
5.2. Surge Classification
Of the 137 glaciers, 20 (15%) glaciers were identified as Type 1 (stable). These glacier terminus change time series may have exhibited some minor advance or retreat (±5%), suggesting that these glaciers are more or less in equilibrium. This behavioural-type was observed across all five sub-regions. Glaciers of this type do not exhibit the typical global trend of glacier retreat.
Type 2 glaciers were the most frequently observed in this study, with 69 (50%) exhibiting this behaviour. These glaciers continuously, but gradually, advance over timescales of years to decades by around 5–30% of glacier length. This is characteristic of a thermally regulated surge mechanism, distinguished by longer surge durations [4,64] compared with hydrologically regulated surges [9]. This surge-type was observed most frequently in Pamir, Karakoram and West Kunlun Shan sub-regions. When considering the principal distribution of this behaviour it is also possible that glacier termini are gradually advancing in line with the long-term mass gain trend occurring between eastern Pamir, through the Karakoram to West Kunlun Shan. However, it is difficult to disentangle the effects of surge-related and mass gain-related advance. Differences between surging and advancing glaciers have recently been investigated in the Eastern Karakoram [65]. That study identified three potential differences including (i) advancing terminus characteristics, where the surging glacier terminus was more ‘bulbous’, (ii) the surging glacier experienced a more dramatic fluctuation in surface velocity, whereas the advancing glacier exhibited more stable flow, and (iii) surface elevation on the surging glacier decreased in the reservoir area and increased in the receiving zone. These differences may however be related to heterogeneous thermal and hydrological regimes, and the spectrum of flow instability operating in the region.
Type 3 glaciers, representing 26 (19%) of the study glaciers, undergo a period of abrupt advance (up to 60% glacier length) over months to years at some point during the study time series. It is likely that Type 3 glaciers advance a greater proportion of their length, compared with other surge-types identified in this study, due to their ability to more rapidly convey mass from a reservoir to a receiving zone. This behaviour is characteristic of a hydrologically regulated surge mechanism, the typical mechanism thought to control temperate surging glaciers, e.g., Variegated Glacier, Alaska [9], and Kyagar Glacier, Karakoram [66]. This surge-type is observed most often in Karakoram and Pamir sub-regions. In some of the glacier terminus position graphs, abrupt advance can be observed superimposed onto a gradual advancing trend. This is consistent with the mass gain trend and associated Karakoram Anomaly [33].
Type 4 glaciers reveal the most about surge dynamics, including surge periodicity and event magnitude changes through time. Glaciers characterised by this behaviour have undergone multiple phases of advance or retreat during the study period. This surge-type was observed in 15 (11%) of the study glaciers. All glaciers from this class underwent two surges during the study timeframe, with the exception of H16, which surged three times. Surge periodicity (quiescent phase durations) from this type of glacier ranged between 12 and 23 years. These glaciers are likely regulated hydrologically, as if a thermal-regulation mechanism was operating, expected surge periodicity would be substantially lower due to the longer quiescent phase durations typical of thermally regulated surges. The glacier terminus position graphs from Type 4 glaciers can be used as a basis for comparison between surge events at the same glacier. For example, Sabche Glacier (H16) underwent three surges between 1988–2019. According to the glacier terminus position graph (Figure 6), H16 surges increased in magnitude for each subsequent event. The first recorded surge advanced approximately 25% of the glacier length, the second 30% and the most recent 45%. This is likely related to quantity of accumulated mass in the reservoir area located roughly 3 km up-glacier from the terminus. Lovell et al. (2018) [45] identify a bowl-shaped depression, which they interpret as the glacier’s reservoir area. When this reservoir reaches a critical threshold, surging ensues, and mass is transferred down-glacier. In this instance, topography exerts a strong control on surge dynamics at this glacier. This study’s results support their inferences and validate their observations.
Behaviour-types 5 (five glaciers, 4%) and 6 (two glaciers, 1%) were the least frequently observed behaviours in this study. Despite overall retreat being the defining characteristic of Type 5 and 6 terminus change time series graphs, all glaciers exhibited some degree of short-term advance within the study period. These behavioral-types were found entirely in the Karakoram and West Kunlun Shan, despite a high proportion of glaciers in these sub-regions being characterised by mass gain and glacier expansion, highlighting that these observed trends are not sub-region-wide. This fits with observations in other studies, e.g., Gardelle et al. (2012) [67] who identified that around 50% glaciers were advancing or stable between 2000–2008; however, some glaciers still retreated, in line with the globally observed recession trend.
5.3. Regional Surge Characteristics
Analysis of surge characteristics can contribute to the identification of a specific controlling mechanism of a surging glacier, e.g., hydrological or thermal regulation. Each controlling mechanism has an indicative range of associated characteristics, however these ranges are anecdotal and can overlap. Overall, surge characteristics observed in this study were variable within and between sub-regions. This variability, combined with the overlap in range of mechanism indicators restricts analysis in this study to speculation only, however some notable trends were identified. Characteristics derived from terminus change time series data included surge duration, distance, and daily and maximum-averaged terminus advance rates. Terminus advance rates established in this study are calculated using total surge duration, or duration between image pairs and absolute terminus advance distance. The values obtained are therefore partially biased by image frequency.
5.3.1. Tian Shan
In Tian Shan, surge durations ranged from 1 to 12 years, with mean and median durations of 7.25 and 8 years, respectively. This is comparatively short-lived, considering average durations in some adjacent sub-regions, e.g., Karakoram and West Kunlun Shan, but still longer than many hydrologically regulated surges. Surge distances observed in Tian Shan ranged from 0.12 to 3.2 km. A maximum-averaged terminus advance rate of 7.8 md−1 was observed at North Inylchek Glacier (TS24), while the other glaciers in this sub-region were characterised by significantly lower advance rates. The small number of sub-regional glacier samples, and wide range of observed surge terminus behaviour and derived surge characteristics limit any inferences that can be made regarding the surging phenomenon in Tian Shan.
5.3.2. Pamir
In Pamir, 12 out of 22 (54%) glaciers surged for a duration of 5 years or less. This short duration is indicative of a hydrological mechanism. This is supported by Dowdeswell et al. (1991) and Wendt et al. (2017) [40,64]. Pamir glaciers surged the second furthest absolute distances (1.6 and 1.3 km mean and median), closely following Tian Shan. This is likely linked to the temperate thermal regimes that characterise these glaciers and again supports existence of a hydrological surging control. High maximum-averaged terminus advance rates of 36.4 m d−1 were observed at Medvezhiy Glacier (P21). For reference, quiescent phase terminus change rates at this glacier were three orders of magnitude slower at m d−1. Advance rates this high also support a hydrological surge mechanism. Other individual and sub-region-wide studies of surging in Pamir suggest that no clear, distinguishable surge mechanism exists due to ambiguous and conflicting evidence to support both hydrological and thermal mechanisms [17,49]. If this is the case, perhaps the spectrum of flow instability model proposed for the Karakoram by Quincey et al. (2015) [42], or Sevestre and Benn’s (2015) [4] enthalpy framework could also apply to the Pamir sub-region.
5.3.3. Karakoram
In the Karakoram, many study glacier termini begin to advance around the mid-late 1990s. This occurs in line with two potentially inter-linked and widely acknowledged observations. Climate observations indicate an increase in winter precipitation and a small decrease in summer temperatures since the 1960s, resulting in the slight mass gain trend observed in Karakoram and adjacent eastern Pamir and West Kunlun Shan [34]. Hewitt (2005) [33] suggests expansion of Karakoram glaciers from the mid-late 1990s is attributable to thermal shifts in ice masses with extreme altitudinal ranges causing accelerated redistribution of ice mass by elevation. These thermal shifts at high elevations may be triggered by mass gain, caused by increased precipitation at high altitudes thickening ice, resulting in pressure melting, reduced friction at the glacier bed and enhanced sliding.
Observed surge duration in Karakoram ranges from 2 to 29 years, with the central 50% of surges lasting 7–20 years. Based on the duration of many Karakoram surges, in conjunction with their gradually advancing termini over annual to decadal timescales, thermal regulation of surges seems the likely dominant controlling mechanism. However, some surge durations are clearly indicative of a hydrological mechanism, such as glacier K30 which advanced around 50% its glacier length (3.55 km) in less than 5 years. The literature supports these inferences, highlighting the difficulty of categorizing surging into one clearly defined end-member.
Quincey et al. (2011) [10] suggested surges in the Karakoram are largely thermally regulated, evidenced through gradual acceleration over several years, in response to observed climate anomalies since the 1960s, and associated high altitude warming of ice masses. Quincey et al. (2015) [42] later revised their interpretation due to observing a variety of surge behaviour characteristic of both thermal and hydrological regulation, and suggested that Karakoram surging occurs on a spectrum of flow instability. Our study similarly observed this variety of surge behaviour, further supporting the existence of a spectrum, as also implied by the enthalpy theory [4].
The maximum terminus advance distance, 6.4 km (equivalent to 62.7% of glacier length) was observed in this sub-region over an 11-year period. The Karakoram also exhibits low daily and maximum-averaged terminus advance rates, further supporting a dominant thermal regulation mechanism. The maximum advance rate observed in the Karakoram was at Glacier K5, where the glacier advanced at a rate of 12.5 m d−1, equating to 4.5 km a−1. This value is approximately 2.5 km a−1 faster than the maximum observed Karakoram surge velocities of 2 km a−1 observed by Quincey et al. [10]. However, their sample size was smaller (eight glaciers) and consequently less representative of surging across the Karakoram.
5.3.4. West Kunlun Shan
In West Kunlun Shan, 16 out of 26 (62%) study glaciers exhibited surge durations exceeding 10 years. These protracted durations are characteristic of thermally regulated surges. Chudley and Willis (2019) [44] partially support this inference, based on relatively slow observed surge velocities, ranging 0.2–1.5 km a−1, and prolonged build-up and termination phases, similar to those observed in this study. However, they also suggest seasonality of surges (summer speed-up) could be indicative of hydrological regulation. Yasuda and Furuya (2015) [43] support a hydrological model of surging in West Kunlun Shan based on seasonal modulation of velocity by about 200% in early winter, compared with those in early summer. Overall, no classical surge model describes the observations, either within or between studies, providing further support for the enthalpy model.
The lowest absolute terminus advance distances were observed in West Kunlun Shan (1.7 km maximum). The small terminus advances observed in West Kunlun Shan could be linked to thermal regime. The climate in West Kunlun Shan is one of the most continental, cold and dry climates across HMA, only influenced by the East Asian Monsoon, receiving around 300 mm a−1 precipitation [68].
When considering surge terminus advance distance in conjunction with surge duration and local climate in West Kunlun Shan, there is clear supporting evidence for a thermally regulated surge mechanism. The lowest daily and maximum-averaged terminus advance rates were observed in West Kunlun Shan (mean daily averaged terminus advance rates 0.15 m d−1, and mean maximum-averaged terminus advance rates 0.4 m d−1), in line with observations of surge duration, and absolute terminus advance distance. This reinforces the likelihood of a dominant thermal surging control. Terminus advance rates calculated for West Kunlun Shan in this study (0.6 m d−1) were within range of feature-tracked velocities established by Yasuda and Furuya (2015) [43], where velocities ranged from 0.2 to 1 km a−1 and Chudley and Willis (2019) [44], where velocities ranged from 0.2 to 1.5 km a−1.
5.3.5. Himalaya
Himalayan glaciers show the least variation in surge duration, however this is partly a consequence of the small sample size (three glaciers). On average, Himalayan glacier surge durations span around seven years. This is neither long nor short compared with clearly thermally or hydrologically regulated surges, complicating assignment of a clear surge mechanism.
5.4. Implications
Developing a well-established understanding of the surge phenomenon in HMA is necessary for several reasons. It may help to shed light on our understanding of the anomalous mass gain and glacier expansion widely observed between eastern Pamir and West Kunlun Shan. The limited understanding of this anomalous trend may partially explain why the behaviour of HMA glaciers is poorly constrained in models, e.g., [24,25], and the disparities in mass loss estimates between studies of the same region.
Surging remains a complex and not fully understood phenomenon on a global scale. HMA is hugely under-studied considering it represents the second major global surge cluster [4]. Based on this study’s results, it was possible to suggest mechanisms that control surging synoptically across HMA, as well as identify trends and heterogeneity between repeat surge events at individual glaciers, and locations where surge-related hazard potential is elevated. Considering surge duration, terminus advance distance and rate, and surge periodicity, surging in Pamir is likely to be largely controlled by a hydrological switch mechanism. This is supported by other studies, e.g., [40,64], and provides validation for other surge studies in Pamir. In contrast, West Kunlun Shan and Karakoram sub-regions appear to be predominantly controlled by a thermal surge mechanism based on their long durations and relatively slow advance rates. However, surge characteristics in the Karakoram show greater variability, supporting the idea of surging occurring on a spectrum of flow instability and via the enthalpy framework proposed by Quincey et al. (2015) [42] and Sevestre and Benn (2015) [4]. Due to smaller sample sizes and ambiguous surge characteristics (in-between hydrological and thermal end-members), attributing Tian Shan and Himalayan surges to an individual surge-type was not feasible. These results validate findings from several studies across HMA at the sub-regional and individual glacier scale. In line with Quincey et al. (2015) [42], it is possible to determine that surging in HMA represents a spectrum of flow instability and in general sub-regions show evidence of both hydrologically and thermally regulated surging.
By analysing trends and heterogeneity between repeat surge events at individual glaciers, we obtain insight into their potential future glacier and surge dynamics. Glacier H16 (Sabche Glacier) represented the best example of this. Sabche Glacier surged three times during the study timeframe, each time characterised by a terminus advance more extensive than the previous. Regular monitoring of Sabche glacier could be used to review continuation of this behaviour. In many other repeat surge events from this study, terminus advance distance was comparable at individual glaciers between events, suggesting the controlling mechanisms between events were unified.
There were 18 surging glaciers identified in this study that have the potential to block valleys (Figure 8). Blocking of glacier valleys encourages formation of ephemeral proglacial lakes, increasing glaciological and GLOF hazard potential. Of particular interest is glacier TS24 (North Inylchek Glacier), Tian Shan, where a surge in 1996 displaced 1.5 × 10⁸ m3 water from upper Lake Merzbacher, filling lower Lake Merzbacher, culminating in its GLOF three months later [48]. Downstream from North Inylchek Glacier and Lake Merzbacher is a settlement that is potentially vulnerable to these catastrophic drainage events. By developing a comprehensive understanding of surge distribution and where surge-related terminus advance is likely to inundate land using GEE and remote imagery, it is possible to gain insight where glacial lakes may form and potentially cause catastrophic GLOF hazards. This information can subsequently be used to assist with hazard modelling, which may be of interest to local communities, stakeholders and scientists.
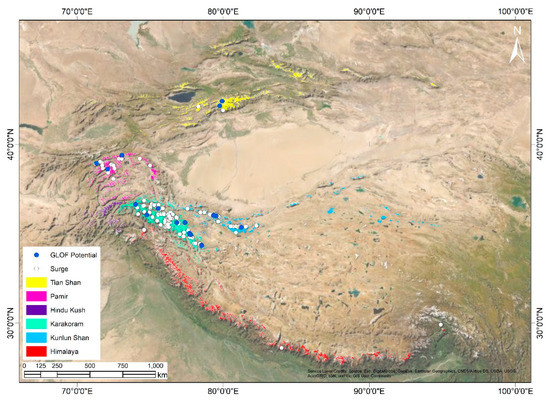
Figure 8.
Surging glaciers identified with the potential to block glacier valleys, encourage glacier lake formation, and increase the glacier lake outburst flood (GLOF) hazard.
5.5. Evaluation of Methods
The use of satellite imagery and GEE for surge identification and quantification of characteristics has significantly enhanced our understanding of the surge phenomenon. Prior to remote sensing, observations of glacier surging were sparse and so understanding of the phenomenon was limited. In this study, the approach used successfully facilitated identification and quantification of the surge characteristics of 137 glaciers across HMA. This study represents one of the largest-scale remote sensing-based studies of surging that exists. It has achieved a degree of representation of surging occurrence across HMA that is not attainable in smaller scale (sub-regional or individual glacier) studies by providing a synoptic overview of surging. Large-scale studies, like this, complement highly detailed smaller-scale studies of surge behaviour.
Focusing solely on terminus change consequently meant that surging glaciers identified in this study represent a minimum number of surges occurring in the study timeframe, as surges are often but not always accompanied by terminus advance [7]. Obscuration of glacier termini by debris cover may also have resulted in the overlooking of some surge events. Enhanced satellite image availability would have facilitated a higher resolution glacier terminus position time series. This would increase the accuracy of the derived quantified surge characteristics, including duration, and terminus advance rate calculations.
Satellite image acquisition rate is continuously increasing through time. This can be observed in the terminus change time series calculated here, where data points (representing image dates) generally increase through time. Consequently, study data becomes higher temporal resolution, and the strength of the method utilised in this study therefore also increases with enhanced image availability.
Some issues were encountered relating to image availability and suitability. One of the most prevalent issues was the absence of satellite imagery between 2000–2008 for many study glaciers. This issue is a consequence of omitting Landsat 7 data from the image selection due to recurring SLF. SLF is a known issue with Landsat 7 imagery since 2003 when the scan line corrector, which compensated for the forward motion of Landsat 7 failed [69]. This technical failure resulted in a 22% reduction of usable data in each Landsat 7 ETM+ scene. Potential methods for correcting the SLF imagery such as interpolating median surrounding values or mosaicing across time were deemed not suitable and out of the scope of this study. In many instances this influenced visualisation of surge data and glacier terminus change time series, making small-scale change detection particularly difficult for the affected period. Specifically, surge-related terminus advance during this period was generally visible in the time series based on terminus positions before and after the imagery gap, but accurately defining the duration of surges where this occurred was more difficult. Other image suitability issues related to snow-cloud detection, minimised using the built-in GEEDiT cloud filter, and topographic shadow. Moving forward, data availability will continue to expand as the number of available platforms, e.g., Sentinel, and NISAR (launch 2022), increase.
For potential future development, it would be possible to automate the margin change and quantification methods utilised in this study using computer vision and machine learning to develop an algorithm for edge detection of glacier termini.
6. Conclusions
Satellite imagery has revolutionised the study of surging glaciers, providing researchers with a greater understanding of their causes, mechanisms and behaviour. As satellite imagery archives expand and become higher resolution both temporally and spatially, its potential to characterise increasingly fine-resolution glacier dynamics will develop. This will significantly contribute to our understanding of surge dynamics and holds potential for continuous monitoring of the surging phenomenon.
This study has successfully identified, characterised and quantified glacier surging at an unprecedented scale across High Mountain Asia between 1987–2019 by accurately digitising glacier terminus change through time. This is a much-needed synoptic-scale study of this highly complex phenomenon using an entirely remote sensing-based approach. By utilising Google Earth Engine, and the GEEDiT algorithm, developed to quickly digitize glacier terminus position [20], 137 surging glaciers were identified in total, 55 of which were newly identified, and 15 of these glaciers surged multiple times within the study timeframe. Common limitations associated with satellite imagery for time series analysis, including frequency of high quality images limits the accuracy of the quantified surge characteristics. This was largely overcome with a subjective characterisation approach.
Results of this study revealed glacier surging across HMA is a complex phenomenon. The distribution of surging was heterogeneous, with the greatest frequency of surge incidence occurring between Pamir, through the Karakoram, to West Kunlun Shan. Only isolated incidences of surging occurred in Tian Shan and Himalayan sub-regions. This distribution of surging validated previous sub-regional studies, as well as provided additional evidence in support of the Karakoram Anomaly.
Glacier terminus change time series analysis enabled the development of a six-part classification of surge phenomenology. This novel classification provided a simple, effective means for classifying this large dataset and clustering trends in terminus change behaviour. This classification could also be applied in other glaciated regions characterised by glacier surging and flow instability, and it has potential for wider application to glacier terminus change studies. Surge-types 2 and 3 (gradual and abrupt advance) were the most frequently observed behaviours.
Several variables were also quantified from terminus change time series analysis, including surge duration, terminus change distance (absolute and proportional), daily and maximum-averaged terminus advance rates, and surge periodicity. Although considerable intra- and extra- sub-regional variation in surge behaviour was observed, this study suggests a change in the dominant surge mechanism across HMA exists, with hydrological regulation mechanisms common in Pamir, and thermal regulation mechanisms dominant in the Karakoram and West Kunlun Shan. However, in most sub-regions there was evidence in support of both hydrologically and thermally regulated surging, supporting the idea that surging occurs along a spectrum of flow instability, and within the unifying enthalpy framework.
Future developments with machine learning are suggested and with increasing image frequency and automation, near real-time monitoring of surging glaciers could be achieved, with positive outcomes for hazard mitigation.
Supplementary Materials
Supplementary material and data can be found in https://www.mdpi.com/article/10.3390/rs13071309/s1, University of Cambridge Apollo Repository. S1 provides a list of imagery used in this study, a supporting map with Landsat Path/Row, and terminus position shapefiles for all study glaciers. S2 combines relevant glacier information from RGI v6.0 with study’s alphanumeric identifiers, quantified surge characteristics, and allocated surge-type classifications. S3 provides the terminus position time series graphs normalized by glacier length that were used to classify the study glaciers.
Author Contributions
A.B.V., N.S.A. and W.G.R. conceptualised this study. A.B.V. processed the data, analysed the datasets, prepared all figures and wrote the manuscript. N.S.A. and W.G.R. contributed to the writing and editing of the manuscript for publication. J.M.L. developed the Google Earth Engine Digitisation Tool (GEEDiT) used to delimit glacier termini in this study and contributed to the editing of this manuscript. All authors have read and agreed to the published version of the manuscript.
Funding
A.B.V.’s work was supported by a University of Bristol Scholarship (Grant no. U104481-102). J.M.L.’s work on this research was supported by UKRI Future Leaders Fellowship (Grant No. MR/S017232/1).
Institutional Review Board Statement
Not applicable.
Informed Consent Statement
Informed consent was obtained from all participants in the glacier classification exercise.
Data Availability Statement
Data has been made publicly available in the University of Cambridge Apollo repository at doi.org/10.17863/CAM.66426 (accessed on 5 January 2021).
Acknowledgments
Gratitude is given to colleagues at Scott Polar Research Institute for their advice during the undertaking of this research and their participation in crowd-sourcing for the development of the surge classification used in this research. We are grateful to the anonymous reviewers for their constructive input on this manuscript.
Conflicts of Interest
The co-authors on this paper Gareth Rees and Neil Arnold are both guest editors of the “Remote Sensing in Glaciology and Cryosphere Research” special edition.
References
- Yao, T.; Thompson, L.; Yang, W.; Yu, W.; Gao, Y.; Guo, X.; Yang, X.; Duan, K.; Zhao, H.; Xu, B.; et al. Different Glacier Status with Atmospheric Circulations in Tibetan Plateau and Surroundings. Nat. Clim. Chang. 2012, 2, 663–667. [Google Scholar] [CrossRef]
- Miles, E.S.; Willis, I.; Buri, P.; Steiner, J.F.; Arnold, N.S.; Pellicciotti, F. Surface Pond Energy Absorption Across Four Himalayan Glaciers Accounts for 1/8 of Total Catchment Ice Loss. Geophys. Res. Lett. 2018, 45. [Google Scholar] [CrossRef]
- Bolch, T.; Kulkarni, A.; Kääb, A.; Huggel, C.; Paul, F.; Cogley, J.G.; Frey, H.; Kargel, J.S.; Fujita, K.; Scheel, M.; et al. The State and Fate of Himalayan Glaciers. Science 2012, 336, 310–314. [Google Scholar] [CrossRef]
- Sevestre, H.; Benn, D.I. Climatic and Geometric Controls on the Global Distribution of Surge-Type Glaciers: Implications for a Unifying Model of Surging. J. Glaciol. 2015, 61, 646–662. [Google Scholar] [CrossRef]
- Sharp, M. Surging Glaciers: Behaviour and Mechanisms. Prog. Phys. Geogr. 1988, 12, 349–370. [Google Scholar] [CrossRef]
- Yde, J.C.; Paasche, Ø. Reconstructing Climate Change: Not All Glaciers Suitable. Eos Trans. Am. Geophys. Union 2010, 91, 189–196. [Google Scholar] [CrossRef]
- Frappé, T.P.; Clarke, G.K.C. Slow Surge of Trapridge Glacier, Yukon Territory, Canada. J. Geophys. Res. Earth Surf. 2007, 112, 1–17. [Google Scholar] [CrossRef]
- Jiskoot, H.; Boyle, P.; Murray, T. The Incidence of Glacier Surging in Svalbard: Evidence from Multivariate Statistics. Comput. Geosci. 1998, 24, 387–399. [Google Scholar] [CrossRef]
- Kamb, B.; Raymond, C.F.; Engelhardt, H.; Echelmeyer, K.A.; Brugm, M.M. Glacier Surge Mechanism: 1982–1983 Surge of Variegated Glacier, Alaska. Science 1985, 227, 469–479. [Google Scholar] [CrossRef]
- Quincey, D.J.; Braun, M.; Glasser, N.F.; Bishop, M.P.; Hewitt, K.; Luckman, A. Karakoram Glacier Surge Dynamics. Geophys. Res. Lett. 2011, 38, L18504. [Google Scholar] [CrossRef]
- Gardelle, J.; Berthier, E.; Arnaud, Y.; Kaab, A.; Kaab, A. Region-Wide Glacier Mass Balance over the Pamir-Karakoram-Himalaya during 1999–2011. Cryosphere 2013, 7, 1263–1286. [Google Scholar] [CrossRef]
- Bhambri, R.; Bolch, T.; Kawishwar, P.; Dobhal, D.P.; Srivastava, D.; Pratap, B. Heterogeneity in Glacier Response in the Upper Shyok Valley, Northeast Karakoram. The Cryosphere. Cryosphere 2013, 7, 1385–1398. [Google Scholar] [CrossRef]
- Kääb, A.; Treichler, D.; Nuth, C.; Berthier, E. Brief Communication: Contending Estimates of 2003-2008 Glacier Mass Balance over the Pamir-Karakoram-Himalaya. Cryosphere 2015, 9, 557–564. [Google Scholar] [CrossRef]
- Lv, M.; Guo, H.; Lu, X.; Liu, G.; Yan, S.; Ruan, Z.; Ding, Y.; Quincey, D.J. Characterizing the Behaviour of Surge and Non-Surge-Type Glaciers in the Kingata Mountains, Eastern Pamir, from 1999–2016. Cryopshere 2019, 13, 219–236. [Google Scholar] [CrossRef]
- Haemmig, C.; Huss, M.; Keusen, H.; Hess, J.; Wegmüller, U.; Wegmüller, W.; Ao, Z.; Kulubayi, W. Hazard Assessment of Glacial Lake Outburst Floods from Kyagar Glacier, Karakoram Mountains, China. Ann. Glaciol. 2014, 55, 34–44. [Google Scholar] [CrossRef]
- Bhambri, R.; Watson, C.S.; Hewitt, K.; Haritashya, U.K.; Kargel, J.S.; Pratap Shahi, A.; Chand, P.; Kumar, A.; Verma, A.; Govil, H. The Hazardous 2017–2019 Surge and River Damming by Shispare Glacier, Karakoram. Sci. Rep. 2020, 10, 1–14. [Google Scholar] [CrossRef] [PubMed]
- Kotlyakov, V.M.; Osipova, G.B.; Tsvetkov, D.G. Monitoring Surging Glaciers of the Pamirs, Central Asia, from Space. Ann. Glaciol. 2008, 48, 125–144. [Google Scholar] [CrossRef]
- Bhambri, R.; Hewitt, K.; Kawishwar, P.; Pratap, B. Surge-Type and Surge-Modified Glaciers in the Karakoram. Sci. Rep. 2017, 7, 1–14. [Google Scholar] [CrossRef]
- Gorelick, N.; Hancher, M.; Dixon, M.; Ilyushchenko, S.; Thau, D.; Moore, R. Google Earth Engine: Planetary-Scale Geospatial Analysis for Everyone. Remote Sens. Environ. 2017, 202, 18–27. [Google Scholar] [CrossRef]
- Lea, J.M. Google Earth Engine Digitisation Tool (GEEDiT) and Margin Change Quantification Tool (MaQiT)-1 Simple Tools for the Rapid Mapping and Quantification of Changing Earth Surface Margins. Earth Surf. Dyn. Discuss. 2018, 6. [Google Scholar] [CrossRef]
- RGI Consortium. Randolph Glacier Inventory (RGI)—A Dataset of Global Glacier Outlines: Version 6.0; Global Land Ice Measurements from Space: Boulder, CO, USA, 2017. [Google Scholar]
- Treichler, D.; Kääb, A.; Salzmann, N.; Xu, C.-Y. Recent Glacier and Lake Changes in High Mountain Asia and Their Relation to Precipitation Changes. Cryosphere 2019, 13, 2977–3005. [Google Scholar] [CrossRef]
- Treichler, D.; Kääb, A.; Salzmann, N. High Mountain Asia Glacier Elevation Trends 2003–2008, Lake Volume Changes 1990–2015 and their Relation to Precipitation Changes. Cryosphere Discuss. 2018. [Google Scholar] [CrossRef]
- Brun, F.; Berthier, E.; Wagnon, P.; Kääb, A.; Treichler, D. A Spatially Resolved Estimate of High Mountain Asia Glacier Mass Balances from 2000–2016. Nat. Geosci. 2017, 10, 668–673. [Google Scholar] [CrossRef]
- Vaughan, D.G.; Comiso, J.C.; Allison, I.; Carrasco, J.; Kaser, G.; Kwok, R.; Mote, P.; Murray, T.; Paul, F.; Ren, J.; et al. Observations: Cryosphere. In Climate Change 2013: The Physical Science Basis. Contribution of Working Group I to the Fifth Assessment Report of the Intergovernmental Panel on Climate Change; Stocker, T.F., Qin, D., Plattner, G.-K., Tignor, M., Allen, S.K., Boschung, J., Nauels, A., Xia, Y., Bex, V., Midgley, P.M., Eds.; Cambridge University Press: Cambridge, UK, 2013. [Google Scholar]
- Bolch, T.; Shea, J.M.; Liu, S.; Azam, F.M.; Gao, Y.; Gruber, S.; Immerzeel, W.; Kulkarni, A.; Li, H.; Tahir, A.; et al. Status and Change of the Cryosphere in the Extended Hindu Kush Himalaya Region. In The Hindu Kush Himalaya Assessment; Springer: Cham, Switzerland, 2019; pp. 209–255. [Google Scholar] [CrossRef]
- Bookhagen, B.; Burbank, D.W. Topography, Relief and TRMM-Derived Rainfall Variations along the Himalaya. Geophys. Res. Lett. 2006, 33, L08405. [Google Scholar] [CrossRef]
- Maussion, F.; Scherer, D.; Molg, T.; Molg, M.; Collier, E.; Curio, J.; Finkelnburg, R. Precipitation Seasonality and Variability over the Tibetan Plateau as Resolved by the High Asia Reanalysis. J. Clim. 2014, 27, 1910–1927. [Google Scholar] [CrossRef]
- Bookhagen, B.; Burbank, D.W. Toward a Complete Himalayan Hydrological Budget: Spatiotemporal Distribution of Snowmelt and Rainfall and their Impact on River Discharge. J. Geophys. Res. Earth Surf. 2010, 115, F03019. [Google Scholar] [CrossRef]
- Hewitt, K. Glacier Change, Concentration and Elevation Effects in the Karakoram Himalaya, Upper Indus Basin. Mt. Res. Dev. 2011, 31, 188–200. [Google Scholar] [CrossRef]
- Farinotti, D.; Immerzeel, W.W.; De Kok, R.J.; Quincey, D.J.; Dehecq, A. Manifestations and Mechanisms of the Karakoram Glacier Anomaly. Nat. Geosci. 2020, 13, 8–16. [Google Scholar] [CrossRef]
- Berthier, E.; Brun, F. Karakoram Geodetic Glacier Mass Balances between 2008 and 2016: Persistence of the Anomaly and Influence of a Large Rock Avalanche on Siachen Glacier. J. Glaciol. 2019, 65, 494–507. [Google Scholar] [CrossRef]
- Hewitt, K. The Karakoram Anomaly? Glacier Expansion and the ‘Elevation Effect’ Karakoram Himalaya. Mt. Res. Dev. 2005, 25, 332–340. [Google Scholar] [CrossRef]
- Fowler, H.J.; Archer, D.R. Conflicting Signals of Climatic Change in the Upper Indus Basin. J. Clim. 2006, 19, 4276–4293. [Google Scholar] [CrossRef]
- Janes, T.J.; Bush, A.B.G. The Role of Atmospheric Dynamics and Climate Change on the Possible Fate of Glaciers in the Karakoram. J. Clim. 2012, 25, 8308–8327. [Google Scholar] [CrossRef]
- Li, X.-F.; Fowler, H.J.; Forsythe, N.; Blenkinsop, S.; Pritchard, D. The Karakoram/Western Tibetan Vortex: Seasonal and Year-to-Year Variability. Clim. Dyn. 2018, 51, 3883–3906. [Google Scholar] [CrossRef]
- De Kok, R.J.; De Tuinenburg, O.A.; Bonekamp, P.N.J.; Immerzeel, W.W. Irrigation as a Potential Driver for Anomalous Glacier Behavior in High Mountain Asia. Geophys. Res. Lett. 2018, 45, 2047–2054. [Google Scholar] [CrossRef]
- Mukherjee, K.; Bolch, T.; Goerlich, F.; Kutuzov, S.; Osmonov, A.; Pieczonka, T.; Shesterova, I. Surge-Type Glaciers in the Tien Shan (Central Asia). Arct. Antarct. Alp. Res. 2017, 49, 147–171. [Google Scholar] [CrossRef]
- Abe, T.; Furuya, M.; Sakakibara, D. Brief Communication: Twelve-Year Cyclic Surging Episodes at Donjek Glacier in Yukon, Canada. Cryosphere 2016, 10, 1427–1432. [Google Scholar] [CrossRef]
- Wendt, A.; Mayer, C.; Lambrecht, A.; Floricioiu, D. A Glacier Surge of Bivachny Glacier, Pamir Mountains, Observed by a Time Series of High-Resolution Digital Elevation Models and Glacier Velocities. Remote Sens. 2017, 9, 388. [Google Scholar] [CrossRef]
- Copland, L.; Sylvestre, T.; Bishop, M.; Shroder, J.; Seong, Y.; Owen, L.; Bush, A.; Kamp, U. Expanded and Recently Increased Glacier Surging in the Karakoram. Arct. Antarct. Alp. Res. 2011, 43, 503–516. [Google Scholar] [CrossRef]
- Quincey, D.J.; Glasser, N.F.; Cook, S.J.; Luckman, A. Heterogeneity in Karakoram Glacier Surges. J. Geophys. Res. Earth Surf. 2015, 120, 1288–1300. [Google Scholar] [CrossRef]
- Yasuda, T.; Furuya, M. Dynamics of Surge-type Glaciers in West Kunlun Shan, Northwestern Tibet. J. Geophys. Res. Earth Surf. 2015, 120, 2393–2405. [Google Scholar] [CrossRef]
- Chudley, T.R.; Willis, I.C. Glacier Surges in the North-West West Kunlun Shan Inferred from 1972–2017 Landsat Imagery. J. Glaciol. 2019, 65, 1–12. [Google Scholar] [CrossRef]
- Lovell, A.M.; Carr, J.R.; Stokes, C.R. Topographic Controls on the Surging Behaviour of Sabche Glacier, Nepal (1967–2017). Remote Sens. Environ. 2018, 210, 434–443. [Google Scholar] [CrossRef]
- Wenjing, Z. Identification of Glaciers with Surge Characteristics on the Tibetan Plateau. Ann. Glaciol. 1992, 16, 168–172. [Google Scholar] [CrossRef]
- Richardson, S.D.; Reynolds, J.M. An Overview of Glacial Hazards in the Himalayas. Quat. Int. 2000, 65, 31–47. [Google Scholar] [CrossRef]
- Häusler, H.; Ng, F.; Kopecny, A.; Leber, D. Remote-Sensing-Based Analysis of the 1996 Surge of Northern Inylchek Glacier, Central Tien Shan, Kyrgyzstan. Geomorphology 2016, 273, 292–307. [Google Scholar] [CrossRef]
- Shangguan, D.H.; Bolch, T.; Ding, Y.J.; Kröhnert, M.; Pieczonka, T.; Wetzel, H.U.; Liu, S.Y. Mass Changes of Southern and Northern Inylchek Glacier, Central Tian Shan, Kyrgyzstan, during 1975 and 2007 Derived from Remote Sensing Data. Cryopshere 2015, 9, 703–717. [Google Scholar] [CrossRef]
- Steiner, J.F.; Kraaijenbrink, P.D.A.; Jiduc, S.G.; Immerzeel, W.W. Brief Communication: The Khurdopin Glacier Surge Revisited-Extreme Flow Velocities and Formation of a Dammed Lake in 2017. Cryosphere 2018, 12, 95–101. [Google Scholar] [CrossRef]
- USGS. USGS Landsat: Collection 1 Level 1: Product Definition. Available online: https://www.usgs.gov/core-science-systems/nli/landsat/landsat-collection-1?qt-science_support_page_related_con=1#qt-science_support_page_related_con (accessed on 8 March 2019).
- Pepin, N.; Bradley, R.S.; Diaz, H.F.; Baraer, M.; Caceres, E.B.; Forsythe, N.; Fowler, H.; Greenwood, G.; Hashmi, M.Z.; Liu, X.D.; et al. Elevation-Dependent Warming in Mountain Regions of the World. Nat. Clim. Chang. 2015, 5, 424–430. [Google Scholar] [CrossRef]
- Miles, K.E.; Hubbard, B.; Irvine-Fynn, T.D.L.; Miles, E.S.; Quincey, D.J.; Rowan, A.V. Hydrology of Debris-Covered Glaciers in High Mountain Asia. Earth Sci. Rev. 2020, 207. [Google Scholar] [CrossRef]
- Brough, S.; Carr, J.R.; Ross, N.; Lea, J.M. Exceptional Retreat of Kangerlussuaq Glacier, East Greenland, between 2016 and 2018. Front. Earth Sci. 2019, 7. [Google Scholar] [CrossRef]
- Fahnestock, M.; Scambos, T.; Moon, T.; Gardner, A.; Haran, T.; Klinger, M. Rapid Large-Area Mapping of Ice Flow using Landsat 8. Remote Sens. Environ. 2016, 185, 84–94. [Google Scholar] [CrossRef]
- Storey, J.; Choate, M.; Kenton, L. Landsat 8 Operational Land Imager On-Orbit Geometric Calibration and Performance. Remote Sens. 2014, 6, 11127–11152. [Google Scholar] [CrossRef]
- USGS. USGS Landsat Levels of Processing. Available online: https://www.usgs.gov/core-science-systems/nli/landsat/landsat-levels-processing (accessed on 9 November 2020).
- QGIS. QGIS Geographic Information System. Open Source Geospatial Foundation Project. 2019. Available online: https://qgis.org/en/site (accessed on 22 June 2020).
- Lea, J.M.; Mair, D.W.F.; Rea, B.R. Evaluation of Existing and New Methods of Tracking Glacier Terminus Change. J. Glaciol. 2014, 60, 323–332. [Google Scholar] [CrossRef]
- Paul, F. Revealing Glacier Flow and Surge Dynamics from Animated Satellite Image Sequences: Examples from the Karakoram. Cryosphere 2015, 9, 2201–2214. [Google Scholar] [CrossRef]
- Hamilton, G.S.; Dowdeswell, J.A. Controls on Glacier Surging in Svalbard. J. Glaciol. 1996, 42, 157–168. [Google Scholar] [CrossRef]
- Jiskoot, H.; Murray, T.; Boyle, P. Controls on the Distribution of Surge-Type Glaciers in Svalbard. J. Glaciol. 2000, 46, 412–422. [Google Scholar] [CrossRef]
- Copland, L.; Sharp, M.J.; Dowdeswell, J.A. The Distribution and Flow Characteristics of Surge-Type Glaciers in the Canadian High Arctic. Ann. Glaciol. 2003, 36, 73–81. [Google Scholar] [CrossRef]
- Dowdeswell, J.A.; Hamilton, G.S.; Hagen, J.O. The Duration of the Active Phase on Surge-Type Glaciers: Contrasts between Svalbard and Other Regions. J. Glaciol. 1991, 37, 388–400. [Google Scholar] [CrossRef]
- Lv, M.; Guo, H.; Yan, J.; Wu, K.; Liu, G.; Lu, X.; Ruan, Z.; Yan, S. Distinguishing Glaciers between Surging and Advancing by Remote Sensing: A Case Study in the Eastern Karakoram. Remote Sens. 2020, 12, 2297. [Google Scholar] [CrossRef]
- Round, V.; Leinss, S.; Huss, M.; Haemmig, C.; Hajnsek, I. Surge Dynamics and Lake Outbursts of Kyagar Glacier, Karakoram. Cryosphere 2017, 11, 723–739. [Google Scholar] [CrossRef]
- Gardelle, J.; Berthier, E.; Arnaud, Y. Slight Mass Gain of Karakoram Glaciers in the Early Twenty-First Century. Nat. Geosci. 2012, 5, 322–325. [Google Scholar] [CrossRef]
- Bao, W.-J.; Liu, S.-Y.; Wei, J.-F.; Guo, W.-Q. Glacier Changes during the Past 40 Years in the West Kunlun Shan. J. Mt. Sci. 2015, 12, 344–357. [Google Scholar] [CrossRef]
- NASA. NASA Landsat Science: Landsat 7. Available online: https://landsat.gsfc.nasa.gov/landsat-7 (accessed on 9 March 2019).


Publisher’s Note: MDPI stays neutral with regard to jurisdictional claims in published maps and institutional affiliations. |
© 2021 by the authors. Licensee MDPI, Basel, Switzerland. This article is an open access article distributed under the terms and conditions of the Creative Commons Attribution (CC BY) license (http://creativecommons.org/licenses/by/4.0/).