1. Related Works Concerning Rural Heritage
The objective of the present work is to show the documentation obtained in a study carried out to characterize and digitize a series of buildings that can be found in rural areas all over Europe and the Middle East, each of which has constructive and formal characteristics according to the area in which it is located. These buildings, which are known as dovecotes, were built in rural areas to shelter domestic pigeons or doves. There are already some studies regarding the current state of some of these buildings, as can be seen in [
1,
2] from an ethnographic point of view.
The goals of pigeon breeding were, until the late 20th century, to provide a complementary supply of food, exploitation for hunting-type activities, and the use of droppings as compost. The ceasing of these activities led these dovecotes to lose their main function in rural areas and they have, therefore, now been neglected as regards to their care and maintenance, thus leading to their abandonment and ruin.
In order to recover and showcase an important part of rural culture that is already being lost, we therefore intended to study these buildings from an architectural point of view with the help of sensors and specialized technology. This kind of approach has already been made previously, especially in larger buildings and infrastructures like Elsaid et al. did in the Greco-Roman Museum in Egypt using terrestrial laser scanning for a later BIM (Building Information Model) model [
3] or as a way to manage documentation in post-disaster heritage sites, as in [
4], where a sensorial fusion was made using data gathered in different moments in the Glasgow School of Art. This technology will lead to a better understanding of the material, geometric and formal characteristics of the buildings, and of their current state of conservation, and this documentation can additionally be employed as a starting point to spread the word about this ethnographic heritage in the central-southern areas of Spain.
Studies related to the characterization of dovecotes have already been carried out in other extensive rural areas in Spain, such as Zamora [
5] and Aragón [
6], but none of them have used cutting edge technologies to obtain data, which is, in certain respects, a limitation. Given the informative and ethnographic inventory nature of these publications, these works are not very specific as regards to the methodology used to obtain the data. They specify only that local planimetry files were consulted if they existed and were available. The graphic documentation of the current state of conservation is, therefore, usually carried out manually with traditional tools such as tape measures and drawing by hand, and usually consists of only the basic volumetric and general measurements of the building. In the case of the work carried in the region of Aragon, only the use of control witnesses (using plaster mortar) to check the state of fissures owing to the possible movement of the walls is specified, along with the performance of other non-destructive tests that are common in the field of architectural restoration, but which are not defined in the methodology.
One reference work concerning vernacular buildings and their subsequent cataloguing in GIS (Geographic Information System) and HIS (Heritage Information System) systems is that of Domínguez-Ruíz, Rey-Pérez, and Rivero-Lamela in [
7]. These authors establish the most appropriate parameters that should be added to the database in the case of these vernacular constructions, when compared to those that would be added to a normal GIS, and this refers to objective data such as geographic coordinates, road infrastructures, construction dates, etc. This HIS includes subjective data parameters obtained from nearby inhabitants that may be significant for the conservation that might take place in a particular vernacular building or zone at a later date, e.g., of which properties are most valued by residents, or which roads and routes are culturally important for them in terms of local folklore. These inputs are not usually handled in conventional GIS models for topography or infrastructure.
The aforementioned studies have been carried out almost completely by hand as regards to defining the characteristics of buildings or largely rural-urban areas, even in studies whose objective is to graphically document individual isolated buildings, such as that carried out by Mira, Bevià, and Giner in the municipality of Castalla (Alicante, Spain) in [
8]. At no time do their authors use sensors or point cloud technologies of any kind to gain a better understanding of their case study building, despite the fact that the objective of their research is to employ a precise graphical approach, and that they even draft approximate distribution floor plans of a past state of the construction. This led us to believe that data collection with sensory technology is not usually prioritized or accessible for this kind of non-singular, small buildings in rural areas.
However, some related studies have been found for similar rural areas all over Europe, whose purpose is, as occurs with the study referenced below, to identify, catalogue, and subsequently place value on rural buildings and their surroundings in a wider context, which includes landscape and topography studies. This slightly more global approach of establishing relationships between vernacular architecture and landscape enabled us to find studies that employ a similar methodology to ours, such as the Lidoriki Project, carried out in the mountainous area near the Gulf of Corinth in Greece, which was documented by Brenningmeyer, Kourelis, and Katsaros [
9]. This project is interesting because it has also been carried out in an area that includes several municipalities, and on diverse and not very homogeneous terrains. Various UAV (Unmanned Aerial Vehicle) flights were, therefore, carried out in order to gather data, which were then used to create not only several photogrammetric-based 3D models of the landscapes but also simplified models of the architecture in these villages. The next steps of this study also included plans to use these photogrammetric models to obtain individual digital models.
There are also many previous studies that use UAV photogrammetry of cultural heritage to obtain data for the later drafting of an HBIM (Heritage Building Information Model) model of single unusual buildings. Although these are also useful, these studies do not really show the relationship between the buildings and their ethnographic context as we do but are instead employed with the highly defined purpose of geometrically modeling the architecture for a better understanding of it, and of subsequently continuing with future preservation activities using a set of as-is documentation. The work of Cavalagli et al. [
10] shows the possibilities of UAV as regards to evaluating structural damage to historic infrastructures, and similar techniques are also an important asset by which to survey and establish later conservation measures in the study carried by Sung and Zhang [
11] for Tibetan heritage architecture. Bakirman et al. also used this approach with an UAV system in [
12]. Another example of this use of UAV, but for later HBIM model generation in a rural area, is the study carried out by Karachaliou et al. [
13] in the traditional village of Metsovo, Greece. This was done by making several UAV flights in order to gather data and later digitize the authors’ local museum in an as-is photorealistic HBIM model. A similar study was carried out in Níjar in the province of Almería (Spain) using a combination of UAV flights to acquire data regarding an abandoned rural facility for its subsequent HBIM modeling using the point cloud and data obtained previously [
14]. In [
15], a study was carried out in Jeddah, in Saudi Arabia, where an HBIM was created in order to later import it to a 3D GIS program. As stated before, there are plenty of studies on HBIM, but they all have a similar approach of digitalization of singular buildings or ancient infrastructures, as Nieto et al. have done in [
16] to understand the construction stages or in [
17], where Castellano-Román and Pinto-Puerto study the different HBIM levels for a later management or conservation. On the other hand, and not necessarily looking for an HBIM model, photogrammetry with drone obtained data was employed to digitize an architectural-sculptural compound with its nearby surrounding terrain in the Qian Foya Grottoes in China [
18]. The authors include the visualization of the heritage asset in either an as-is interactive model or a theoretical reconstruction, and after processing the point clouds and creating the 3D models, real or approximate textures are applied to them for their subsequent importation to video game rendering engines. An excellent example of this is shown in [
19], in which Unity 3D [
20] is used as the visualization and interactive videogame engine for the divulgation of heritage.
2. Contributions
We have made essential improvements to the data acquisition and processing stages, thus attaining more accurate and precise 3D models, and providing construction professionals with greater accessibility to the results obtained in the fields of both single architecture models and ethnographic and socio-cultural data.
In this respect, we have considered it appropriate to carry out a study using a combination of scanning and processing techniques. We have taken as a reference, previous studies in the convergence of different technologies for the documentation of heritage, like the study carried out in the Magoska Temple [
21] using terrestrial laser scanning and UAV photogrammetry. This integration makes it possible to obtain very high-quality 3D models whose treatment is suitable for useful high-precision documentation when future restoration works will be carried out, or for being viewed on specific heritage or virtual reality platforms. We have also created a database containing the cartographic coordinates, the typology to which these dovecotes belong (e.g., attached to other constructions, isolated or tower-type constructions in an existing building), and photographs of the current state of conservation. This work has been carried out using a FARO Photon laser [
22] scanner for indoor views and a Phantom IV Advance [
23] drone vehicle for the exterior views of the buildings, which were later texturized by employing photogrammetry.
The main contributions of this work can be summarized as follows:
The study was carried out in a largely rural area, whereas the works reviewed above usually focus on the study of singular buildings (e.g., cathedrals, archaeological sites). This allows us to characterize these constructions with respect to ethnological and cultural aspects in their geographical area, in addition to comparing them.
It deals with the sensor fusion paradigm, in which a 3D scanner laser, an RGB camera, and an Unmanned Aerial Vehicle (UAV) were used to obtain integral, high-definition 3D, and graphic documentation.
The results contemplate a series of open-access virtual resources that have been made available to researchers and technicians. These consist of a catalogue of all the dovecotes studied, which includes important information about the building itself, photographs, and blueprints, along with 3D interactive models, which are accessible in an online repository.
This paper is structured as follows.
Section 3 shows our working methodology and describes shortly the main phases of the whole documentation process.
Section 4 presents the sensors used, the data collection stage, and the models, whereas
Section 5 deals with the integration of all the collected information into a common framework. Finally, our conclusions are summarized in
Section 6.
3. Methodology
This section shows our working methodology, which was employed in order to obtain and integrate documentation regarding 80 dovecotes. This study covers the north-eastern part of the province of Albacete in the region of Castilla-la-Mancha, Spain (see
Figure 1a), which principally comprises the municipalities of south-Villarobledo, El Bonillo, Ossa de Montiel, Viveros, el Ballestero, Munera, Lezuza, Barrax, and Minaya (see
Figure 1b).
The work is organized in 5 phases: Preliminary documentation, data collection, data storage, information processing, and visualization.
The prior documentation and location of the examples was obtained from several sources, the main ones being oral information (from local agents), the references attained from websites, blogs, or social networking forums related to the popular architecture of the specified area and tracking by means of IGN (Spanish National Geographic Institute) cartography, cadastral maps, or Google maps. This allowed us to locate about 80 dovecotes in the geographical area being studied.
Data collection (field work) had to be carried out by means of successive visits to the buildings, of which at least was required: an initial visit to discover the maintenance and accessibility conditions of the construction, a second visit (if owners had to be contacted) in order to verify whether the interior of the building was accessible, and a third to collect data using remote sensors.
During the first visit, traditional documentation resources were used to identify the external and internal characteristic elements and to measure the height, width, and dimensions of openings. The tools used for this purpose were a mobile phone, a camera, a laser distance measurer, a tape measure, and a notebook. The measurements were noted directly on the images taken using the mobile phone, while the camera made it possible to obtain the most relevant architectural details and the notebook was used to make explanatory drawings of constructive solutions, such as assemblies of elements or materials that were not visually identifiable. The information obtained during these first visits (exterior and/or interior together or independently) was then employed to generate a database (.xml or .dbs), which allowed the progressive incorporation of information as the documentation process of the different elements continued.
Once the relevant dovecotes had been located, it was necessary to respond to several questions in order to proceed with the documentation work regarding remote sensing and to choose the most appropriate procedure in each case. A laser-scanner was chosen to collect indoor data, whereas the outside of the building was sensed by employing a photogrammetry technique using unmanned vehicles (drones).
Most of the dovecote buildings had interior dimensions ranging between 4 and 7 m, which allowed complete scanning with two or three scans. The main difficulties were related to the small dimensions of the entrance (in some cases 60 cm × 150 cm) and the complexity of the access when transporting equipment (through trap doors and up ladders). In some cases, the poor structural safety conditions of the floors (owing to a lack of maintenance or abandonment) did not allow the correct positioning of the equipment.
Since most of these constructions are located in exposed and isolated places, it is necessary to have favorable weather conditions when working outdoors. The greatest difficulties are strong winds, which may affect the stability of the drone during flight, and sunlight, which may prevent the attainment of images without excessive contrast. Each data acquisition session was usually conducted for 3 or 4 interesting constructions located in the same area, as long as the conditions guaranteed profitable work.
The processing of the data obtained by means of aerial photography and terrestrial laser scanner was generally carried out using commercial tools, which easily provide the generation of models formed by point clouds that can then be exported in different formats (FLY, OBJ, BIN, E57, etc.). In the case of the exterior models, a mesh was generated, and the images were applied as a texture. However, the complexity of the interior models of these spaces, which are formed of thousands of "niches", does not allow the efficient generation of meshes because of high occlusion. In those cases, in which it was not possible to work with remote sensors, simpler 3D models were generated manually by considering the measurements collected using traditional documentation resources.
The information obtained during the various data acquisition phases and from processing was then stored in different repositories and connected by means of a common database file, which gathers all the information.
The visualization and exploration of the 3D models was mainly carried out using commercial and public visualization tools, such as REVIT [
24] and SKETCHUP [
25]. Regarding the content of the database file, the user can visualize different information of the dovecote in an Earth browser such as Google Earth [
26].
Figure 2 shows a chart of the general methodology.
4. Data Collection
As mentioned above, several different technologies were used to gather complete information about the dovecote buildings. The three technologies used in our documentation work (2D photography, 3D laser scanning, and photogrammetry) are described in the following subsections.
4.1. 2D Photography
Photography is an essential documentation tool for two main reasons: First, it enables the easy and rapid manual insertion of basic measurements and annotations on the same image by using some of the editing properties of current mobile phones. Second, several architectural details of characteristic elements of dovecote buildings, such as “openings”, “interior compartments”, or “roof towers”, cannot be obtained with sufficient resolution when using other remote sensing technologies (see
Figure 3). A Fujifilm FinePix S2000HD camera was used for photographic documentation. This camera has an effective still resolution of 10 Mp and 15× optical zoom, which allows the user to take precise photos of small details and interesting characteristics of the building.
4.2. 3D Laser Scanning
The goal of employing this technology was to attain accurate colored 3D models of the interiors of dovecotes. These are named as Terrestrial Laser Scanning (TLS) models. This process was split into planning, data collection, and data processing stages.
4.2.1. Planning
We first carried out the accessible scanner position planning in situ. The volume that could be covered in a single scan was constrained by several factors, such as: the field of view, the accessibility of the scanner, the occlusion conditions, and the overlapping between scans. The scan sequence was then sorted, which demanded a minimum overlapping of 30% between contiguous samples. Finally, two operators moved the scanner to each planned position and carried out the scanning procedure. A dovecote is usually composed of less than three contiguous rooms, so we took between 3 and 8 scans per dovecote. When we occasionally detected redundant views, these were discarded from the whole project.
4.2.2. Data Collection
Data acquisition took place during a single session of around 2 hours. The 3D sensor used was the FARO Photon 80 scanner with the FARO Scene software, which provides a panoramic view of the scene with azimuth and elevation ranges of [0,360°] and [−65°,90°], respectively. The data density is of 10.000 × 4307 points (using an extended range image view) per scan, which is taken in 7 minutes. The scanner has an accuracy of 0.6–17 mm at 6 and 76 m, respectively, with a systematic error of ±2 mm at 25 m.
A Nikon D200 camera with Nikon AF DX Fisheye lens of 10.5 mm focal distance is coupled to the scanner and assigns the color to the point cloud. The camera provides images of 3872 × 2592 pixels, with a total of 10.2 million effective pixels. This system makes up a single panoramic image from 10 single photos which are patched to a single scan.
The final amount of data and memory requirement per scan were over 1,500,000 points and 170 Mb, respectively. The geometric model was run on a Intel(R) Core(TM) i7-10810U CPU 2.4 GHz, 32 GB RAM computer. FARO Scene [
27] was the software used for collecting the colored point clouds of the scene.
4.2.3. Data Processing
Apart from noise and outlier filtering tasks in a pre-processing stage, we also had to correct errors in the color assignment process. The system is able to associate color information to around 90% of point clouds, but it was necessary to refine the color-geometry registration owing to small camera alignment errors. This problem was solved by establishing a pair of corresponding points in both the reflectance and the color images of two scans and then aligning them more accurately.
As mentioned above, the scans were taken from predefined locations, and the data were, therefore, referenced in different coordinate systems. The data of two sequential scans can be registered by using the well-known ICP (Iterative Closest Point) algorithm [
28], but in order to make the registration process more precise, we first carried out a coarse alignment by manually indicating several corresponding points in consecutive overlapping scans. The ICP algorithm was then run using the metric point-to-plane and a maximum number of iterations of 20. The root mean square error returned was below 7 mm.
Finally, and with the aim of attaining a model that was as regular and homogenous as possible, we conducted the normalization and resampling steps. The original point cloud was subsampled using a box grid filter, so that the points within the same box are merged to a single point in the output. With this subsampling, the point clouds were reduced up to 55% and with a precision of 1 point/cm
2. The size of the final model ranged between 2 to 4 million points. Matlab 2020a [
29] was the programming language used for data processing (
Figure 4).
4.3. Photogrammetric Technique
Data acquisition employing photogrammetry techniques with UAV was also carried out by following the aforementioned stages: planning, data acquisition, and data processing. These are the Structure from Motion (SfM) models.
4.3.1. Planning
In the planning stage, the flight zone was first evaluated by considering the following aspects:
Calculation of the GSD (Ground Sample Distance). This parameter establishes the relationship of every pixel in the image provided by the UAV, with its corresponding terrain area.
Set up of the degrees of longitudinal and transversal overlapping between adjacent images. In our case, we took a 60% longitudinal overlapping and a 50% transversal overlapping.
Flight parameter configuration. We established the height and flight speed, the time interval between shots and lines, and the length and spacing between them.
Other aspects that are external to the UAV system were also evaluated. These were:
Weather forecast in the area. Special care was taken in the presence of winds stronger than 10 km/h, which could have destabilized the flight of the UAV.
Presence of obstacles in the vicinity of the dovecote. For example, the presence of trees or power lines is very common in the countryside, and a GIS map of the terrain was, therefore, created in order to verify the existence of obstacles in the work area. This was also used to roughly locate the position of the fiducials.
Presence of sources of electromagnetic interference. These sources may cause a significant loss of signal in GPS devices.
4.3.2. Data Collection
In the data collection phase, the dovecote geopositioning was first conducted using the RTK Topcon GR-5 GPS with a base solution and Rover. This device has 216 Universal Following channels, G3 (GPS/GLONASS/GALILEO) technology, and is equipped with a Fence™ antenna and RTK high precision technology, with position updates of up to 100 Hz. At least 6 control points were taken for each dovecote, which allowed us to geographically locate the model with a precision of 5 mm (H) and 10 mm (V) (
Figure 5).
The flight and image reception were carried out using a Phantom 4 DJI weighing 1.380 g, at a top speed of 72 km/h, with a maximum wind resistance of 10 m/s and approximately 18 min of battery in the photography/video mode. This UAV is equipped with a camera with a 1/2.3” CMOS sensor, 12.4 MPixels, and a maximum image size of 4.000 × 3.000 pixels. The terrain resolution ranged from 1.06 to 8.04 mm/px.
4.3.3. Data Processing
The data processing was carried out using AgisoftMetashape V. 1.6.3 [
30] software, on an Intel(R) Core(TM) i7-8750H CPU @ 2.20 GHz processor, with 13GB RAM and a NVIDIA GeForce RTX 2070 graphic card. The workflow sequentially followed these steps: the orientation of the set of images in a common coordinate system, the attainment of a dense point cloud, the creation of the mesh model, and the attainment of a 3D texturized model. Three-dimensional models of normal directions and occlusion were also generated, which provided us extra visual information. Processing times varied according to the number of pictures in a range of 90 minutes (42 pictures) to 12 hours (477 pictures) (
Figure 6 and
Figure 7).
It is worth mentioning that small details do not appear sharply on the model for reasons of occlusion. This situation could be corrected in the future by combining both aerial and terrestrial photogrammetry. The textured models are available in Sketchfab [
31], which offers varied visualization options.
5. Sensory Integration and Dissemination Results
During this work, we realized the enormous difficulty involved in documenting this type of constructions in an effective manner and in a short period of time. However, the precarious state of preservation and the imminent risk of disappearance of most of these buildings led us to develop a catalogue that will allow their memory to be conserved. We trust that an integrated documentation of this type of heritage, which is unknown owing to its difficult access, will lead to its enhancement and generate interest in its conservation.
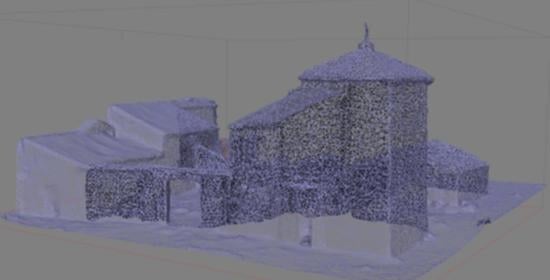
TLS, SfM, and CAD models coexist into a unique of documentation framework. The process has been as follows: TLS and SfM are first matched obtaining a unique as-is indoor-outdoor model (see
Figure 8d). The 3D CAD model of the dovecotes is then manually obtained with the help of the as-is model.
Figure 8e shows an example of how the 3D CAD model is integrated into the as-is model. This is an exportable model that can be handled by standard modeling programs.
Both, as-is and CAD models, are necessary for different applications and users. The as-is model provides the texture and geometric details of the dovecote, which are very useful for visualization purposes. On the other hand, a simplified CAD model offers the main geometrical and architectural characteristics of the building, which can be very convenient for exportation and manipulation of the model in CAD environments. Therefore, although the as-is and CAD models are not fussed into a unique model, both models are necessary and complementary as they share information in the documentation database of the building.
In order to be clear, we state that the sensory fusion also refers to that information coming from different sensors (in our case, 2D photography, 3D scanner, and UAV photogrammetry) are integrated into a common documentation framework, which include other kind of information (i.e.,: GPS building coordinates, state of the building, detailed photos, architectural characteristics, …).
All the information generated has been made available to the public. As many new references and studies as desired can be included and additional information can be joined onto the existing models using the methodology shown in
Section 4.1.
Both the database (Excel file) and the photographic information have been hosted in the institutional repository of the University of Castilla La Mancha and are available on request. The 3D models have been uploaded in SKETCHFAB (also through the use of institutional accounts) in order to allow public access [
32].
Figure 8 shows indoor and outdoor models obtained from the 3D sensory technology applied, along with photos and CAD models manually obtained from the data collected.
Finally, in order to visualize the information as a whole unit, a set of KML files were generated from the database. A KML file format, which is used to display geographic data in an Earth browser such as Google Earth [
26], made it possible to pinpoint locations and incorporate links to images and 3D models of the dovecotes (
Figure 9).
The database contained into the KML file stores information structured into six open access topics. The topics and their corresponding fields are the following:
Localization: province, village, coordinates, popular name of the place, and Universal Transverse Mercator (UTM) coordinates.
Type of construction: isolated, attached and/or tower.
Overall dimensions: length, width, height, volume, and area.
Geometric details: shape, number of rooms, and floor/roof geometry.
Construction details in walls, niches, roof structure materials, and preservation status.
Database also contains the fields related to external sensory information (pictures, models and point clouds) where links are included to access the corresponding files.
Additional non-shared information regards fields of contact details, accessibility, cadastral references, and personal information.
6. Conclusions
In this paper, we introduce a paradigm of the use of 3D computer vision technologies with the aim of performing a valuable and complete documentation of typical rural constructions. Dovecotes have existed since the Roman era, have been a profitable resource for Spanish farmers, and a huge number of them were constructed until the last decade of the 20th century. A great number of dovecotes can still be found in Spain. However, more than 70% of the buildings in the area studied are seriously damaged, and some are even crumbling away. The eventual objective of this work is to show alternative digital technologies that can complement the traditional documentation methodologies in order to make this heritage easily accessible to the general public and contribute to awareness, preservation, and the authenticity of Castilla-la Mancha traditional architecture as it has been already made in related studies [
33].
With this idea in mind, we have developed an extensive documentation work of 80 old dovecotes in an area of 1500 km2. Apart from data obtained manually, such as precise measurements, drawings, and traditional photography, we have also incorporated the data yielded by 3D terrestrial laser scanning and 3D photogrammetry obtained using unmanned aerial vehicles. Average accuracies of 1.2 and 5.5 mm at 10 m were reported for the data collected by the laser scanner and the photogrammetric devices. After processing these data separately, our system provided dense 3D-colored models of the interior and exterior of the buildings subsampled to densities of 1 points/cm3 and 0.7 points/cm3 respectively. Finally, the two models were later fused and again subsampled into a unique 3D as-is model composed of a range of between 1.4 million points and 2.1 million points, depending on the dovecote’s size. The precision of the whole as-is 3D model was set on 0.8 points/cm3, which is enough precision for our documentation objective.
It can be said that the ground truth of this kind of building is the as-is models obtained from our methodology, and that these models are precise enough to document the building architecture. Moreover, deviations of the current dovecote’s geometry and local deformations with respect to the original geometry cannot be calculated because earlier documentation is not available. However, from now on, further deterioration of the building can be measured in the future by using our models.
As mentioned before, we combine TLS data with SfM point cloud data and generate a unique point cloud model that can be turned into a mesh model or not. Therefore, we can say that data fusion is applied for TLS and SfM models. The as-is model is used as a reference for manually conducting the 3D CAD modeling. Researchers and those who are interested can therefore access the 3D as-is models, the 3D CAD models, the images, and other valuable information in different formats, thus allowing its multi-purpose use.
This first project in the field of Rural Heritage research has opened up new challenges and future lines of investigation. It has demonstrated that making use of remote sensing technologies allows Rural Heritage to be documented and made accessible by means of conventional apps in a very user-friendly way. Many other isolated traditional elements, such as water mills, sheepfolds, shelters, or wine cellars could also be documented, and relevant examples scanned, thus providing valuable information that may enhance the interest in these vulnerable buildings by means of interactive catalogues.
Technologies based on smaller scanners should be developed in order to access the most difficult places and rooms in which lighting, and work conditions are not suitable for conventional devices. The automation of procedures with which to integrate information in order to update interactive catalogues must be also investigated. It has been also demonstrated that this information may originate from different sources over time.


