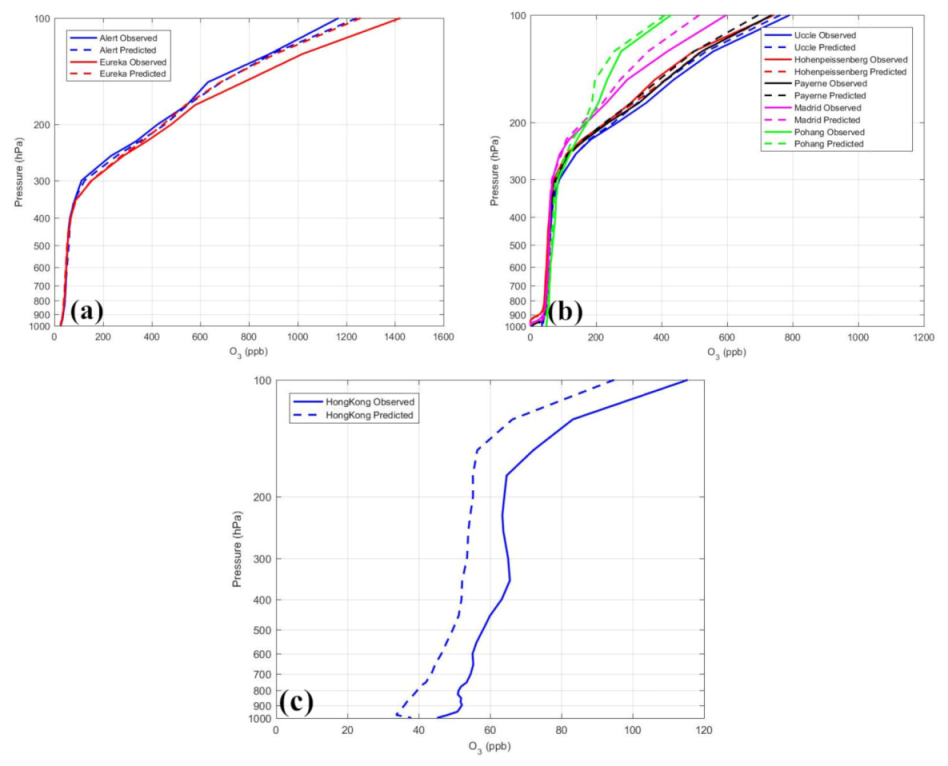
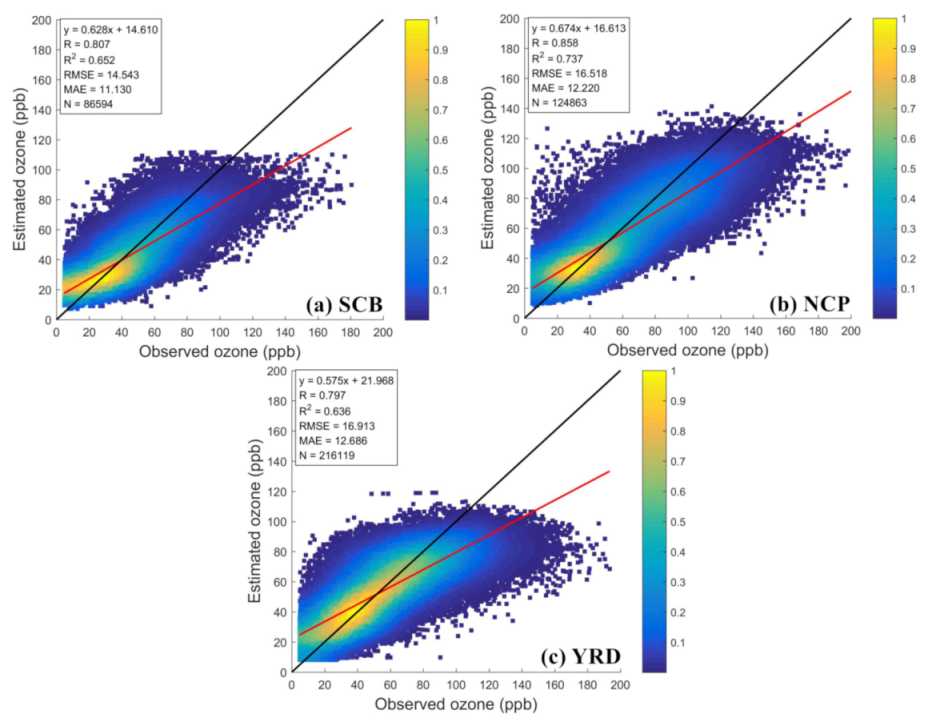
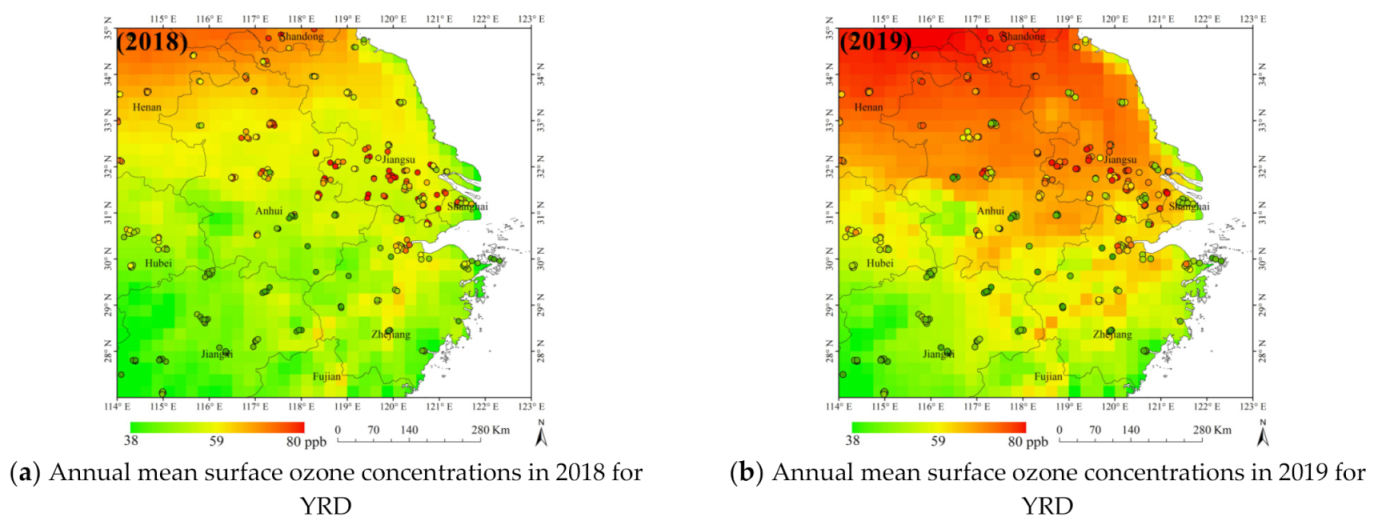
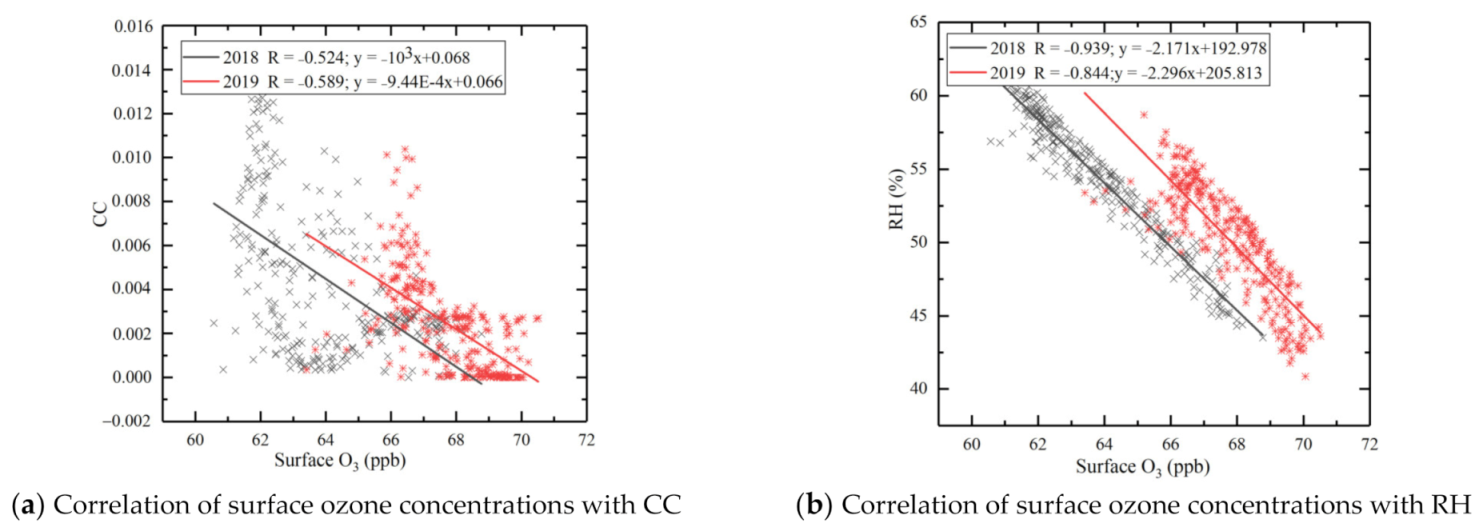
Estimation of Lower-Stratosphere-to-Troposphere Ozone Profile Using Long Short-Term Memory (LSTM)
Abstract
:1. Introduction
2. Data
2.1. LST Ozone Datasets
2.1.1. WOUDC Datasets
2.1.2. CARIBIC Flights Data
2.1.3. Near-Surface Ozone Data
2.2. Satellite Data
2.3. Meteorological Data
2.4. Dataset Used and Processing
3. Methods
3.1. Variable Analysis
- (1)
- Add a random noise to the variable X (temperature, humidity, and so on), and the prediction accuracy of the model was recalculated. If the prediction accuracy of the model is greatly reduced after adding the noise, then it is of high importance.
- (2)
- Repeat for all variables to calculate the variable importance.
3.2. LSTM Model
4. Results
4.1. Model Training
4.2. Model Evaluation
4.2.1. Applied to CARIBIC
4.2.2. Applied to CNEMC
5. Discussion
6. Conclusions
Author Contributions
Funding
Acknowledgments
Conflicts of Interest
Appendix A
| Site | Country | Latitude (°) | Longitude (°) | Height (m) | Days | Dates |
|---|---|---|---|---|---|---|
| Alert | Canada | 82.49 | −62.34 | 75 | 166 | August 2015 to April 2020 |
| Eureka | Canada | 79.98 | −85.04 | 10 | 312 | January 2015 to September 2020 |
| Resolute | Canada | 74.7 | −94.96 | 46 | 114 | April 2015 to November 2018 |
| United Kingdom | Great Britain | 60.14 | −1.19 | 84 | 143 | January 2015 to December 2016 |
| Legionowo | Poland | 52.41 | 20.96 | 96 | 203 | January 2015 to October 2019 |
| Bilt | Netherlands | 52.100 | 5.177 | 4 | 182 | January 2015 to December 2018 |
| Uccle | Belgium | 50.8 | 4.35 | 100 | 768 | January 2015 to December 2020 |
| Hohenpeissenberg | Germany | 47.8 | 11 | 976 | 733 | January 2015 to December 2020 |
| Payerne | Switzerland | 46.49 | 6.57 | 491 | 781 | January 2015 to October 2020 |
| Vigna di Valle | Italy | 42.08 | 12.21 | 260 | 50 | January 2015 to November 2015 |
| Madrid | Spain | 40.47 | −3.58 | 631 | 315 | January 2014 to December 2020 |
| Boulder | USA | 39.9491 | −105.1 | 1743 | 144 | January 2015 to June 2017 |
| Tsukuba | Japan | 36.06 | 140.13 | 31 | 172 | April 2015 to February 2019 |
| Pohang | Korea | 36.03 | 129.38 | 6 | 97 | January 2018 to December 2019 |
| Taiwan | China | 24.9979 | 121.443 | 11 | 48 | January 2015 to March 2019 |
| Hong Kong | China | 22.31 | 114.17 | 66 | 294 | January 2014 to September 2020 |
| Hilo | USA | 19.43 | −155.04 | 11 | 187 | January 2015 to December 2017 |
| San Pedro | Costa Rica | 9.9396 | −84.0423 | 1240 | 156 | January 2015 to December 2017 |
| Sepang Airport | Malaysia | 2.73 | 101.7 | 17 | 68 | January 2014 to December 2017 |
| Singapore | Singapore | 1.34 | 103.89 | 36 | 18 | January 2014 to September 2015 |
| Frozen Layers | Region | R2 | RMSE (ppb) | MAE (ppb) |
|---|---|---|---|---|
| 0 | NH | 0.721 | 80.549 | 96.425 |
| NM | 0.727 | 112.301 | 76.264 | |
| NL | 0.354 | 18.012 | 17.956 | |
| 1 | NH | 0.741 | 79.256 | 94.821 |
| NM | 0.731 | 111.931 | 74.189 | |
| NL | 0.359 | 17.972 | 17.061 | |
| 1,2 | NH | 0.774 | 77.410 | 92.978 |
| NM | 0.773 | 109.334 | 72.932 | |
| NL | 0.352 | 17.523 | 17.496 | |
| 1,2,3 | NH | 0.769 | 78.736 | 93.648 |
| NM | 0.758 | 110.192 | 73.245 | |
| NL | 0.356 | 17.945 | 17.154 |
References
- Lelieveld, J.; Dentener, F.J. What controls tropospheric ozone? J. Geophys. Res. Atmos. 2000, 105, 3531–3551. [Google Scholar] [CrossRef]
- Rieder, H.E.; Polvani, L.M. Are recent Arctic ozone losses caused by increasing greenhouse gases? Geophys. Res. Lett. 2013, 40, 4437–4441. [Google Scholar] [CrossRef] [Green Version]
- Baasandorj, M.; Fleming, E.L.; Jackman, C.H.; Burkholder, J.B. O(D-1) Kinetic Study of Key Ozone Depleting Substances and Greenhouse Gases. J. Phys. Chem. A 2013, 117, 2434–2445. [Google Scholar] [CrossRef] [PubMed]
- Ma, P.; Chen, L.; Wang, Z.; Zhao, S.; Li, Q.; Tao, M.; Wang, Z. Ozone Profile Retrievals from the Cross-Track Infrared Sounder. IEEE Trans. Geosci. Remote Sens. 2016, 54, 3985–3994. [Google Scholar] [CrossRef]
- Young, P.J.; Naik, V.; Fiore, A.M.; Gaudel, A.; Guo, J.; Lin, M.Y.; Neu, J.L.; Parrish, D.D.; Rieder, H.E.; Schnell, J.L.; et al. Tropospheric Ozone Assessment Report: Assessment of global-scale model performance for global and regional ozone distributions, variability, and trends. Elem. Sci. Anth. 2018, 6. [Google Scholar] [CrossRef]
- Mills, G.; Buse, A.; Gimeno, B.; Bermejo, V.; Holland, M.; Emberson, L.; Pleijel, H. A synthesis of AOT40-based response functions and critical levels of ozone for agricultural and horticultural crops. Atmos. Environ. 2007, 41, 2630–2643. [Google Scholar] [CrossRef]
- Taylan, O. Modelling and analysis of ozone concentration by artificial intelligent techniques for estimating air quality. Atmos. Environ. 2017, 150, 356–365. [Google Scholar] [CrossRef]
- Ayres, J.G.; Ayres, J.; Maynard, R.L.; Richards, R. Air Pollution and Health; Imperial College Press: London, UK, 2006. [Google Scholar]
- Lupaşcu, A.; Butler, T. Source attribution of European surface O-3 using a tagged O-3 mechanism. Atmos. Chem. Phys. 2019, 19, 14535–14558. [Google Scholar] [CrossRef] [Green Version]
- Li, J.Y.; Mao, J.Q.; Fiore, A.M.; Cohen, R.C.; Crounse, J.D.; Teng, A.P.; Wennberg, P.O.; Lee, B.H.; Lopez-Hilfiker, F.D.; Thornton, J.A.; et al. Decadal changes in summertime reactive oxidized nitrogen and surface ozone over the Southeast United States. Atmos. Chem. Phys. 2018, 18, 2341–2361. [Google Scholar] [CrossRef] [Green Version]
- Li, R.; Cui, L.L.; Li, J.L.; Zhao, A.; Fu, H.B.; Wu, Y.; Zhang, L.W.; Kong, L.D.; Chen, J.M. Spatial and temporal variation of particulate matter and gaseous pollutants in China during 2014–2016. Atmos. Environ. 2017, 161, 235–246. [Google Scholar] [CrossRef]
- Li, X.; Zhang, Q.; Zhang, Y.; Zhang, L.; Wang, Y.X.; Zhang, Q.Q.; Li, M.; Zheng, Y.X.; Geng, G.N.; Wallington, T.J.; et al. Attribution of PM2.5 exposure in Beijing–Tianjin–Hebei region to emissions: Implication to control strategies. Sci. Bull. 2017, 62, 957–964. [Google Scholar] [CrossRef] [Green Version]
- Tan, Z.F.; Lu, K.D.; Dong, H.B.; Hu, M.; Li, X.; Liu, Y.H.; Lu, S.H.; Shao, M.; Su, R.; Wang, H.C.; et al. Explicit diagnosis of the local ozone production rate and the ozone-NOx-VOC sensitivities. Sci. Bull. 2018, 63, 1067–1076. [Google Scholar] [CrossRef] [Green Version]
- Liu, X.; Chance, K.; Sioris, C.E.; Spurr, R.J.D.; Kurosu, T.P.; Martin, R.V.; Newchurch, M.J. Ozone profile and tropospheric ozone retrievals from the Global Ozone Monitoring Experiment: Algorithm description and validation. J. Geophys. Res. Atmos. 2005, 110, 110. [Google Scholar] [CrossRef] [Green Version]
- Fu, D.; Kulawik, S.S.; Miyazaki, K.; Bowman, K.W.; Worden, J.R.; Eldering, A.; Livesey, N.J.; Teixeira, J.; Irion, F.W.; Herman, R.L.; et al. Retrievals of tropospheric ozone profiles from the synergism of AIRS and OMI: Methodology and validation. Atmos. Meas. Tech. 2018, 11, 5587–5605. [Google Scholar] [CrossRef] [Green Version]
- Vanicek, K. Differences between ground Dobson, Brewer and satellite TOMS-8, GOME-WFDOAS total ozone observations at Hradec Kralove, Czech. Atmos. Chem. Phys. 2006, 6, 5163–5171. [Google Scholar] [CrossRef] [Green Version]
- Li, R.; Zhao, Y.L.; Zhou, W.H.; Meng, Y.; Zhang, Z.Y.; Fu, H.B. Developing a novel hybrid model for the estimation of surface 8 h ozone (O-3) across the remote Tibetan Plateau during 2005–2018. Atmos. Chem. Phys. 2020, 20, 6159–6175. [Google Scholar] [CrossRef]
- Susskind, J.; Barnet, C.; Blaisdell, J.; Iredell, L.; Keita, F.; Kouvaris, L.; Molnar, G.; Chahine, M. Accuracy of geophysical parameters derived from Atmospheric Infrared Sounder/Advanced Microwave Sounding Unit as a function of fractional cloud cover. J. Geophys. Res. Atmos. 2006, 111. [Google Scholar] [CrossRef] [Green Version]
- Nassar, R.; Logan, J.A.; Worden, H.M.; Megretskaia, I.A.; Bowman, K.W.; Osterman, G.B.; Thompson, A.M.; Tarasick, D.W.; Austin, S.; Claude, H.; et al. Validation of Tropospheric Emission Spectrometer (TES) nadir ozone profiles using ozonesonde measurements. J. Geophys. Res. Atmos. 2008, 113. [Google Scholar] [CrossRef] [Green Version]
- Clerbaux, C.; Hadji-Lazaro, J.; Turquety, S.; George, M.; Boynard, A.; Pommier, M.; Safieddine, S.; Coheur, P.F.; Hurtmans, D.; Clarisse, L.; et al. Tracking pollutants from space: Eight years of IASI satellite observation. Comptes Rendus Geosci. 2015, 347, 134–144. [Google Scholar] [CrossRef]
- Liu, X.; Bhartia, P.K.; Chance, K.; Spurr, R.J.D.; Kurosu, T.P. Ozone profile retrievals from the Ozone Monitoring Instrument. Atmos. Chem. Phys. 2010, 10, 2521–2537. [Google Scholar] [CrossRef] [Green Version]
- Garane, K.; Koukouli, M.-E.; Verhoelst, T.; Lerot, C.; Heue, K.P.; Fioletov, V.; Balis, D.; Bais, A.; Bazureau, A.; Dehn, A.; et al. TROPOMI/S5P total ozone column data: Global ground-based validation and consistency with other satellite missions. Atmos. Meas. Tech. 2019, 12, 5263–5287. [Google Scholar] [CrossRef] [Green Version]
- Bai, K.X.; Liu, C.S.; Shi, R.H.; Gao, W. Comparison of Suomi-NPP OMPS total column ozone with Brewer and Dobson spectrophotometers measurements. Front. Earth Sci. 2015, 9, 369–380. [Google Scholar] [CrossRef]
- Ghoneim, O.A.; Manjunatha, B.R. Forecasting of Ozone Concentration in Smart City using Deep Learning. In Proceedings of the 2017 International Conference on Advances in Computing, Communications and Informatics (Icacci), Udupi, India, 13–16 September 2017; pp. 1320–1326. [Google Scholar]
- Feng, R.; Zheng, H.J.; Zhang, A.R.; Huang, C.; Gao, H.; Ma, Y.C. Unveiling tropospheric ozone by the traditional atmospheric model and machine learning, and their comparison:A case study in hangzhou, China. Environ. Pollut. 2019, 252, 366–378. [Google Scholar] [CrossRef] [PubMed]
- Zhan, Y.; Luo, Y.Z.; Deng, X.F.; Grieneisen, M.L.; Zhang, M.H.; Di, B.F. Spatiotemporal prediction of daily ambient ozone levels across China using random forest for human exposure assessment. Environ. Pollut. 2018, 233, 464–473. [Google Scholar] [CrossRef]
- Danielsen, E.F. Stratospheric-Tropospheric Exchange Based on Radioactivity Ozone and Potential Vorticity. J. Atmos. Sci. 1968, 25, 502. [Google Scholar] [CrossRef]
- Ancellet, G.; Daskalakis, N.; Raut, J.C.; Tarasick, D.; Hair, J.; Quennehen, B.; Ravetta, F.; Schlager, H.; Weinheimer, A.J.; Thompson, A.M.; et al. Analysis of the latitudinal variability of tropospheric ozone in the Arctic using the large number of aircraft and ozonesonde observations in early summer 2008. Atmos. Chem. Phys. 2016, 16, 13341–13358. [Google Scholar] [CrossRef] [Green Version]
- Pittman, J.V.; Pan, L.L.; Wei, J.C.; Irion, F.W.; Liu, X.; Maddy, E.S.; Barnet, C.D.; Chance, K.; Gao, R.-S. Evaluation of AIRS, IASI, and OMI ozone profile retrievals in the extratropical tropopause region using in situ aircraft measurements. J. Geophys. Res. 2009, 114. [Google Scholar] [CrossRef] [Green Version]
- Watson, G.L.; Telesca, D.; Reid, C.E.; Pfister, G.G.; Jerrett, M. Machine learning models accurately predict ozone exposure during wildfire events. Environ. Pollut. 2019, 254, 112792. [Google Scholar] [CrossRef]
- Sayeed, A.; Choi, Y.; Eslami, E.; Lops, Y.; Roy, A.; Jung, J. Using a deep convolutional neural network to predict 2017 ozone concentrations, 24 hours in advance. Neural Networks 2020, 121, 396–408. [Google Scholar] [CrossRef]
- Müller, M.D.; Kaifel, A.K.; Weber, M.; Tellmann, S.; Burrows, J.P.; Loyola, D. Ozone profile retrieval from Global Ozone Monitoring Experiment (GOME) data using a neural network approach (Neural Network Ozone Retrieval System (NNORSY)). J. Geophys. Res. Atmos. 2003, 108. [Google Scholar] [CrossRef]
- Liu, R.Y.; Ma, Z.W.; Liu, Y.; Shao, Y.C.; Zhao, W.; Bi, J. Spatiotemporal distributions of surface ozone levels in China from 2005 to 2017: A machine learning approach. Environ. Int. 2020, 142, 105823. [Google Scholar] [CrossRef]
- Jumin, E.; Zaini, N.; Ahmed, A.N.; Abdullah, S.; Ismail, M.; Sherif, M.; Sefelnasr, A.; El-Shafie, A. Machine learning versus linear regression modelling approach for accurate ozone concentrations prediction. Eng. Appl. Comput. Fluid 2020, 14, 713–725. [Google Scholar] [CrossRef]
- Stubi, R.; Levrat, G.; Hoegger, B.; Viatte, P.; Staehelin, J.; Schmidlin, F.J. In-flight comparison of Brewer-Mast and electrochemical concentration cell ozonesondes. J. Geophys. Res. Atmos. 2008, 113. [Google Scholar] [CrossRef] [Green Version]
- Logan, J.A.; Staehelin, J.; Megretskaia, I.A.; Cammas, J.P.; Thouret, V.; Claude, H.; De Backer, H.; Steinbacher, M.; Scheel, H.E.; Stübi, R.; et al. Changes in ozone over Europe: Analysis of ozone measurements from sondes, regular aircraft (MOZAIC) and alpine surface sites. J. Geophys. Res. Atmos. 2012, 117. [Google Scholar] [CrossRef] [Green Version]
- Assonov, S.S.; Brenninkmeijer, C.A.M.; Schuck, T.J.; Taylor, P. Analysis of C-13 and O-18 isotope data of CO2 in CARIBIC aircraft samples as tracers of upper troposphere/lower stratosphere mixing and the global carbon cycle. Atmos. Chem. Phys. 2010, 10, 8575–8599. [Google Scholar] [CrossRef] [Green Version]
- Schuck, T.J.; Brenninkmeijer, C.A.M.; Baker, A.K.; Šlemr, F.; Von Velthoven, P.F.J.; Zahn, A. Greenhouse gas relationships in the Indian summer monsoon plume measured by the CARIBIC passenger aircraft. Atmos. Chem. Phys. 2010, 10, 3965–3984. [Google Scholar] [CrossRef] [Green Version]
- Wang, T.; Xue, L.; Brimblecombe, P.; Lam, Y.F.; Li, L.; Zhang, L. Ozone pollution in China: A review of concentrations, meteorological influences, chemical precursors, and effects. Sci. Total Environ. 2017, 575, 1582–1596. [Google Scholar] [CrossRef]
- Reale, O.; McGrath-Spangler, E.L.; Mccarty, W.; Holdaway, D.; Gelaro, R. Impact of Adaptively Thinned AIRS Cloud-Cleared Radiances on Tropical Cyclone Representation in a Global Data Assimilation and Forecast System. Weather Forecast. 2018, 33, 909–931. [Google Scholar] [CrossRef]
- Hoffmann, L.; Günther, G.; Li, D.; Stein, O.; Wu, X.; Griessbach, S.; Heng, Y.; Konopka, P.; Müller, R.; Vogel, B.; et al. From ERA-Interim to ERA5: The considerable impact of ECMWF’s next-generation reanalysis on Lagrangian transport simulations. Atmos. Chem. Phys. 2019, 19, 3097–3124. [Google Scholar] [CrossRef] [Green Version]
- Xue, C.D.; Wu, H.; Jiang, X.G. Temporal and Spatial Change Monitoring of Drought Grade Based on ERA5 Analysis Data and BFAST Method in the Belt and Road Area during 1989–2017. Adv. Meteorol. 2019, 2019, 1–10. [Google Scholar] [CrossRef]
- Malik, A.; Tauler, R. Exploring the interaction between O-3 and NOx pollution patterns in the atmosphere of Barcelona, Spain using the MCR–ALS method. Sci. Total Environ. 2015, 517, 151–161. [Google Scholar] [CrossRef] [PubMed]
- Santurtún, A.; González-Hidalgo, J.C.; Sanchez-Lorenzo, A.; Zarrabeitia, M.T. Surface ozone concentration trends and its relationship with weather types in Spain (2001–2010). Atmos. Environ. 2015, 101, 10–22. [Google Scholar] [CrossRef]
- Kerr, G.H.; Waugh, D.W.; Strode, S.A.; Steenrod, S.D.; Oman, L.D.; Strahan, S.E. Disentangling the Drivers of the Summertime Ozone-Temperature Relationship Over the United States. J. Geophys. Res. Atmos. 2019, 124, 10503–10524. [Google Scholar] [CrossRef]
- He, X.; Pang, S.F.; Ma, J.B.; Zhang, Y.H. Influence of relative humidity on heterogeneous reactions of O-3 and O-3/SO2 with soot particles: Potential for environmental and health effects. Atmos. Environ. 2017, 165, 198–206. [Google Scholar] [CrossRef]
- He, X.; Zhang, Y.-H. Influence of relative humidity on SO2 oxidation by O3 and NO2 on the surface of TiO2 particles: Potential for formation of secondary sulfate aerosol. Spectrochim. Acta A 2019, 219, 121–128. [Google Scholar] [CrossRef]
- Dufour, G.; Eremenko, M.; Cuesta, J.; Doche, C.; Foret, G.; Beekmann, M.; Cheiney, A.; Wang, Y.; Cai, Z.; Liu, Y.; et al. Springtime daily variations in lower-tropospheric ozone over east Asia: The role of cyclonic activity and pollution as observed from space with IASI. Atmos. Chem. Phys. 2015, 15, 10839–10856. [Google Scholar] [CrossRef] [Green Version]
- Strobl, C.; Boulesteix, A.L.; Kneib, T.; Augustin, T.; Zeileis, A. Conditional variable importance for random forests. BMC Bioinform. 2008, 9, 307. [Google Scholar] [CrossRef] [Green Version]
- Archer, K.J.; Kirnes, R.V. Empirical characterization of random forest variable importance measures. Comput. Stat. Data Anal. 2008, 52, 2249–2260. [Google Scholar] [CrossRef]
- Krzyzanowski, M.; Cohen, A. Update of WHO air quality guidelines. Air Qual. Atmos. Health 2008, 1, 7–13. [Google Scholar] [CrossRef] [Green Version]
- Williams, R.S.; Hegglin, M.I.; Kerridge, B.J.; Jöckel, P.; Latter, B.G.; Plummer, D.A. Characterising the seasonal and geographical variability in tropospheric ozone, stratospheric influence and recent changes. Atmos. Chem. Phys. 2019, 19, 3589–3620. [Google Scholar] [CrossRef] [Green Version]
- Hochreiter, S.; Schmidhuber, J. Long Short-Term Memory. Neural Comput. 1997, 9, 1735–1780. [Google Scholar] [CrossRef]
- Pedregosa, F.; Varoquaux, G.; Gramfort, A.; Michel, V.; Thirion, B.; Grisel, O.; Blondel, M.; Prettenhofer, P.; Weiss, R.; Dubourg, V.; et al. Scikit-learn: Machine Learning in Python. J. Mach. Learn. Res. 2011, 12, 2825–2830. [Google Scholar]
- Hara, K.; Saito, D.; Shouno, H. Analysis of Function of Rectified Linear Unit Used in Deep learning. In Proceedings of the 2015 International Joint Conference on Neural Networks (IJCNN), Killarney, Ireland, 12–17 July 2015. [Google Scholar]
- Chollet, F.O. Deep Learning with Python; Manning Publications, Co.: Shelter Island, NY, USA, 2018; p. 361. [Google Scholar]
- Wang, Y.X.; Liu, J.Q.; Misic, J.; Misic, V.B.; Lv, S.H.; Chang, X.L. Assessing Optimizer Impact on DNN Model Sensitivity to Adversarial Examples. IEEE Access 2019, 7, 152766–152776. [Google Scholar] [CrossRef]
- Liao, Z.H.; Ling, Z.H.; Gao, M.; Sun, J.R.; Zhao, W.; Ma, P.K.; Quan, J.N.; Fan, S.J. Tropospheric Ozone Variability Over Hong Kong Based on Recent 20 years (2000–2019) Ozonesonde Observation. J. Geophys. Res. Atmos. 2021, 126, e2020JD033054. [Google Scholar] [CrossRef]
- Xiao, X.L.; Mudiyanselage, T.B.; Ji, C.Y.; Hu, J.; Pan, Y. Fast Deep Learning Training Through Intelligently Freezing Layers. In Proceedings of the 2019 International Conference on Internet of Things (Ithings) and IEEE Green Computing and Communications (Greencom) and Ieee Cyber, Physical and Social Computing (Cpscom) and Ieee Smart Data (Smartdata), Atlanta, GA, USA, 14–17 July 2019; pp. 1225–1232. [Google Scholar] [CrossRef]
- Yang, X.Y.; Wu, K.; Wang, H.L.; Liu, Y.M.; Gu, S.; Lu, Y.Q.; Zhang, X.L.; Hu, Y.S.; Ou, Y.H.; Wang, S.G.; et al. Summertime ozone pollution in Sichuan Basin, China: Meteorological conditions, sources and process analysis. Atmos. Environ. 2020, 226, 117392. [Google Scholar] [CrossRef]


| Dataset | Variable | Unit | Temporal Resolution | Spatial Resolution | Data Source |
|---|---|---|---|---|---|
| LST ozone datasets | LST ozone profile | ppb | Daily | In situ | WOUDC |
| LST ozone profile | ppb | Daily | In situ | CARIBIC | |
| Near-surface ozone | μg/m3 | Hourly | Ground based | CNEMC | |
| Satellite Data | Radiances of seven channels near the ozone absorption bands | milliwatts/ m2/cm−1 | Daily | 50 km × 50 km | AIRS/Aqua |
| Apparent reflectance of 15 channels | _ | Daily | 13 km × 24 km | OMI/Aura | |
| Meteorological | Divergence (d) | s−1 | Hourly | 0.25° | ERA5 |
| Fraction of cloud cover (CC) | _ | ||||
| Potential vorticity (PV) | K m2 kg−1 s−1 | ||||
| Relative vorticity (VO) | Pa s−1 | ||||
| Temperature (T) | K | ||||
| Specific humidity (q) | kg/kg | ||||
| Vertical velocity (w) | Pa s−1 | ||||
| Eastward component of wind (U) | m s−1 | ||||
| Northward component of wind (V) | m s−1 | ||||
| Relative humidity (r) | % | ||||
| Pressure(P) | hPa |
| NH | NM | NL | |||||||
|---|---|---|---|---|---|---|---|---|---|
| Training | Validation | Testing | Training | Validation | Testing | Training | Validation | Testing | |
| Number of samples | 15,000 | 1878 | 1909 | 62,130 | 7766 | 7780 | 15,458 | 1932 | 1933 |
| Number of profiles | 571 | 72 | 75 | 2378 | 298 | 312 | 570 | 75 | 79 |
| R2 | 0.978 | 0.936 | 0.928 | 0.905 | 0.883 | 0.885 | 0.695 | 0.612 | 0.590 |
| RMSE (ppb) | 86.921 | 94.377 | 94.222 | 68.042 | 68.806 | 71.110 | 20.640 | 19.825 | 20.153 |
| MAE (ppb) | 34.874 | 37.062 | 36.348 | 31.013 | 26.863 | 29.079 | 13.085 | 11.643 | 13.322 |
| R2 | RMSE | MAE | |||||||
|---|---|---|---|---|---|---|---|---|---|
| SCB | NCP | YRD | SCB | NCP | YRD | SCB | NCP | YRD | |
| 2018 | 0.648 | 0.736 | 0.621 | 14.930 | 17.157 | 17.764 | 11.496 | 12.720 | 13.276 |
| 2019 | 0.670 | 0.747 | 0.650 | 14.194 | 15.881 | 16.207 | 10.783 | 11.734 | 12.134 |
Publisher’s Note: MDPI stays neutral with regard to jurisdictional claims in published maps and institutional affiliations. |
© 2021 by the authors. Licensee MDPI, Basel, Switzerland. This article is an open access article distributed under the terms and conditions of the Creative Commons Attribution (CC BY) license (https://creativecommons.org/licenses/by/4.0/).
Share and Cite
Zhang, X.; Zhang, Y.; Lu, X.; Bai, L.; Chen, L.; Tao, J.; Wang, Z.; Zhu, L. Estimation of Lower-Stratosphere-to-Troposphere Ozone Profile Using Long Short-Term Memory (LSTM). Remote Sens. 2021, 13, 1374. https://doi.org/10.3390/rs13071374
Zhang X, Zhang Y, Lu X, Bai L, Chen L, Tao J, Wang Z, Zhu L. Estimation of Lower-Stratosphere-to-Troposphere Ozone Profile Using Long Short-Term Memory (LSTM). Remote Sensing. 2021; 13(7):1374. https://doi.org/10.3390/rs13071374
Chicago/Turabian StyleZhang, Xinxin, Ying Zhang, Xiaoyan Lu, Lu Bai, Liangfu Chen, Jinhua Tao, Zhibao Wang, and Lili Zhu. 2021. "Estimation of Lower-Stratosphere-to-Troposphere Ozone Profile Using Long Short-Term Memory (LSTM)" Remote Sensing 13, no. 7: 1374. https://doi.org/10.3390/rs13071374
APA StyleZhang, X., Zhang, Y., Lu, X., Bai, L., Chen, L., Tao, J., Wang, Z., & Zhu, L. (2021). Estimation of Lower-Stratosphere-to-Troposphere Ozone Profile Using Long Short-Term Memory (LSTM). Remote Sensing, 13(7), 1374. https://doi.org/10.3390/rs13071374


