Abstract
Moisture content in tidal flats changes frequently and spatially on account of tidal fluctuations, which greatly influence the reflectance of the tidal flat surface. Precise prediction of the spatial-temporal variation of tidal flats’ moisture content is an important foundation of surface bio-geophysical information research by remote sensing. In this paper, we first measured the multi-angle reflectance of soil samples obtained from tidal flats in the northeastern Dongtai, Jiangsu Province, China, in the laboratory. Then, based on the particle swarm optimization (PSO) algorithm, we retrieved the photometric characteristics of the soil surface by employing the SOILSPECT bidirectional reflectance model. Finally, the soil moisture content was retrieved by introducing the equivalent water thickness of the soil. The results showed that: (i) A significant correlation existed between the retrieved equivalent water thickness and the measured soil moisture content. The SOILSPECT model is capable of estimating soil moisture with high precision by using multi-angle reflectance. (ii) Retrieved values of single scattering albedo (ω) were consistent with the variation of soil moisture content. The roughness parameter (h) and the asymmetry factor (Θ) were consistent with the structure and particle composition of the soil surface in dry soil samples. (iii) When the soil samples were soaked with water, the roughness parameter (h) and the type of scattering on the soil surface both showed irregular changes. These results support the importance of using the measured soil particle size as one of the parameters for the retrieval of soil moisture content, which is a method that should be used cautiously, especially in tidal flats.
1. Introduction
Tidal flats are intertidal shoals on the muddy coast that are considered the intersection of land and ocean, which are affected by water level changes and other various dynamic environmental factors [1]. Tidal flats not only support the livelihoods of millions of humans worldwide and provide habitats for wild-life and resources for land reclamation but they also protect the coast from extreme meteorological or oceanic events [2]. Moreover, tidal flats play an important role in the global carbon cycle and in climate change as an organic carbon sink [3,4]. Intensifying human activities [5] and global climate change have greatly impacted tidal flats [1,6,7]. Thorough research of tidal flats would be beneficial to understand the hydrological, ecological, geomorphological, and environmental impacts of intertidal zones. This is especially important, considering that the soil moisture content (SMC) of tidal flat surfaces not only affects the lives and migration of wild-life but also influences the formation, migration, and the mechanism of material exchange [8,9,10]. In addition, considering the combined effect of tides and evaporation, the soil surface moisture of tidal flats is also closely related to their topography [11,12]. Thus, studies of the distribution and variation of soil surface moisture are important aspects of tidal flats research.
The traditional gravimetric method requires drying and weighing, and in situ measurement needs a water content measurement probe [13,14]. Although these methods are time-consuming and laborious, they were widely used and as calibrated data as they provide good results [15,16]. However, the periodic tides and muddy environment of tidal flats make it more difficult and hazardous to investigate the in situ soil moisture data [17]. Therefore, these conventional methods are difficult to scale spatially and temporally to conduct continuous, stereoscopic, and comprehensive monitoring of tidal flats [18,19]. To adapt to the high dynamism of tidal flats, a noninvasive approach is required to assess changes in the surface characteristics and the SMC of tidal flats. The recent combination of remote sensing techniques and in situ surveying has given us a novel opportunity to investigate the moisture content of tidal flats faster and more conveniently [14,20,21].
Remote sensing techniques using thermal infrared [22,23,24] and microwave [12,25,26,27] have made significant progress in soil moisture monitoring. Although these methods are advantageous for improving the precision of SMC estimation, low spatial-temporal resolution constrains the use of microwave sensors for small regions. In addition, many studies have demonstrated that the solar domain (400 nm–2500 nm) could also be used for the study of soil moisture [28,29,30,31]. For example, Khanna et al. [32] proposed an index that estimates the soil and vegetation moisture with near infrared (NIR, 858 nm) and shortwave infrared (SWIR, 1240 nm and 1640 nm) bands of a Moderate-resolution Imaging Spectroradiometer (MODIS). Using the Red-NIR spectral feature space, Gao et al. [33] retrieved soil moisture by developing an empirical relationship between vegetation canopy and mixed pixels reflectance that was based on the linear decomposition algorithm. Peng et al. [34] evaluated the effectiveness of discrete wavelet transform (DWT) for soil moisture retrieval. Bablet et al. [35] and Sadeghi et al. [36] developed a linear physically-based model and a multilayer radiative transfer model to estimate the surface SMC in the solar domain, respectively. These studies made great progress in describing the relationship between soil moisture and soil reflectance. However, the practice of combining spectral and directional reflectance properties of bare soil is rarely implemented. Surface anisotropy can be a diagnostic characteristic of surface properties and provide additional information for extracting SMC, which should not be dissociated in remote sensing applications [37].
Soil is a complex combination of mineral, water, air, and organic matter [38]. Soil reflectance is a cumulative property that derives from the inherent spectral behavior of the heterogeneous combination of its composition [39]. The bidirectional spectral reflectance model based on the radiative transfer theory developed by Hapke [40,41,42] can best describe how to characterize the orientation and heterogeneous scattering of soil particles. The Hapke model can be readily inverted against multi-angular spectral reflectance measurements and relate the radiance field emerging from a surface to physically meaningful parameters, such as the single scattering albedo (SSA), the roughness, and the scattering properties of the soil surface. The Hapke model was supplemented and improved by Hapke [43,44], and many scientists have extended it and applied new models to investigate the physical properties of soil. For example, Jacquemoud et al. [37] developed the SOILSPECT model based on the Hapke model and were able to describe the directional reflectance of the soil surface from 450 nm to 2450 nm with higher accuracy. Yang et al. [45] introduced the SMC into the soil bidirectional reflectance distribution function (BRDF) model, quantitatively converted the single scattering albedo in the SOILSPECT model and the soil reflectance of the dual-hemisphere and established an extended soil BRDF model. The Hapke model has been widely applied. For instance, Chappell et al. [46] used the Hapke model to investigate the directional modeling of the reflectance of three soils with heavy rain and wind erosion and inverted it against the bidirectional soil spectral reflectance model. Furthermore, the Hapke model is also suitable for multi-scale assessments across large-scale areas of angular sensors on airborne and satellite platforms [47]. However, satellite data of multi-angle sensors with low and medium spatial resolution cannot be used for small regions. Because of the large-scale difference between the in situ measurement data and the images of spaceborne sensors, much field research of tidal flats is still needed to retrieve preliminary surface properties. There are few published photometric properties of tidal flats retrieved from multi-angular data using bidirectional spectral reflectance models. Bidirectional reflectance spectra and the SOILSPECT model provide a novel approach to retrieve surface photometric characteristics and the SMC of tidal flats.
Therefore, the objective of this research is to retrieve the photometric characteristics and the SMC of tidal flats combined with the SOILSPECT model and multi-angle reflectance spectra under controlled conditions. The main objectives of this study include: (i) obtaining soil samples in tidal flats and measuring the multi-angle reflectance spectra and the corresponding SMC in the laboratory; (ii) employing the SOILSPECT model to retrieve the photometric characteristics of tidal flats; and (iii) applying the parameter of the SMC to the SOILSPECT model for analyzing and verifying the estimated SMC.
2. Study Area and Data Sources
2.1. Study Area
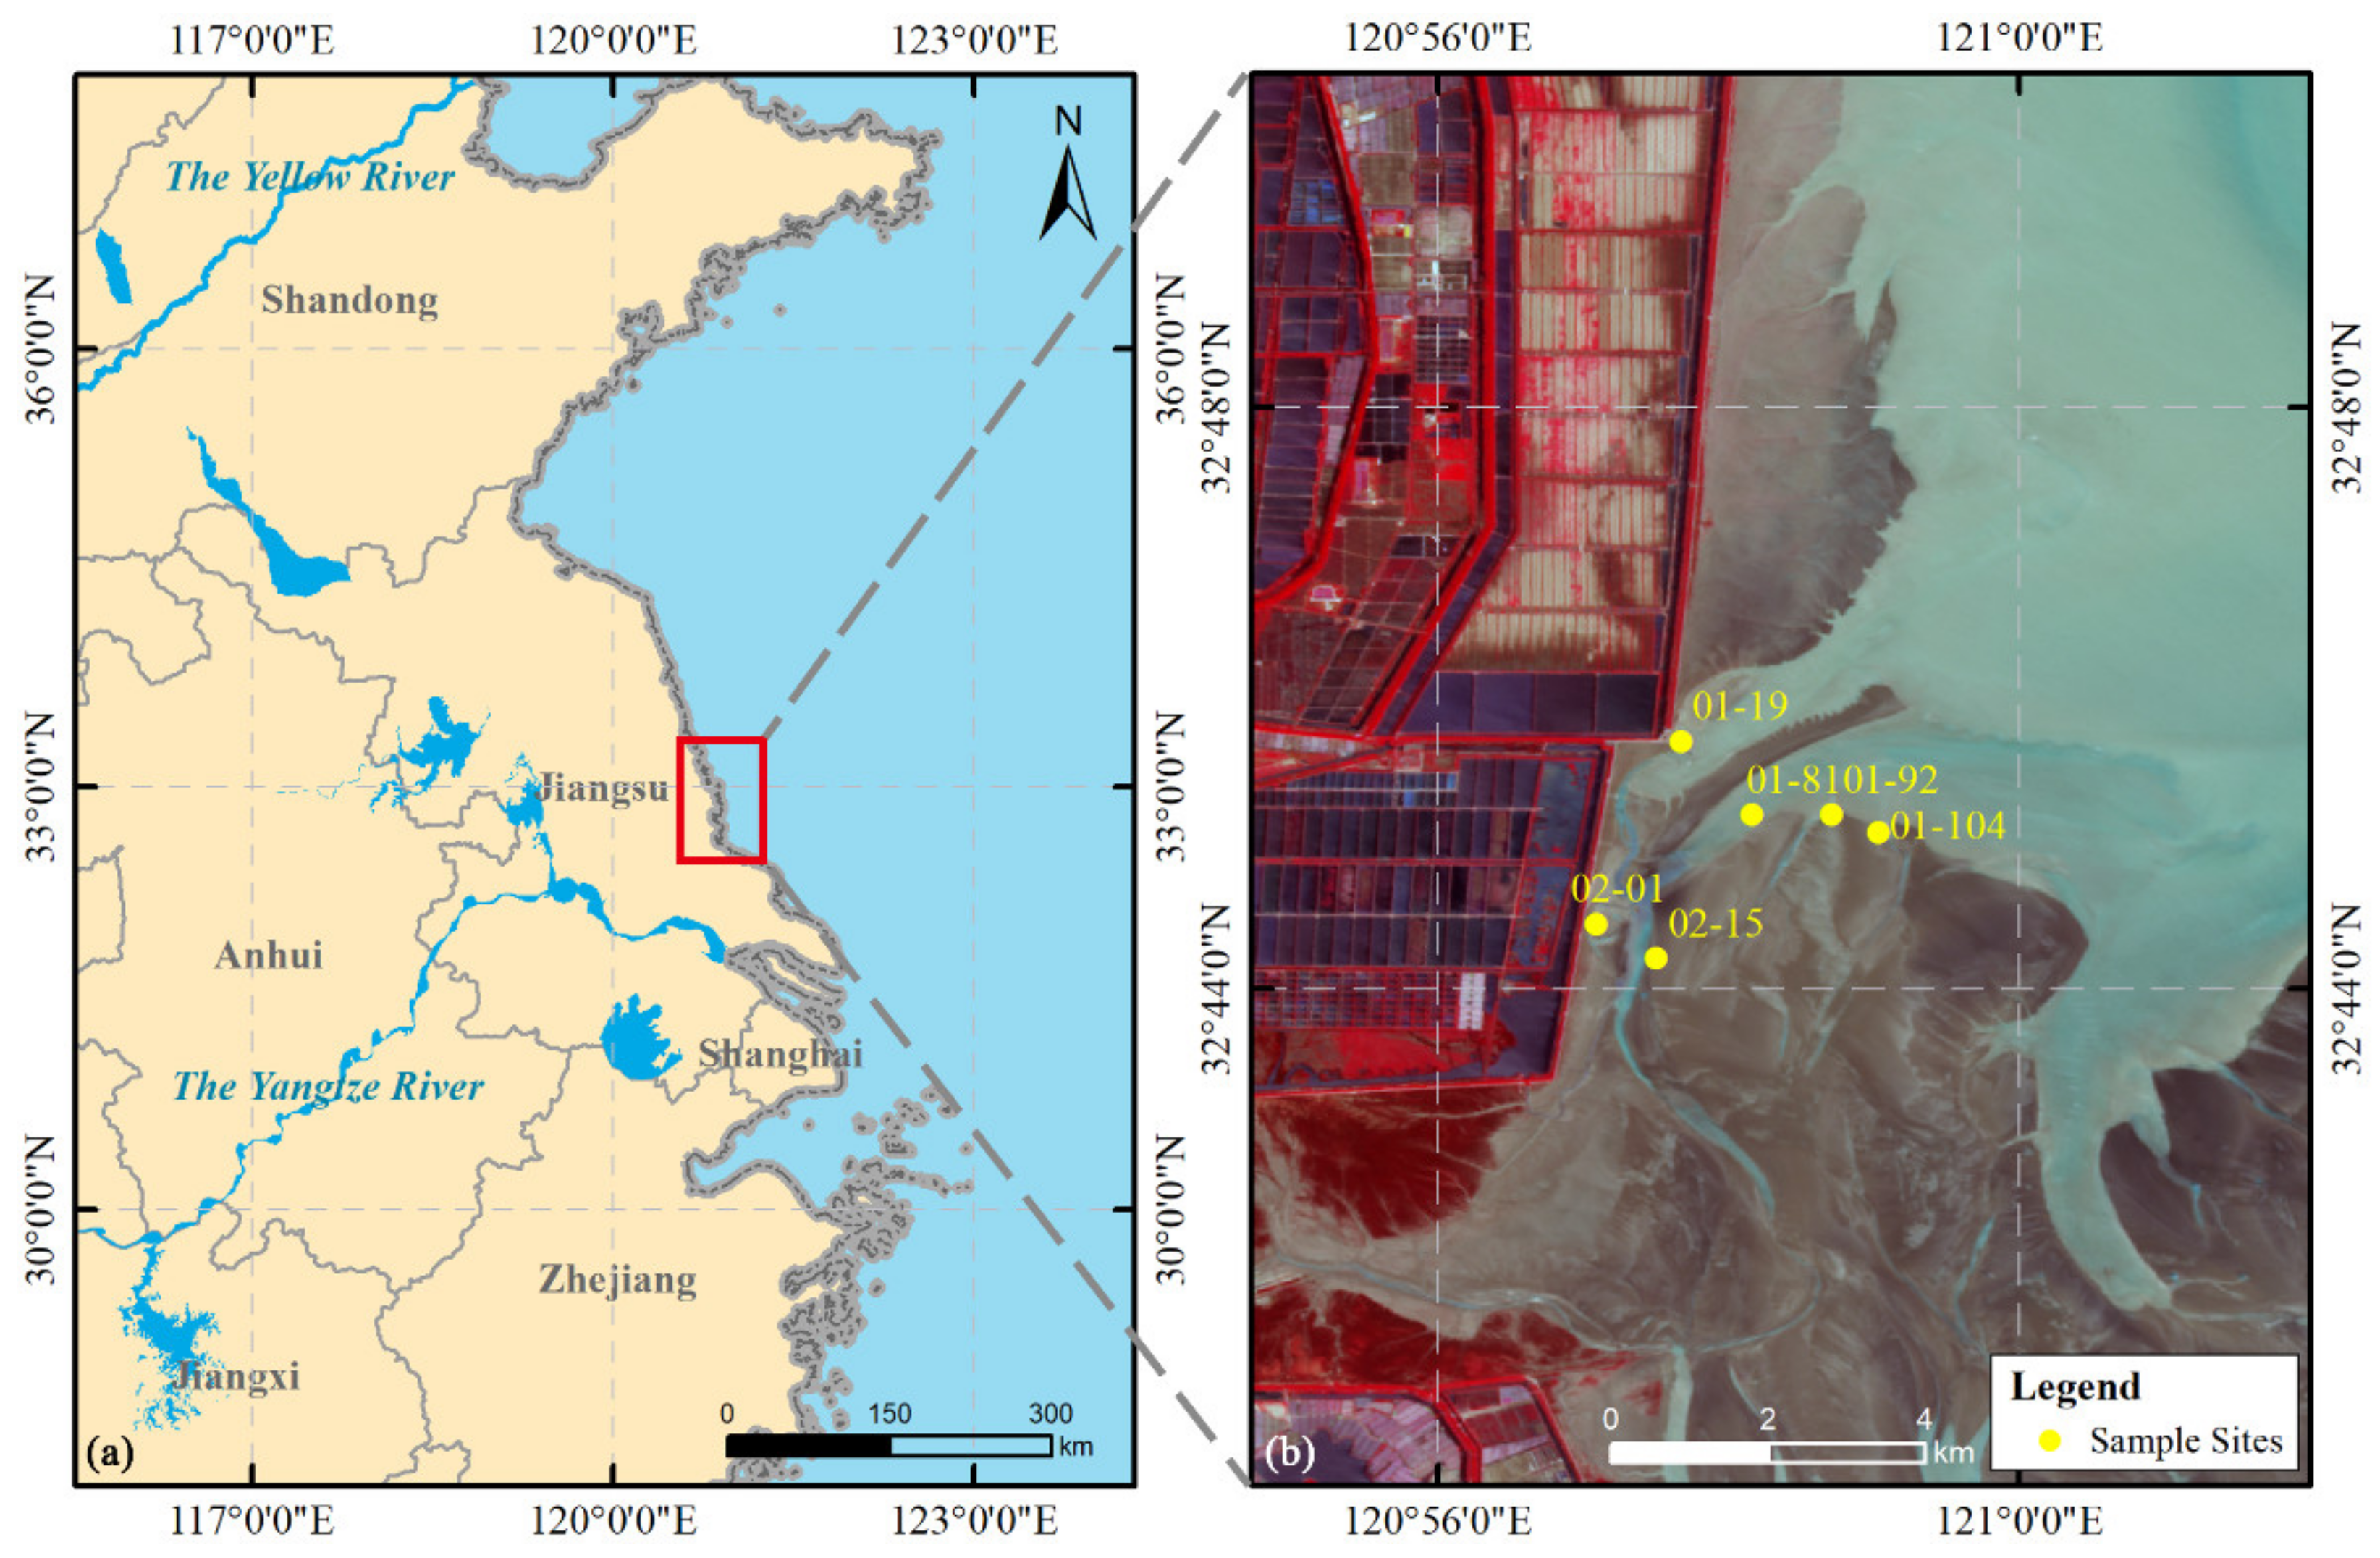
For the sampling site of this study, we selected a tidal flat located east of Dongtai, Jiangsu, China (Figure 1). Because the Yellow River has migrated great distances on both sides of the Shandong Peninsula, wide tidal flats have developed on the plain coasts of Bohai Bay and the west Yellow Sea of Jiangsu Province [48]. Thus, the tidal flat of Jiangsu is one of the major muddy tidal flat coasts of China. Such tidal flats are characterized by a width of 3 to 20 km and an average slope of 0.2‰ and include mud flats above the high tide level, sandy silt flats near the low tide level, and muddy silt flats in the middle of the intertidal zone. This area is a transition zone between the subtropical and warm temperate zones, with moderate climates and abundant rainfall. The mean annual precipitation and mean temperature are 1 061 mm and 15 °C, respectively. The terrain in this region is flat, with an average ground elevation of 4 meters. The seashore saline soil is the main soil type, and there is a low degree of soil development. The soil texture ranges from silty sand to medium soil.
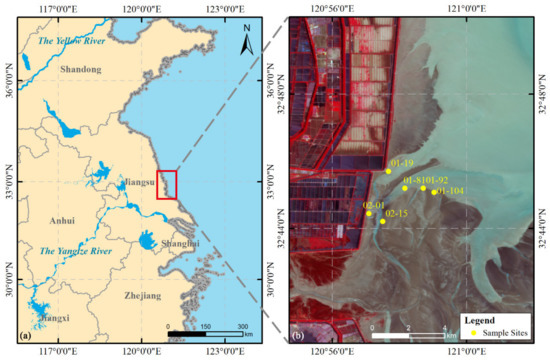
Figure 1.
(a) Location of the study area. (b) Sampling sites and pseudo color displays of GaoFen-1 WFV image (http://www.cresda.com/CN/index.shtml) that show the landscape of the study area on 8 June 2020.
2.2. Data Acquisition and Instruments
Soil samples were obtained in June 2020 from six sampling sites (Figure 1). The bare soil of the tidal flats was used as each sampling site, and the sampling depth was 0–10 cm. After the soil collection was complete, every soil sample was put in an aluminum box with a diameter of 10 cm and a height of 1.5 cm. All the samples were brought back to the laboratory, where impurities were removed for the gradient setting of SMC (for details, see Section 3.1) and particle size determination, afterward, the spectral reflectance was measured. Since the soil samples collected in this study were only used for measurement and analysis in the laboratory, there was no need to consider the uniformity of the spatial distribution of the sample sites.
The reflectance spectra at wavelengths from 350 nm to 2500 nm were measured in the laboratory by using the Fieldspec 4 spectroradiometer (Analytical Spectral Devices, Inc., Boulder, Colorado, USA). The spectral sampling of 1.4 nm was between 350 and 1050 nm, and the spectral sampling of 2 nm was between 1000 and 2500 nm. The field angle of the spectrometer probe was 25°, and the probe height was 10 cm from the surface for observing vertically downwards with a circle of about 8.8 cm diameter. The illumination was provided by a 60 W Halogen lamp, with a zenith angle of 30° and 60°. The azimuth angle was set to 0°, 90°, 180°, and 270°. The view zenith angle range was set between 0° and 50° for each orientation, with a step interval of 10° (Table 1). Before every target measurement, a Spectralon panel calibrated as the reference plate provided total irradiance information.

Table 1.
Geometries of measurement for directional spectral data.
3. Methodology
3.1. Gradient setting of SMC
The field samples were taken back to the laboratory to measure the moisture content and the gradient setting of water.
The SMC was expressed as a weight percent. First, the weights of the soil samples were measured using a precise electronic scale (METTLER TOLEDO ME204E, accuracy = 0.0001 g). Then, the soil samples were heated under 105 °C for 8 h in an oven and weighed again. Last, the SMC were calculated as:
where is the weight of the soil samples with an aluminum specimen box. is the weight of the soil samples after drying with an aluminum specimen box. is the weight of the dry and clean aluminum specimen box.
A total of 5 SMC gradients were set up to investigate the characteristics of soil bidirectional reflectance under different states of moisture content in this study. The experiments were developed to include simulations of natural tidal flat environmental states of different SMC. Water was added to the soil sample in the aluminum box to a supersaturated state and left standing for over 24 h until the free water on the surface disappeared, after which the samples were weighed. Dry conditions were measured at 40 °C. These samples were weighed every half an hour during the gradual drying process. Directional reflectance measurements were taken before conducting the experiments (for details, see Section 2.2). Thus, we obtained different moisture contents of the soil sample and the multi-angle reflectance.
3.2. Bidirectional Reflectance Model and its Extension
The Hapke model is a widely-used soil bidirectional reflectance model, which was originally applied to planetary surfaces, such as the moon’s [40]. The Hapke model is based on the radiation transmission theory. This theory assumes that a horizontal surface includes many irregular absorbing particles with surfaces facing random directions, the particles’ size is larger than the wavelength, and the radiation from the horizontal surface is zero. In addition, the shadows among the particles can be ignored. The radiation received by the sensor is divided into two parts: single scattering radiation and multiple scattering radiation. The single scattering radiation can be expressed as an analytical formula derived from rigorous mathematics, while the calculation of multiple scattering radiation needs to assume the isotropy of the surface scattering.
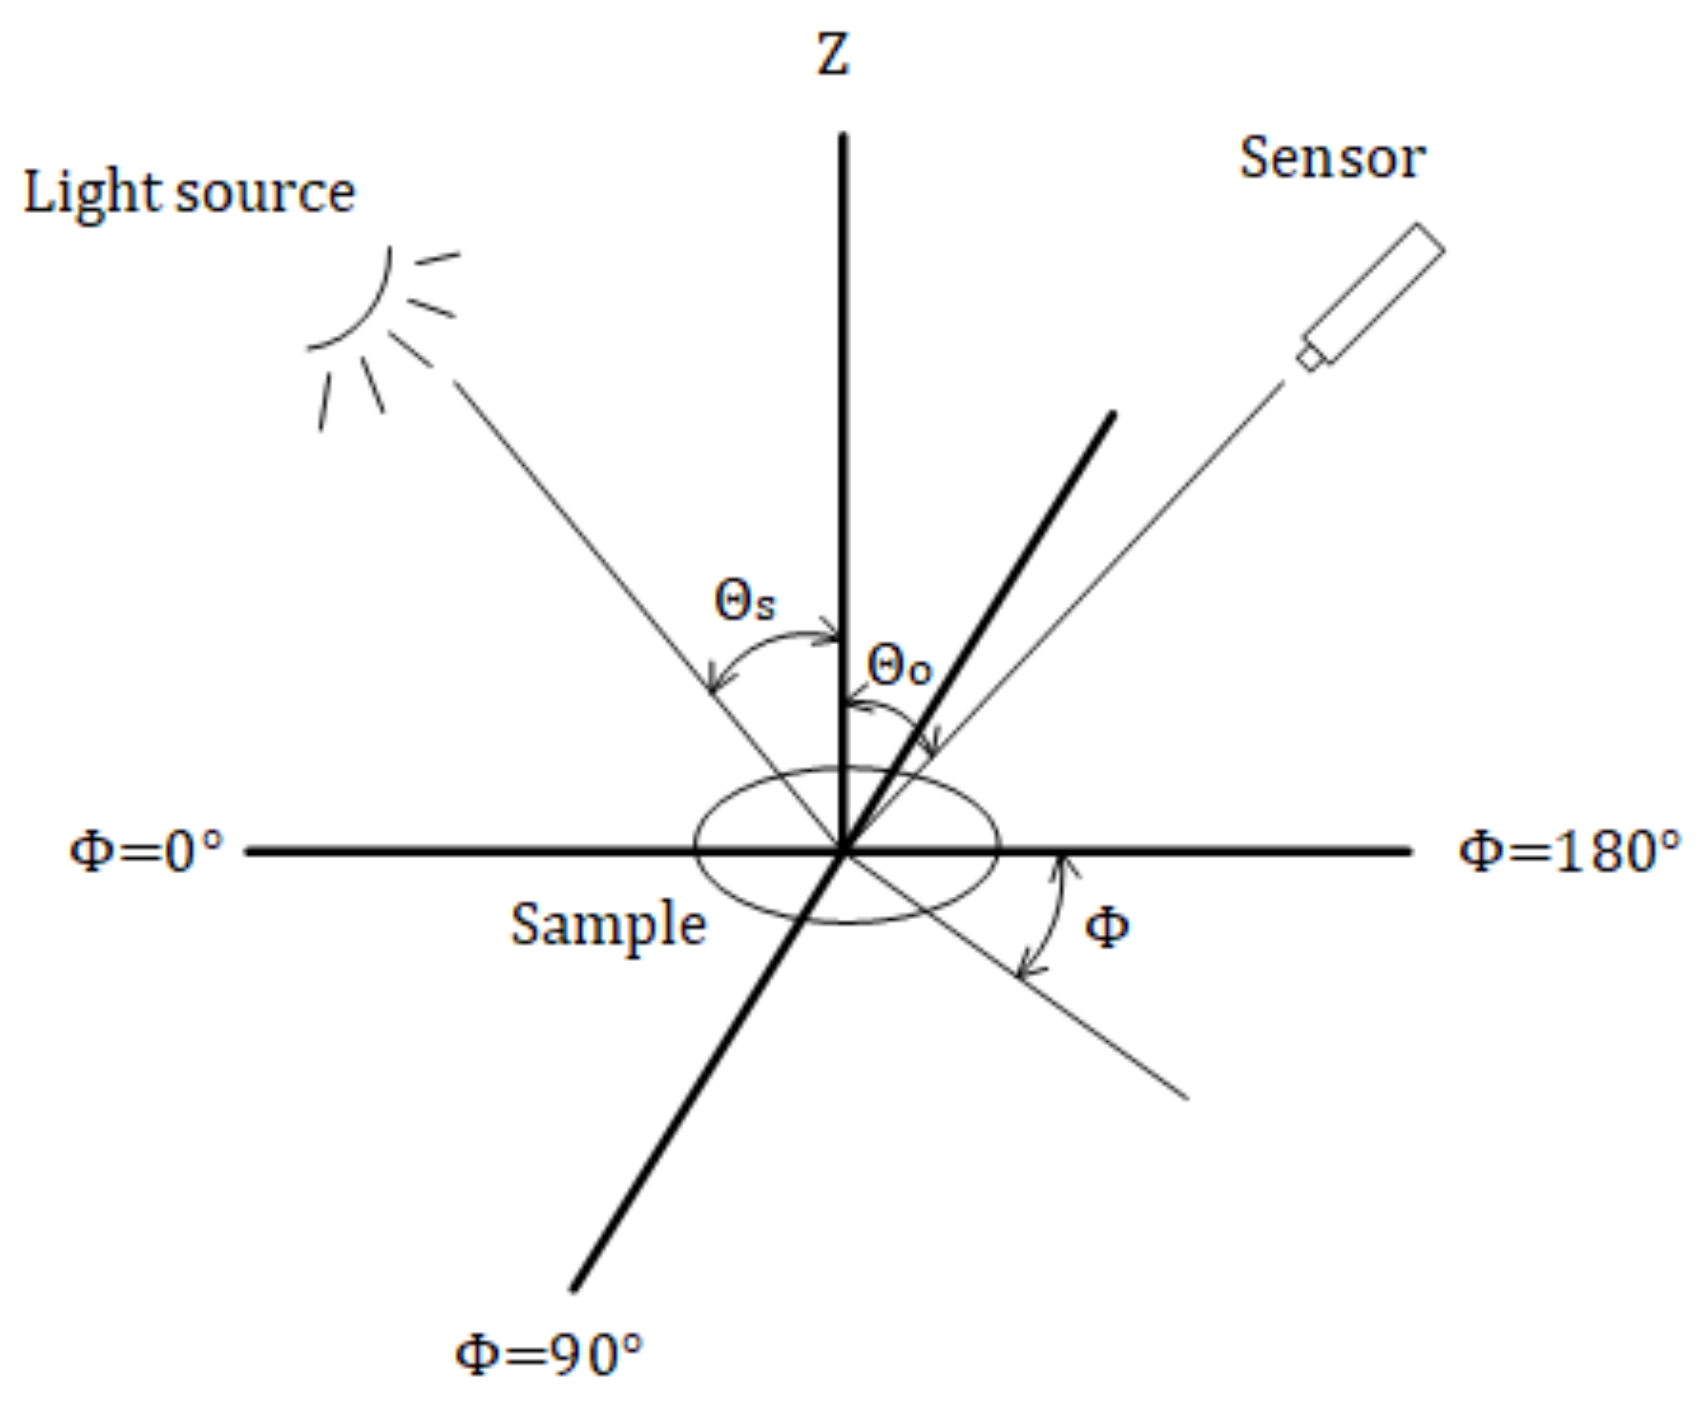
Jacquemoud et al. [37] extended the Hapke model and assumed that the soil is a discontinuous system composed of several blocks separated by many pores and established the SOILSPECT model with six parameters. In this model, the bidirectional reflectance of a surface illuminated with a solar zenith angle , viewed from a zenith angle (Figure 2), can be expressed as follows:
where,
in Equation (2), is the single scattering albedo of the soil. is the viewing azimuth of the sensor. is a scattering phase function according to a second-order Legendre polynomial, which is proposed to interpret both backward scattering and forward scattering from a smooth soil surface. In this function, , which is the phase angle, refers to the angle between the incident light and the emergent light, and indicates the angle between the specular and the outgoing light directions. , , , and are coefficients of the scattering phase function. is the backscattering of the light as a function of , a roughness parameter , and that describes the intensity size of the hot spot effect. In function , is related to the grain size distribution, the porosity of the medium and gradient of compaction with depth [49]. is set to 1 [37] because Pinty et al. [50] did not consider that was derived on strictly theoretical grounds. The is the function used to compute the multiple scattering, the term approximates the contribution from multiple scattering according to Pinty et al. [50], while is used to indicate the substitution of the and terms into the equation, respectively.
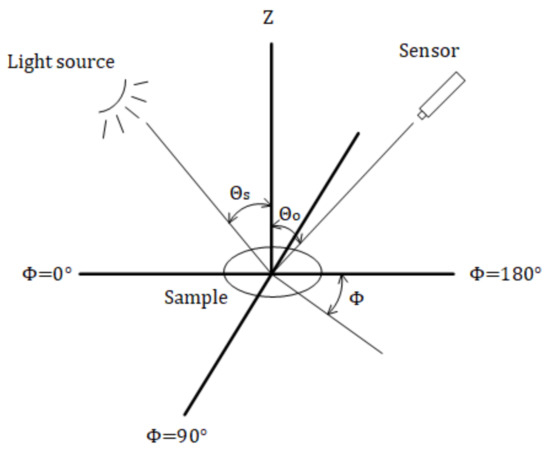
Figure 2.
Illumination and view angles in the soil bidirectional spectral reflectance model.
Based on the above model, Yang et al. [45] combined the equation describing the relationship between bi-hemisphere reflectance, single scattering albedo proposed by Bach and Mauser [51] (Equation (8)), and the Beer–Lambert law (Equation (9)) to introduce soil moisture information for SMC retrieval research.
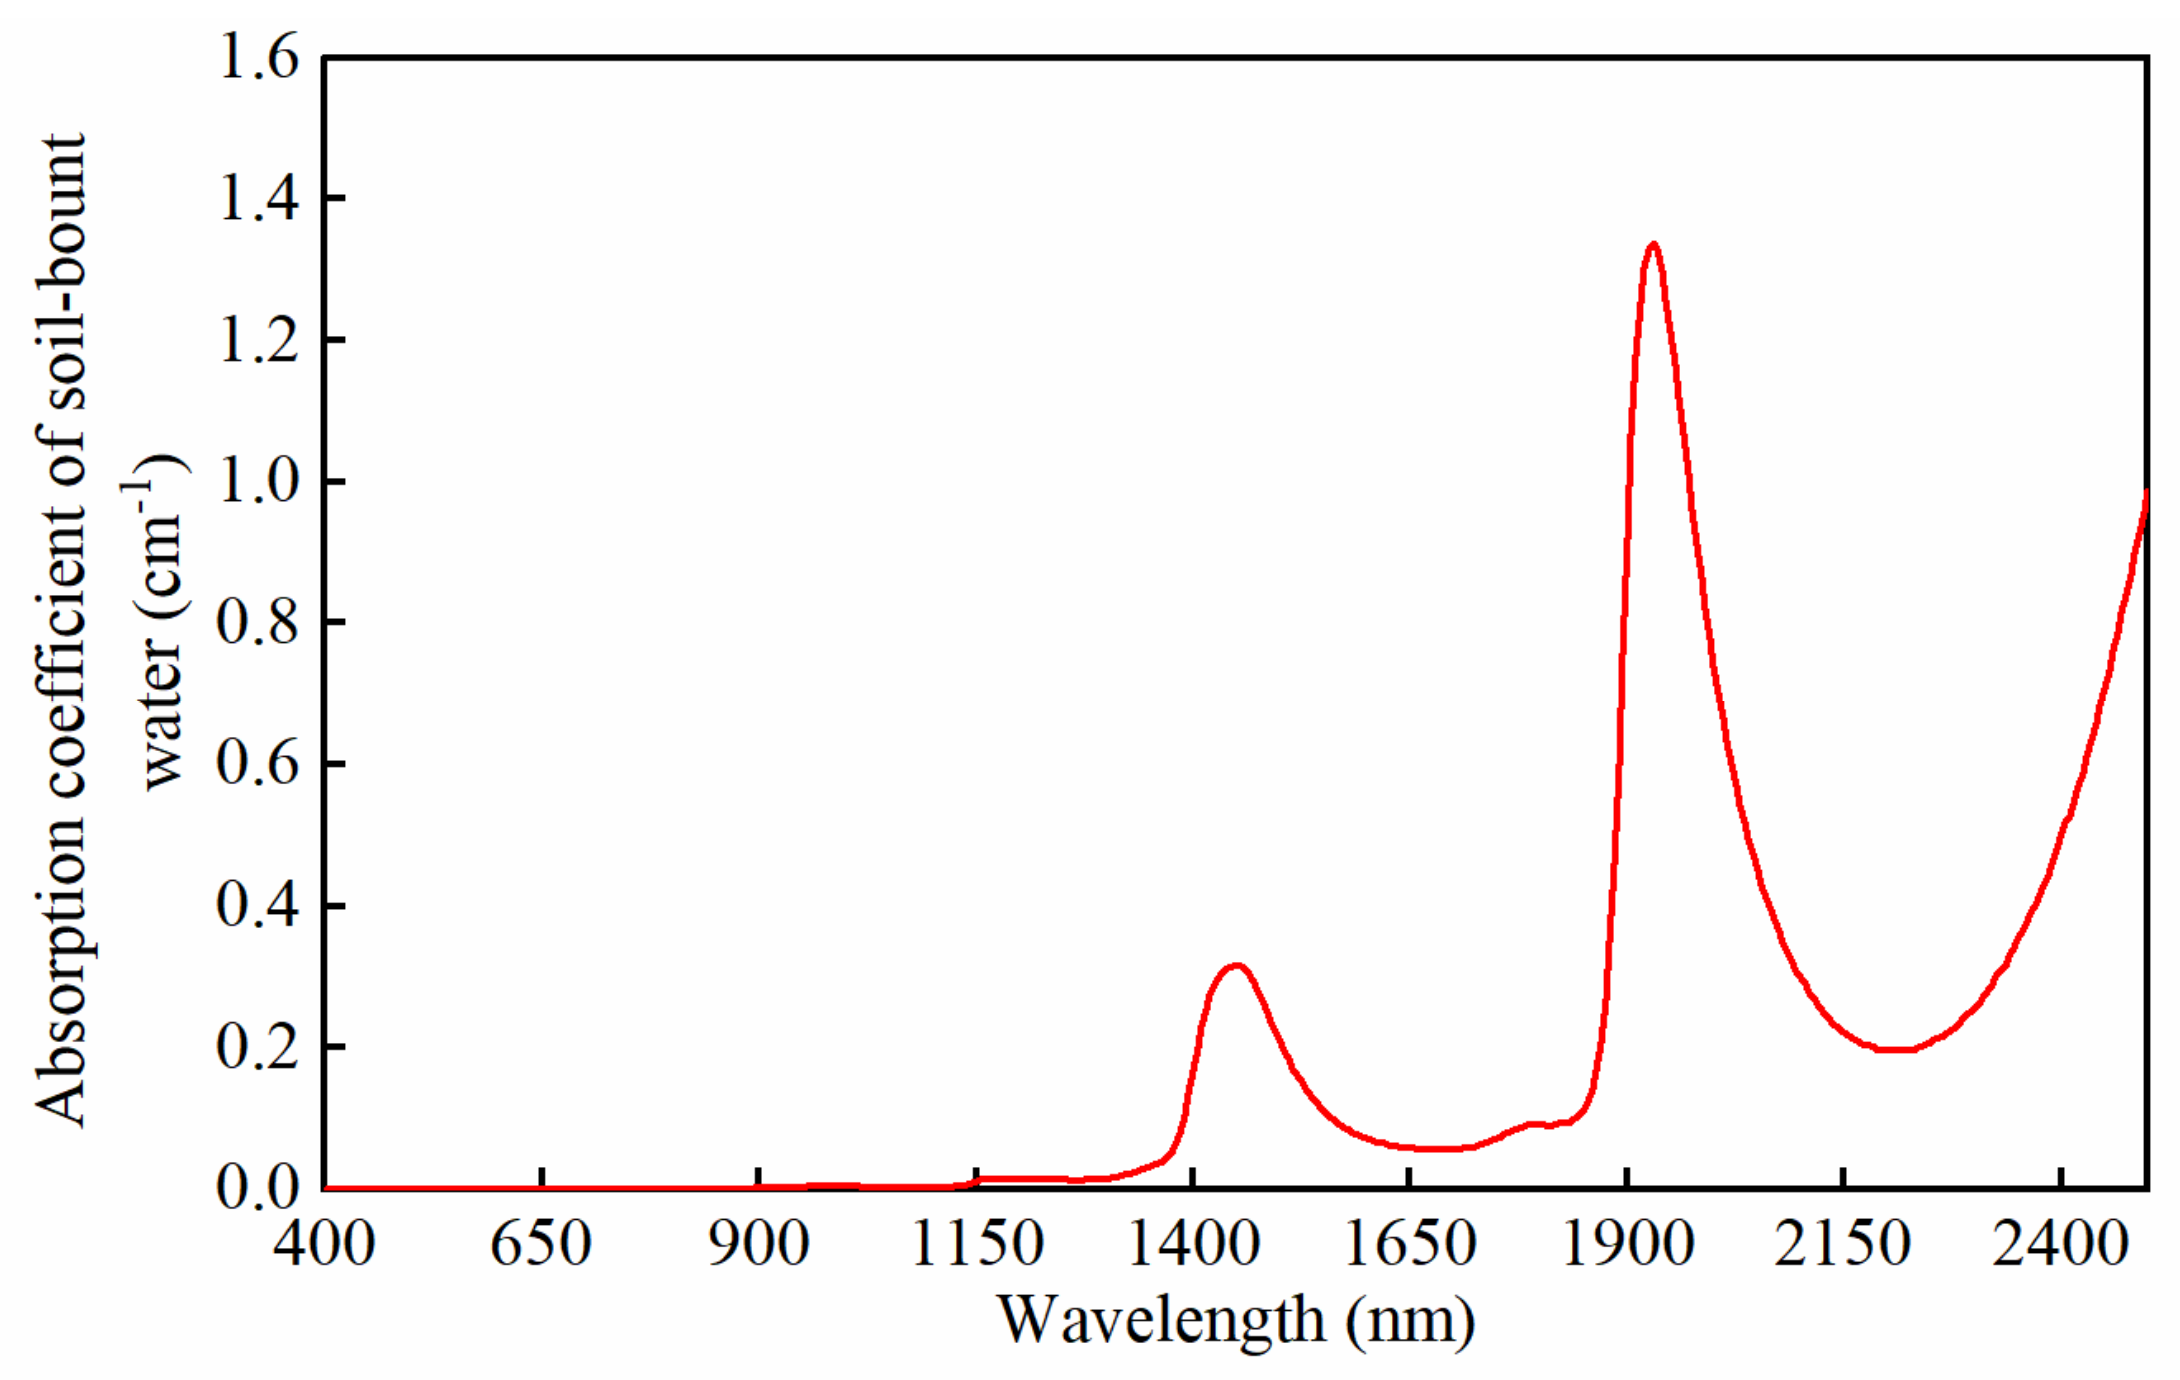
in Equations (8) and (9), is the double-hemisphere reflectance of wet soil, is the reflectance of the dry soil sample, is the absorption coefficient (cm−1), and its reference value is the absorption coefficient of water within the wavelength range of 400 nm–2500 nm measured by Segelstein’s laboratory [52] (Figure 3). is the equivalent water thickness of soil moisture (cm). The final formulation of this approach contains the following seven parameters: , , , , , , and .
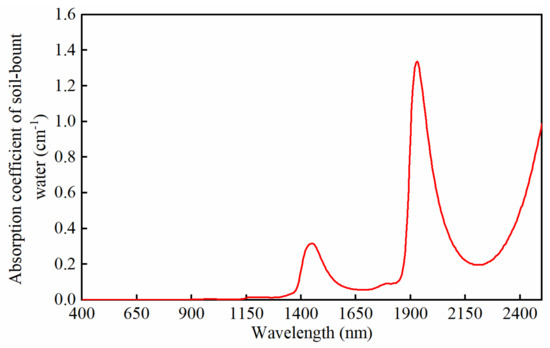
Figure 3.
The coefficient of water absorption.
3.3. Model Parameter Retrieval and Evaluation Methods
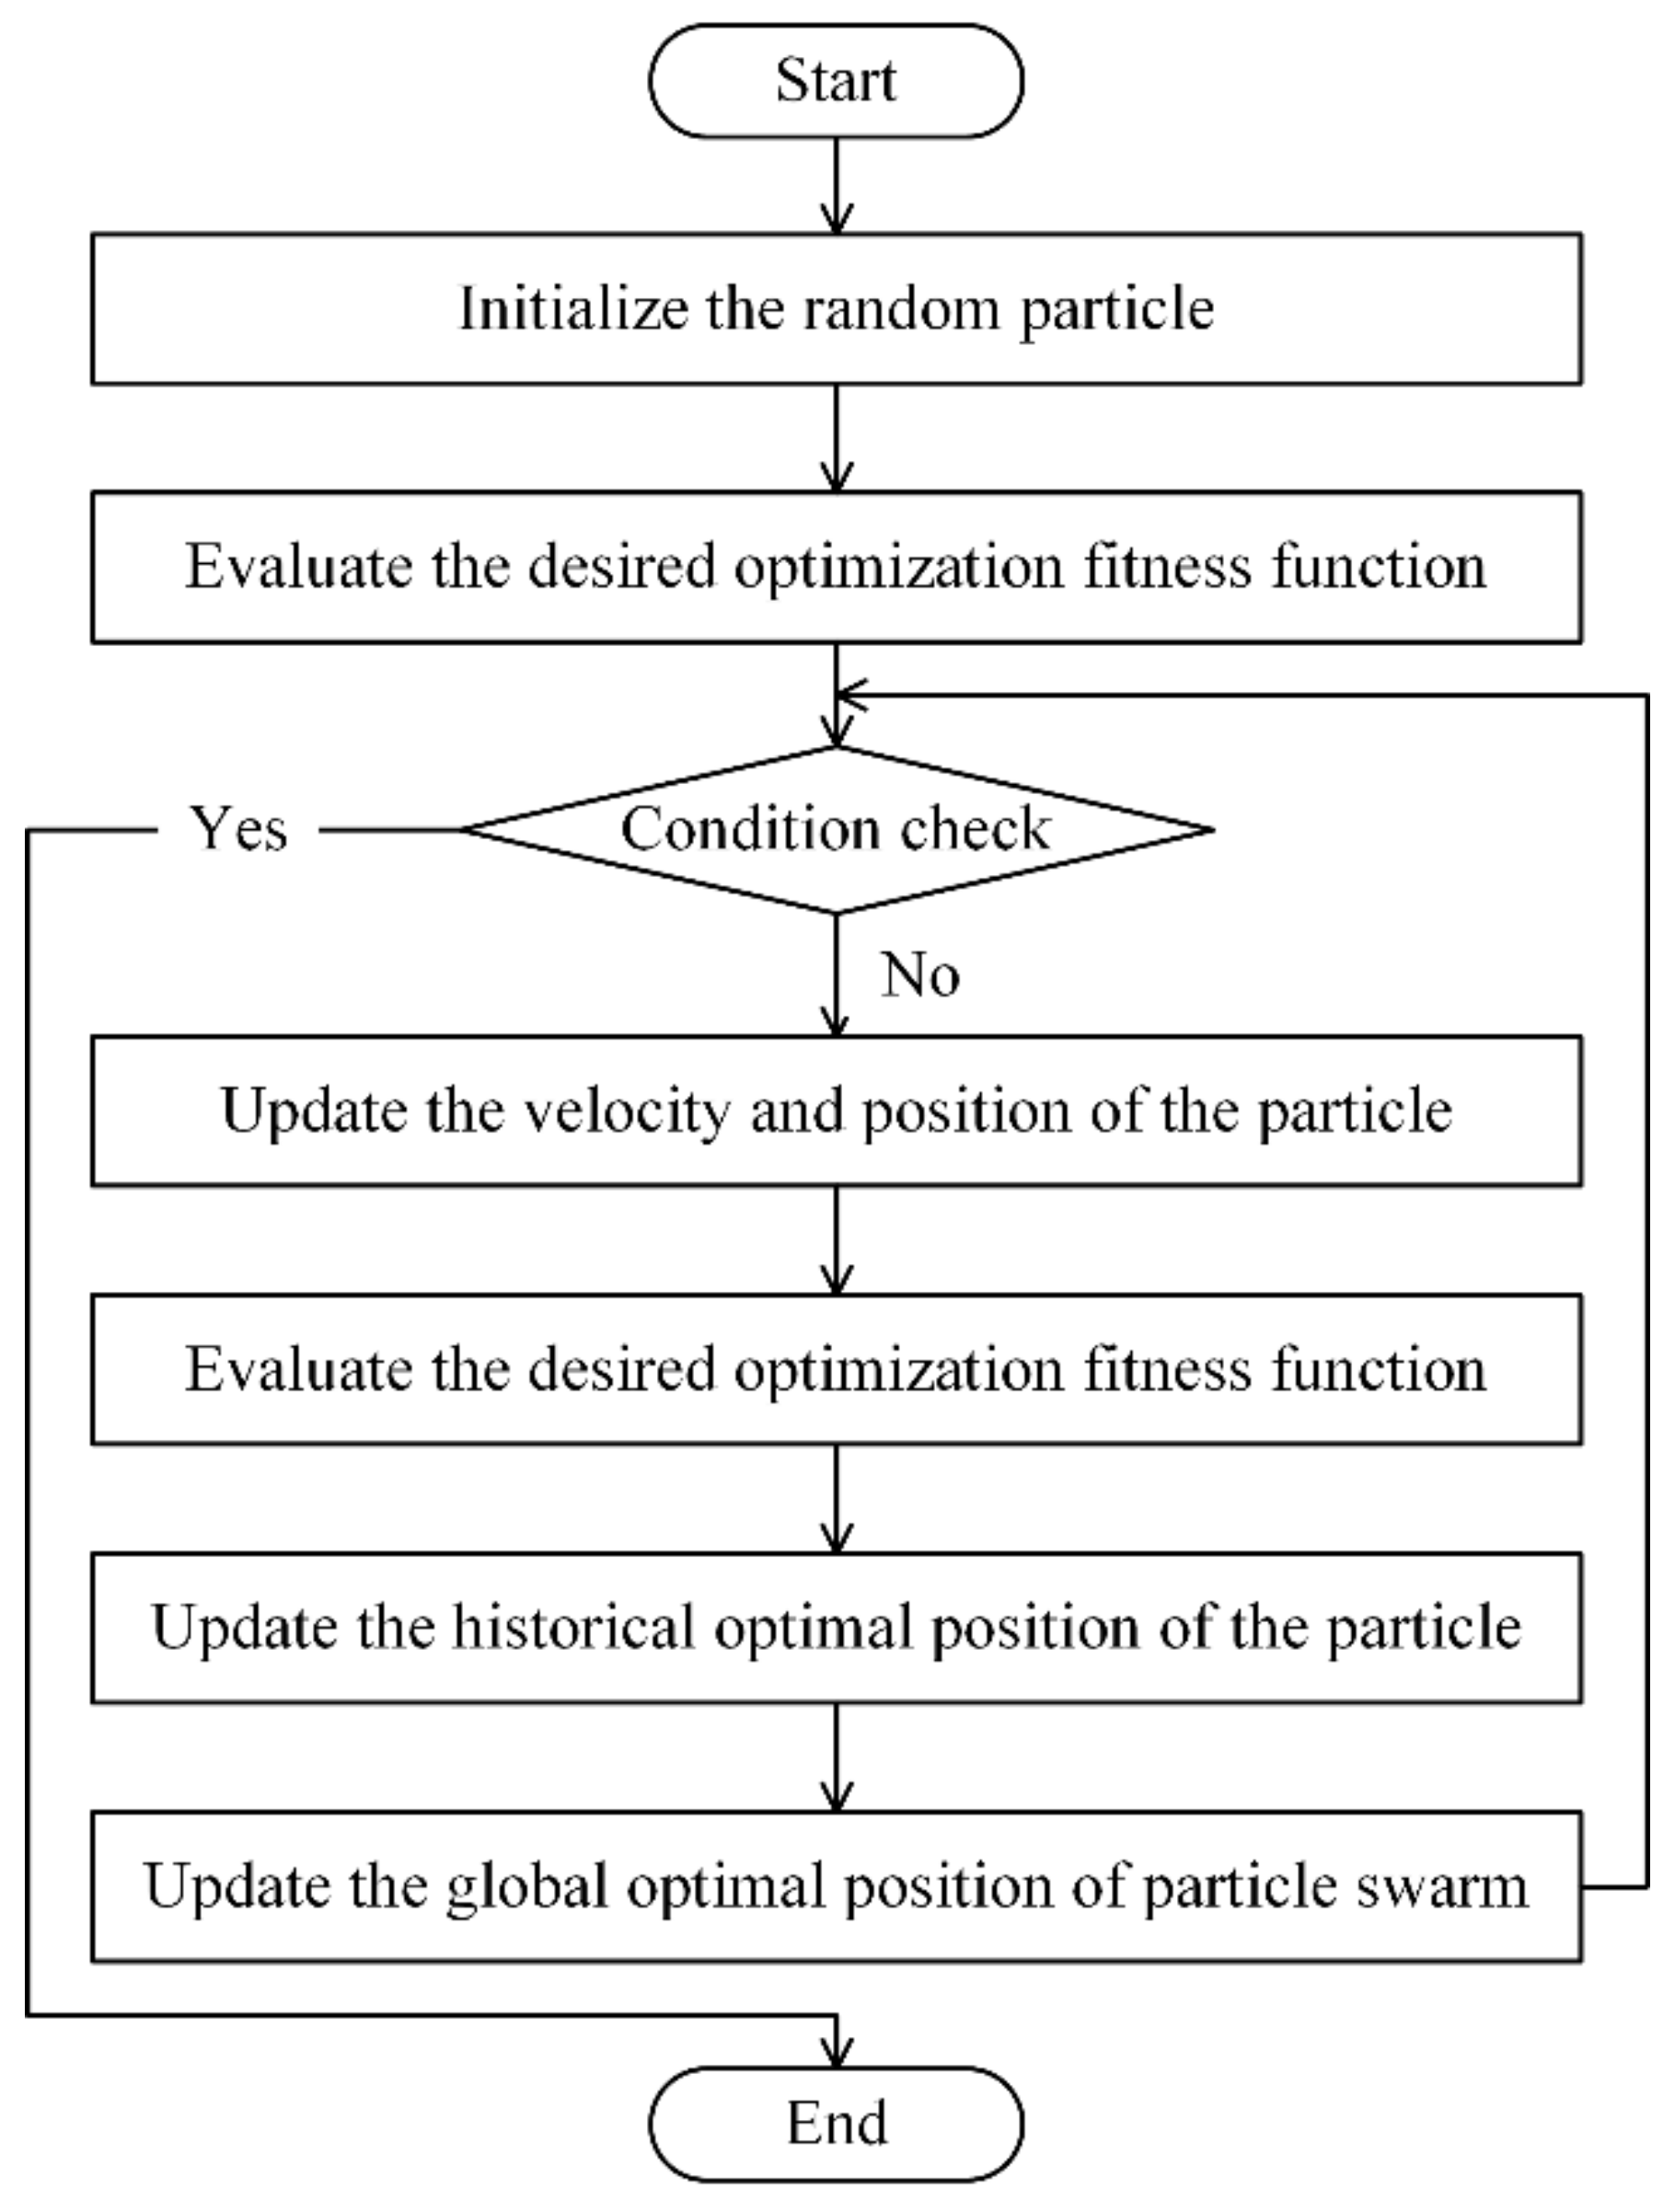
Because the above model is highly nonlinear and contains seven model parameters, it is difficult to find unique, meaningful solutions for its inversion. Without prior information regarding the parameter values, the inverse problem usually involves an optimal set of variables that minimizes the distance between the observed value and the modeled values by iterative numerical calculation. First, the initial parameter values were defined to determine the best-fit parameters. In previous studies, Pinty et al. [50] and Chappell et al. [46] pointed that the optimization procedure is not sensitive to the initial estimates. However, through a series of experiments with many different initial values, Wu et al. [47] found that the inversion results are significantly dependent on the initial values. Thus, this study employed the particle swarm optimization algorithm to solve the optimal solution of the bidirectional reflectance model. Particle swarm optimization (PSO) is a powerful optimization algorithm that was originally proposed by Kennedy (a social psychologist) and Eberhart (an electrical engineer) [53]. The algorithm is simple in principle, easy to implement with fewer control parameters, and has a fast search speed and wide range. Because of these advantages, it has been widely studied and applied in various fields. The PSO algorithm first initializes a group of random particles (i.e., providing a random solution), and then the particle group searches the optimal solution at a certain speed and position according to the position of the current optimal particle solution in the solution field. In other words, the PSO algorithm determines the optimal solution through iteration. The flow chart of the PSO algorithm is shown in Figure 4. To ensure a physically reasonable meaning and to avoid overfitting, some parameter constraints and control parameters of the PSO algorithm were employed in our study. The parameter limits in Table 2 were derived from the results of existing studies [37,47,50].
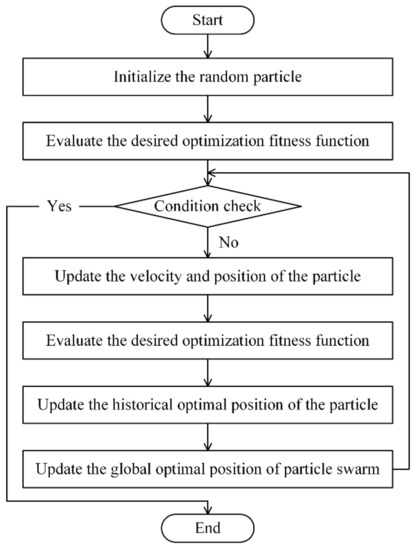
Figure 4.
The flow chart of the particle swarm optimization (PSO) algorithm.

Table 2.
The setting of parameters for the SOILSPECT model and the initialization of the particle swarm optimization (PSO) algorithm.
The performance of the optimization was judged using the quantity , defined as:
where is the multi-angle spectral observation value, is the calculated value of the bidirectional reflectance model with the given parameters of the optimization, and is the total number of observations. The performance of the optimization is judged using the square root of the mean squared difference (RMSE), defined as:
where is the number of degrees of freedom, which is the number of independent data points minus the number of parameters estimated by the procedure.
In this study, we performed the retrieval of characteristic bands determined by the continuum removal method of the spectral reflectance of the soil samples. According to Equation (2), it can be concluded that the coefficient of the scattering phase function and soil surface roughness parameters (h, b, c, b′, c′) vary with the wavelength. However, in the existing research of many scholars the parameters in the SOILSPECT model, except for , are not sensitive to wavelength [37,46,47]. Because of this, these parameters can be treated as constant and adaptive to all bands. Thus, in the inversion process of this paper, each parameter was retrieved globally. Lastly, the final parameter results are determined by calculating the average.
4. Results
4.1. Descriptive Statistics of SMC and Particle Size
The surface soil samples were collected from the study area, oven-dried, and once their impurities (dead twigs and shell fragments, etc.) were removed, they were analyzed by a laser diffraction instrument (Mastersizer 2000, Malvern Panalytical Co., Malvern, UK). The particle size and the SMC of the six soil samples used in this study are shown in Table 3. The particle size of the six soil samples from largest to smallest are as follows: 01-81, 02-15, 01-92, 01-104, 02-01, 01-19.

Table 3.
Soil moisture content (SMC) and particle size of six soil samples.
4.2. Reflectance Features of Soil Samples
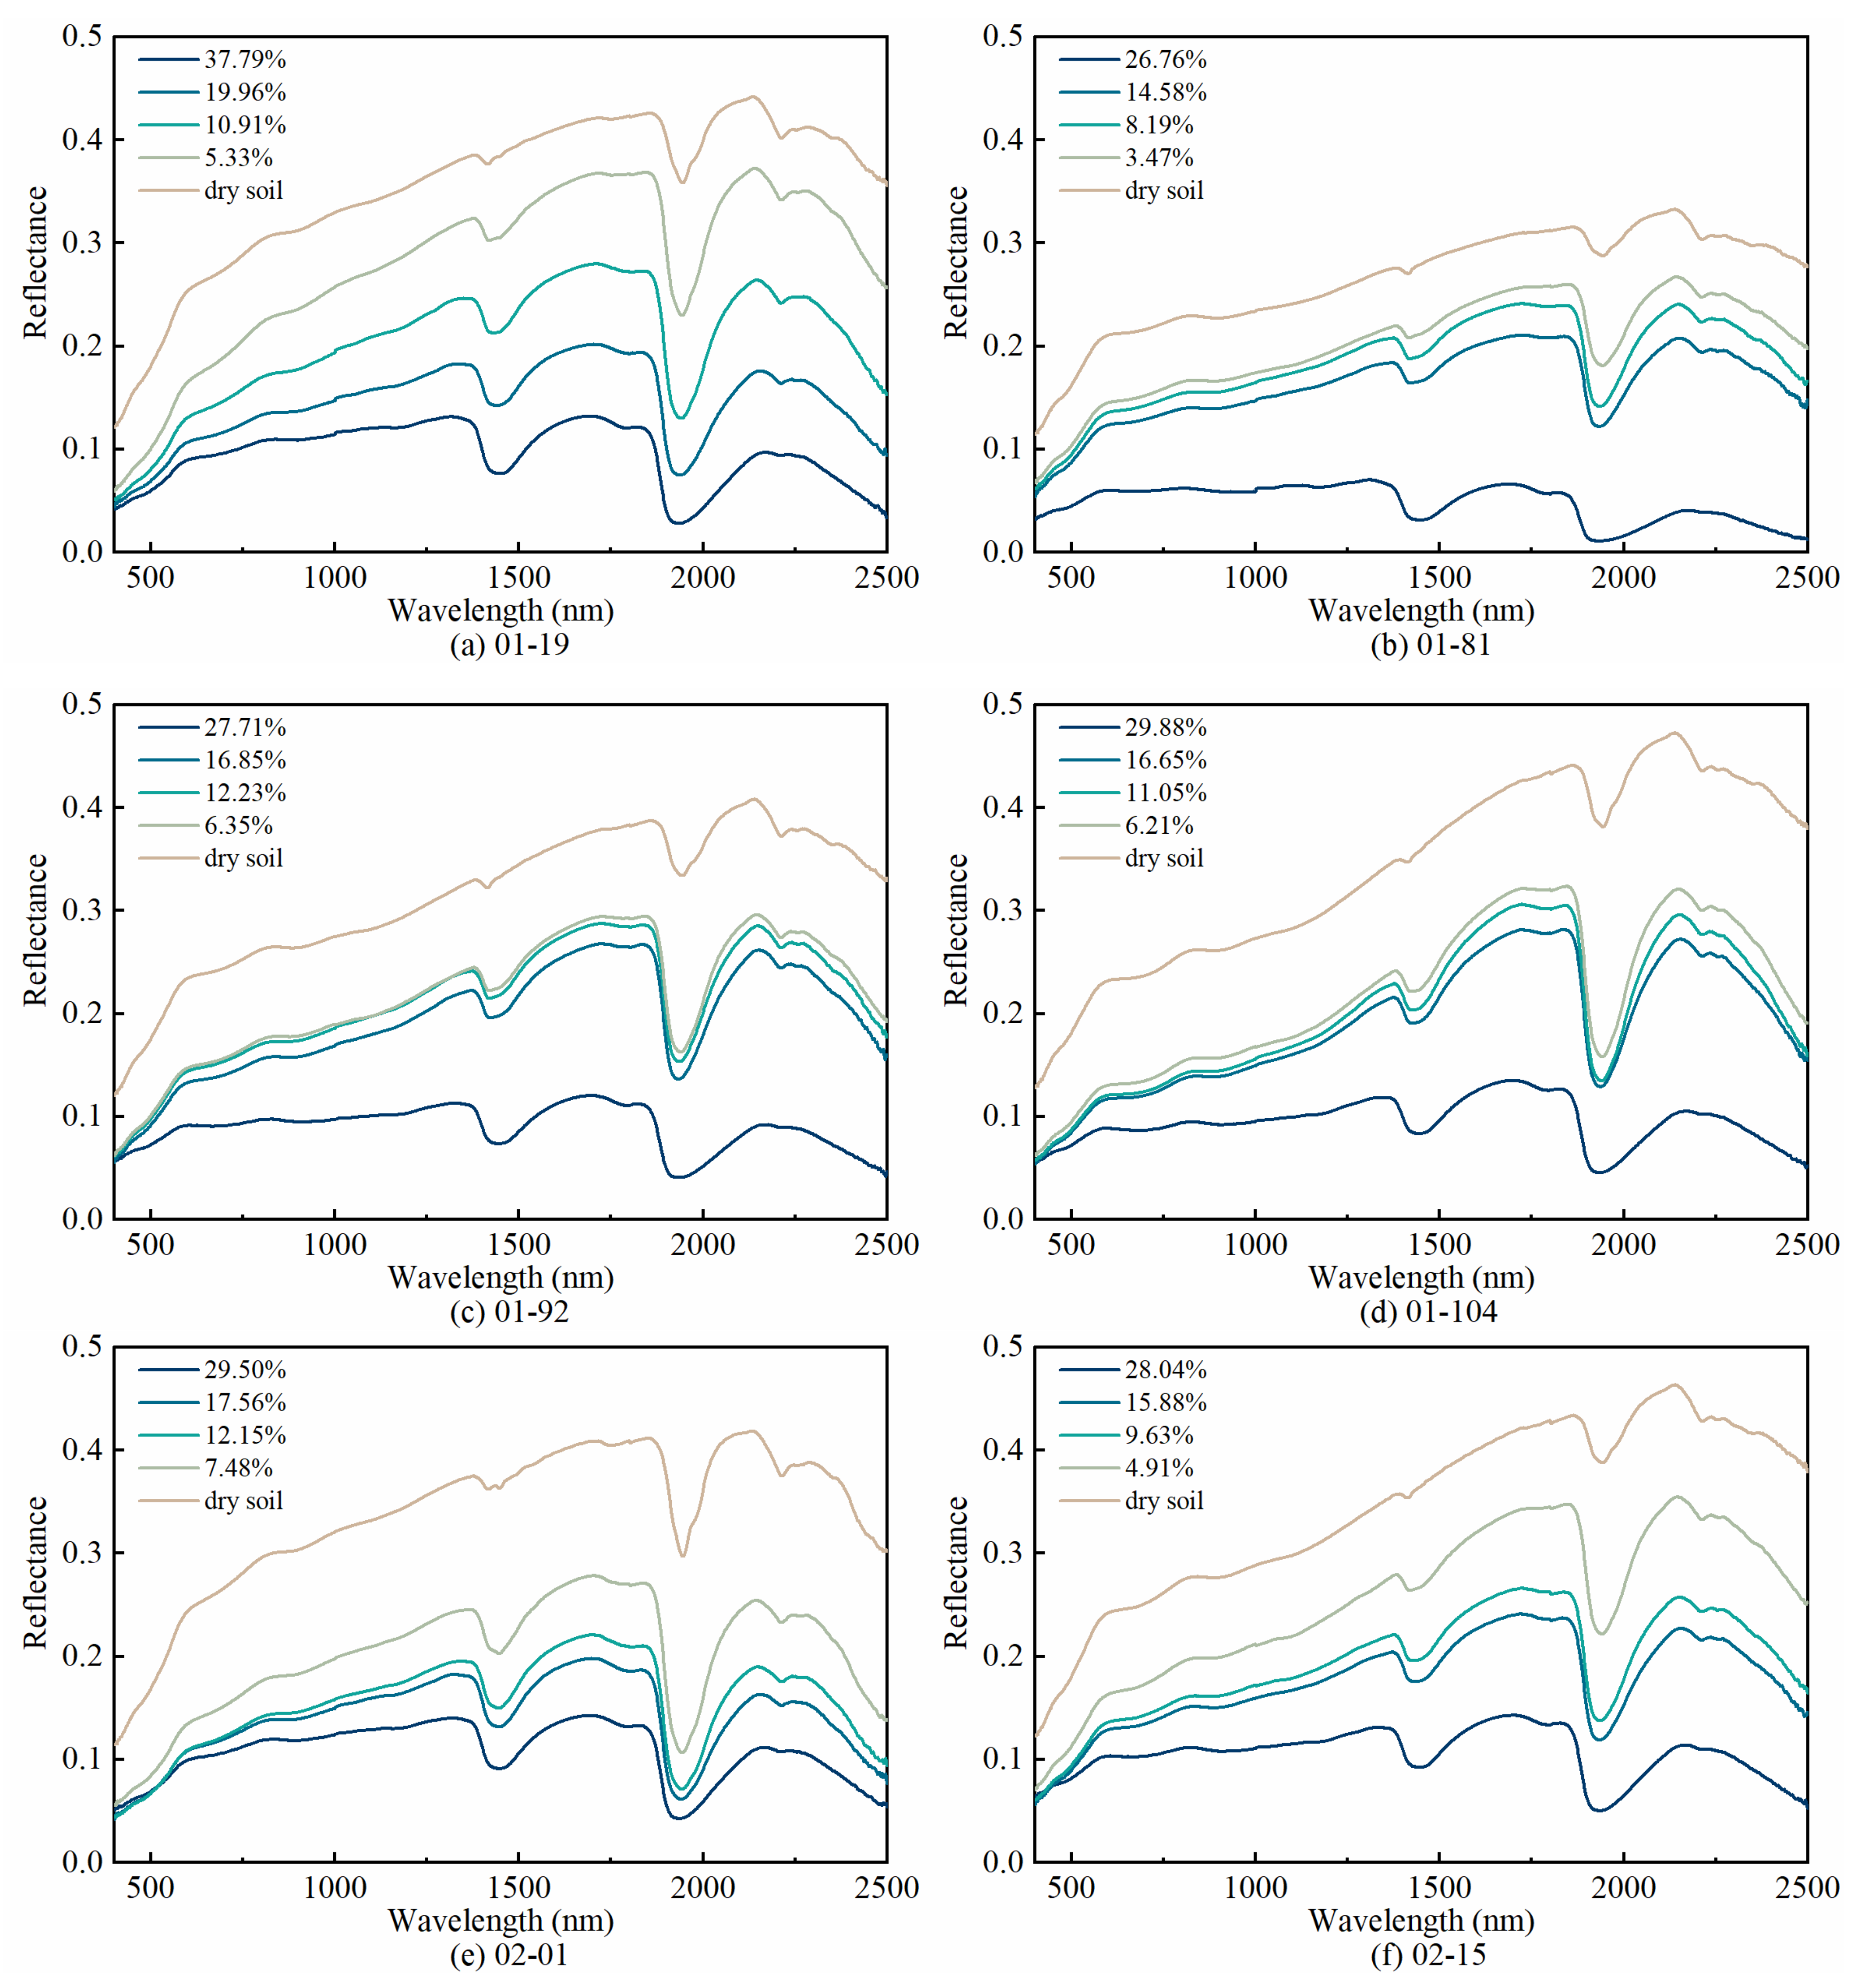
To analyze the reflectance of soil samples with different moisture content, we configured soil samples with different moisture contents according to the method in Section 3.1 and measured their reflectance. Because all soil systems are spatially heterogeneous and their spectral properties are influenced by many factors (i.e., moisture content, surface roughness, mineral composition, organic matter content, and observed conditions), soil samples were observed under the same conditions with zenith angle of the light source and sensor of 30° and 0° (perpendicular to the soil samples surface) was selected as the paradigms for feature analysis here. As shown in Figure 5, reflectance spectra varied among the six soil samples with different SMC, while the trends were similar. The reflectance decreased with the increase in SMC. This is in very good agreement with previous results [54,55]. The overall reflectance of the six soil samples was not high, and the reflectance curve shape of the 600 ~ 1300 nm band was slightly concave. Two obvious reflectance peaks at about 1440 nm and 1920 nm were displayed in the spectral curve. For six different soil samples, the absorption peaks varied in depth, width, and displacement. Compared with the shortwave infrared (SWIR) bands, the visible bands (400 nm ~ 780 nm) were less sensitive to the fluctuations of SMC. This coincides with the finding of an existing study in which Liu et al. [28] pointed out that the longer wavelengths would be more efficient for soil moisture estimation within the low soil moisture levels.
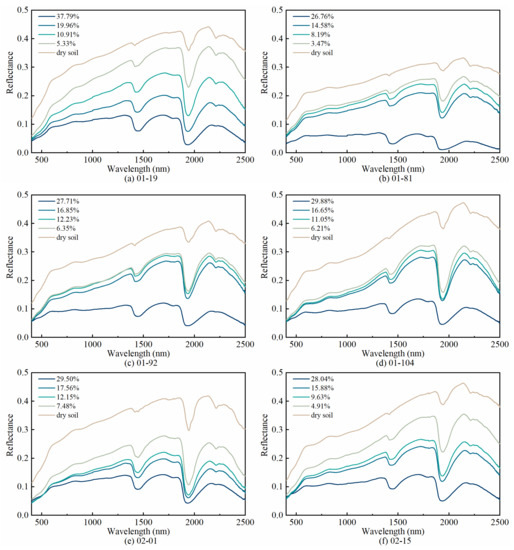
Figure 5.
Reflectance spectra of six soil samples at different soil moisture content (SMC) levels.
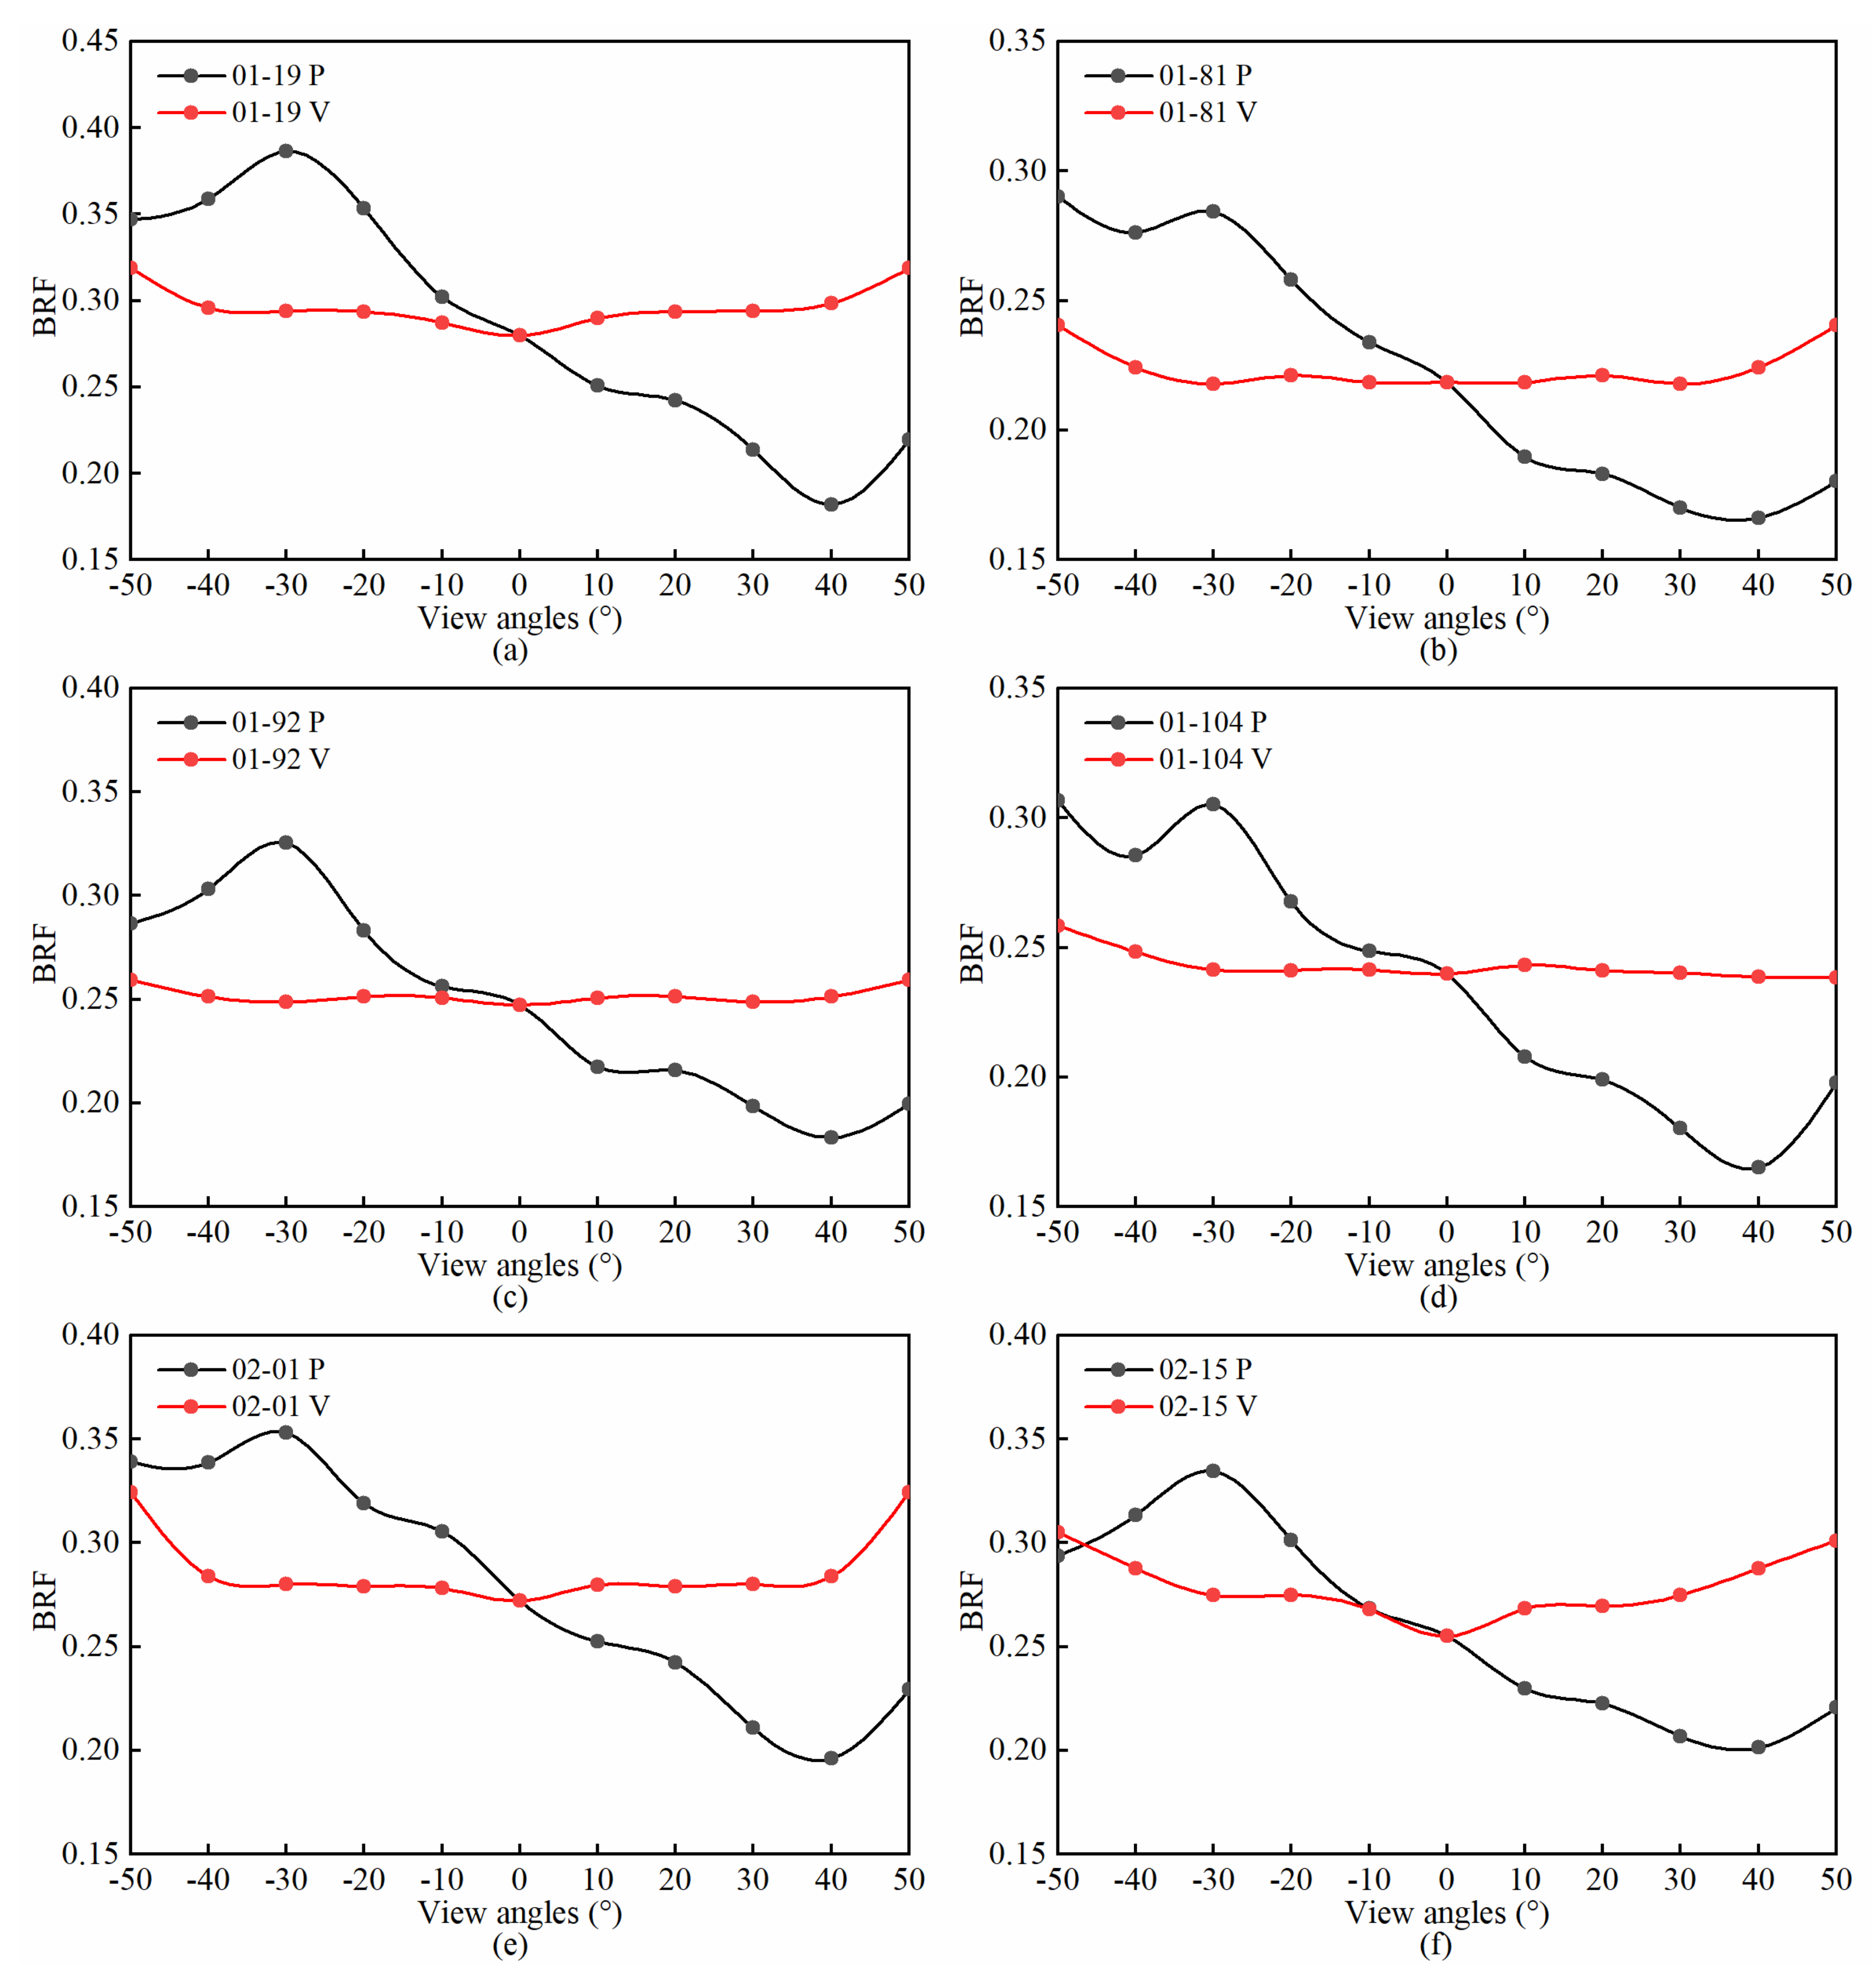
Figure 6a–f shows the bidirectional reflectance factor (BRF) of six dry soil samples in the red band (700 nm). Negative view angles indicate the backward scattering of light (the view direction is the same as the incident direction of the light source), and positive view angles indicate forward scattering (the view direction is opposite to the incident direction of the light source). In general, the six soil samples were “bowl” shaped in the light source principal plane. The reflectance increased as the angle between the view direction and the incident direction of the light source decreased. The reflectance was maximum opposite to the light source (backward scattering) as the detector viewed more soil sample surfaces in direct light [56]. In the vertical light source principal plane, the reflectance was azimuthally symmetric, and the reflectance varied little as the view angles changed.
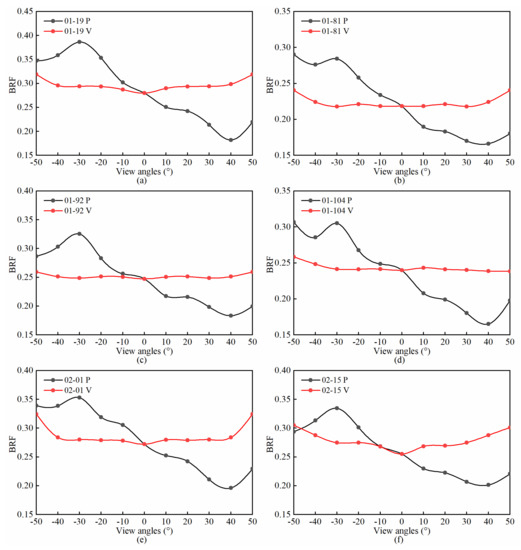
Figure 6.
Angular signatures of bidirectional reflectance for 6 dry soil samples in red band (700 nm); P: light source principal plane; V: the vertical light source principal plane.
4.3. Retrieval Results of the Model Parameters
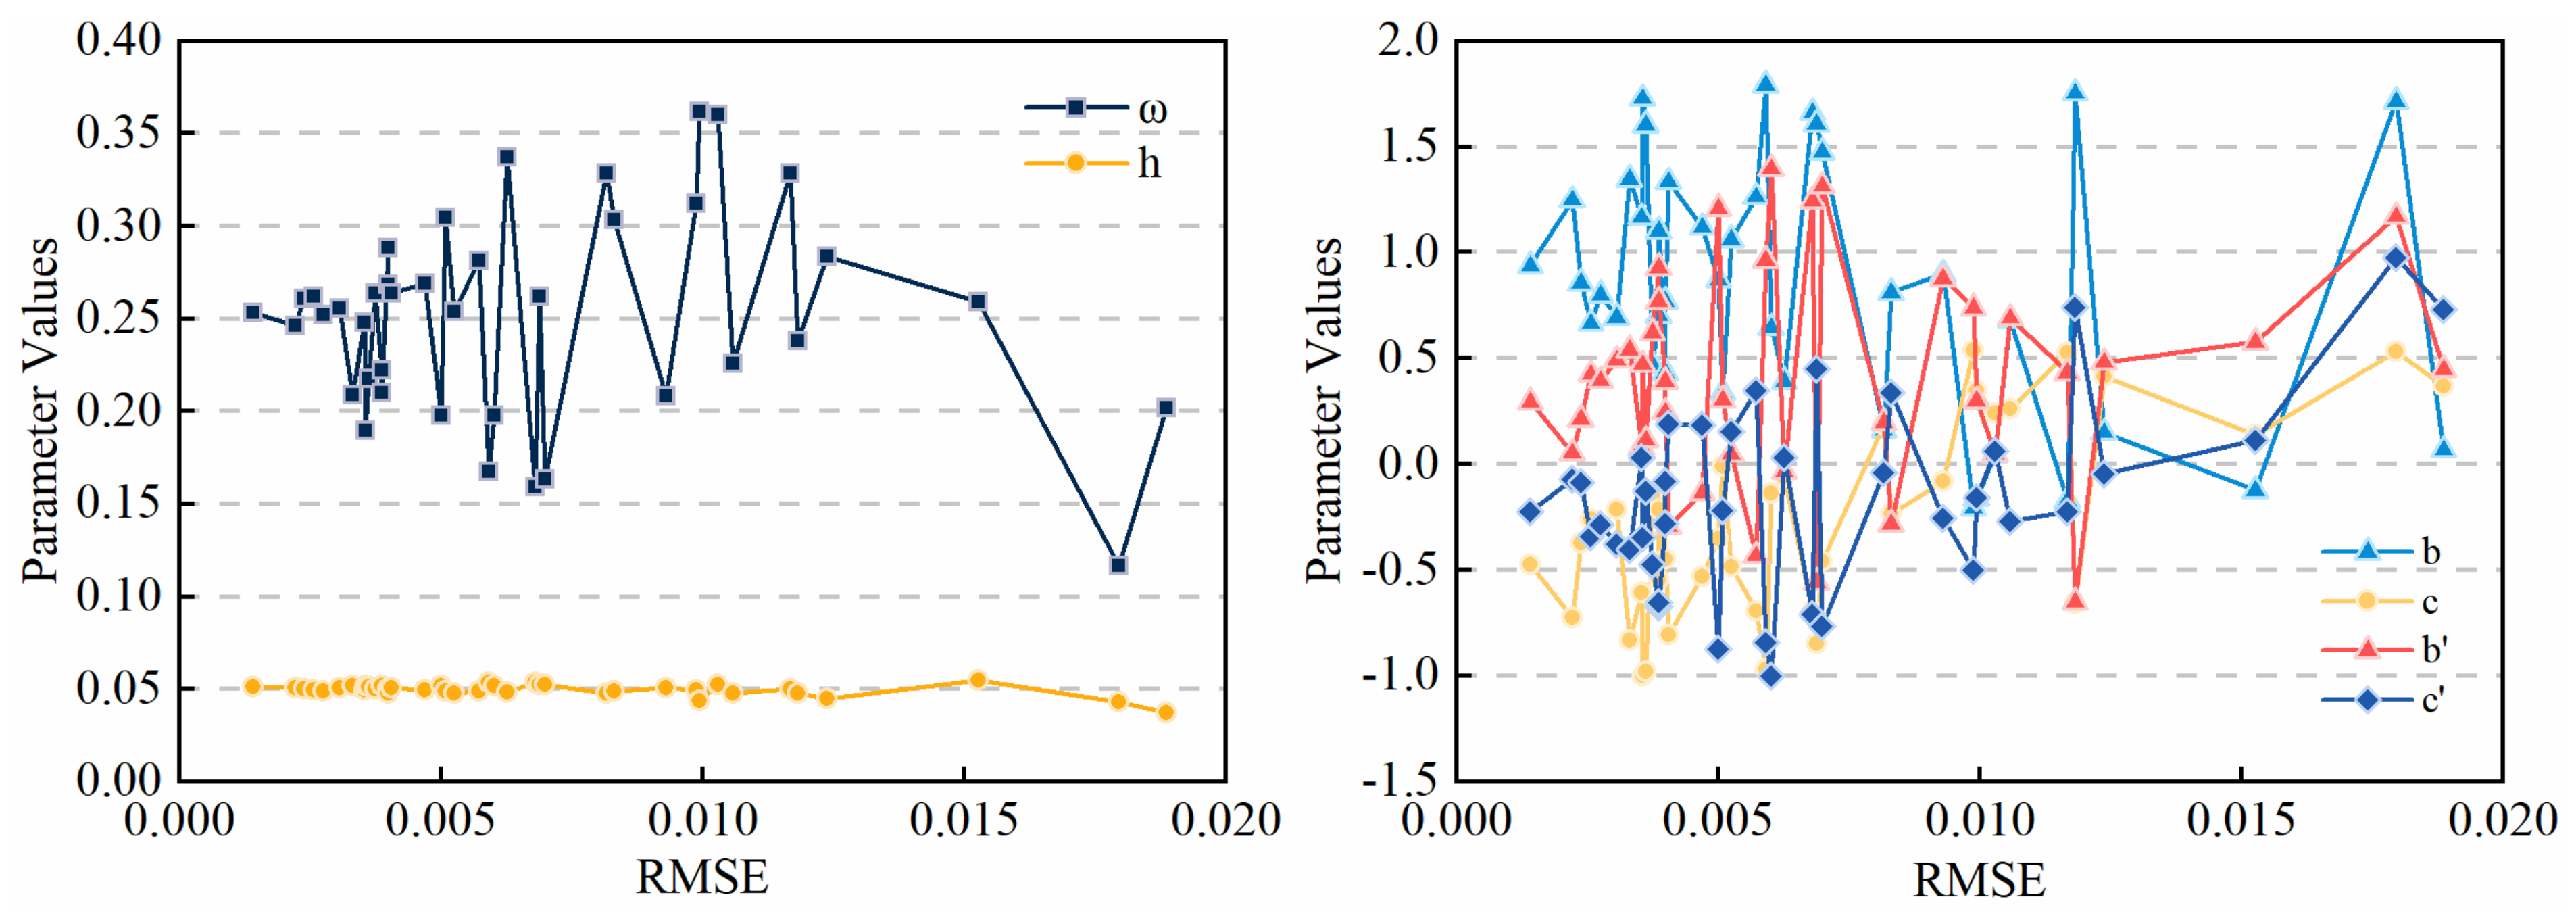
Similar to the multivariate nonlinear model, the forward problem has a unique solution, while the inverse problem does not [47]. In this study, by providing a set of parameter values to the SOILSPECT model, a unique soil BRF distribution was calculated. However, there were lots of different parameter combinations for the same BRF of the SOILSPECT model. To evaluate the stability of the model parameters, a set of model parameter values were selected from Yang et al. [45] as the “true” values. These “true” values were 0.25 for , 0.05 for h, 1.0 for b, −0.5 for c, 0.25 for b′, and −0.2 for c′. These parameter values were used to generate a total of 48 bidirectional reflectance values with the same measurement geometries. Random errors of 0~5% from a normal distribution were added to generate the 40 sets of the simulated model data, and the parameter values were calculated using the PSO algorithm. Figure 7 shows the distribution of these parameter values and their RMSE.
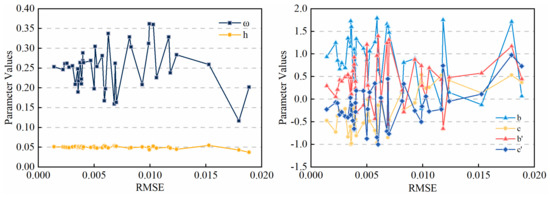
Figure 7.
The parameter retrieval result of the SOILSPECT model and their root of the mean squared difference (RMSE) distribution based on the modeled data.
Figure 7 shows that, except for h, the other five parameters had a relatively large fluctuation, but they were all within the 95% confidence interval of the normal distribution. Thus, we believe that when the RMSE is less than 0.02, the retrieval results of the SOILSPECT model meet the accuracy requirements [45,47]. In this study, the stability analysis of the parameters was estimated from the standard deviations. The smaller the standard deviation, the higher the stability and the smaller the sensitivity. Table 4 shows the results of the stability analysis for the parameters. The stability results followed the order: h > ω > b > b′ > c > c′, and indicated that the soil surface roughness, h, was the most stable among the six parameters. Therefore, the roughness parameter h was taken as a constant into the SOILSPECT model to solve the other parameters in Yao et al. [57].

Table 4.
The results of the sensitivity analysis for the parameters of the SOILSPECT model.
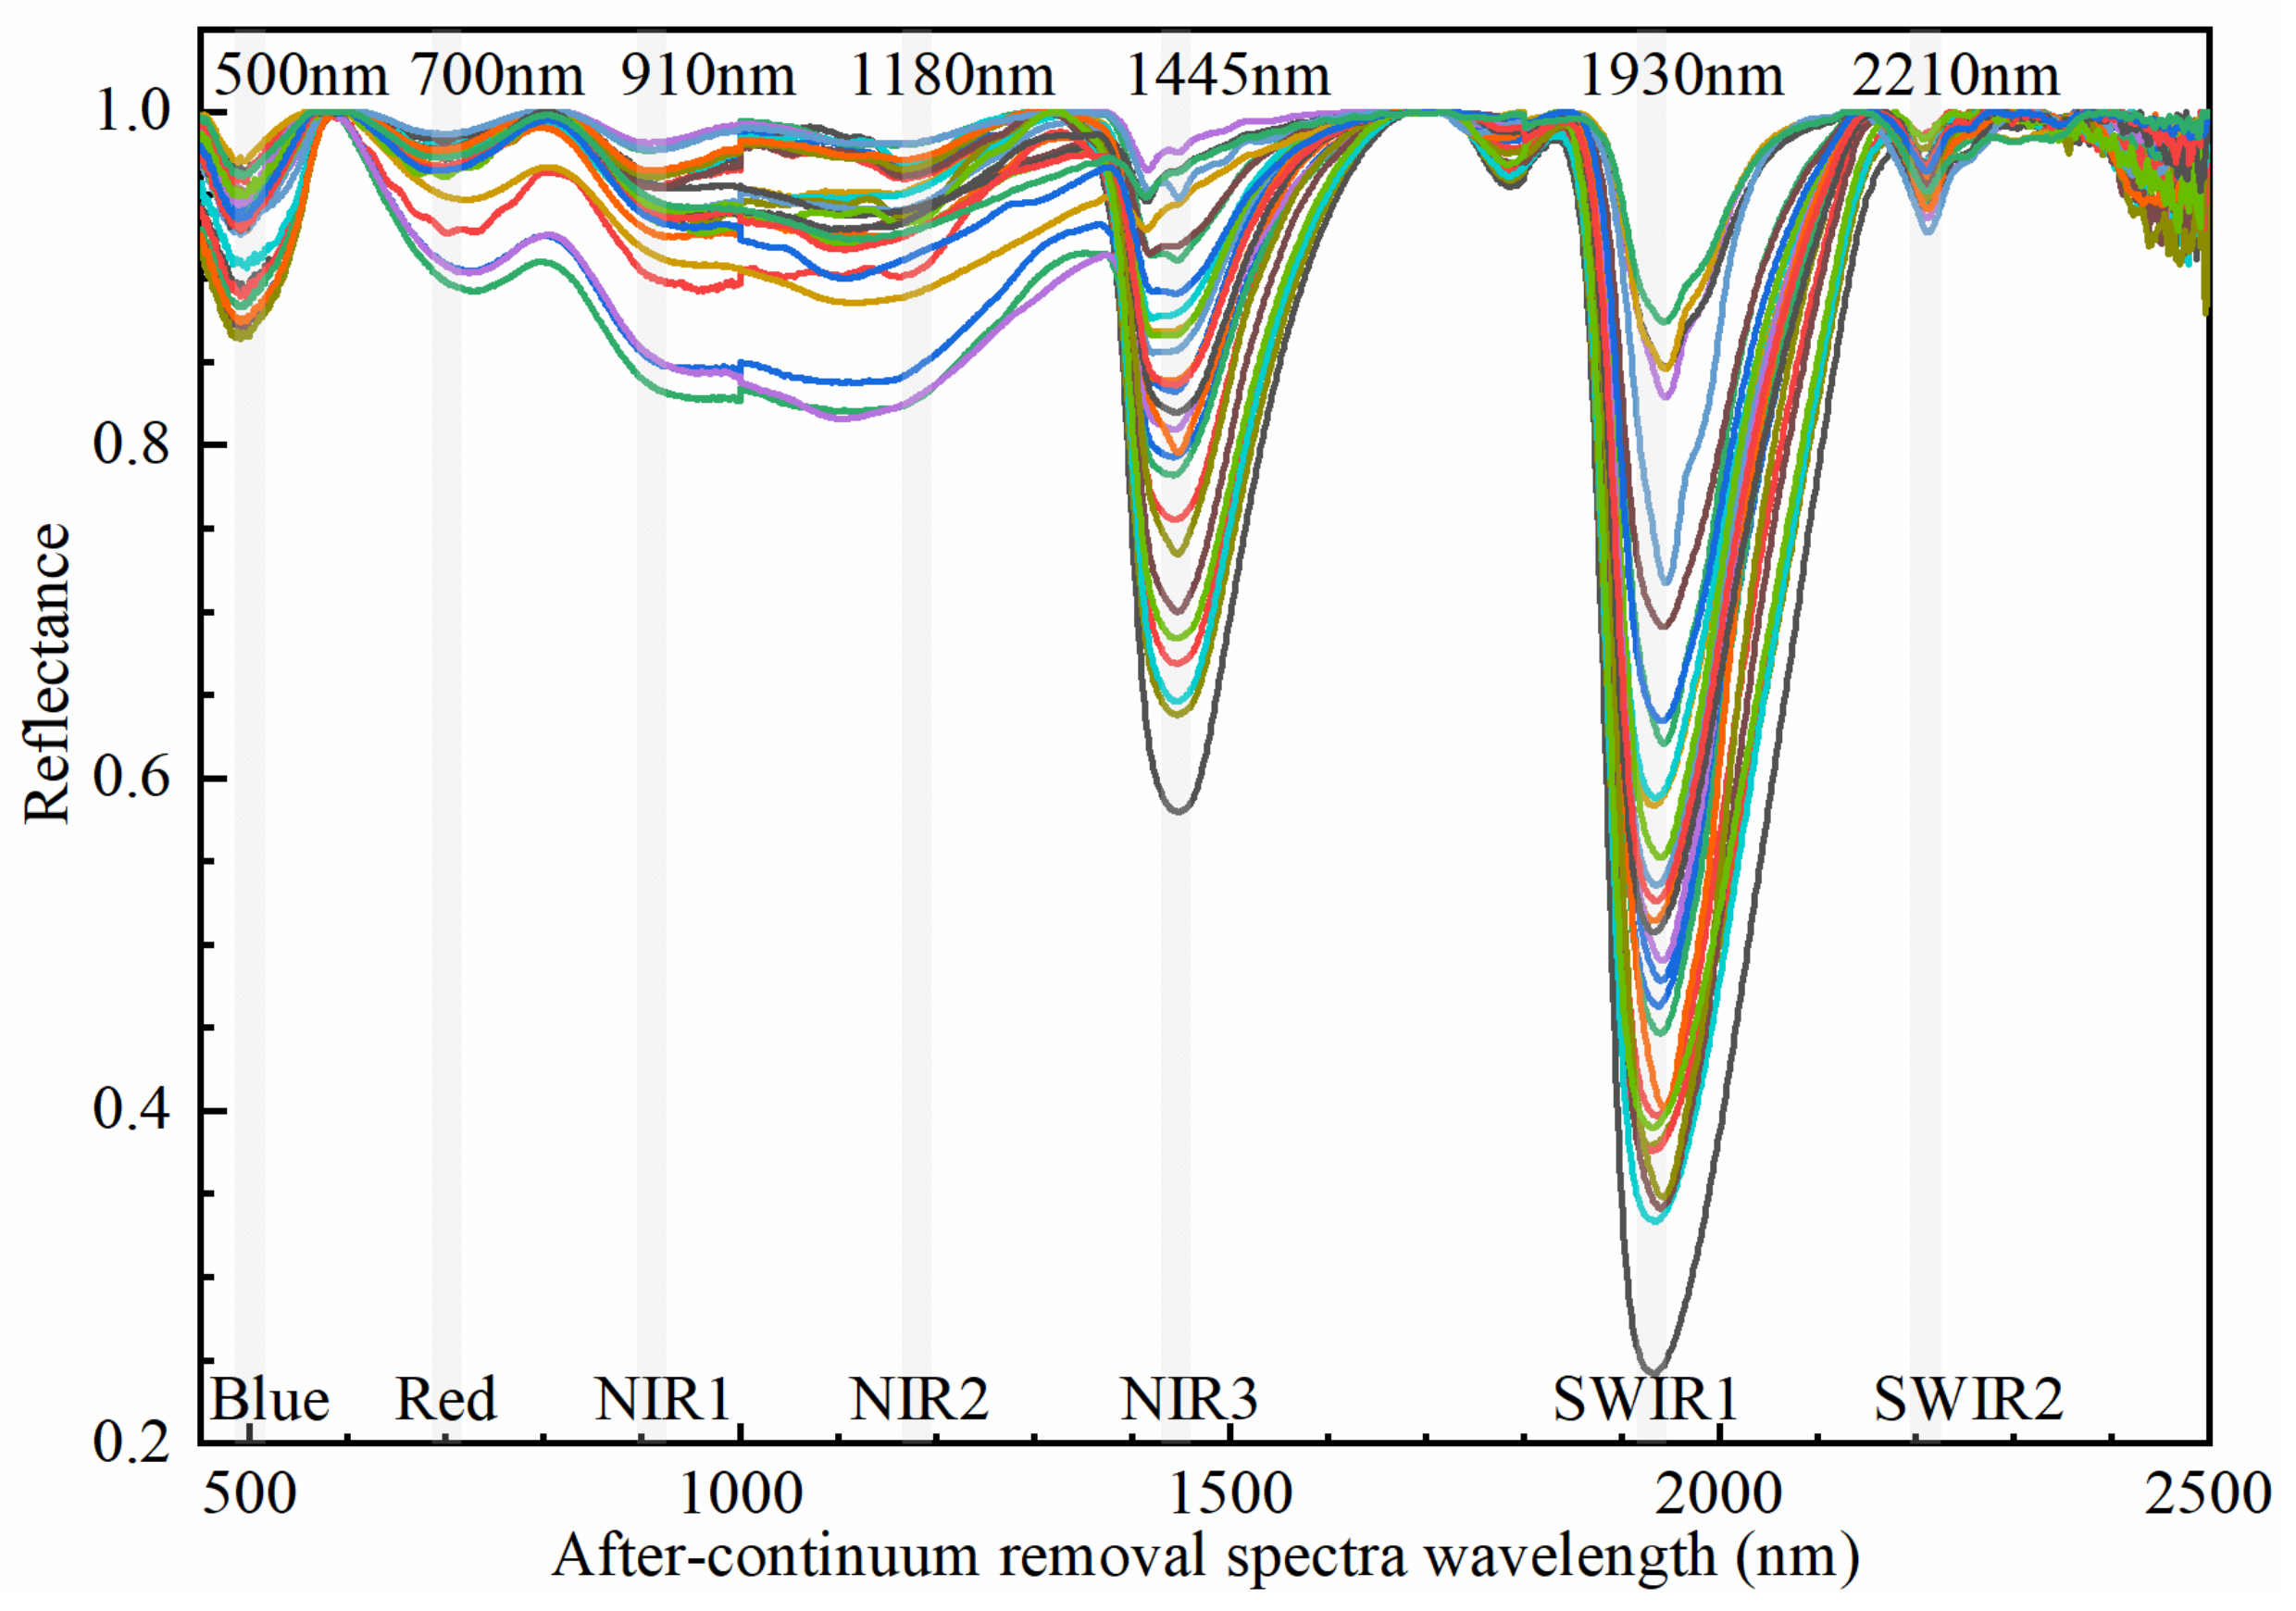
All the parameters of the SOILSPECT model of the soil samples were retrieved by the PSO algorithm. Seven characteristic bands (500 nm, 700 nm, 910 nm, 1180 nm, 1445 nm, 1930 nm, 2210 nm) were employed in the calculation. Continuum removal was introduced to determine the characteristic bands since this method can suppress the background information and highlight the absorption characteristics of the target (Figure 8). Continuum removal, the linear connection between the peaks in the spectral reflectance, is a commonly used method in hyperspectral data processing [58].
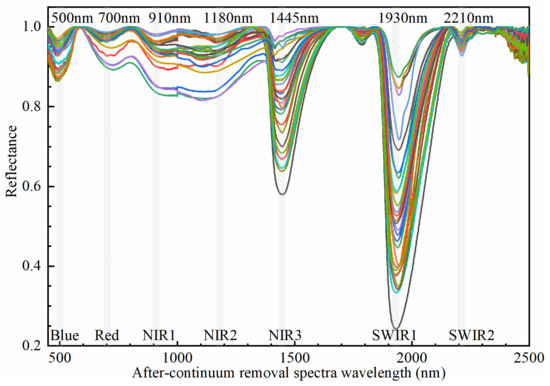
Figure 8.
The continuous removal spectra of soil samples. The light gray bars represent the characteristic bands.
As mentioned in Section 3.3, among the six parameters of the SOILSPECT model, only the single scattering albedo ω changed with the change in wavelength, while the roughness parameter h and the coefficients of the phase function b, c, b′, c′ had no dependence on wavelength. Table 5 shows the retrieval results of ω from each characteristic band under different SMCs of different soil samples. For each soil sample, the single scattering albedo was different under the different SMC, and as the SMC decreased, ω showed an increasing trend in almost all the characteristic bands. This is why dry soils are usually brighter than wet soils. According to Jacquemoud et al. [37], soil samples present the quasi-homothetic variations under the different SMC, and these variations show the same phenomenon with water absorption from the visible to the SWIR. In this study, the characteristic bands also showed the same results. For dry soil samples with different particle sizes, larger particle sizes corresponded to rougher surfaces and smaller ω values.

Table 5.
Optimized parameter results of single scattering albedo ω of the SOILSPECT model from the six soil samples in the characteristic bands.
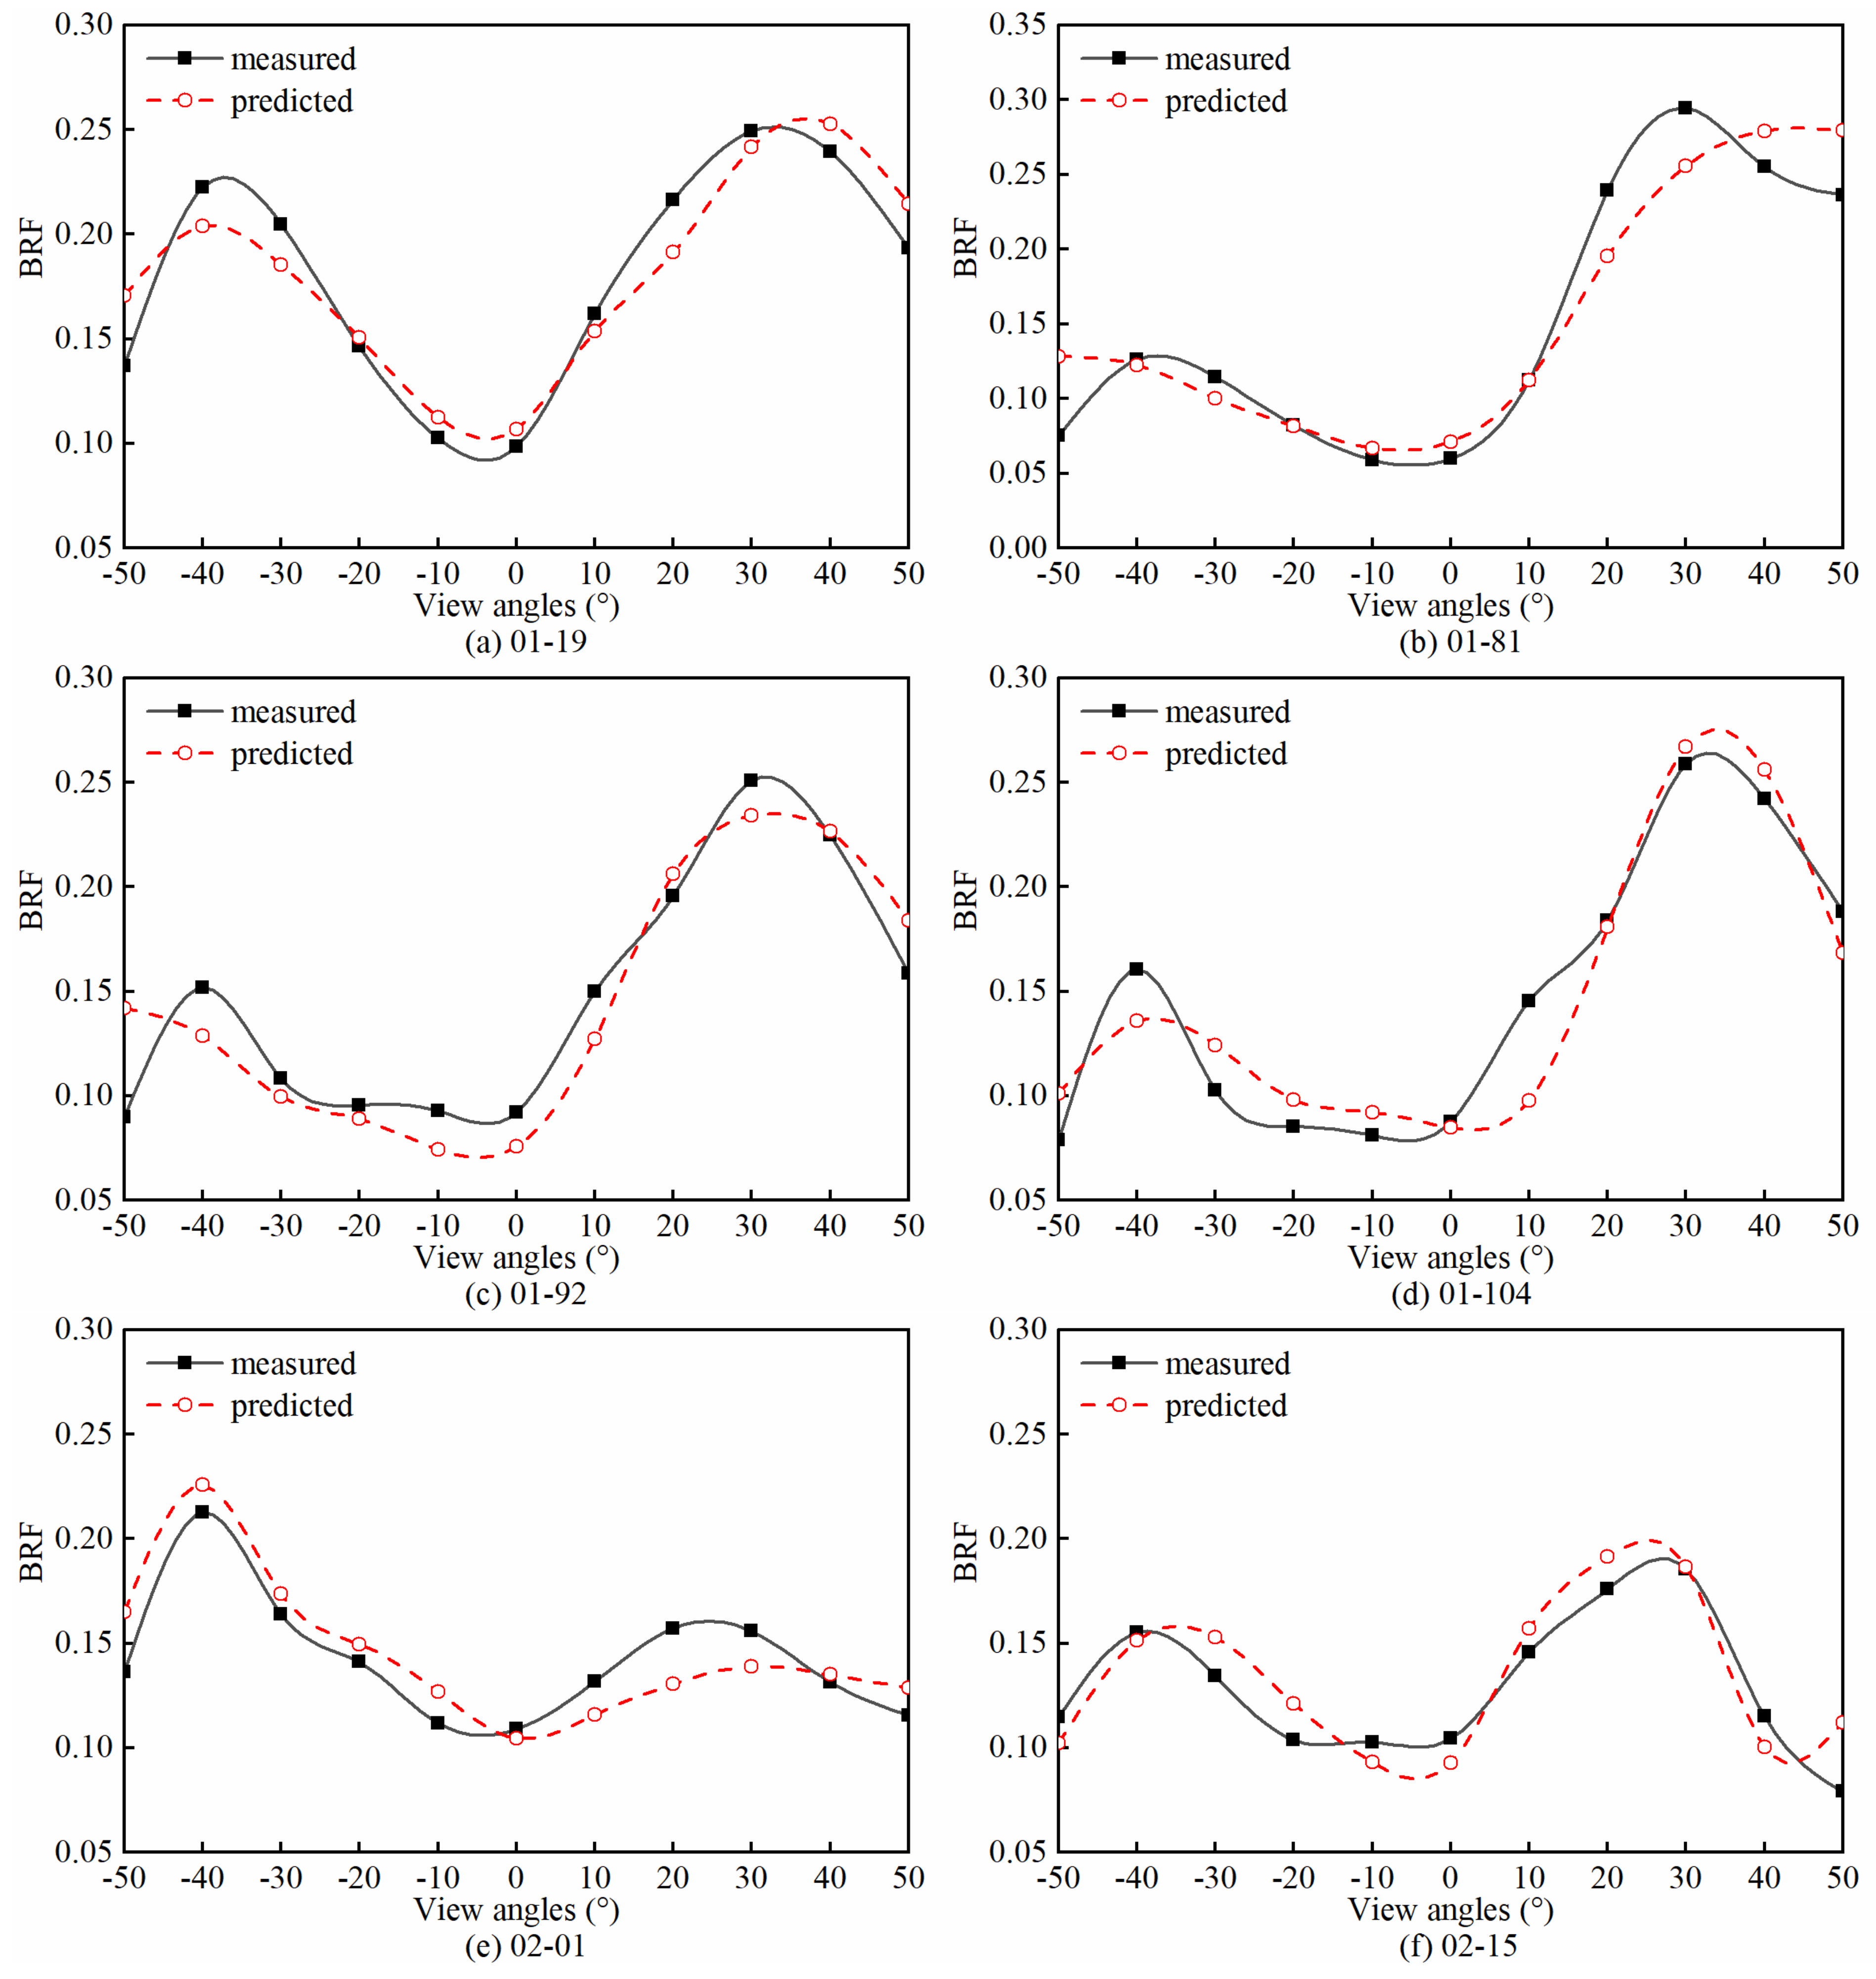
Table 6 lists the average values of the parameters of the SOILSPECT model that were inverted from indoor measurements of six soil samples under different moisture contents. Table 6 indicates that the roughness parameter h is related to the SMC and particle size of Table 3. As the particle size increased, the average value of the roughness parameter, h, also increased (Dry soil). In addition, as the moist soil of each soil sample dried out gradually, the h also changed and showed a trend of gradual increase. The four parameters of the phase function, b, c, b′, and c′, had an impact on the backward and forward scattering of the soil surface. When b and c were greater than b′ and c′, the soil surface showed backscattering. When b and c were less than b′ and c′, the soil surface showed forward scattering. When these values were close, the soil surface showed mixed scattering, which indicates a combination of forward and backward scattering. This characteristic can also be represented by the asymmetry factor Θ proposed by Pinty et al. [50]. Negative values of Θ indicate backscattering, and positive values of Θ indicate that the forward scattering is dominant. According to the values of Θ, we can make a preliminary judgment regarding the surface scattering type of different soil samples with different SMC. According to the changes in the parameter results in dry soil samples shown in Table 6, the rougher soil surfaces were dominated by backscattering, and the smoother surfaces were dominated by forward scattering. In wet soil samples, the surface scattering type changed as the soil gradually dried. Other than the two soil samples of 01-19 and 02-01, which maintained a forward scattering, the surface scattering conditions of the soil samples showed a transition from forward scattering to backscattering. Figure 9 shows an example of measured and predicted bidirectional reflectance for the six soil samples with SMC1 in the red band. The RMSEs of the six soil samples were 0.0195, 0.0207, 0.0226, 0.0206, 0.0183, and 0.0161, respectively.

Table 6.
Optimized parameter values of SOILSPECT model retrieved from all of the soil samples.
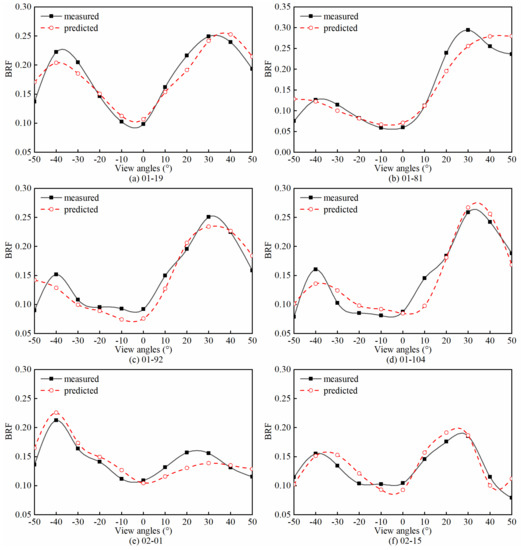
Figure 9.
Comparison between the measured and predicted bidirectional reflectance for all the soil samples with SMC1 in the red band (700 nm).
4.4. Retrieval Results and Validation of SMC
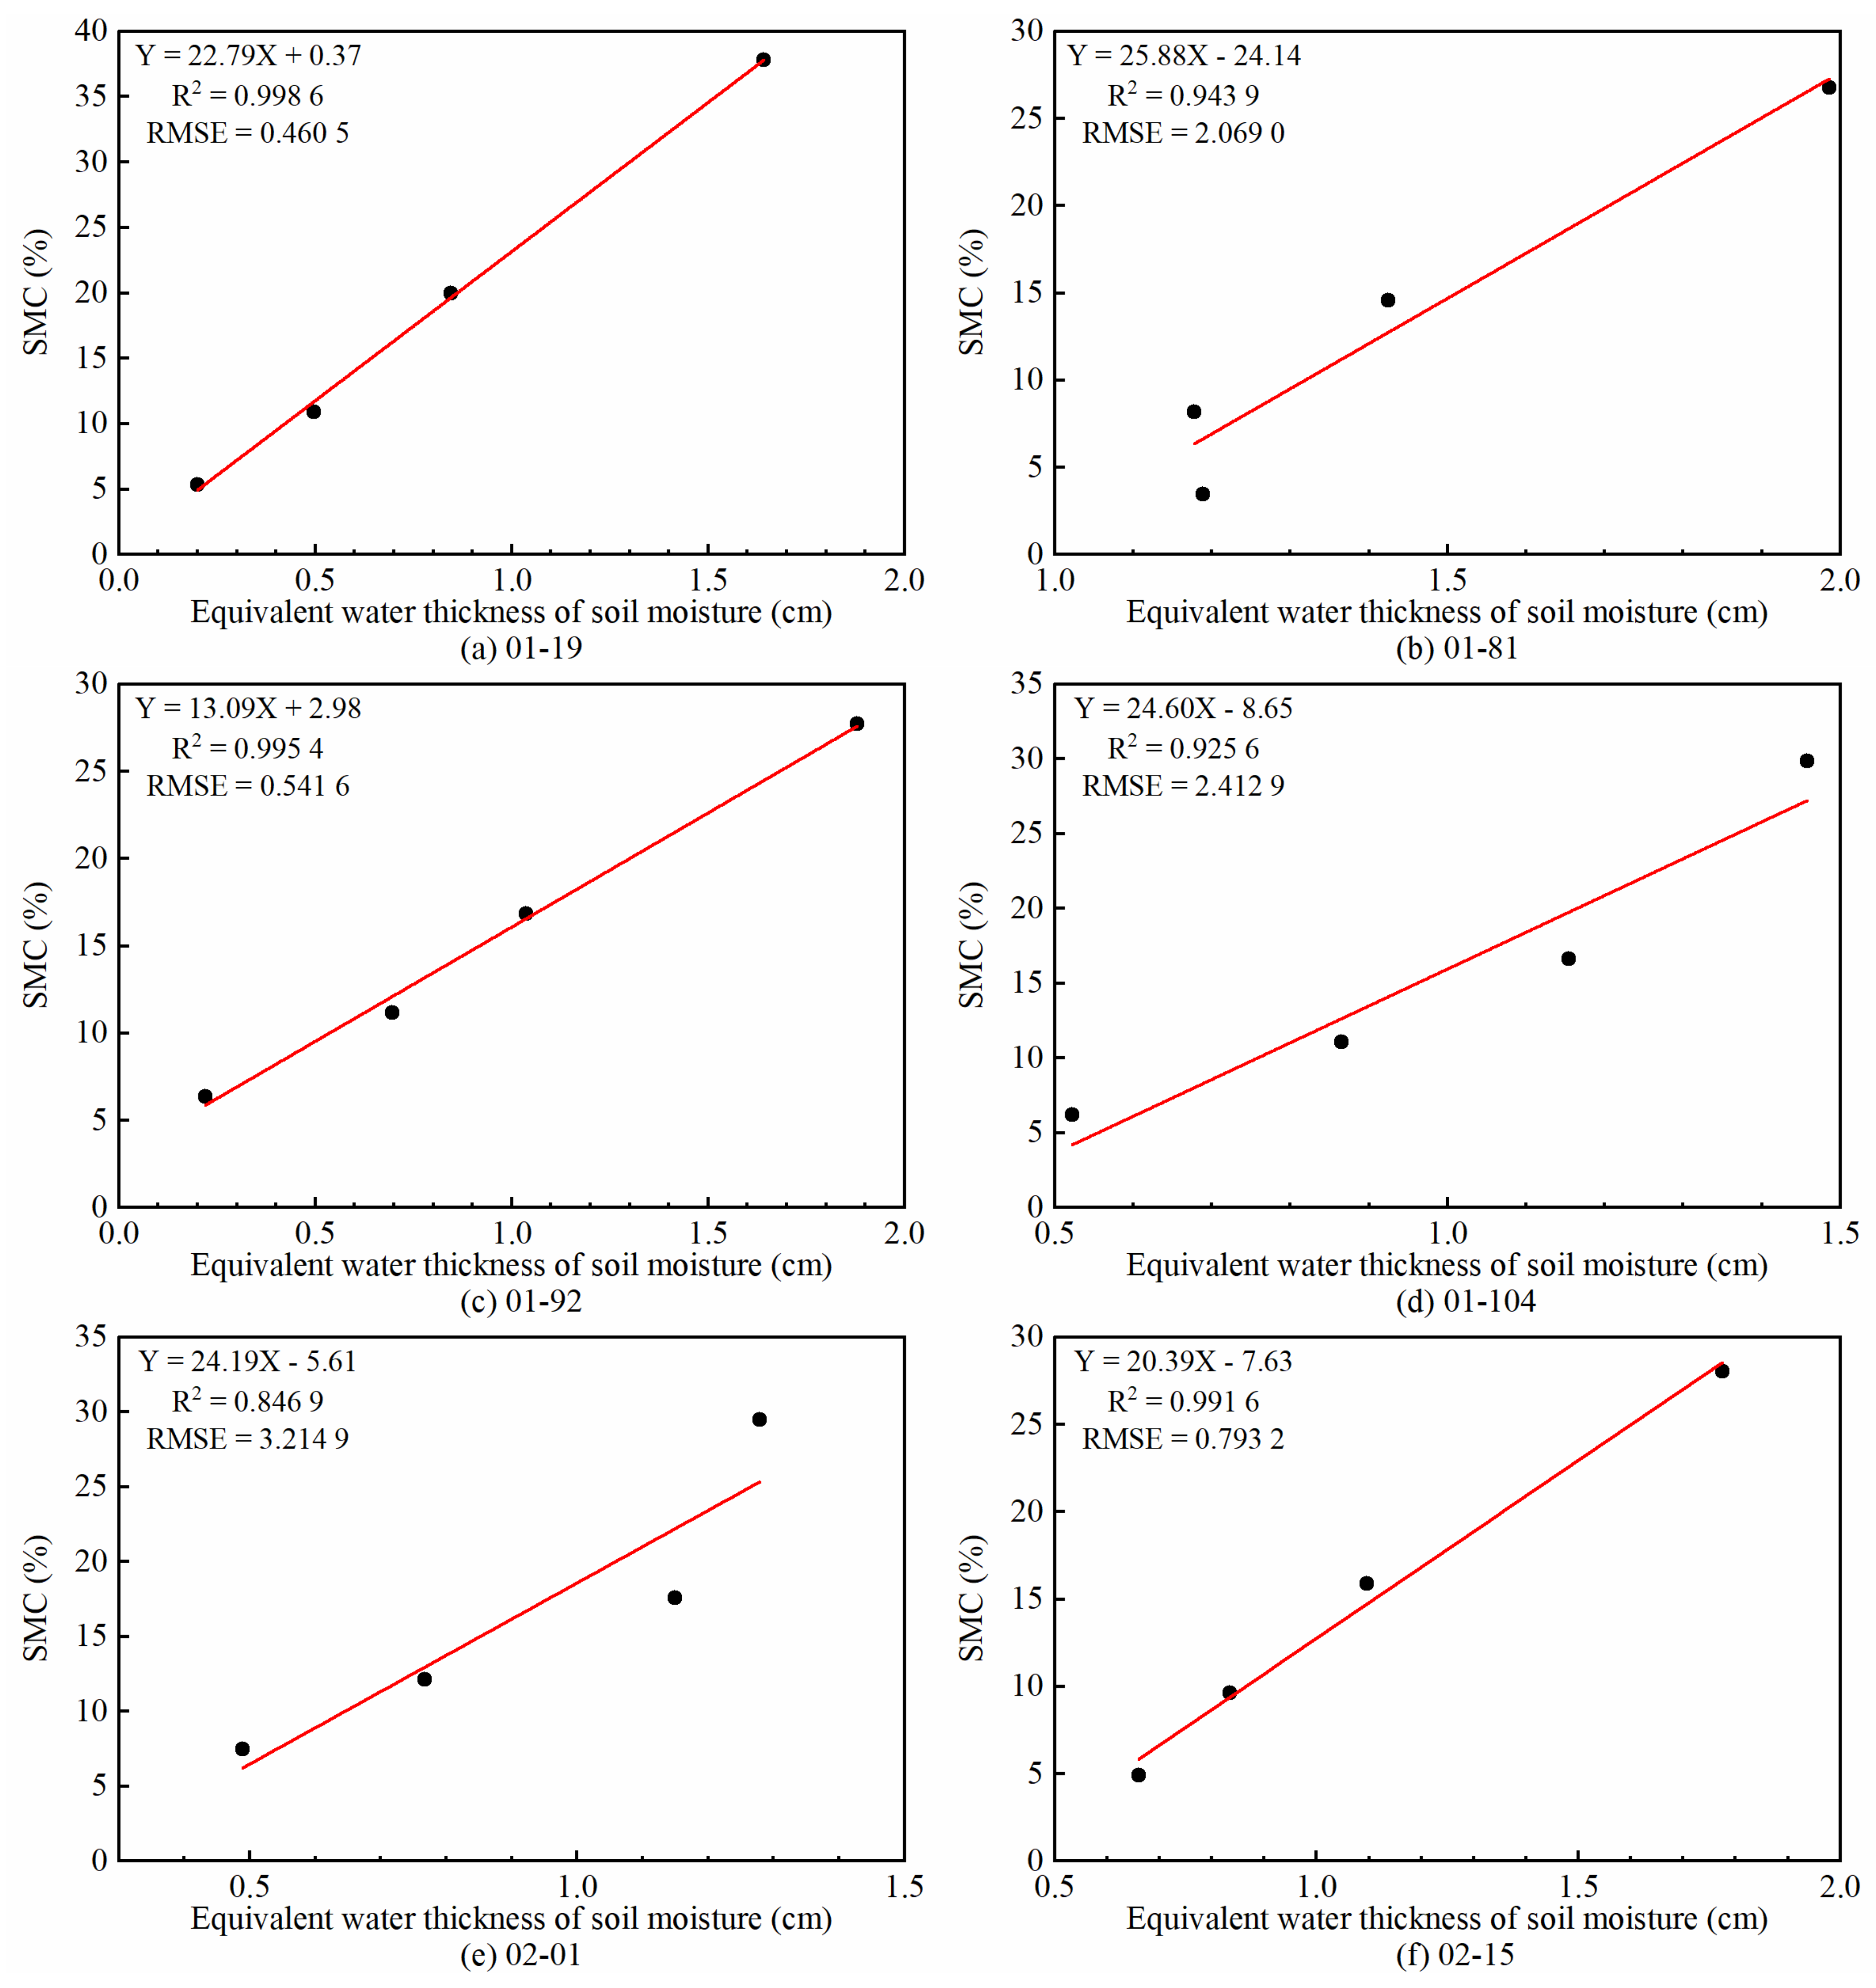
Equations (3) and (4) were used to calculate the equivalent water thickness ξ of soil moisture. The relationship between the equivalent water thickness and the in situ SMC was established for each soil sample (Figure 10). A comparison of the differences of estimation accuracy ξ among all the soil samples demonstrated that there was a significant positive correlation between ξ and SMC. The average determination coefficient R2 of the linear fitting was about 0.95, and the average RMSE was about 1.58. In Equations (3) and (4), the double-hemisphere reflectance was used as a link to connect ξ with the parameters obtained by the SOILSPECT model, and ξ was used to represent the SMC based on the significant positive correlation between ξ and SMC.
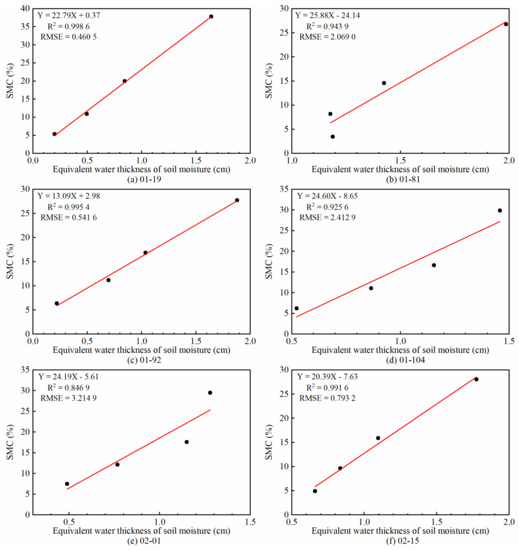
Figure 10.
The correlation analysis between the equivalent water thickness of soil moisture (ξ) and in situ SMC.
5. Discussion
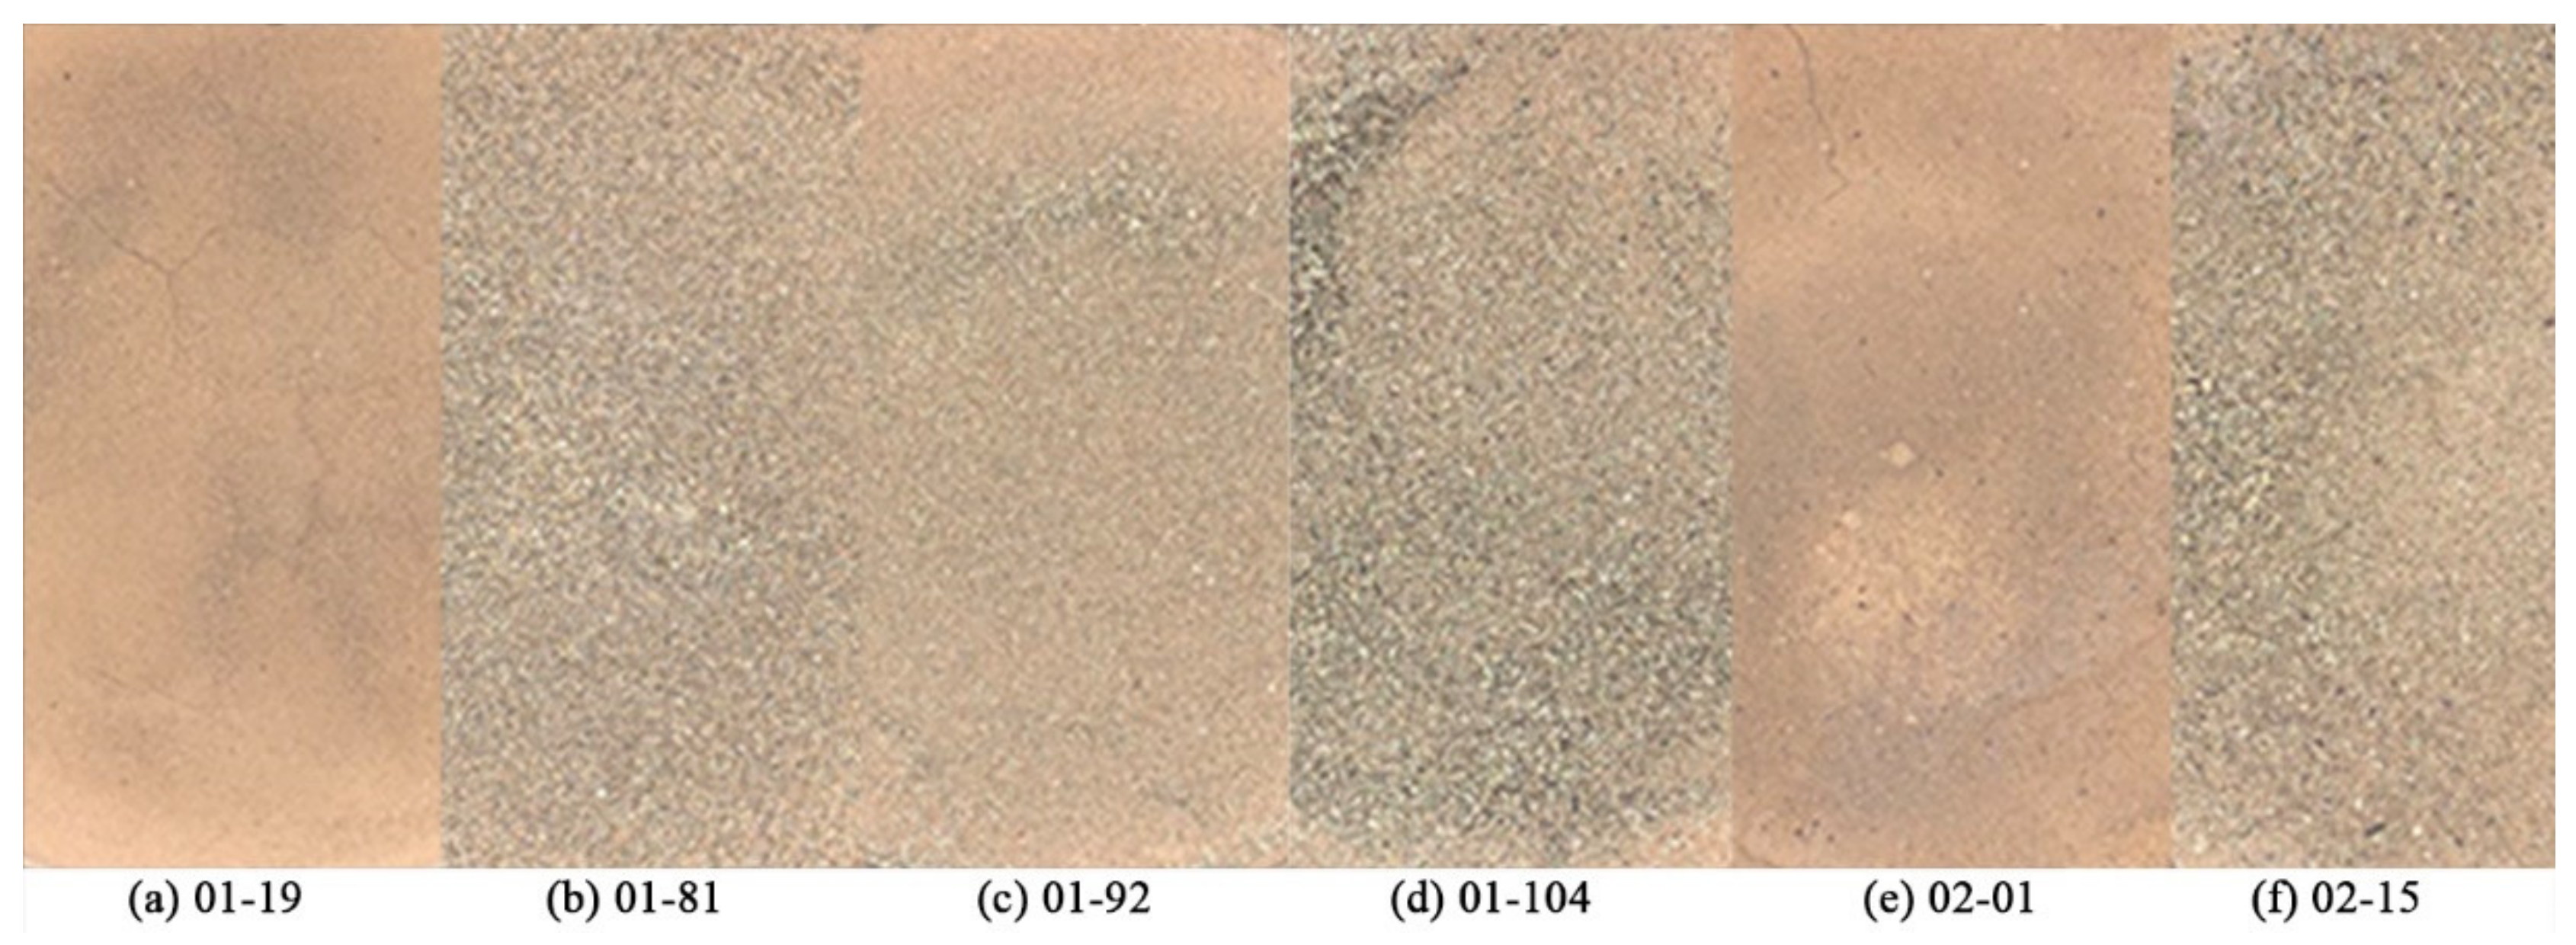
In this study, all the soil samples were dried and sieved with a 0.5 mm mesh to remove larger impurities. However, after adding water to the soil samples, some “shell residues” floated on the soil surface (Figure 11). Stoner and Baumgardner [39] used a laboratory spectroradiometer to measure the spectral bidirectional reflectance factor from a total of 485 moist soil samples over the 520 to 2320 nm wavelength range. Five distinct soil spectral reflectance curve forms were identified. Among them, the organic-dominated form exhibited a characteristic concave shape from 500 to 1300 nm, similar to the curve shape of the soil samples collected in this article. It can also be noted from the comparison in Figure 5 and Figure 11, that the more “shell residues” that lay on the surface of the soil samples, the more obvious the concave shape in the range of 500 to 1300 nm. Although the foreign matter on the soil surface changed the curve shape in the visible and part of the NIR bands, the change trend of the spectrum was uniform, and there was no apparent abnormality in the retrieval of the bidirectional reflectance model. This also seems to indicate that similar situations on the soil surface of a tidal flat may not influence the retrieval results of SMC in future larger studies.
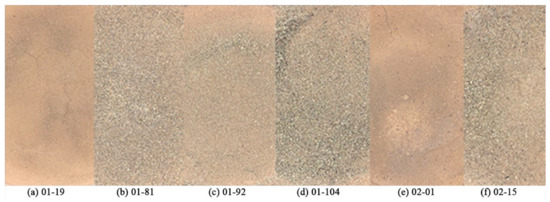
Figure 11.
Laboratory photos for all the soil samples.
As the wet soil samples dried, the roughness parameter h increased gradually, but the h value of dry soil was smaller than that of loose soil. Changes in the soil surface during the drying process, especially in the soil crusts [59,60], reduce the roughness. Thus, the smaller the soil particle size, the tighter the soil particles will be bound together [61]. The spectral information was related to changes in particle size distribution and texture at the surface of the soil. The soil samples in this research were taken from a tidal flat area, which has been affected by water level changes and various dynamic environmental factors for a long time. Thus, there was little loose dry soil. This was why we did not have loose soil samples in our experiment. Although the h value retrieved from the same soil sample with different moisture content increased with the decrease in moisture content roughly, it did not satisfy this rule completely. When the empirical model of SMC of the tidal flat was built, the state of the soil surface could not be ignored, especially since large errors may occur when the soil particles are similar in size.
Rough surfaces have more backscattering than smooth surfaces. Therefore, the empirical model of the normalized difference between backscattering and forward scattering was adopted to invert the soil surface roughness [62,63]. In this article, however, the results of the asymmetry factor were unexpected. Among the dry soil samples, the scattering-type of the soil surface fit the general law, that is, the soil sample 01-81 with the largest particle size exhibited backscattering, and the soil sample 01-19 with the smallest particle size exhibited forward scattering. However, the results changed when the soil sample was soaked with water. The asymmetry factor varied between negative and positive, which indicated that the scattering-type of the different SMC was not stable for one soil sample. The apparently irregular asymmetry factors for these soil samples may be due to the fact that water filled the interstices of the soil particles, which not only darkened the soil reflectance but also modified the angular pattern of the reflected radiation [64,65]. Simple descriptive models of the reflectance from dry soil and wet soil were illustrated by Tian and Philpot [65] (see Figure 9 in [65]). The incident first radiation interacts with the water film when the light source illuminates the wet soil surface (see Figure 9b in [65]). Multiple internal reflections within the water layer at the soil surface provided a mechanism for the redistribution of light [54,66]. The mechanism that causes this change requires further research, especially in tidal flats where the water content changes extremely frequently.
In existing studies on the retrieval of soil surface characteristics using the bidirectional reflectance model, almost all the research has been carried out in farmland, forests, and other areas that have relatively slow-changing moisture content and relatively stable properties. There are very few published studies on the retrieved photometric properties of tidal flats. We set up a series of experiments to retrieve the SMC of the tidal flat along the coast of Jiangsu. There was a highly significant correlation between the SMC and the equivalent water thickness parameter, which indicates that this method can be adopted to obtain the soil moisture of the tidal flat. However, due to the particularity and complexity of this study area, some results (such as surface scattering and roughness parameters, etc.) did not show the regularity we expected. Nevertheless, our research is still meaningful. A significant contribution is using the soil particle size measured in the laboratory as one of the parameters for the inversion of SMC, which should be used especially cautiously in tidal flats.
6. Conclusions
In this study, we investigated the soil surface photometric properties of a tidal flat using multi-angle reflectance data. The SOILSPECT model, the relationship between double-hemisphere reflectance and single scattering albedo ω and the Beer–Lambert law were employed to calculate the SMC of the tidal flat. Field data were obtained from six bare soil sampling sites of the tidal flat, and a total of five moisture gradients were set up for each soil sample. We then obtained 30 sets of spectral data by measuring the multi-angle reflectance spectra and the corresponding soil moisture data in the laboratory. The main conclusions are as follows:
- The stability of each parameter was evaluated by selecting a set of model parameter results from existing studies. The stability results followed the order: h > ω > b > b′ > c > c′, and showed that the soil surface roughness, h, is the most stable among the six parameters.
- Model parameters retrieval was achieved by combining the particle swarm optimization algorithm for seven characteristic bands, which were identified by the continuum removal method. The parameters retrieval procedure was not sensitive to the initial values. Among all the parameters, the single scattering albedo ω had a strong correlation with soil moisture and showed an increasing trend as the soil moisture decreased for each soil sample. The larger the particle size in the dry soil samples was, the smaller the ω was. However, the change in ω with particle size did not demonstrate a general trend for soil samples with different water content. This phenomenon has important implications for using the soil particle size measured in the laboratory as one of the parameters for water content estimation. In this procedure, the soil surface state should be fully considered, especially in tidal flats. In the dry soil samples, the roughness parameter, h, showed an increasing trend as the particle size increased. The four parameters of the phase function, b, c, b′, and c′, had an impact on the scattering of the soil surface. Forward scattering was dominant in the soil surface with the highest moisture, while backscattering was dominant during the gradual drying process.
- A regression analysis of model-estimated soil equivalent water thickness ξ and the measured SMC, demonstrated a significant positive correlation, as the determination coefficient was about 0.95 and the RMSE was 1.58.
Because of the limited soil samples, we set as many water content gradients as possible and measured the multi-angle reflectance indoors. In addition, due to the complexity of this work, the conclusions of this study require more experiments for further verification. Coupled with the SMC simulation in the laboratory, there will be deviations inevitably from the soil surface in the field. Based on the results of laboratory research, in the future, our works will be focused on (i) understanding the bidirectional reflectance characteristics of tidal flats surface, (ii) exploring how surface roughness influence on the bidirectional reflectance at satellite image scale, and (iii) finding a convenient and practical method for retrieving the soil moisture content to provide rapid and large region data support for tidal flats research.
Author Contributions
Conceptualization, C.G., M.X. and W.Z.; Data curation, C.G.; Methodology, C.G.; Resources, M.X.; Software, C.G.; Supervision, W.Z.; Visualization, C.G. and H.X.; Writing – original draft, C.G.; Writing – review & editing, H.X. All authors have read and agreed to the published version of the manuscript.
Funding
This research was funded by the National Key Research and Development Plan, grant number 2017-YFC-1405500 and the Jiangsu Marine Science and Technology Innovation Project, grant number JSZRHYKJ202002.
Data Availability Statement
The data are not publicly available due to research agreements associated with the research permit.
Acknowledgments
The authors appreciate the insightful and constructive comments and suggestions from the anonymous reviewers and the Editor that helped improve the quality of the manuscript. The authors are thankful for the assistance in field data collection from Yifei Zhao, Jicheng Cao, and Yinan Mao. The authors would also like to acknowledge the Nanjing Institute of Geography and Limnology, Chinese Academy of Sciences for providing the spectroradiometer used in the current study.
Conflicts of Interest
The authors declare no conflict of interest.
References
- Murray, N.J.; Phinn, S.R.; DeWitt, M.; Ferrari, R.; Johnston, R.; Lyons, M.B.; Clinton, N.; Thau, D.; Fuller, R.A. The global distribution and trajectory of tidal flats. Nat. Cell Biol. 2019, 565, 222–225. [Google Scholar] [CrossRef] [PubMed]
- Allen, J. Morphodynamics of Holocene salt marshes: A review sketch from the Atlantic and Southern North Sea coasts of Europe. Quat. Sci. Rev. 2000, 19, 1155–1231. [Google Scholar] [CrossRef]
- Zhang, Y.; Xiao, X.; Liu, D.; Wang, E.; Liu, K.; Ding, Y.; Yao, P.; Zhao, M. Spatial and seasonal variations of organic carbon distributions in typical intertidal sediments of China. Org. Geochem. 2020, 142, 103993. [Google Scholar] [CrossRef]
- Phang, V.X.H.; Chou, L.M.; Friess, D.A. Ecosystem carbon stocks across a tropical intertidal habitat mosaic of mangrove forest, seagrass meadow, mudflat and sandbar. Earth Surf. Process. Landf. 2015, 40, 1387–1400. [Google Scholar] [CrossRef]
- Syvitski, J.P.M.; Kettner, A.J.; Overeem, I.; Hutton, E.W.H.; Hannon, M.T.; Brakenridge, G.R.; Day, J.W.; Vorosmarty, C.J.; Saito, Y.; Giosan, L.; et al. Sinking deltas due to human activities. Nat. Geosci. 2009, 2, 681–686. [Google Scholar] [CrossRef]
- Oost, A.; Hoekstra, P.; Wiersma, A.; Flemming, B.; Lammerts, E.; Pejrup, M.; Hofstede, J.; van der Valk, B.; Kiden, P.; Bartholdy, J.; et al. Barrier island management: Lessons from the past and directions for the future. Ocean Coast. Manag. 2012, 68, 18–38. [Google Scholar] [CrossRef]
- Passeri, D.L.; Hagen, S.C.; Medeiros, S.C.; Bilskie, M.V.; Alizad, K.; Wang, D. The dynamic effects of sea level rise on low-gradient coastal landscapes: A review. Earth’s Futur. 2015, 3, 159–181. [Google Scholar] [CrossRef]
- Schmutz, P.P.; Namikas, S.L. Measurement and modeling of the spatiotemporal dynamics of beach surface moisture content. Aeolian Res. 2018, 34, 35–48. [Google Scholar] [CrossRef]
- Nield, J.M.; Wiggs, G.F.; Squirrell, R.S. Aeolian sand strip mobility and protodune development on a drying beach: Examining surface moisture and surface roughness patterns measured by terrestrial laser scanning. Earth Surf. Process. Landf. 2010, 36, 513–522. [Google Scholar] [CrossRef]
- Smit, Y.; Donker, J.J.A.; Ruessink, G. Spatiotemporal Surface Moisture Variations on a Barred Beach and their Relationship with Groundwater Fluctuations. Hydrology 2019, 6, 8. [Google Scholar] [CrossRef]
- Li, H.; Gong, Z.; Dai, W.; Lu, C.; Zhang, X.; Cybele, S.; Guo, H. Feasibility of Elevation Mapping in Muddy Tidal Flats by Remotely Sensed Moisture (RSM) Method. J. Coast. Res. 2018, 85, 291–295. [Google Scholar] [CrossRef]
- Tan, K.; Chen, J.; Zhang, W.; Liu, K.; Tao, P.; Cheng, X. Estimation of soil surface water contents for intertidal mudflats using a near-infrared long-range terrestrial laser scanner. ISPRS J. Photogramm. Remote. Sens. 2020, 159, 129–139. [Google Scholar] [CrossRef]
- Gaskin, G.; Miller, J. Measurement of Soil Water Content Using a Simplified Impedance Measuring Technique. J. Agric. Eng. Res. 1996, 63, 153–159. [Google Scholar] [CrossRef]
- Edwards, B.L.; Namikas, S.L.; D’Sa, E.J. Simple infrared techniques for measuring beach surface moisture. Earth Surf. Process. Landf. 2012, 38, 192–197. [Google Scholar] [CrossRef]
- Anbazhagan, P.; Bittelli, M.; Pallepati, R.R.; Mahajan, P. Comparison of soil water content estimation equations using ground penetrating radar. J. Hydrol. 2020, 588, 125039. [Google Scholar] [CrossRef]
- De Queiroz, M.G.; da Silva, T.G.F.; Zolnier, S.; Jardim, A.M.D.R.F.; de Souza, C.A.A.; Júnior, G.D.N.A.; de Morais, J.E.F.; de Souza, L.S.B. Spatial and temporal dynamics of soil moisture for surfaces with a change in land use in the semi-arid region of Brazil. Catena 2020, 188, 104457. [Google Scholar] [CrossRef]
- Wang, L.; Qu, J.J. Satellite remote sensing applications for surface soil moisture monitoring: A review. Front. Earth Sci. China 2009, 3, 237–247. [Google Scholar] [CrossRef]
- Wang, Y.; Liu, Y.; Jin, S.; Sun, C.; Wei, X. Evolution of the topography of tidal flats and sandbanks along the Jiangsu coast from 1973 to 2016 observed from satellites. ISPRS J. Photogramm. Remote. Sens. 2019, 150, 27–43. [Google Scholar] [CrossRef]
- Su, S.L.; Singh, D.; Baghini, M.S. A critical review of soil moisture measurement. Measurement 2014, 54, 92–105. [Google Scholar] [CrossRef]
- Ryu, J.-H.; Kim, C.-H.; Lee, Y.-K.; Won, J.-S.; Chun, S.-S.; Lee, S. Detecting the intertidal morphologic change using satellite data. Estuar. Coast. Shelf Sci. 2008, 78, 623–632. [Google Scholar] [CrossRef]
- Schmutz, P.P.; Namikas, S.L. Utility of the Delta-T Theta Probe for Obtaining Surface Moisture Measurements from Beaches. J. Coast. Res. 2011, 27, 478. [Google Scholar] [CrossRef]
- Ambrosone, M.; Matese, A.; Di Gennaro, S.F.; Gioli, B.; Tudoroiu, M.; Genesio, L.; Miglietta, F.; Baronti, S.; Maienza, A.; Ungaro, F.; et al. Retrieving soil moisture in rainfed and irrigated fields using Sentinel-2 observations and a modified OPTRAM approach. Int. J. Appl. Earth Obs. Geoinf. 2020, 89, 102113. [Google Scholar] [CrossRef]
- Price, J.C. On the analysis of thermal infrared imagery: The limited utility of apparent thermal inertia. Remote. Sens. Environ. 1985, 18, 59–73. [Google Scholar] [CrossRef]
- Verhoef, A. Remote estimation of thermal inertia and soil heat flux for bare soil. Agric. For. Meteorol. 2004, 123, 221–236. [Google Scholar] [CrossRef]
- Telling, J.; Lyda, A.; Hartzell, P.; Glennie, C. Review of Earth science research using terrestrial laser scanning. Earth Sci. Rev. 2017, 169, 35–68. [Google Scholar] [CrossRef]
- Baghdadi, N.; Boyer, N.; Todoroff, P.; El Hajj, M.; Bégué, A. Potential of SAR sensors TerraSAR-X, ASAR/ENVISAT and PALSAR/ALOS for monitoring sugarcane crops on Reunion Island. Remote. Sens. Environ. 2009, 113, 1724–1738. [Google Scholar] [CrossRef]
- Lakhankar, T.; Krakauer, N.; Khanbilvardi, R. Applications of microwave remote sensing of soil moisture for agricultural applications. Int. J. Terraspace Sci. Eng. 2009, 2, 81–91. [Google Scholar]
- Weidong, L.; Baret, F.; Xingfa, G.; Qingxi, T.; Lanfen, Z.; Bing, Z. Relating soil surface moisture to reflectance. Remote. Sens. Environ. 2002, 81, 238–246. [Google Scholar] [CrossRef]
- Dalal, R.C.; Henry, R.J. Simultaneous Determination of Moisture, Organic Carbon, and Total Nitrogen by Near Infrared Reflectance Spectrophotometry. Soil Sci. Soc. Am. J. 1986, 50, 120–123. [Google Scholar] [CrossRef]
- Vthi, D.N.; Ha, N.T.T.; Dang, Q.T.; Koike, K.; Trong, N.M. Effective Band Ratio of Landsat 8 Images Based on VNIR-SWIR Reflectance Spectra of Topsoils for Soil Moisture Mapping in a Tropical Region. Remote. Sens. 2019, 11, 716. [Google Scholar] [CrossRef]
- Stoner, E.R.; Baumgardner, M.F.; Weismiller, R.A.; Biehl, L.L.; Robinson, B.F. Extension of Laboratory-measured Soil Spectra to Field Conditions. Soil Sci. Soc. Am. J. 1980, 44, 572–574. [Google Scholar] [CrossRef]
- Khanna, S.; Palacios-Orueta, A.; Whiting, M.L.; Ustin, S.L.; Riaño, D.; Litago, J. Development of angle indexes for soil moisture estimation, dry matter detection and land-cover discrimination. Remote. Sens. Environ. 2007, 109, 154–165. [Google Scholar] [CrossRef]
- Gao, Z.; Xu, X.; Wang, J.; Yang, H.; Huang, W.; Feng, H. A method of estimating soil moisture based on the linear decomposition of mixture pixels. Math. Comput. Model. 2013, 58, 606–613. [Google Scholar] [CrossRef]
- Peng, J.; Shen, H.; He, S.W.; Wu, J.S. Soil moisture retrieving using hyperspectral data with the application of wavelet analysis. Environ. Earth Sci. 2013, 69, 279–288. [Google Scholar] [CrossRef]
- Bablet, A.; Vu, P.; Jacquemoud, S.; Viallefont-Robinet, F.; Fabre, S.; Briottet, X.; Sadeghi, M.; Whiting, M.; Baret, F.; Tian, J. MARMIT: A multilayer radiative transfer model of soil reflectance to estimate surface soil moisture content in the solar domain (400–2500 nm). Remote. Sens. Environ. 2018, 217, 1–17. [Google Scholar] [CrossRef]
- Sadeghi, M.; Jones, S.B.; Philpot, W.D. A linear physically-based model for remote sensing of soil moisture using short wave infrared bands. Remote. Sens. Environ. 2015, 164, 66–76. [Google Scholar] [CrossRef]
- Jacquemoud, S.; Baret, F.; Hanocq, J. Modeling spectral and bidirectional soil reflectance. Remote. Sens. Environ. 1992, 41, 123–132. [Google Scholar] [CrossRef]
- Muller, E.; Décamps, H. Modeling soil moisture–reflectance. Remote. Sens. Environ. 2001, 76, 173–180. [Google Scholar] [CrossRef]
- Stoner, E.R.; Baumgardner, M.F. Characteristic Variations in Reflectance of Surface Soils. Soil Sci. Soc. Am. J. 1981, 45, 1161–1165. [Google Scholar] [CrossRef]
- Hapke, B. Bidirectional reflectance spectroscopy: 1. Theory. J. Geophys. Res. Space Phys. 1981, 86, 3039–3054. [Google Scholar] [CrossRef]
- Hapke, B. Bidirectional reflectance spectroscopy: 3. Correction for macroscopic roughness. Icarus 1984, 59, 41–59. [Google Scholar] [CrossRef]
- Hapke, B. Bidirectional Reflectance Spectroscopy: 5. The coherent backscatter opposition effect and aniso-tropic scattering. Icarus 2002, 157, 523–534. [Google Scholar] [CrossRef]
- Hapke, B.; Wells, E. Bidirectional reflectance spectroscopy: 2. Experiments and observations. J. Geophys. Res. Space Phys. 1981, 86, 3055–3060. [Google Scholar] [CrossRef]
- Hapke, B. Bidirectional reflectance spectroscopy: 6. Effects of porosity. Icarus 2008, 195, 918–926. [Google Scholar] [CrossRef]
- Yang, G.-J.; Zhao, C.-J.; Huang, W.-J.; Wang, J.-H. Extension of the Hapke bidirectional reflectance model to retrieve soil water content. Hydrol. Earth Syst. Sci. 2011, 15, 2317–2326. [Google Scholar] [CrossRef]
- Chappell, A.; Zobeck, T.M.; Brunner, G. Using bi-directional soil spectral reflectance to model soil surface changes induced by rainfall and wind-tunnel abrasion. Remote. Sens. Environ. 2006, 102, 328–343. [Google Scholar] [CrossRef]
- Wu, Y.; Gong, P.; Liu, Q.; Chappell, A. Retrieving photometric properties of desert surfaces in China using the Hapke model and MISR data. Remote. Sens. Environ. 2009, 113, 213–223. [Google Scholar] [CrossRef]
- Wang, Y. The Mudflat System of China. Can. J. Fish. Aquat. Sci. 1983, 40, s160–s171. [Google Scholar] [CrossRef]
- Hapke, B. Theoretical Photometric Function for the Lunar Surface. Astron. J. 1963, 68, 279. [Google Scholar] [CrossRef]
- Pinty, B.; Verstraete, M.M.; Dickinson, R.E. A physical model for predicting bidirectional reflectances over bare soil. Remote. Sens. Environ. 1989, 27, 273–288. [Google Scholar] [CrossRef]
- Bach, H.; Mauser, W. Modelling and model verification of the spectral reflectance of soils under varying moisture conditions. In Proceedings of the IGARSS ’94—1994 IEEE International Geoscience and Remote Sensing Symposium, Pasadena, CA, USA, 8–2 August 1994; Volume 4, pp. 2354–2356. [Google Scholar]
- Segelstein, D. The Complex Refractive Index of Water; University of Missouri-Kansas City: Kansas City, MO, USA, 1981. [Google Scholar]
- Poli, R.; Kennedy, J.; Blackwell, T. Particle swarm optimization. Swarm Intell. 2007, 1, 33–57. [Google Scholar] [CrossRef]
- Ångström, A. The Albedo of Various Surfaces of Ground. Geogr. Ann. 1925, 7, 323–342. [Google Scholar] [CrossRef]
- Planet, W.G. Some comments on reflectance measurements of wet soils. Remote. Sens. Environ. 1970, 1, 127–129. [Google Scholar] [CrossRef]
- Cheng, J.L.; Shi, Z.; Li, H.Y. Measurement and simulation of bi-directional reflectance on three zonal soils in the south-east of China. N. Z. J. Agric. Res. 2007, 50, 1177–1185. [Google Scholar] [CrossRef]
- Yao, Y.M.; Liu, Y.; Gao, M.F.; Chen, Z.X. Hyperspectral inversion of soil moisture content based on SOIL-SPECT model. In Proceedings of the 7th International Conference on Agro-Geoinformatics (Agro-Geoinformatics), Hangzhou, China, 6–9 August 2018; pp. 450–455. [Google Scholar]
- Clark, R.N.; Roush, T.L. Reflectance spectroscopy: Quantitative analysis techniques for remote sensing applications. J. Geophys. Res. 1984, 89, 6329–6340. [Google Scholar] [CrossRef]
- Goldshleger, N.; Ben-Dor, E.; Benyamini, Y.; Agassi, M.; Blumberg, D.G. Characterization of soil’s structural crust by spectral reflectance in the SWIR region (1.2–2.5 mum). Terra Nova 2001, 13, 12–17. [Google Scholar] [CrossRef]
- Cipra, J.E.; Baumgardner, M.F.; Stoner, E.R.; Macdonald, R.B. Measuring Radiance Characteristics of Soil with a Field Spectroradiometer. Soil Sci. Soc. Am. J. 1971, 35, 1014–1017. [Google Scholar] [CrossRef]
- Eshel, G.; Levy, G.J.; Singer, M.J. Spectral Reflectance Properties of Crusted Soils under Solar Illumination. Soil Sci. Soc. Am. J. 2004, 68, 1982–1991. [Google Scholar] [CrossRef]
- Chen, J.; Menges, C.; Leblanc, S. Global mapping of foliage clumping index using multi-angular satellite data. Remote. Sens. Environ. 2005, 97, 447–457. [Google Scholar] [CrossRef]
- Nolin, A.W.; Payne, M.C. Classification of glacier zones in western Greenland using albedo and surface roughness from the Multi-angle Imaging SpectroRadiometer (MISR). Remote. Sens. Environ. 2007, 107, 264–275. [Google Scholar] [CrossRef]
- Twomey, S.A.; Bohren, C.F.; Mergenthaler, J.L. Reflectance and albedo differences between wet and dry surfaces. Appl. Opt. 1986, 25, 431–437. [Google Scholar] [CrossRef] [PubMed]
- Tian, J.; Philpot, W.D. Soil directional (biconical) reflectance in the principal plane with varied illumination angle under dry and saturated conditions. Opt. Express 2018, 26, 23883–23897. [Google Scholar] [CrossRef] [PubMed]
- Lekner, J.; Dorf, M.C. Why some things are darker when wet. Appl. Opt. 1988, 27, 1278–1280. [Google Scholar] [CrossRef] [PubMed]
Publisher’s Note: MDPI stays neutral with regard to jurisdictional claims in published maps and institutional affiliations. |
© 2021 by the authors. Licensee MDPI, Basel, Switzerland. This article is an open access article distributed under the terms and conditions of the Creative Commons Attribution (CC BY) license (https://creativecommons.org/licenses/by/4.0/).

