Abstract
In satellite-based remote sensing applications, the conversion of the sensor recorded top-of-atmosphere reflectance to radiance, or vice-versa, is carried out using a reference spectral solar irradiance (SSI) dataset. The choice of reference SSI spectrum has consistently changed over the past four decades with the increasing availability of more accurate SSI measurements with greater spectral coverage. Considerable differences (up to 15% at certain wavelengths) exist between the numerous SSI spectra that are currently being used in satellite ground processing systems. The aim of this study is to quantify the absolute differences between the most commonly used SSI datasets and investigate their impact in satellite inter-calibration and environmental retrievals. It was noted that if analogous SNPP and NOAA-20 VIIRS channel reflectances were perfectly inter-calibrated, the derived channel radiances can still differ by up to 3% due to the utilization of differing SSI datasets by the two VIIRS instruments. This paper also highlights a TSIS-1 SIM-based Hybrid Solar Reference Spectrum (HSRS) with an unprecedented absolute accuracy of 0.3% between 460 and 2365 nm, and recommends that the remote sensing community use it as a common reference SSI in satellite retrievals.
1. Introduction
Accurate absolute measurements of the total and spectral irradiance from the Sun, especially between 200–2400 nm, are essential for comprehensive understanding of the Earth’s atmospheric chemistry and climate change [1,2]. In remote sensing applications, the conversion of satellite-measured radiances to reflectance values, or vice-versa, is performed using a reference spectral solar irradiance (SSI) dataset. There exist numerous independent SSI datasets suitable to serve this purpose. With the increasing availability of improved SSI datasets, the choice of a reference SSI spectrum for satellite based remote sensing applications has constantly changed in the past four decades. Early SSI spectra were derived using ground-based or high-altitude aircraft/rocket measurements [3,4,5,6]. The associated uncertainty of these SSI datasets is considerably large, especially at shorter wavelengths, as the measurements were greatly influenced by the atmospheric absorptions. A composite SSI dataset reported by Neckel and Labs [3] in 1984 with a broad spectral coverage ranging from 0.33 µm to 1.25 µm was widely accepted for use for numerous satellite sensors, including Landsat Multispectral Scanner (MSS) [7] and the first two generations of NOAA’s Advanced Very High Resolution Radiometer (AVHRR) sensor series [8]. The spectral coverage of Neckel and Labs SSI was inadequate for the third generation AVHRR instruments that carried a new 1.6 µm channel. For AVHRR instruments onboard NOAA-15 through -17, the source of SSI data has not been documented well. For NOAA-18 onwards, a subset of SSI data compiled by Wehrli [9] is used for computing band-integrated solar constants for all three reflective solar bands (RSB) of AVHRR. The Moderate Resolution Imaging Spectroradiometer (MODIS) instruments on board Terra and Aqua spacecrafts use a composite of three different SSI datasets, namely Thuillier et al. (1998) [10] for wavelengths between 350–800 nm, Neckel and Labs (1984) [3] between 800–1100 nm, and Smith and Gottlieb (1974) [11] between 1100–2500 nm. The reference solar spectrum for MODIS products was determined prior to the launch of Terra MODIS and has remained the same for all Collections of MODIS L1B datasets.
In 2004, the Calibration and Validation (CALVAL) Working Group of the Committee on Earth Observation Satellites (CEOS) recommended use of the SSI dataset of Thuillier et al. [12] as a common reference to all satellite agencies across the globe [13]. The Thuillier 2003 spectrum is currently the most widely used SSI spectrum and is based on the space-based measurements of the solar irradiance obtained from the ATmospheric Laboratory for Applications and Science (ATLAS) and EUropean Retrieval CArrier (EURECA) missions [10,12]. The MEdium Resolution Imaging Spectrometer (MERIS) instrument on board the European Space Agency (ESA)’s Envisat platform [14], Sentinel-2 [15], and the Visible Infrared Imaging Radiometer Suite (VIIRS) on board the NOAA-20 satellite [16] rely on Thuillier 2003 SSI for ground processing of their L1B datasets. Similarly, the Sea-Viewing Wide Field-of-View Sensor (SeaWiFS) used Neckel and Labs in its earlier processed datasets and later switched to the Thuillier spectrum. The VIIRS instrument on board the Suomi-National Polar-orbiting Partnership (SNPP) spacecraft, however, utilizes the Kurucz spectra [17,18] from MODTRAN 4.0 [16,19]. Previous studies [16,20,21,22] have reported noticeable differences between these solar spectra that can potentially lead to incompatible retrievals from these satellite datasets.
Satellite observations must be accurately calibrated in order to ensure reliable quantitative studies in remote sensing. A reliable means of obtaining in-flight radiometric calibration for satellite sensors is the installation of an on-board calibrator, such as internal lamps or a solar diffuser (SD). The MSS and Thematic Mapper instruments onboard Landsat-1 through -5 carried tungsten filament lamps that provided an internal reference radiance for calibrating the sensor-recorded counts in RSB [23]. Because of the radiance-based calibration, the accuracy of the conversion of the calibrated Landsat radiances to TOA reflectance rely on the reference SSI spectrum. In the most recently processed Landsat MSS and TM datasets, the band-integrated solar constants for RSB are provided using the combined Chance and Kurucz exoatmospheric solar irradiance, which is distributed within MODTRAN 5 [24,25]. The SD provides an absolute reference for reflectance-based calibration. The bidirectional reflectance distribution function (BRDF) of the SD is derived from extensive prelaunch characterization. On orbit, the SD is illuminated by the sun and the sensor records the counts corresponding to the received solar irradiance. Because the reflectance of the SD at the given angle of incidence for sunlight is known from the prelaunch BRDF characterization, the sensor radiometric gain can be derived from the SD measurements. It is important to note that a SD-based onboard calibration can only provide calibrated reflectance values from satellite-observed counts. The spectral radiances are later derived via ground processing systems by choosing a reference solar spectrum. SD is the most common source of on-board calibration in modern era satellite instruments, including SeaWiFS, MODIS, VIIRS, Landsat-8 Operational Land Imager, Sentinnel-2, and the new generation geostationary imagers [26]. Radiometric biases between these instruments have been reported in several cross-calibration studies [16,22,27,28,29,30]. The biases in their reflectance products are primarily due to the calibration differences (due to difference in SD characterization) and spectral band differences. However, the radiometric biases in the L1B radiance products are the result of both the calibration differences as well the disparities between the different reference SSI spectra used by these sensors during ground processing. The adaption of a common reference SSI spectrum, therefore, would simplify cross-calibration studies by eliminating the need for estimating separate sets of biases for radiance and reflectance products. In this context, the Landsat-8 OLI instrument has a unique calibration scheme. Prior to launch, the OLI sensor output was radiometrically calibrated in terms of spectral radiance using an integrating sphere source traceable to National Institute of Standards and Technology (NIST) standards of spectral irradiance [31]. On orbit, the stability of the radiance calibration is monitored over time using highly precise onboard calibration lamps. The on-orbit reflectance calibration of OLI, however, is based on the onboard SD that was characterized prior to launch. Therefore, the calibration of the radiance and reflectance datasets of Landsat-8 OLI are independent and not tied to any specific reference solar spectrum [31].
For inter-calibration purposes, it is also feasible to reverse engineer the L1B radiance dataset to get rid of the embedded solar spectrum and incorporate a common reference SSI for improved radiometric consistency between different datasets. This can be done by rederiving the band-integrated solar constants, or ESUN, using the same reference SSI spectrum for all instruments. A successful example of such effort is the uniform radiometric calibration of ~40 years of the AVHRR record, as reported by Doelling et al. [32], whereby both the calibration coefficients and ESUN values were derived to scale the AVHRR measurements from TIROS-N through MetOP-B to a common absolute radiance standard of Aqua-MODIS Collection 6. The ESUN values for all AVHRR instruments were based on the same reference SSI spectrum as used by MODIS. The combined set of the calibration coefficients and ESUN values is believed to ensure a more consistent radiance and reflectance-based retrieval set for the AVHRR record.
This paper presents a detailed quantitative study of how the inter-calibration between two sensors is impacted by a difference in solar spectra used by the two instruments. Eight of the most widely used SSI spectra are considered for this study. These spectra are discussed in detail in the next section. The absolute differences between the selected SSI datasets are investigated between 300–2400 nm wavelengths. Each of these spectra are convolved with the spectral response functions (SRF) of the NOAA-20 VIIRS RSB for quantitative analysis of the resulting differences in their ESUN values. The RSB of NOAA-20 VIIRS are chosen because they encompass broad wavelengths between 400 to 2400 nm and represent a new standard for spectral channels in the next generation sensors. All future JPSS missions and the next-generation GEO imagers will have the spectral channels similar to the VIIRS instrument.
2. Methodology
2.1. Solar Spectra
In this study, eight independent and widely used solar spectra covering wavelengths from ultra-violet to shortwave infrared are intercompared, and their impact on satellite calibration is quantified for multiple spectral channels. These spectra are briefly described below.
2.1.1. MCST Solar Spectrum
As mentioned earlier, the MCST utilizes a composite SSI spectrum for deriving the MODIS L1B radiance products from the calibrated TOA reflectance measurements. This reference spectrum is referred here as the MCST SSI spectrum. The MCST reference spectrum spans 0.2 to 5.5 μm and is composited from three sources. From 0.4 to 0.8 μm, the MCST spectrum is derived from the space-based observations by the SOLar SPECtrum (SOLSPEC) instrument from 24 March 1992 to 2 April 1992 during the first ATmospheric Laboratory for Applications and Science (ATLAS 1) shuttle mission [10]). The uncertainty in the SOLSPEC absolute calibration is 2 to 3% as established by a 3000-K blackbody at Heidelburg Observatory, traceable to the Physikalisch-Technische Bundesanstalt (PTB) in Germany. The SOLSPEC instrument collectively observes from 0.2 to 3.0 μm with three spectrometers for the ultraviolet, visible and infrared domains.
Between 0.8 and 1.1 μm, the MCST spectrum is sourced to a solar irradiance dataset derived from ground-based observations of the absolute intensity at the center of the solar disk measured in the early 1960s and converted to a disk-averaged solar spectral irradiance [3]. The conversion from a measured disk-center solar intensity at 196 spectral pass bands to a solar irradiance spanning 0.33 to 12.5 μm, corrected for Earth molecular “telluric” lines and atmospheric attenuation, is described in a number of papers [3,6,33]. In brief, the process required independent observations of the change in solar intensity across the solar disk, referred to as the center-to-limb variation (CLV), to translate the intensities at disk-center into mean, disk-averaged intensities. Conversion to disk-averaged solar irradiances then followed by multiplying the disk-averaged intensities by the solid angle of the Sun at the mean Sun-Earth distance. For wavelengths below 0.66 μm, the CLV data are McMath Solar Telescope observations at the Kitt Peak National Observatory (KPNO) [3]. For wavelengths above 0.66 μm, the CLV data are from Pierce et al. [34] using the same telescope. The absolute radiometric scale of the intensity measurements was established against a blackbody source at the Heidelburg Observatory. High-resolution, ground-based, Fourier transform spectrometer (FTS) observations of the Sun’s spectrum from KPNO between 0.3 and 1.5 μm were calibrated to the absolute intensities at the 196 passbands using a least squares fit [35]. The final Neckel and Labs solar irradiance spectrum is reported in varying-sized bins: 0.001 μm bins for data between 0.3305 and 0.6295 μm, 0.002 μm bins for data between 0.631 to 0.869 μm, and 0.005 μm bins for data from 0.8725 to 1.2475 μm [3].
Above 1.1 μm, the MCST spectrum is sourced to the Smith and Gotlieb composite spectrum [11] spanning 0.33 to 20,000 μm. Between 1.0 and 2.4 μm, the original solar datasets comprising the composite spectrum are from Pierce [36] and Arvesen et al. [4]. The Pierce observations were disk-center, relative solar intensities that were normalized to mean, disk-averaged, solar intensities at the absolute intensity scale established by Labs and Neckel [33] as described in the preceding paragraph. Conversion to disk-averaged solar irradiances was subsequently determined by multiplying by the solid angle of the Sun at the mean Sun-Earth distance. Arvesen et al. [4] made spectroradiometric measurements over the range 0.3 to 2.500 μm from an aircraft and derived an extraterrestrial solar irradiance spectrum by extrapolating the observations to zero airmass. The absolute scale of the airborne spectroradiometer is accurate to 3% and traceable to a 1000-W Tungsten lamp, which is the 1963 spectral irradiance standard established by the National Bureau of Standards (now known as the National Institute of Standards and Technology).
2.1.2. Kurucz (MODTRAN 4.0)
There are multiple variants of Kurucz spectra disseminated in the MODerate resolution atmospheric TRANsmission (MODTRAN 4.0) [19] software package. In this study, we have considered the “newkur.dat” solar irradiance spectrum named so because it was a “new” modification of the originating Kurucz solar irradiance reference spectrum, which subsequently became known as “oldkur.dat” after the variation was introduced. The newkur.dat spectrum is used by the SNPP-VIIRS ground processing system for deriving the band-integrated solar constants for the SNPP-VIIRS RSB. In newkur.dat, the irradiance baseline of the oldkur.dat spectrum was adjusted between 0.31 and 0.36 μm [37] to improve the agreement to extraterrestrial solar irradiance observations by the Shuttle Solar Backscatter Ultraviolet (SSBUV) instrument [38,39] on the first ATLAS shuttle mission. The newkur.dat modification was undertaken by the MODTRAN team independently of Robert Kurucz.
The originating Kurucz spectrum, oldkur.dat, is a modeled solar spectrum that is representative of minimum solar activity conditions. From the available documentation [18], this dataset is developed from an empirical model of the quiet sun photosphere, supplemented by a different quiet sun model with chromospheric lines [40], and 58 million observed and predicted lines [41,42] spanning 50–50,000 cm−1 (0.2 to 200 μm). The computed spectrum was degraded to 1 cm-1 wavenumber bins for use in MODTRAN.
2.1.3. Thuillier 2003
The Thuillier (2003) solar irradiance reference spectrum spans 0.2 to 2.4 μm [12]. Data from 0.2 to 0.87 μm were measured during the ATLAS 3 shuttle mission by the SOLSPEC instrument over a ten-day period in November of 1994, and data at wavelengths longer than 0.87 μm were measured during the EURECA mission by a SOLSPEC witness unit, named SOlar SPectrometer (SOSP), between August to October, 1992. The SOLSPEC and SOSP instruments each consist of three spectrometers for the ultraviolet, visible, and infrared spectral ranges. The choice to combine ultraviolet and visible observations from SOLSPEC observations on the ATLAS 3 mission with infrared observations from SOSP on the EURECA mission is discussed with respect to differences in SOLSPEC and SOSP instrument performances and improved thermal stability on the EURECA platform that benefited the thermo-electrically cooled detector of the infrared channel [12].
The total uncertainty of this dataset is reported as 1–2% with radiometric calibration ensured by a 3000-K blackbody at Heidelberg Observatory traceable to PTB in Germany. The ultraviolet portion of the spectrum is an average of 55 spectra measured over the time period listed above, the visible portion of the spectrum is an average of 6 spectra, and the infrared portion of the spectrum is an average of 16 spectra. As described in Thuillier et al. [12], the variance of the selected spectra from the mean is typically 1%, growing to 3% near 2500 nm.
2.1.4. SOLAR-ISS, Version 2
Version 2 of the SOLAR-ISS solar irradiance reference spectrum is a composite spectrum that spans 0.165 to 3.0 [43]. The baseline irradiance level of the composite reference spectrum and its original version (v1.1), at approximately 0.6 to 9.5 nm spectral resolution, were derived from the SOLSPEC observations on the SOLAR payload of the International Space Station (ISS) from April 2008 observations for 0.165 to 0.656 [44] and a multi-year average (2010 through 2016) for 0.656 to 3.0 [45] as described in Meftah et al. [46]. Higher-resolution solar line data are superimposed on the SOLSPEC irradiance baseline using the spectral ratio method [43,46]. The spectral resolution of the composite is then 0.1 nm below 1 and 1 nm in the 1–3 wavelength range.
As described in Thuillier et al. [47], the SOLAR payload on the International Space Station provided solar observations from 0.016 to 3.080 with three instruments: the SOLar Auto-Calibrating EUV/UV Spectrophotometers (SOL-ACES), the SOlar Variability Irradiance Monitor (SOVIM), and SOLSPEC. The SOLSPEC instrument on the SOLAR payload is an updated model of the predecessor SOLSPEC instrument that flew on the earlier ATLAS-1, -2, and -3 space shuttle missions (see Section 2.1.3). Like its predecessor, SOLSPEC on SOLAR is also a 3 channel spectrometer and included various improvements based on lessons learned from the earlier ATLAS missions. The improvements included: improved electronics that allowed for an extended range of near-infrared observations beyond 2.4 , improved pointing knowledge that reduced non-uniform instrument responsivity effects, a revised optical design that allowed for higher signal-to-noise levels in the wings of each spectrometer channel, a change of the internal lamp used for wavelength calibration that extended its lifetime, and a change in absolute radiometric calibration traced to the BB3200pg blackbody standard of Physikalisch-Technische Bundesanstalt (PTB). The total uncertainty of SOLSPEC on SOLAR is reported as 2% at 0.2 , 5% at 3.0 , 1% in the visible, decreasing to about 0.5% in the near-infrared [47]. The mean absolute uncertainty from 0.165 to 3.0 is reported as 1.26% [46].
Version 2 of the SOLAR-ISS reference spectrum addressed discontinuities discovered in the originally released v1.1 SOLAR-ISS reference spectrum prescribed to both the underlying SOLSPEC irradiance baseline and the high-resolution solar line data. As discussed in Meftah et al. [43], the corrections included a ~45% adjustment at 0.165–0.180 , possibly due to uncorrected scattered light, by fitting SOLSPEC observations in that range to concurrent observations of the SOLar Stellar Intercomparison Experiment (SOLSTICE) instrument [48] on the SOlar Radiation Climate Experiment (SORCE) mission [49]. A smaller adjustment to the SOLSPEC irradiance baseline, up to ~10%, was also applied at 0.216–0.228 again by fitting to SORCE SOLSTICE. This latter adjustment was discussed in relation to the SOLSPEC absolute calibration, where the introduction of an optical attenuation filter introduced a discontinuity in the absolute calibration at 0.216 relative to that at shorter wavelengths. Finally, in the near-infrared, adjustments were made in the choice of solar line datasets constrained to the SOLSPEC irradiance baseline. In SOLAR-ISS v1.1, the high-resolution solar line data below 2.4 are the same as those used in the ATLAS-3 composite spectrum [50], namely, the atomic line database of Kurucz and Bell [51], while above 2.4 , the synthetic solar lines are from the Solar Radiation Physical Model (SRPM) of Fontenla et al. [52]. In SOLAR-ISS v2, the solar line data above 2.4 was replaced with that of Kurucz and Bell [51] to better match the high-resolution solar observations.
2.1.5. SCIAMACHY, Version 9
Hilbig et al. [53] describe the newest version (v9) of the solar irradiance reference spectrum from the Scanning Imaging Absorption Spectrometer for Atmospheric Chartography (SCIAMACHY) instrument on the Environmental Satellite Platform mission [54,55]. The SCIAMACHY spectral range is 0.24 to 2.4 μm and the spectral resolution varies from 0.25 to 1.25 nm. The spectral range from 0.24 to 1.77 μm is observed contiguously, and there are two additional narrow bands centered near 2.0 and 2.3 μm. The lower limit of the 2σ total reference spectrum uncertainty is 3% over much of the spectrum from 0.3 to 1.6 μm and increases to 5–6% beyond those wavelengths [53]. The v9 SCIAMACHY reference spectrum is specific to 27 February 2003, a change from the time period of an earlier v6 SCIAMACHY reference spectrum of 4 March 2004 [56].
SCIAMACHY’s primary goal is the retrieval of atmospheric trace gas properties determined from the ratio of back-scattered radiance measurements to the downwelling solar irradiance spectrum [57]. SCIAMACHY operated from August 2002 to April 2012 and typically observed the Sun’s irradiance spectrum once per day. Absolute radiometric accuracy is tied to FEL lamps traceable to the National Institute of Standards and Technology (NIST) [53,56]. Hilbig et al. [53] summarize the various documented approaches that have been applied to monitor and correct the degradation of the SCIAMACHY optical path in the post-launch period, increasing in sophistication for v9 to include a model of the thickness and absorbing properties of the growing layer of contaminant hypothesized to cause the degradation as well as natural variability in the solar irradiance [53]. A different correction, one that accounts for instrument changes that occur from the pre-launch to the post-launch environment, is derived from on-orbit measurements with the Tungsten-halogen, 3000 K, white light source (WLS) calibration lamp. As discussed in Hilbig et al. [53], the primary changes to the SCIAMACHY v9 reference spectrum are then attributed to an improved WLS correction that is specific to the time period from launch in August 2002 through the new reference spectrum date of 23 February 2003; the selected reference spectrum date holds importance as it defines the start of the SCIAMACHY “post-launch period”.
The improved WLS correction described in Hilbig et al. [53] accounts for all instrumental effects up to the start of the post-launch period in a single function, including effects from degradation and documented icing on the near-infrared detectors beyond 1.7 μm [58]. It is based upon a multiple-parameter least-squares fit of WLS spectra measured pre-launch and on the reference spectrum date with Planck black body curves at different temperatures. The ratio at wavelengths from approximately 0.4 to 1.5 μm, which are assumed to be unimpacted by optical degradation or icing on the near-infrared detector and are not near channel boundaries, are used in the fit. The fit is then extrapolated to the full SCIAMACHY measurement range and applied as the WLS correction. The total measurement uncertainty of the SCIAMACHY v9 reference spectrum includes the contribution from the uncertainty in the WLS correction fit. The SCIAMACHY SSI measurements exhibit small, but numerous, data gaps, particularly beyond 1.6 µm, which makes the integral operation and absolute comparison with other spectra more challenging and inaccurate at those wavelengths. As such, the SCIAMACHY spectrum beyond 1.6 µm is excluded in this study.
2.1.6. LASP WHI
The Laboratory for Atmospheric and Space Physics (LASP) produced three solar irradiance reference spectra for the coordinated, international, effort called the Whole Heliosphere Interval (WHI) [59]. These reference spectra are composite spectra, developed from simultaneous observations from rocket and satellite platforms that span the X-ray ultraviolet to the near-infrared spectral range. Spectral irradiance observations by the SOLar Stellar Intercomparison Experiment (SOLSTICE) at 0.1 nm spectral resolution [60] and the Spectral Irradiance Monitor (SIM) at varying spectral resolution [61] on the SORCE mission [49] provide the composite solar irradiance between 0.116 to 0.310 μm and 0.310 to 2.4 μm, respectively. The composite between 0.0001 and 0.116 μm is from observations by the Solar EUV Experiment (SEE) instrument on the Thermosphere, Ionosphere, Mesosphere, Energetics, and Dynamics (TIMED) satellite mission [62] and an underflight SEE calibration rocket payload [63,64]. The “quiet sun” LASP WHI reference spectrum derived from an average of data collected over 10–16 April 2008 represents solar minimum conditions between solar cycles 23 and 24.
The LASP WHI composite irradiance uncertainty in the extreme ultraviolet is 9 to 20% [65] with radiometric accuracy traceability to the NIST Synchrotron Ultraviolet Radiation Facility III (SURF-III). SORCE SOLSTICE, a grating spectrometer with an accuracy uncertainty of 2 to 5% that is also traceable to the NIST SURF facility [60], is a newer model of the SOLSTICE instrument that flew on the Upper Atmospheric Research Satellite (UARS). SORCE SIM is a prism spectrometer [61] with 1 to 3% radiometric accuracy uncertainty [63]. The SORCE SIM data at wavelengths longer than 1.35 μm have been adjusted by up to 8% to agree with the ATLAS-3 composite spectrum, in a recalibration that has been discussed with reference to a systematic bias due to incomplete pre-flight calibrations [61,66]. Therefore, the LASP WHI and ATLAS-3 reference spectra are not independent above 1.35 μm. The LASP WHI reference spectra are normalized to the total solar irradiance (TSI) values observed by the SORCE Total Irradiance Monitor (TIM) [67] during the concurrent time periods. As described in Woods et al. [63], the integral of the solar spectral irradiance at wavelengths not measured (i.e., longer than 2.4 μm) is estimated and subtracted from the SORCE TIM measured TSI values prior to the normalization. The normalizations scale the WHI composite irradiance spectra at all wavelengths by approximately 1%, within the accuracy uncertainties of the observations.
2.1.7. TSIS-1 SIM
The Spectral Irradiance Monitor (SIM) on the Total and Spectral Solar Irradiance Sensor (TSIS-1) mission is a prism spectrometer that measures solar spectral irradiance from 0.2 to 2.4 μm spectral range with a variable spectral resolution of approximately 0.25 to 42 nm. TSIS-1 SIM shares the same name as the heritage SORCE SIM instrument but has a number of key updates. Relative to SORCE SIM, the TSIS-1 SIM has improved noise performance, improved stability, and improved absolute accuracy [68,69]. Of primary importance for a reference solar irradiance spectrum are the order-of-magnitude reductions in radiometric accuracy uncertainty achieved relative to SORCE SIM. As described in Richard et al. [70], these advances were achieved through an extensive component level calibration program performed in a first-of-its-kind spectral radiometric calibration facility. This calibration program allowed for characterizing the instrument as an absolute sensor across the spectrum in irradiance units using a NIST cryogenic radiometer traceable to Système International (SI) units and stable tunable laser sources. An instrument-level verification of the irradiance accuracy across the spectrum and final end-to-end absolute calibration placed relative pre-launch accuracy uncertainties at 0.24% (>460 nm) to 0.41% (<460 nm) [70]. Observations made by redundant and independent instrument channels that are exposed to the Sun at varying duty cycles are used to monitor and correct instrument degradation to maintain calibration stability on-orbit. TSIS-1 SIM has measured daily spectral irradiance since March 2018 from the International Space Station. TSIS-1 SIM data are available from https://lasp.colorado.edu/home/tsis/data/ssi-data/ (accessed on 4 April 2021).
2.1.8. TSIS-1 HSRS
The TSIS-1 Hybrid Solar Reference Spectrum (HSRS) is a composite reference spectrum spanning 0.2 to 2.73 μm developed by normalizing independent solar line observations of at least 0.01 nm spectral resolution to the high-accuracy, absolute irradiance scale of the TSIS-1 SIM (see Section 2.1.7) and the Compact SIM (CSIM) observations. CSIM is a CubeSat technology demonstration mission observing solar spectral irradiance from 210 to 2800 nm. CSIM was calibrated in the same facility as the TSIS-1 SIM but by calibration transfer as opposed to absolute calibration verification. The CSIM measurement uncertainty is <1% from 0.3 to 2.0 μm, increasing to 1.26% above 2.0 μm [69]. The TSIS-1 HSRS extends the utility of the high-accuracy SIM observations for research purposes that require higher spectral resolution than that acquired by the SIM instruments. The comprehensive details of the derivation of the TSIS-1 HSRS has been described by Coddington et al. [71].
The baseline irradiance spectrum of the TSIS-1 HSRS between 0.2 and 2.365 μm is an average of TSIS-1 SIM observations from 1–7 December 2019 concatenated with an average of CSIM observations between 2.365 and 2.73 μm over April to October 2019. The time period is representative of solar minimum between solar cycles 24 and 25. A 0.8% offset applied to CSIM data at wavelengths longer than 2.365 μm is within the 1.26% CSIM measurement uncertainty and ensures the CSIM portion of the spectrum matches TSIS-1 SIM at 2.365 μm. Solar observations at higher spectral resolution are normalized to the baseline irradiance spectrum using a modified spectral ratio method (Coddington et al. 2020). The solar line observations are the Air Force Geophysical Laboratory ultraviolet solar irradiance balloon observations [72]; the ground-based Quality Assurance of Spectral Ultraviolet Measurements In Europe Fourier transform spectrometer solar irradiance observations [73]; the Fourier transform spectrometer observations that comprise the Kitt Peak National Observatory solar transmittance atlas [17]; and the semi-empirical Solar Pseudo-Transmittance Spectrum atlas, with contributions from multiple ground- and space-based FTS instruments, supplemented with observations from high-altitude balloons [74,75].
The TSIS-1 HSRS uncertainty is 0.5% from 0.4 to 0.46 μm, 0.3% from 0.46 to 2.365 μm, and 1.3% below 400 nm and above 2365 nm. This uncertainty includes the contributions from the TSIS-1 SIM and CSIM observations and the 1-σ standard deviation of the relative difference between the SIM observations and the TSIS-1 HSRS. It reflects the uncertainty of the HSRS for the same spectral resolution as the TSIS-1 and the CSIM instruments.
The selected eight spectra are summarized in Table 1. Figure 1 shows these SSI datasets plotted as a function of wavelength. The reported uncertainties are valid for a spectral range of 300–2400 nm.

Table 1.
List of solar spectra used in this study.
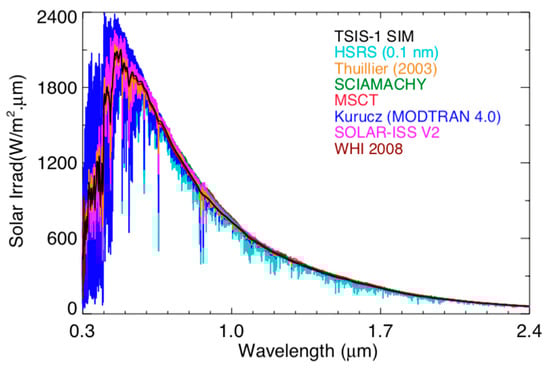
Figure 1.
Solar reference spectra from multiple studies at their native spectral resolutions.
These solar spectra were developed at different time periods. The magnitude of the Sun’s irradiance spectrum varies over the 11-year solar cycle. Ultraviolet solar cycle variability is on the order of 10% at 200 nm, reducing to 5% by 210 nm and to ~1% by 300 nm with the exception of the Mg II line near 280 nm. Visible and near-infrared solar cycle variability is on the order of 0.1% or less [76]. The eight solar spectra also have different spectral resolutions. For this work, we require a common spectral resolution, and this is accomplished by convolving each with the instrument line shape of the TSIS-1 SIM as described further in Section 2.3.
As noted in the introduction, previous studies [17,20,21,22] have reported noticeable differences between these solar spectra that can be larger than their reported uncertainties. The state-of-the-art TSIS-1 SIM observations (Section 2.1.7) have order-of-magnitude reductions in uncertainty (<0.3% over the majority of the spectrum) relative to predecessor instruments, justifying our use of the TSIS-1 SIM as the baseline for comparing the other solar spectra against. To support this choice, in Table 2, we compare the integrated SSI for each of the solar spectra against the value of total solar irradiance (TSI) adopted by the International Astronomical Union [77], 1361 W/m2. The integrals are computed over 205 to 2390 nm, a region of the spectrum accounting for 96% of the TSI and the majority of the variability in the solar spectrum. To make the comparison, we need to first estimate the contribution to TSI at wavelengths longer than 2390 nm and shorter than 205 nm: for wavelengths 2390 to 100,000 nm, the integrated SSI is 51.9 W/m2 according to the modeled “newkur.dat” spectrum distributed with the Modtran 4.0 radiative transfer software package [39] (Section 2.1.2); for wavelengths from 115 to 205 nm, the integrated SSI according to the SORCE Solar-stellar irradiance comparison experiment (SOLSTICE) observations [48] is ~0.12 W/m2. The total offset is then 51.9 + 0.12 = 52 W/m2. We justify treating this offset as a constant because solar cycle variability in the visible and infrared is very small as noted above. While ultraviolet solar cycle variability is larger, the contribution to the integrated energy is very small. The integral of the MCST spectra shows a difference of +15.1 W/m2 from the TSI value. The integral of the Thuillier 2003 spectra is 1367.2 W/m2, which is after the 1.4% wavelength-independent normalization (reduction) of the original Thuillier spectra, as described in Section 4 of [12] to match the then adopted TSI value of 1368 W/m2. Without the normalization, the integral of the Thuillier 2003 spectra results in a greater TSI of 1386 W/m2. Similarly, the WHI 2008 spectra used in this study also includes 0.909% wavelength-independent (Section 2 of [59]) to match the current International Astronomical Union (IAU) adopted TSI value of 1361 W/m2. The results in Table 2 demonstrate that both the TSIS-1 SIM observations and the TSIS-1 HSRS, after adjusting for the constant offset, provide the closest match to adopted TSI, without requiring any normalization. The integral of SCIAMACHY SSI is not included in Table 2 due to the data gaps in the measurements beyond 1.6 μm.
Table 2.
Total integrated solar irradiance values derived for all eight spectral solar irradiance (SSI) datasets and their differences with the TSI value adopted by IAU.
2.2. NOAA-20 VIIRS RSB Calibration
The VIIRS instrument onboard NOAA-20 is a scanning radiometer providing high-quality calibrated and geolocated earth observations in 22 spectral bands, out of which 14 are RSB with wavelengths between 0.41 μm and 2.25 μm. The VIIRS RSB are calibrated on orbit using a SD. The SD data are collected for every orbit to ensure radiometric quality. The SD also determines the absolute radiometric calibration for RSB based on the extensive prelaunch characterization of the SD. The frequent use of the SD degrades the throughput of the SD especially for shorter wavelengths. The solar diffuser stability monitor (SDSM) uses simultaneous observations of the sun through an attenuator and the diffuser to track any changes to the SD reflectance over time [78,79,80]. The calibration coefficients derived from the SD and SDSM observations are used to update the VIIRS L1B calibration lookup tables (LUTs) throughout the mission. The SD provides a reference for reflectance-based calibration of the sensor recorded top-of-atmosphere counts. The VIIRS L1B radiance dataset is derived from the calibrated reflectance record using the Thuillier 2003 SSI spectrum [12,16]. The sensor SRFs are convolved with the SSI data to compute band-specific ESUN values that are required for radiance-to-reflectance conversion. Figure 2 shows the SRFs of NOAA-20 VIIRS RSB M1 (0.41 µm), M2 (0.45 µm), M3 (0.49 µm), M4 (0.56 µm), M5 (0.67 µm), M6 (0.75 µm), M7 (0.87 µm), M8 (1.24 µm), M9 (1.38 µm), M10 (1.61 µm), M11 (2.25 µm), and I1 (0.64 µm) along with the Thuillier 2003 solar spectra in the background.
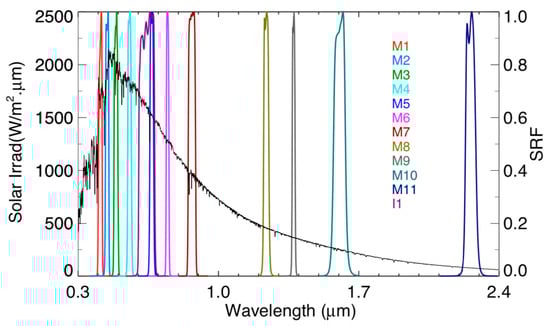
Figure 2.
Spectral response functions (SRFs) of NOAA-20 VIIRS RSB along with the Thuillier 2003 solar spectrum (in black) in the background.
2.3. Resampling of Multiple Solar Spectra
Owing to varying spectral resolution of SSI datasets listed in Table 1, a direct comparison of these spectra at a given wavelength is not feasible. As such, all spectra, other than TSIS-1 SIM, are resampled to a common spectral resolution of TSIS-1 SIM by convolving them with the line shape functions (LSFs) of the SIM instrument. The LSFs of TSIS-1 SIM are publicly available [81] for wavelengths ranging from 200 to 2400 nm with a sampling interval of 0.1 nm. Figure 3 depicts the original Kurucz spectrum (red curve) from MODTRAN 4.0 and after resampling (blue curve) to the spectral resolution equivalent to that of the SIM instrument. The inset shows a sample LSF of the SIM instrument at 650 nm. After resampling all solar spectra to a common spectral resolution, the absolute differences between them can be computed more precisely by direct subtraction of irradiance values at given wavelengths.
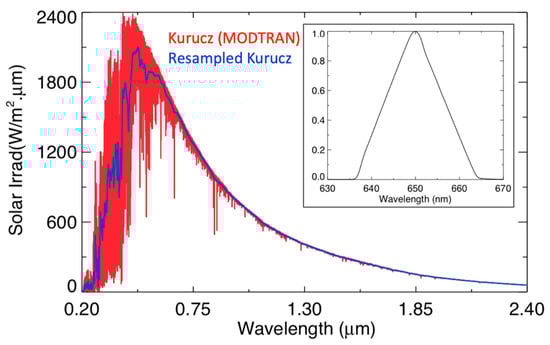
Figure 3.
Original (red) and re-sampled (blue) Kurucz solar spectra after convolving with the TSIS-1 SIM instrument’s line spread functions. Inset shows the shape of line shape function (LSF) at 650 nm.
2.4. Computation of ESUN
The satellite-measured calibrated reflectance () for a given RSB can be converted into spectral radiance () using the following equation:
where is the solar zenith angle, d is the Earth–Sun distance in astronomical units, and ESUN is the band-integrated solar constant (W m−2 µm−1). ESUN is computed from the SRF of the RSB and the chosen SSI spectrum as follows:
where and are the band edges of the RSB, and is the solar spectral irradiance as a function of wavelength. The solar spectral irradiances and the VIIRS RSB SRFs were defined at different spectral resolutions. Prior to the convolution of the two datasets, the courser resolution SRF or SSI data are resampled to the higher resolution SSI or SRF data using linear interpolation between the consecutive measurements. The ESUN values are computed for all RSB of NOAA-20 VIIRS using the eight SSI datasets in Table 1, and a percent difference () is computed (Equation (3)) relative to the Thuillier 2003 spectra, the official reference SSI spectrum used for NOAA-20 VIIRS.
3. Results and Discussion
3.1. Solar Spectra and ESUN Differences
The TSIS-1 SIM and the other seven solar spectra resampled to the spectral resolution of the TSIS-1 SIM instrument are depicted in Figure 4a. For these spectra, a percentage relative difference with respect to the TSIS-1 SIM spectrum is computed as a function of wavelength and are shown in Figure 4b. A positive relative difference indicates the given spectrum’s irradiance value is lesser than that of TSIS-1 SIM. The HSRS agrees with the TSIS-1 SIM spectrum within ~1% for wavelengths between 400 to 2400 nm. Noticeable differences can be seen between TSIS-1 SIM and other spectra. The Kurucz solar spectrum exhibits differences more than 5% at shorter wavelengths and up to ~2.5% in SWIR regimes. SCIAMACHY shows the greatest discrepancy (~6%) in the NIR wavelengths. The Thuillier spectrum is consistent with the TSIS-1 SIM measurements within ~2.5% in VIS and NIR wavelengths. However, the difference nearly exceeds +7% for SWIR wavelengths. The WHI solar irradiances are lower (positive relative difference) than that from TSIS-1 SIM for wavelengths <900 nm. Beyond 900 nm, the average WHI irradiance is greater (negative relative difference) than that for TSIS-1 SIM by ~5%. Both SOLAR-ISS and MCST exhibit a negative relative difference with respect to TSIS-1 SIM at wavelengths near 1 µm. However, at longer wavelengths, the differences turn out to be positive. Near 2.3 µm, the difference between the MCST and TSIS-1 SIM spectra is greater than 10%, whereas the differences between SOLAR-ISS and TSIS-1 SIM are smaller at ~2%. The discrepancy near 2.3 µm is even larger (~15%) between the MCST and WHI spectra. These observed relative differences between the multiple solar spectra exceed the associated uncertainties reported for these measurements.
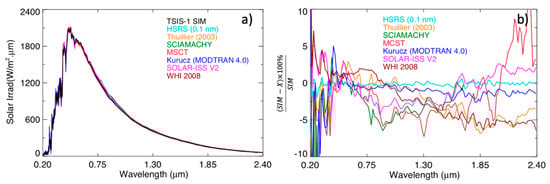
Figure 4.
(a) Resampled solar spectra after convolving with TSIS-1 SIM LSF. (b) Relative difference with respect to the TSIS-1 SIM spectrum computed as a function of wavelength.
The observed discrepancies among these solar spectra can result in a significantly different ESUN value for a given reflective solar channel, depending upon which solar spectrum is chosen. The difference in the ESUN value is not uniform and is wavelength dependent. A larger uncertainty in the estimation of ESUN value is inherited to the TOA radiance to reflectance, or vice-versa, conversion. To illustrate this statement, the ESUN values are computed for the NOAA-20 VIIRS RSB utilizing all eight solar spectra considered for this study. The computation of ESUN was discussed in Section 2.4. Figure 5a shows the various solar spectra and the SRF of the NOAA-20 VIIRS I1 band. The ESUN values derived for this band using the multiple spectra are shown as a bar graph in Figure 5b. A percentage difference in the ESUN value is computed for each of the spectra relative to the Thuillier spectra, which is the official solar spectra used by the NOAA-20 VIIRS ground processing system. These differences are shown in Figure 5c. Because the VIIRS instrument calibration is reflectance-based, the difference plot (Figure 5c) highlights the expected changes in the I1 band radiance if other spectra were used. A negative percentage difference indicates the radiances would be greater compared to using the Thuillier spectra. The maximum difference (~2%) in the I1 band ESUN value is computed for the SCIAMACHY and SOLAR-ISS spectra. Both MCST and Kurucz spectra results in ~1.5% difference in the ESUN value for I1 band relative to Thuillier spectra. It is noteworthy to mention here that the I1 band on both VIIRS instruments has a similar SRF and is calibrated using the SD as a reference source for reflectance. However, the ground processing system derives the L1B radiances from the satellite measured reflectances using Thuillier solar spectra for NOAA-20 and Kurucz spectra for SNPP VIIRS. As such, the magnitude of radiometric biases between the two VIIRS instruments are different for their radiance and reflectance datasets. If the onboard reflectance calibration of both VIIRS instruments is adjusted to be the same, the I1 band radiances would still differ by 1.5% due to the solar spectra differences. This applies to all other VIIRS RSB where the Thuillier and Kurucz spectra show noticeable differences in solar irradiances. Figure 5d–f illustrates the similar ESUN discrepancies for the VIIRS M11 (2.25 µm) band, where the reflectance-to-radiance conversion exceeds 10%. As expected from the discussion in the previous paragraph, the greatest relative difference in ESUN value is found for the VIIRS M11 band using the MCST spectra. The M11 band calibrated radiances from the two VIIRS instruments can be off by ~3% solely due to the difference between the Kurucz and Thuillier spectra. The ESUN differences for all RSB of NOAA-20 VIIRS are summarized in Table 3.
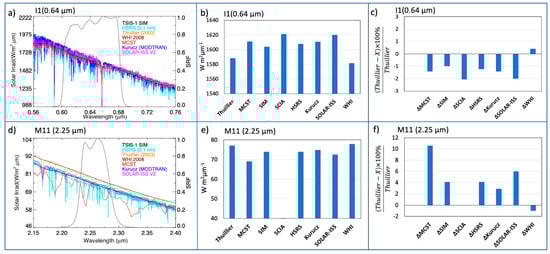
Figure 5.
(a) SRF of NOAA-20 VIIRS I1 band along with various solar spectra shown in the background. (b) ESUN values derived for the I1 band using various solar spectra. (c) ESUN percentage difference computed relative to the Thuillier spectra. (d–f) Same as (a–c) but for the VIIRS M11 (2.25 µm) band.
Table 3.
Percentage difference in ESUN values for NOAA-20 VIIRS channels computed for various solar spectra relative to Thuillier spectra.
3.2. Inter-Band Calibration Consistency
The previous section quantified the differences in ESUN values for the individual RSB of NOAA-20 VIIRS resulting from using different reference solar spectra. The relative percentage differences listed in Table 2 have a direct impact on the reflectance-to-radiance conversion of the VIIRS RSB dataset. The choice of solar spectra can impact even more severely in certain environmental retrievals that rely on combined use of multiple channels of satellite observations. For example, the Normalized Difference Vegetation Index (NDVI), which is a key spectral index for assessing natural resources and monitoring long-term trends in vegetation growth [82,83], is determined using satellite measured TOA reflectances in the visible (M5 or I1) and near-infrared (M7) channels using . Another example is the computation of Normalized Difference Snow Index (NDSI), a spectral index commonly used to monitor the extent of snow cover, as well as to distinguish between cloud and snow surface, that relies on the satellite observations at 0.65 µm and 1.6 µm [84,85]. Similarly, reflectance measurements from multiple RSB and their relative ratios as thresholds are used for deriving cloud masks, cloud optical thickness, cloud particle radius, and daytime cloud phase selection [86,87,88]. Therefore, in retrieval algorithms utilizing multiple channels, the net impact of solar spectra differences upon the retrievals is determined by the individual channel effects listed in Table 2 and how the multi-channel observations are related in the algorithm. For illustration, Figure 6 shows a time series of the ratio of clear-sky TOA radiances measured by NOAA-20 VIIRS M5 and M10 bands over a Saharan Desert (Libya-4) at near nadir viewing zenith angles. The desert site is chosen because it is temporally stable and offers very high signal-to-noise at both M5 and M10 wavelengths. The blue triangles represent the actual TOA radiance ratio derived from the NOAA-20 VIIRS L1b Collection 2 dataset produced by NASA VIIRS Land Science Investigator-led Processing System (Land SIPS). The green diamonds, red circles, and purple squares represent the expected M5/M10 radiance ratio if Land SIPS had incorporated Kurucz, TSIS-1 HSRS, and MCST solar spectra instead of Thuillier 2003. It can be seen that the M5/M10 radiance ratio can differ by more than 5% using the TSIS-1 HSRS spectra. The M5/M10 radiance ratio may be different for other scene types, but the relative percentage difference in the ratio due to the disparities between the solar spectra remains the same.
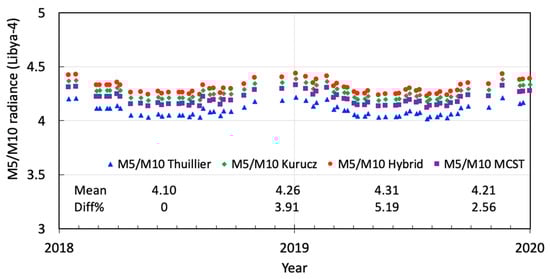
Figure 6.
Clear-sky TOA radiance ratio of VIIRS M5 and M10 bands derived over Libya-4 PICS using multiple solar spectra. The reported differences for the mean values are computed with respect to the Thuillier mean.
The inter-band radiance ratio may also be affected by an inadequate calibration consistency across multiple wavelengths. This could be a result of a varying uncertainty in the BRDF characterization of the SD across wavelengths or any temporal drifts in the calibration of one or more channels. For example, the SWIR bands of Terra-MODIS in C6.1 experienced calibration drifts after the 2016 safe-mode incident [89]. These temporal drifts results in an inconsistent inter-band radiance or reflectance ratio between the VIS and SWIR bands in Terra-MODIS. The assessment of calibration-dependent inter-band ratio is an independent topic and is beyond the scope of this study.
4. Conclusions
Accurate radiometric calibration of satellite observations is essential for reliable quantitative studies in remote sensing. The majority of satellite operators use a reference radiance or reflectance source to radiometrically calibrate the satellite measured counts. The calibration is then tied to a reference solar spectrum to allow the users for radiance-to-reflectance conversion, or vice-versa. Numerous solar irradiance datasets are currently in use among the remote sensing community. This paper summarized the derivation and the absolute uncertainty of eight of the most commonly used solar spectra in remote sensing. The absolute differences between these different solar spectra were computed and their impacts in satellite inter-comparison was investigated. Each spectrum is compared against the TSIS-1 SIM solar spectra that has a significantly greater radiometric precision and absolute accuracy than any previously reported SSI spectrum. The results show considerable differences at multiple wavelengths between 300 and 2400 nm. The greatest relative difference (~15%) is found between the MCST and WHI spectra near 2.3 µm. These wavelength-dependent differences are reflected as additional radiometric biases during inter-comparison of satellite instruments. If the instruments’ primary calibration is reflectance-based, these biases appear in their L1B radiance products. For example, if the two VIIRS instruments were both scaled to the same radiometric scale of absolute reflectance, their radiances can still differ by up to 3% because they use different reference spectra for ground processing. The radiometric inconsistency may even be larger for retrieval studies relying on relative ratios of multi-band radiance measurements. The existing non-uniformity in the usage of reference solar spectra among the multiple satellites RSB L1B radiance datasets adds extra challenges to achieve radiometric harmonization and consistent retrievals across the sensors. It is, therefore, very important for sensor dataset providers to explicitly state the solar spectra used in L1B products and the corresponding band Esun factors. The solar spectra can be easily incorporated in the netCDF or HDF metadata as well as in data quality summaries. Users should be able to quickly locate the solar spectra utilized in the L1B dataset in order to circumvent the easily avoidable sensor radiance comparison biases, similar to the examples illustrated in this paper.
This paper also highlighted the TSIS-1 HSRS, which is a new high-resolution solar irradiance spectrum developed by normalizing fine spectral resolution solar line observations to the high-accuracy TSIS-1 SIM absolute irradiance scale. The TSIS-1 HSRS has an unprecedented absolute accuracy of 0.3% between 460 and 2365 nm, and provides an integrated solar irradiance value that agrees very well (within 0.1%) with the adopted TSI of 1361 W/m2. The TSIS-1 HSRS uncertainty figure is a significant improvement over that of the Thuillier spectrum, which is currently the CEOS recommended SSI dataset. Multiple variants of TSIS-1 HSRS are available with a fixed spectral resolution of 1 nm to 0.001 nm suitable to fulfill the need for a broad range of low and high spectral resolution applications. They exhibit excellent radiometric consistency. Targeted to the UV community, coauthor Coddington and the TSIS-1 SIM team are also developing an approach to provide a temporally variable TSIS-1 HSRS based on the daily, direct TSIS-1 SIM solar spectral irradiance observations. The authors recommend using HSRS as a common reference solar spectrum for use in the calibration of current and future RSB satellite instruments. The CLARREO mission will incorporate the TSIS-1 HSRS SSI dataset to provide the corresponding hyper-spectral radiances for the reflectance-based SI traceable measurements.
Author Contributions
R.B. and D.R.D. formulated and directed the methodology, results analysis, and prepared the manuscript. O.C. provided the TSIS-1 SIM and HSRS solar spectra datasets and contributed towards writing the methodology section. B.S., A.G., and C.H. provided the SRF datasets and online tools for validating the ESUN values. All authors have read and agreed to the published version of the manuscript.
Funding
This work was supported by the National Aeronautics and Space Administration (NASA) Earth Science Enterprise Office through the CERES Project and NASA’s TSIS-1 project (80GSFC18C0056).
Data Availability Statement
Not applicable.
Acknowledgments
The authors thank NOAA’s VIIRS SDR team and NASA’s VCST for providing valuable insight on the different solar spectra used in the VIIRS ground processing systems. Odele Coddington thanks NASA’s TSIS-1 project (80GSFC18C0056) and the Solar Irradiance Science Team (80NSSC18K1304) for the ongoing support.
Conflicts of Interest
The authors declare no conflict of interest.
References
- Haigh, J.D. The Sun and the Earth’s Climate. Living Rev. Sol. Phys. 2007, 4, 2. [Google Scholar] [CrossRef]
- Gray, L.J.; Beer, J.; Geller, M.; Haigh, J.D.; Lockwood, M.; Matthes, K.; Cubasch, U.; Fleitmann, D.; Harrison, G.; Hood, L.; et al. Solar influences on climate. Rev. Geophys. 2010, 48, RG4001. [Google Scholar] [CrossRef]
- Neckel, H.; Labs, D. The solar radiation between 3300 and 12500 Å. Sol. Phys. 1984, 90, 205–258. [Google Scholar] [CrossRef]
- Arvesen, J.C.; Griffin, R.N.; Pearson, B.D. Determination of Extraterrestrial Solar Spectral Irradiance from a Research Aircraft. Appl. Opt. 1969, 8, 2215. [Google Scholar] [CrossRef]
- Thekaekara, M.P.; Kruger, R.; Duncan, C.H. Solar Irradiance Measurements from a Research Aircraft. Appl. Opt. 1969, 8, 1713. [Google Scholar] [CrossRef]
- Neckel, H.; Labs, D. Improved data of solar spectral irradiance from 0.33 to 1.25μ. Sol. Phys. 1981, 74, 231–249. [Google Scholar] [CrossRef]
- Markham, B.L.; Barker, J.L. Radiometric properties of U.S. processed landsat MSS data. Remote Sens. Environ. 1987, 22, 39–71. [Google Scholar] [CrossRef]
- Robel, J.; Graumann, A. NOAA KLM User’s Guide; National Oceanic and Atmospheric Administration: Maryland, MD, USA, 2014.
- McCluney, W.R. The extraterrestrial solar spectrum. Sol. Energy 1974, 15, 319. [Google Scholar] [CrossRef]
- Thuillier, G.; Hersé, M.; Simon, P.C.; Labs, D.; Mandel, H.; Gillotay, D.; Foujols, T. The visible solar spectral irradiance from 350 to 850 nm as measured by the solspec spectrometer during the ATLAS I mission. Sol. Phys. 1998, 177, 41–61. [Google Scholar] [CrossRef]
- Smith, E.V.P.; Gottlieb, D.M. Solar flux and its variations. Space Sci. Rev. 1974, 16, 771–802. [Google Scholar] [CrossRef]
- Thuillier, G.; Hersé, M.; Labs, D.; Foujols, T.; Peetermans, W.; Gillotay, D.; Simon, P.C.; Mandel, H. The solar spectral irradiance from 200 to 2400 nm as measured by the SOLSPEC spectrometer from the ATLAS and EURECA missions. Sol. Phys. 2003, 214, 1–22. [Google Scholar] [CrossRef]
- Desnos, Y.L. Working group on calibration and validation. Eur. Space Agency 2002, 22, 2–3. [Google Scholar]
- Kneubuhler, M.; Schaepman, M.; Thome, K.; Baret, F.; Muller, A. Calibration and Validation of Envisat MERIS Part 1: Vicarious Calibration at Rail Road Valley Playa (NV). In Proceedings of the Envisat Validation Workshop, Frascati, Italy, 9–13 December 2002. [Google Scholar]
- Gorroño, J.; Fomferra, N.; Peters, M.; Gascon, F.; Underwood, C.I.; Fox, N.P.; Kirches, G.; Brockmann, C. A radiometric uncertainty tool for the sentinel 2 mission. Remote Sens. 2017, 9, 178. [Google Scholar] [CrossRef]
- Uprety, S.; Cao, C.; Blonski, S.; Shao, X. Assessing the NOAA-20 and S-NPP VIIRS Radiometric Consistency. In Proceedings of the Earth Observing Missions and Sensors: Development, Implementation, and Characterization V, Honolulu, HI, USA, 25–26 September 2018; p. 32. [Google Scholar]
- Kurucz, R.L. High Resolution Irradiance Spectrum from 300 to 1000 nm. In Proceedings of the AFRL Transmission Meeting, Monterey, CA, USA, 18–20 January 2006. [Google Scholar]
- Kurucz, R.L. The solar irradiance by computation. In Proceedings of the 17th Annual Conference on Atmospheric Transmission Models, Bedford, MA, USA, 6–8 June 1995; Volume 95, pp. 333–334. [Google Scholar]
- Berk, A.; Anderson, G.P.; Bernstein, L.S.; Acharya, P.K.; Dothe, H.; Matthew, M.W.; Adler-Golden, S.M.; Chetwynd, J.H., Jr.; Richtsmeier, S.C.; Pukall, B.; et al. MODTRAN4 radiative transfer modeling for atmospheric correction. In Proceedings of the SPIE 3756, Optical Spectroscopic Techniques and Instrumentation for Atmospheric and Space Research III, Denver, CO, USA, 18–23 July 1999. [Google Scholar]
- Zhang, L.; Hu, S.; Yang, H.; Wu, T.; Tong, Q.; Zhang, F. The effects of solar irradiance spectra on calculation of narrow band top-of-atmosphere reflectance. IEEE J. Sel. Top. Appl. Earth Obs. Remote Sens. 2014, 7, 49–58. [Google Scholar] [CrossRef]
- Shanmugam, P.; Ahn, Y.H. Reference solar irradiance spectra and consequences of their disparities in remote sensing of the ocean colour. Ann. Geophys. 2007, 25, 1235–1252. [Google Scholar] [CrossRef]
- Bhatt, R.; Doelling, D.R.; Haney, C.; Spangenberg, D.A.; Scarino, B.; Gopalan, A. Clouds and the Earth’s Radiant Energy System strategy for intercalibrating the new-generation geostationary visible imagers. J. Appl. Remote Sens. 2020, 14, 1. [Google Scholar] [CrossRef]
- Thome, K.; Markham, B.; Barker, J.; Slater, P.; Biggar, S. Radiometric calibration of Landsat. Photogramm. Eng. Remote Sens. 1997, 63, 853–858. [Google Scholar]
- Chance, K.; Kurucz, R.L. An improved high-resolution solar reference spectrum for earth’s atmosphere measurements in the ultraviolet, visible, and near infrared. J. Quant. Spectrosc. Radiat. Transf. 2010, 111, 1289–1295. [Google Scholar] [CrossRef]
- Czapla-Myers, J.; McCorkel, J.; Anderson, N.; Thome, K.; Biggar, S.; Helder, D.; Aaron, D.; Leigh, L.; Mishra, N. The ground-based absolute radiometric calibration of Landsat 8 OLI. Remote Sens. 2015, 7, 600–626. [Google Scholar] [CrossRef]
- Yu, F.; Shao, X.; Wu, X.; Kondratovich, V.; Li, Z. Validation of early GOES-16 ABI on-orbit geometrical calibration accuracy using SNO method. In Proceedings of the SPIE Optical Engineering + Applications, Earth Observing Systems XXII, San Diego, CA, USA, 6–10 August 2017; p. 30. [Google Scholar]
- Bhatt, R.; Doelling, D.; Scarino, B.; Haney, C.; Gopalan, A. Cross-Calibration of Aqua-MODIS and NPP-VIIRS Reflective Solar Bands for a Seamless Record of CERES Cloud and Flux Properties. In Proceedings of the IGARSS 2018—IEEE International Geoscience and Remote Sensing Symposium, Valencia, Spain, 22–27 July 2018; pp. 4332–4335. [Google Scholar]
- Uprety, S.; Cao, C.; Shao, X. Radiometric consistency between GOES-16 ABI and VIIRS on Suomi NPP and NOAA-20. J. Appl. Remote Sens. 2020, 14, 032407. [Google Scholar] [CrossRef]
- Li, S.; Ganguly, S.; Dungan, J.L.; Wang, W.; Nemani, R.R. Sentinel-2 MSI Radiometric Characterization and Cross-Calibration with Landsat-8 OLI. Adv. Remote Sens. 2017, 6, 147–159. [Google Scholar] [CrossRef]
- Barsi, J.A.; Alhammoud, B.; Czapla-Myers, J.; Gascon, F.; Haque, M.O.; Kaewmanee, M.; Leigh, L.; Markham, B.L. Sentinel-2A MSI and Landsat-8 OLI radiometric cross comparison over desert sites. Eur. J. Remote Sens. 2018, 51, 822–837. [Google Scholar] [CrossRef]
- Markham, B.; Barsi, J.; Kvaran, G.; Ong, L.; Kaita, E.; Biggar, S.; Czapla-Myers, J.; Mishra, N.; Helder, D. Landsat-8 operational land imager radiometric calibration and stability. Remote Sens. 2014, 6, 12275–12308. [Google Scholar] [CrossRef]
- Doelling, D.R.; Bhatt, R.; Scarino, B.R.; Gopalan, A.; Haney, C.O.; Minnis, P.; Bedka, K.M. A consistent AVHRR visible calibration record based on multiple methods applicable for the NOAA degrading orbits. Part II: Validation. J. Atmos. Ocean. Technol. 2016, 33, 2517–2534. [Google Scholar] [CrossRef]
- Labs, D.; Neckel, H. Transformation of the absolute solar radiation data into the “International Practical Temperature Scale of 1968”. Sol. Phys. 1970, 15, 79–87. [Google Scholar] [CrossRef]
- Pierce, A.K.; Slaughter, C.D.; Weinberger, D. Solar limb darkening in the interval 7404-24 018 Å, II. Sol. Phys. 1977, 52, 179–189. [Google Scholar] [CrossRef]
- Kurucz, R.L.; Furenlid, I.; Brault, J.; Testerman, L. Solar Flux Atlas from 296 to 1300 nm; National Solar Observatory Atlas: New Mexico, NM, USA, 1984. [Google Scholar]
- Pierce, A.K. Relative Solar Energy Distribution in the Spectral Region 10,000–25,000 a. Astrophys. J. 1954, 119, 312. [Google Scholar] [CrossRef]
- Acharya, P.; Berk, A.; Bernstein, L.; Robertson, D.; Chetwynd, J. Recent Upgrades to MODTRAN—New Solar Irradiance and Instrument Scanning Functions; National Solar Observatory: Boulder, CO, USA, 1998. [Google Scholar]
- Cebula, R.P.; Hilsenrath, E.; Guenther, B. Calibration of the Shuttle Borne Solar Backscatter Ultraviolet Spectrometer. In Proceedings of the SPIE 1109, Optical Radiation Measurements II, Orlando, FL, USA, 27–31 March 1989; Volume 1109, p. 205. [Google Scholar]
- Cebula, R.P.; Thuillier, G.O.; VanHoosier, M.E.; Hilsenrath, E.; Herse, M.; Brueckner, G.E.; Simon, P.C. Observations of the solar irradiance in the 200–350 nm interval during the ATLAS-1 Mission: A comparison among three sets of measurements-SSBUV, SOLSPEC, and SUSIM. Geophys. Res. Lett. 1996, 23, 2289–2292. [Google Scholar] [CrossRef]
- Fontenla, J.M.; Avrett, E.H.; Loeser, R. Energy balance in the solar transition region. III—Helium emission in hydrostatic, constant-abundance models with diffusion. Astrophys. J. 1993, 406, 319. [Google Scholar] [CrossRef]
- Kurucz, R. Atomic and Molecular Data for Opacity Calculations. Rev. Mex. Astron. Astrofis. 1992, 23, 45–48. [Google Scholar]
- Kurucz, R. Remaining line opacity problems for the solar spectrum. Rev. Mex. Astron. Astrofís. 1992, 23, 187–194. [Google Scholar]
- Meftah, M.; Damé, L.; Bolsée, D.; Pereira, N.; Snow, M.; Weber, M.; Bramstedt, K.; Hilbig, T.; Cessateur, G.; Boudjella, M.Y.; et al. A New Version of the SOLAR-ISS Spectrum Covering the 165–3000 nm Spectral Region. Sol. Phys. 2020, 295, 14. [Google Scholar] [CrossRef]
- Meftah, M.; Bolsée, D.; Damé, L.; Hauchecorne, A.; Pereira, N.; Irbah, A.; Bekki, S.; Cessateur, G.; Foujols, T.; Thiéblemont, R. Solar Irradiance from 165 to 400 nm in 2008 and UV Variations in Three Spectral Bands During Solar Cycle 24. Sol. Phys. 2016, 291, 3527–3547. [Google Scholar] [CrossRef][Green Version]
- Meftah, M.; Damé, L.; Bolsée, D.; Pereira, N.; Sluse, D.; Cessateur, G.; Irbah, A.; Sarkissian, A.; Djafer, D.; Hauchecorne, A.; et al. A New Solar Spectrum from 656 to 3088 nm. Sol. Phys. 2017, 292, 101. [Google Scholar] [CrossRef]
- Meftah, M.; Damé, L.; Bolsée, D.; Hauchecorne, A.; Pereira, N.; Sluse, D.; Cessateur, G.; Irbah, A.; Bureau, J.; Weber, M.; et al. SOLAR-ISS: A new reference spectrum based on SOLAR/SOLSPEC observations. Astron. Astrophys. 2018, 611, A1. [Google Scholar] [CrossRef]
- Thuillier, G.; Foujols, T.; Bolsée, D.; Gillotay, D.; Hersé, M.; Peetermans, W.; Decuyper, W.; Mandel, H.; Sperfeld, P.; Pape, S.; et al. SOLAR/SOLSPEC: Scientific Objectives, Instrument Performance and Its Absolute Calibration Using a Blackbody as Primary Standard Source. Sol. Phys. 2009, 257, 185–213. [Google Scholar] [CrossRef]
- Mcclintock, W.; Rottman, G.; Woods, T. Solar–Stellar Irradiance Comparison Experiment II (Solstice II): Instrument Concept and Design. In Solar Physics—SOL PHYS; Springer: Berlin, Germany, 2007; Volume 230, pp. 225–258. [Google Scholar]
- Rottman, G. The SORCE mission. In Solar Physics; Springer: Berlin, Germany, 2007; Volume 230, pp. 7–25. [Google Scholar]
- Thuillier, G.; Floyd, L.; Woods, T.N.; Cebula, R.; Hilsenrath, E.; Hersé, M.; Labs, D. Solar irradiance reference spectra for two solar active levels. Adv. Space Res. 2004, 34, 256–261. [Google Scholar] [CrossRef]
- Kurucz, R.L.; Bell, B. Atomic Line List; Smithsonian Astrophysical Observatory: Cambridge, MA, USA, 1995. [Google Scholar]
- Fontenla, J.M.; Stancil, P.C.; Landi, E. Solar spectral irradiance, solar activity, and the near-ultra-violet. Astrophys. J. 2015, 809, 157. [Google Scholar] [CrossRef]
- Hilbig, T.; Weber, M.; Bramstedt, K.; Noël, S.; Burrows, J.P.; Krijger, J.M.; Snel, R.; Meftah, M.; Damé, L.; Bekki, S.; et al. The New SCIAMACHY Reference Solar Spectral Irradiance and Its Validation. Sol. Phys. 2018, 293, 121. [Google Scholar] [CrossRef]
- Burrows, J.P.; Hölzle, E.; Goede, A.P.H.; Visser, H.; Fricke, W. SCIAMACHY-scanning imaging absorption spectrometer for atmospheric chartography. Acta Astronaut. 1995, 35, 445–451. [Google Scholar] [CrossRef]
- Skupin, J.; Noël, S.; Wuttke, M.W.; Gottwald, M.; Bovensmann, H.; Weber, M.; Burrows, J.P. SCIAMACHY solar irradiance observation in the spectral range from 240 to 2380 nm. Adv. Space Res. 2005, 35, 370–375. [Google Scholar] [CrossRef]
- Pagaran, J.; Harder, J.W.; Weber, M.; Floyd, L.E.; Burrows, J.P. Intercomparison of SCIAMACHY and SIM vis-IR irradiance over several solar rotational timescales. Astron. Astrophys. 2011, 528, A67. [Google Scholar] [CrossRef]
- Bovensmann, H.; Burrows, J.P.; Buchwitz, M.; Frerick, J.; Noël, S.; Rozanov, V.V.; Chance, K.V.; Goede, A.P.H. SCIAMACHY: Mission objectives and measurement modes. J. Atmos. Sci. 1999, 56, 127–150. [Google Scholar] [CrossRef]
- Gloudemans, A.M.S.; Schrijver, H.; Kleipool, Q.; van den Broek, M.M.P.; Straume, A.G.; Lichtenberg, G.; van Hees, R.M.; Aben, I.; Meirink, J.F. The impact of SCIAMACHY near-infrared instrument calibration on CH 4 and CO total columns. Atmos. Chem. Phys. Discuss. 2005, 5, 2369–2383. [Google Scholar] [CrossRef]
- Woods, T.N.; Chamberlin, P.C.; Harder, J.W.; Hock, R.A.; Snow, M.; Eparvier, F.G.; Fontenla, J.; McClintock, W.E.; Richard, E.C. Solar Irradiance Reference Spectra (SIRS) for the 2008 Whole Heliosphere Interval (WHI). Geophys. Res. Lett. 2009, 36, L01101. [Google Scholar] [CrossRef]
- Mcclintock, W.E.; Rottman, G.J.; Woods, T.N. Solar–Stellar Irradiance Comparison Experiment II (Solstice II): Instrument Concept and Design. Sol. Phys. 2005, 230, 225–258. [Google Scholar] [CrossRef]
- Harder, J.W.; Fontenla, J.; Lawrence, G.; Woods, T.; Rottman, G. The spectral irradiance monitor: Measurement equations and calibration. Sol. Phys. 2005, 230, 169–204. [Google Scholar] [CrossRef]
- Woods, T.; Eparvier, F.; Bailey, S.; Chamberlin, P.; Lean, J.; Rottman, G.; Solomon, S.; Tobiska, W.K.; Woodraska, D. Solar EUV Experiment (SEE): Mission overview and first results. J. Geophys. Res. Space Phys. 2005, 110, 1312. [Google Scholar] [CrossRef]
- Woods, T.; Eparvier, F.; Jones, A.; Judge, D.; Lean, J.; Mariska, J.; Mcmullin, D.; Warren, H.; Berthiaume, G.; Bailey, S. The EUV Variability Experiment (EVE) on the Solar Dynamics Observatory (SDO): Science plan and instrument overview. ESA SP 2006, 617, 19–24. [Google Scholar]
- Chamberlin, P.C.; Hock, R.A.; Crotser, D.A.; Eparvier, F.G.; Furst, M.; Triplett, M.A.; Woodraska, D.L.; Woods, T.N. EUV variability experiment (EVE); multiple EUV grating spectrographs (MEGS), radiometric calibrations and results. In Proceedings of the Solar Physics and Space Weather Instrumentation II, San Diego, CA, USA, 26–30 August 2007. [Google Scholar]
- Chamberlin, P.C.; Woods, T.N.; Crotser, D.A.; Eparvier, F.G.; Hock, R.A.; Woodraska, D.L. Solar cycle minimum measurements of the solar extreme ultraviolet spectral irradiance on 14 April 2008. Geophys. Res. Lett. 2009, 36, L05102. [Google Scholar] [CrossRef]
- Harder, J.W.; Thuillier, G.; Richard, E.C.; Brown, S.W.; Lykke, K.R.; Snow, M.; McClintock, W.E.; Fontenla, J.M.; Woods, T.N.; Pilewskie, P. The SORCE SIM solar spectrum: Comparison with recent observations. Sol. Phys. 2010, 263, 3–24. [Google Scholar] [CrossRef]
- Kopp, G.; Lawrence, G.; Rottman, G. The Total Irradiance Monitor (TIM): Science results. In The Solar Radiation and Climate Experiment (SORCE); Springer: Berlin, Germany, 2005. [Google Scholar]
- Richard, E.; Harber, D.; Harder, J.; Pilewskie, P.; Brown, S.; Smith, A.; Lykke, K. Future Long-term Measurements of Solar Spectral Irradiance by JPSS TSIS. In AGU Fall Meeting Abstracts; American Geophysical Union: San Francisco, CA, USA, 2011; p. GC23A-0917. [Google Scholar]
- Richard, E.C.; Pilewskie, P.; Kopp, G.; Coddington, O.; Woods, T.N.; Wu, D.L. Continuing the Solar Irradiance Data Record with TSIS. In AGU Fall Meeting Abstracts; American Geophysical Union: San Fracisco, DC, USA, 2016; p. A11I-0133. [Google Scholar]
- Richard, E.; Harber, D.; Coddington, O.; Drake, G.; Rutkowski, J.; Triplett, M.; Pilewskie, P.; Woods, T. SI-traceable spectral irradiance radiometric characterization and absolute calibration of the TSIS-1 spectral irradiance monitor (SIM). Remote Sens. 2020, 12, 1818. [Google Scholar] [CrossRef]
- Coddington, O.M.; Richard, E.C.; Harber, D.; Pilewskie, P.; Woods, T.N.; Chance, K.; Liu, X.; Sun, K. The TSIS-1 Hybrid Solar Reference Spectrum. Geophys. Res. Lett. 2020. [Google Scholar] [CrossRef]
- Hall, L.A.; Anderson, G.P. High-resolution solar spectrum between 2000 and 3100 Å. J. Geophys. Res. 1991, 96, 12927. [Google Scholar] [CrossRef]
- Gröbner, J.; Kröger, I.; Egli, L.; Hülsen, G.; Riechelmann, S.; Sperfeld, P. The high-resolution extraterrestrial solar spectrum (QASUMEFTS) determined from ground-based solar irradiance measurements. Atmos. Meas. Tech. 2017, 10, 3375–3383. [Google Scholar] [CrossRef]
- Toon, G.C. The Solar Spectrum: An Atmospheric Remote Sensing Perspective; University of Toronto Seminar: Toronto, ON, Canada, 2013. [Google Scholar]
- Toon, G.C. Solar Line List for GGG2014. Available online: https://mark4sun.jpl.nasa.gov/toon/solar/solar_spectrum.html (accessed on 11 December 2020).
- Lean, J. Evolution of the Sun’s Spectral Irradiance Since the Maunder Minimum. Geophys. Res. Lett. 2000, 27, 2425–2428. [Google Scholar] [CrossRef]
- Prša, A.; Harmanec, P.; Torres, G.; Mamajek, E.; Asplund, M.; Capitaine, N.; Christensen-Dalsgaard, J.; Depagne, É.; Haberreiter, M.; Hekker, S.; et al. Nominal Values for Selected Solar and Planetary Quantities: Iau 2015 Resolution B3. Astron. J. 2016, 152, 41. [Google Scholar] [CrossRef]
- Sun, J.; Wang, M. NOAA-20 VIIRS reflective solar bands on-orbit calibration using solar diffuser and solar diffuser stability monitor. In Proceedings of the SPIE 10764, Earth Observing Systems XXIII, San Diego, CA, USA, 19–23 August 2018; p. 47. [Google Scholar]
- Xiong, X.; Cao, C.; Lei, N.; Chiang, K.; Angal, A.; Li, Y.; Blonski, S.; Wang, W.; Choi, T. Early results from NOAA-20 (JPSS-1) VIIRS on-orbit calibration and characterization. In Proceedings of the IGARSS 2018—2018 IEEE International Geoscience and Remote Sensing Symposium, Valencia, Spain, 22–27 July 2018; pp. 1112–1115. [Google Scholar]
- Choi, T.J.; Shao, X.; Blonski, S.; Wang, W.; Uprety, S.; Cao, C. NOAA-20 VIIRS initial on-orbit radiometric calibration using scheduled lunar observations. In Proceedings of the SPIE 11127, Earth Observing Systems XXIV, San Diego, CA, USA, 11–15 August 2019; p. 72. [Google Scholar]
- TSIS-1 SIM Line Shape Function. Available online: https://lasp.colorado.edu/home/tsis/data/ssi-data/#tsis_sim_lsf (accessed on 11 December 2020).
- Reed, B.C.; Brown, J.F.; VanderZee, D.; Loveland, T.R.; Merchant, J.W.; Ohlen, D.O. Measuring phenological variability from satellite imagery. J. Veg. Sci. 1994, 5, 703–714. [Google Scholar] [CrossRef]
- Van Leeuwen, W.J.D.; Orr, B.J.; Marsh, S.E.; Herrmann, S.M. Multi-sensor NDVI data continuity: Uncertainties and implications for vegetation monitoring applications. Remote Sens. Environ. 2006, 100, 67–81. [Google Scholar] [CrossRef]
- Salomonson, V.V.; Appel, I. Estimating fractional snow cover from MODIS using the normalized difference snow index. Remote Sens. Environ. 2004, 89, 351–360. [Google Scholar] [CrossRef]
- Riggs, G.A.; Hall, D.K.; Salomonson, V.V. Algorithm Theoretical Basis Document (ATBD), MODIS Snow and Sea Ice Global Mapping Project. 2013. Available online: https://modis-snow-ice.gsfc.nasa.gov/?c=atbd (accessed on 4 April 2021).
- Platnick, S.; Li, J.Y.; King, M.D.; Gerber, H.; Hobbs, P.V. A solar reflectance method for retrieving the optical thickness and droplet size of liquid water clouds over snow and ice surfaces. J. Geophys. Res. Atmos. 2001, 106, 15185–15199. [Google Scholar] [CrossRef]
- Platnick, S.; King, M.D.; Ackerman, S.A.; Menzel, W.P.; Baum, B.A.; Riédi, J.C.; Frey, R.A. The MODIS cloud products: Algorithms and examples from terra. IEEE Trans. Geosci. Remote Sens. 2003, 41, 459–472. [Google Scholar] [CrossRef]
- Minnis, P.; Sun-Mack, S.; Chen, Y.; Chang, F.-L.; Yost, C.R.; Smith, W.L.; Heck, P. CERES MODIS cloud product retrievals for Edition 4, Part I: Algorithm Changes. IEEE Trans. Geosci. Remote Sens. 2021, 54, 2744–2780. [Google Scholar] [CrossRef]
- Bhatt, R.; Doelling, D.R.; Angal, A.; Xiong, X.; Haney, C.; Scarino, B.R.; Wu, A.; Gopalan, A. Response Versus Scan-Angle Assessment of MODIS Reflective Solar Bands in Collection 6.1 Calibration. IEEE Trans. Geosci. Remote Sens. 2020, 58, 2276–2289. [Google Scholar] [CrossRef]


Publisher’s Note: MDPI stays neutral with regard to jurisdictional claims in published maps and institutional affiliations. |
© 2021 by the authors. Licensee MDPI, Basel, Switzerland. This article is an open access article distributed under the terms and conditions of the Creative Commons Attribution (CC BY) license (https://creativecommons.org/licenses/by/4.0/).