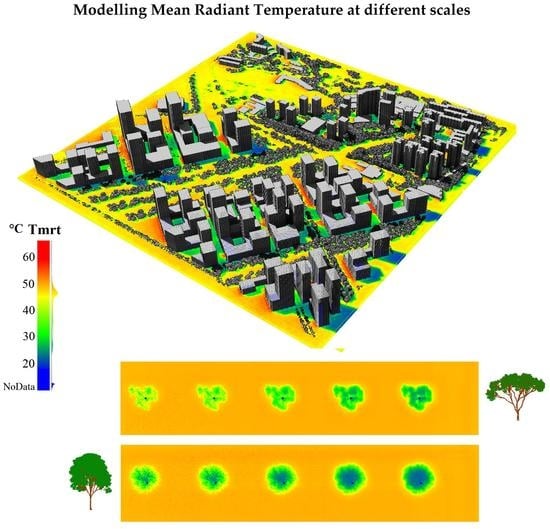
1. Introduction
The increased number of heat waves due to global climate change experienced in growing urban areas across the world directly and indirectly affects thermal comfort and health of urban residents, particularly in the tropics. The environmental factors controlling outdoor thermal comfort are the Mean Radiant Temperature (Tmrt), wind speed, air temperature, and humidity [
1]. Outdoor thermal comfort and heat related mortality are more influenced by the Tmrt and less by the other three factors [
2]. Tmrt is considered an essential bio-meteorological variable having a strong influence on thermal comfort indices such as the Physiological Equivalent Temperature (PET) [
3], Predicted Mean Vote (PMV) [
1], Universal Thermal Climate Index (UTCI) [
4], the Perceived Temperature (PT) [
5], and Global Outdoor Comfort Index (GOCI) [
6]. A comprehensive review of thermal comfort studies in urban spaces can be found in Lai et al. 2020 [
7].
In solar exposure conditions, the energy loss or gain by radiation is the most important heat flux in the energy balance; followed by convective fluxes of sensible and latent heat and at last, the conductive heat flux [
8]. The concept of Tmrt is based on the fact that the net exchange of radiant energy between two objects is approximately proportional to their temperature difference multiplied by their ability to emit and absorb heat [
1]. This is valid as long as the absolute temperatures of objects in question are large compared to the temperature differences, allowing linearization of the Stefan–Boltzmann Law in the relevant temperature range [
9,
10]. Different city structures in the same thermal region differ mainly in their radiation temperatures [
11]. This is due to the geometrical complexity of buildings, their surface radiative properties and their wavelength dependency. These properties play an important role in the radiation exchange and therefore, on its modelling. Numerical tools such as Rayman [
9], ENVI-met [
12], SOLWEIG [
13], TUF-3D [
14], CityComfort+ [
15], and VTUF 3D [
16] are increasingly being used by planners and architects to assess the bio-meteorological performance of urban scenarios. Such tools vary in terms of dimensionality, i.e., 1-D/3-D, accuracy in predicting the radiation fluxes, consideration of surface material properties, distribution of surface temperatures, physical representation of the vegetation, scale of analysis, speed of computation, and capability to assimilate remote sensing data as input for simulations.
Remote sensing technologies have great potential to study the thermal behavior of cities in space and time [
17], particularly when combining information of urban surfaces and their spectral characteristics using physically-based radiative transfer models (RTMs). Recent studies have successfully combined a variety of remotely acquired data with RTMs to derive urban surface properties (albedo and temperature), energy fluxes, and Tmrt [
18,
19,
20,
21,
22,
23]. These studies highlight an increasing demand for advanced tools capable of 3-D analysis of detailed urban data including the vegetation. RTMs used in the field of remote sensing were developed to compute accurate canopy spectral radiance, to invert and evaluate existing data, and for the configuration of future satellite missions [
24]. Only a few RTMs simultaneously simulate the canopy spectral radiance and the canopy 3-D radiative budget (RB). To our knowledge, advanced physically-based RTM models have not been fully employed for modelling Tmrt. Therefore, this study seeks to (1) exploit the advanced capabilities of a physically-based 3-D RTM for the estimation of Tmrt of complex urban scenes, and (2) introduce its use for a broader application by planners and urban climate scientists.
In this study we propose a new method for detailed 3-D modelling of Tmrt in complex urban scenes by improving the radiative budget module of the Discrete Anisotropic Radiation Transfer model DART [
25]. The characteristics that make DART a powerful tool to model radiation are summarized hereafter. (1) DART considers the full spectral domain from ultraviolet to thermal infrared in solar/atmosphere radiation and optical properties. Therefore, it provides more accurate results than models that consider that radiation only belongs to two spectral domains (i.e., short and long wave domains) and/or that the canopy optical property is only defined by its albedo and emissivity. (2) DART considers all types of surface optical properties, including spectral reflectance, transmittance, and absorbance; spectral emissivity of opaque material is equal to one minus spectral reflectance of this material. Surface reflectance can be isotropic (Lambertian) or anisotropic using Fresnel equations or predefined bidirectional reflectance distribution function, which allows DART to consider any material. (3) DART can simulate vegetation either as a set of facet-like leaves with specific locations, orientations, and optical properties, or as a 3-D distribution of turbid medium (i.e., infinite number of infinitely small plane elements) defined by specific clumping, leaf angle distribution, Leaf Area Index (LAI)/Leaf Area Density (LAD), and optical properties. Therefore, DART simulates light propagation below trees conversely to models that represent trees as opaque volumes. The turbid representation of vegetation is adopted in this work. (4) DART simulates 3-D multiple scattering within vegetation and between vegetation and other materials (e.g., walls). This is very important in presence of high reflectance scene elements (e.g., green vegetation in the near infrared domain), and also to simulate the grey body (emissivity less than one) in long wave domain. (5) In addition to the radiative budget of canopies, DART simulates their remote sensing signal [
21,
24,
26]. DART is considered one of the most advanced 3-D RTMS and that it has been positively evaluated in the framework of the Radiative transfer inter-comparison project (RAMI) [
27,
28].
Our methodology for modelling Tmrt can be applied at different scales and under a range of parameters including the urban pattern, surface material of ground, walls, roofs, and vegetation properties (coverage, shape, spectral properties, Leaf Area Index, and Leaf Area Density). Three dimensional scenes can be generated from multi-source remote sensing data as shown on our previous study on 3-D Reconstruction of urban landscapes from satellite data, where a detailed workflow for the derivation of 3-D urban scenes was presented, together with an evaluation of 3-D radiative budget over different urban typologies found in Singapore [
21]; additionally, scenes can be generated from Aerial LiDAR Scanning (ALS) point cloud data [
29] or using 3-D modelling software. Depending on the desired scale of analysis, vegetation turbid plots (i.e., volume of turbid material) can be generated from satellite data [
21], from ALS point clouds [
29] or using realistic 3-D models. Moreover, vegetation properties (e.g., LAI/LAD) can be retrieved from terrestrial laser scanning data (TLS) at plant scale [
30,
31], from ALS [
32,
33] at neighborhood scale or from other remote sensing systems. Finally, the spatial distribution of vegetation can be modelled from hybrid point cloud data [
29]. Information on suggested data sources for scene creation can be found in
Table A1 and
Table A3.
We illustrate our approach in Singapore, a city experiencing strong UHI and seeking to enhance outdoor thermal comfort. We present a field comparison and perform a sensitivity analysis to examine how building materials and vegetation properties influence Tmrt. Then, we discuss limitations of our approach, possible areas of improvement and future research directions.
4. Discussion
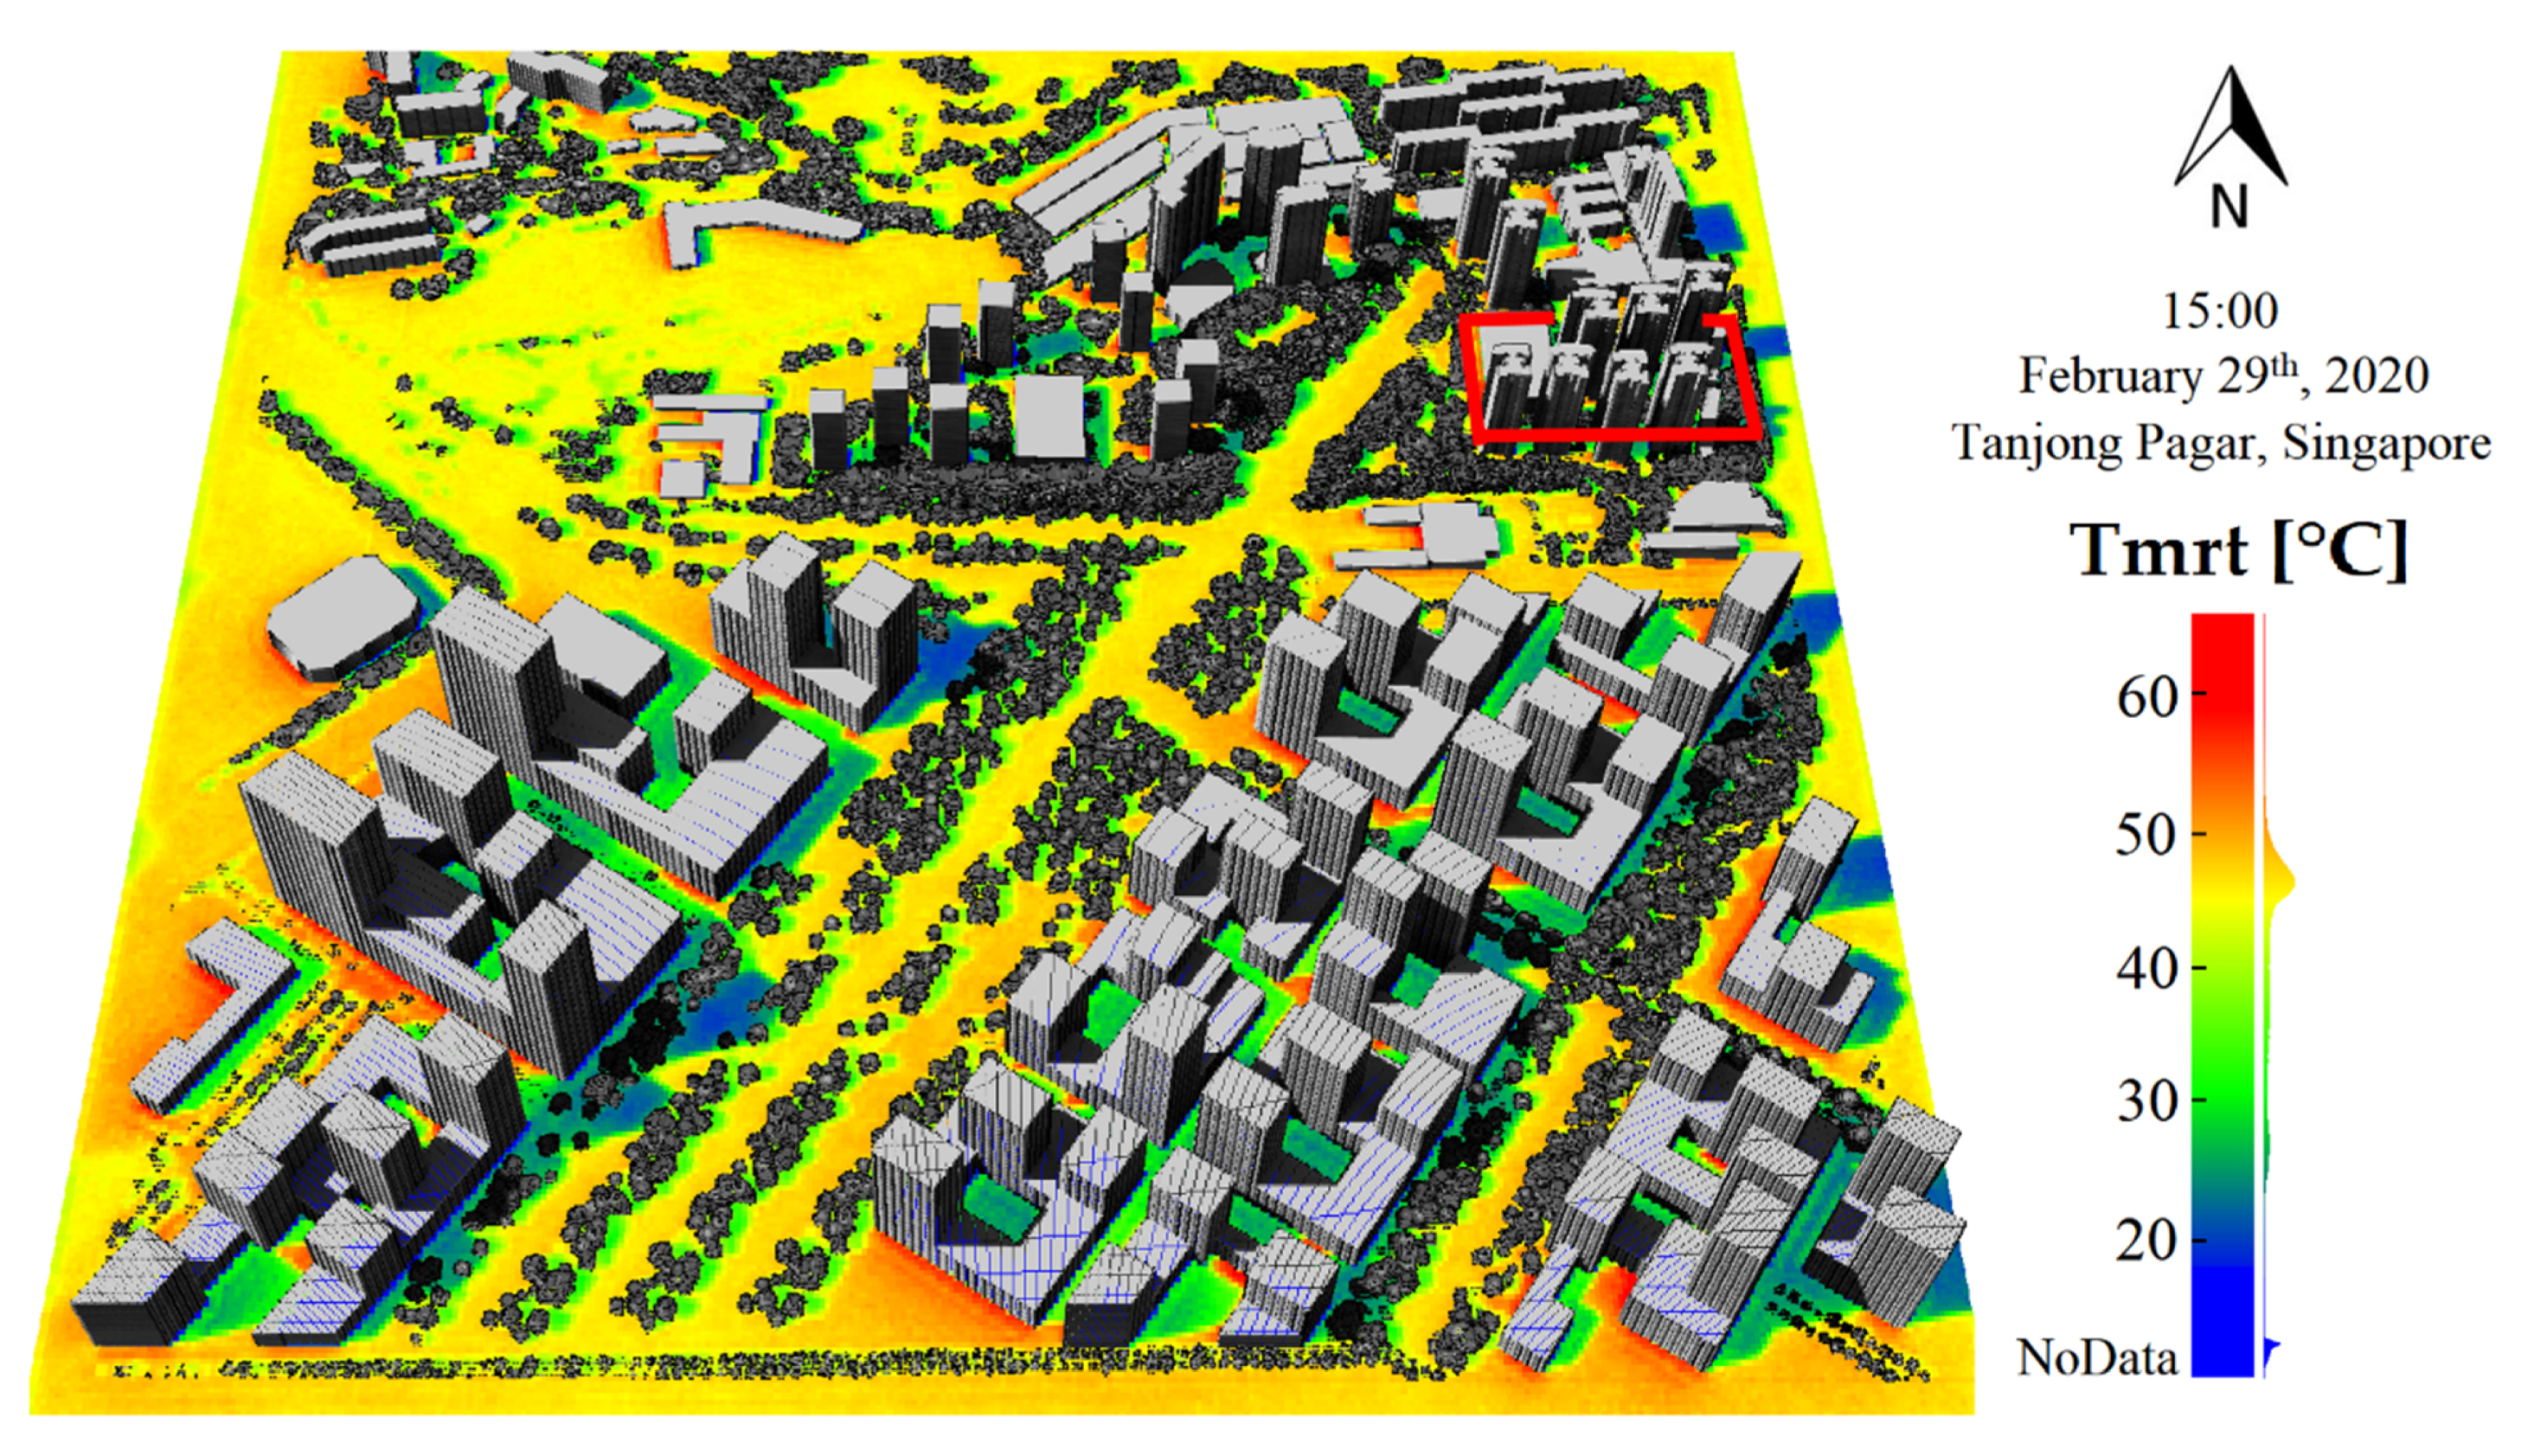
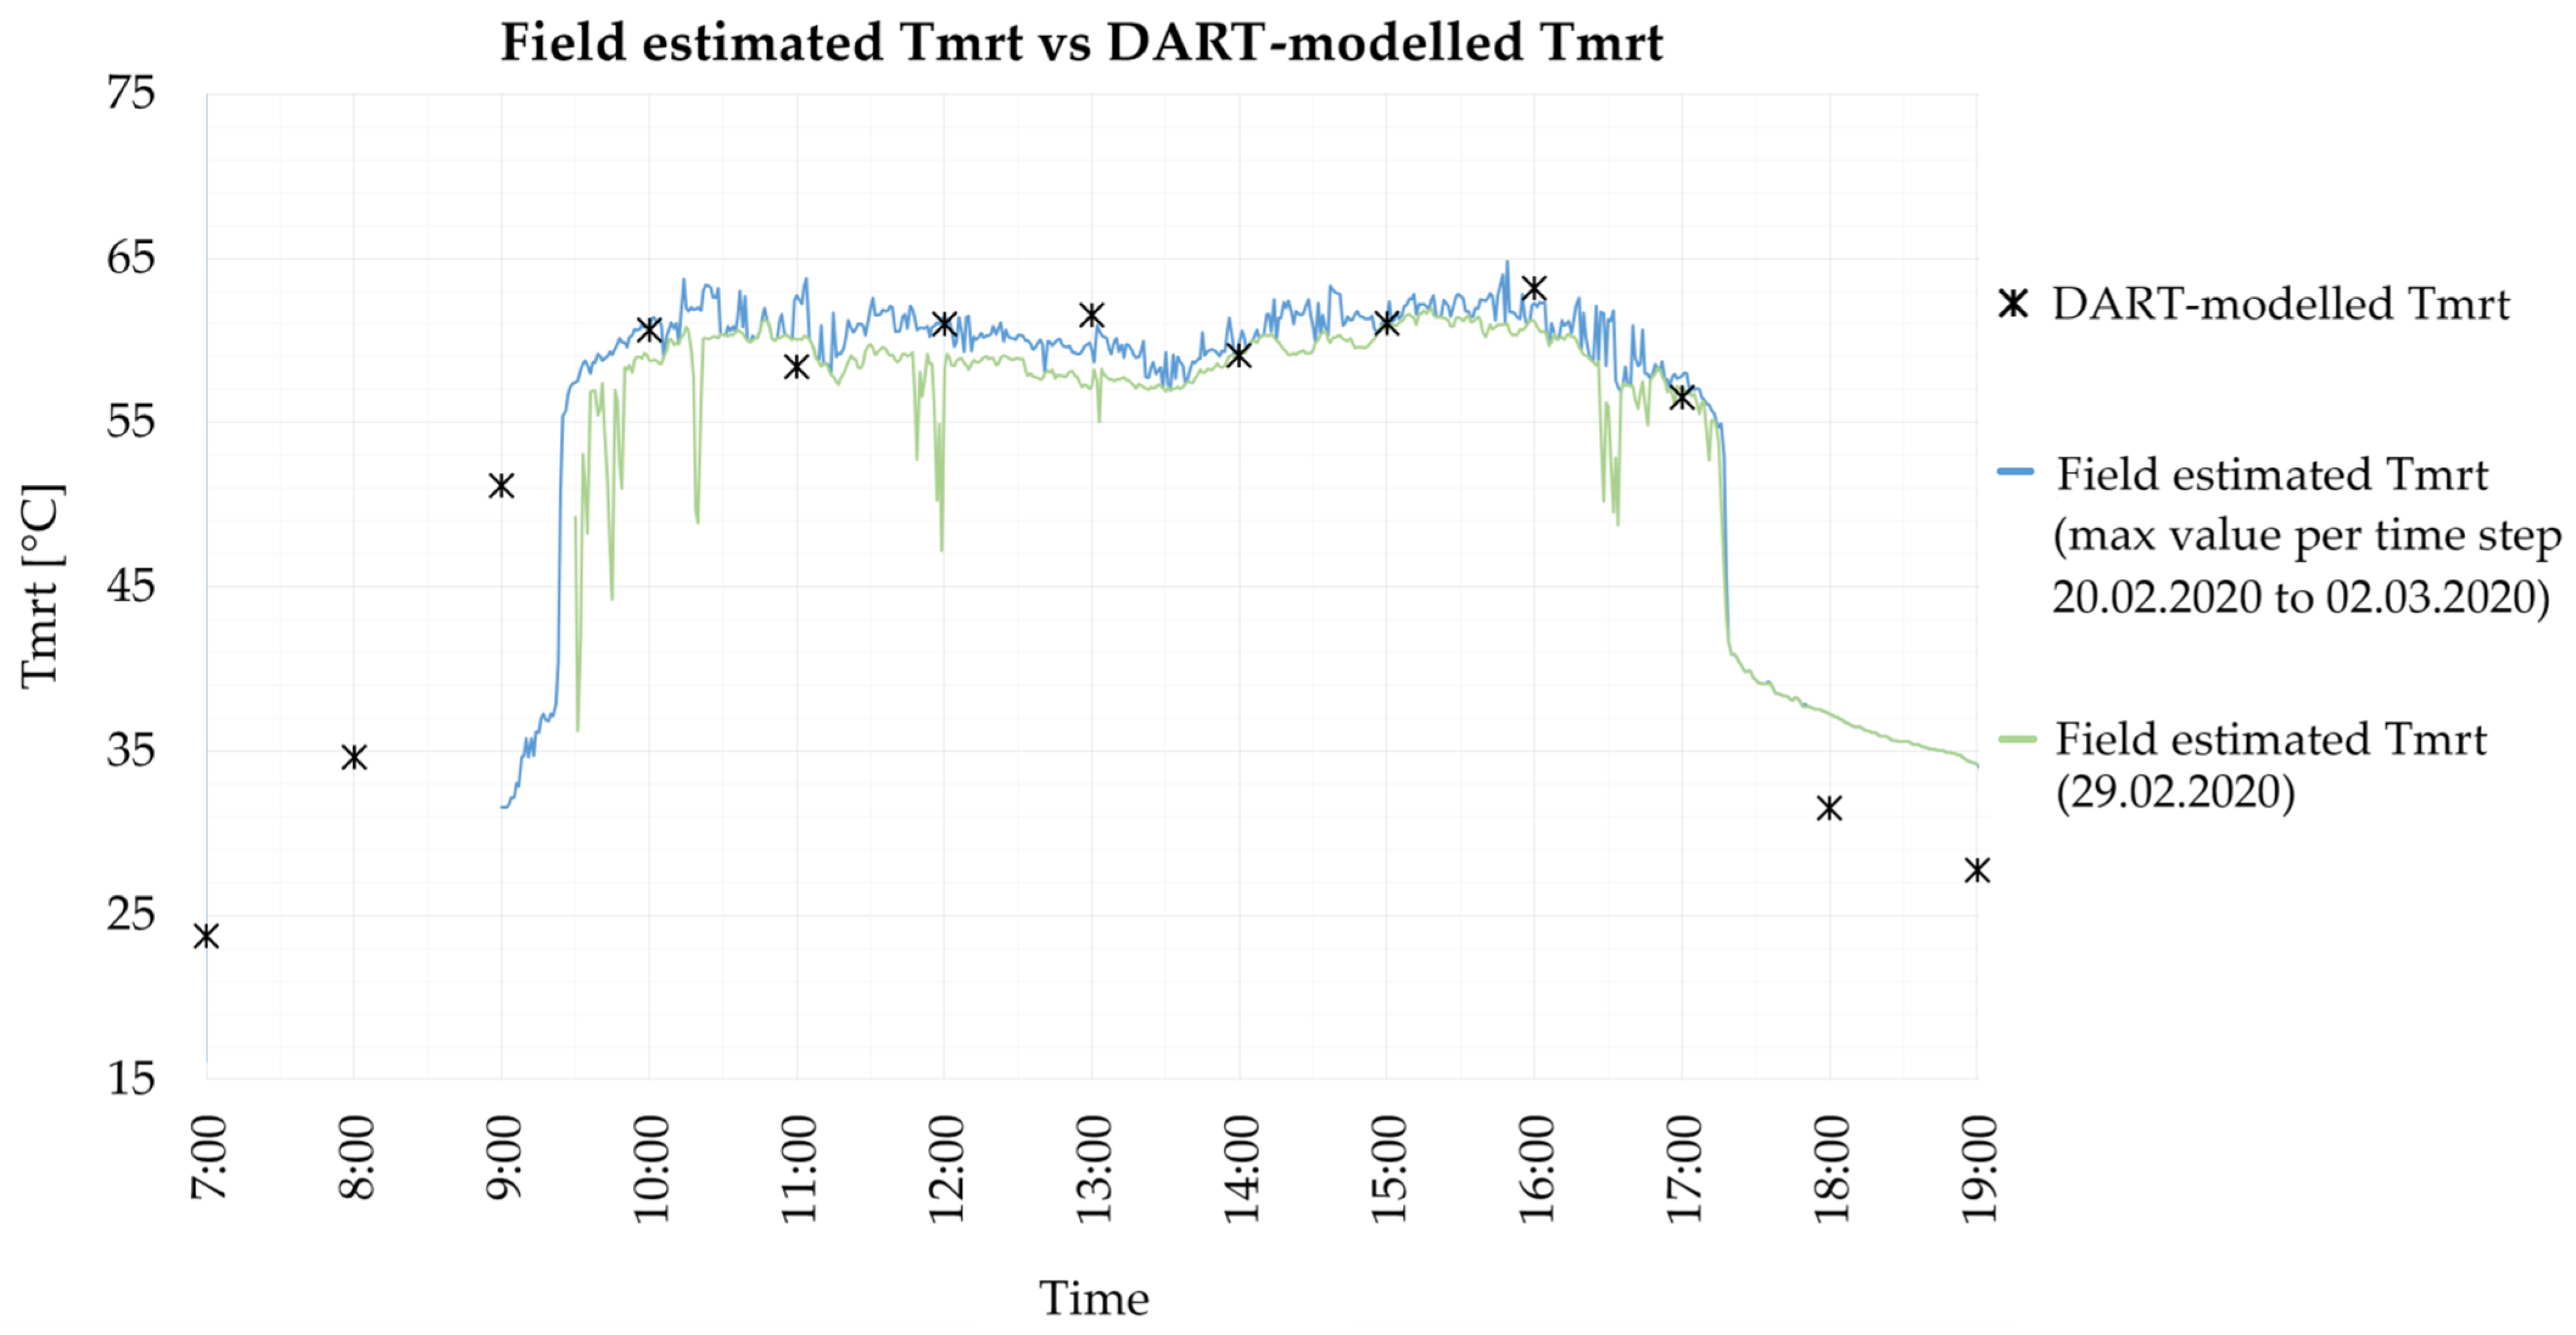
This work introduced a new method, which uses for the first time the DART model to estimate and map Tmrt at different scales. Our motivation to use the DART model to estimate Tmrt stems from its capability to assimilate a large variety of 3-D data derived from state-of-the-art remote sensing techniques; providing the possibility to better analyze how Tmrt is influenced by vegetation and its biophysical properties, by the optical properties of surface materials, by surface temperature, and also by local atmospheric conditions. The field evaluation indicated good agreement between DART-simulated Tmrt and field estimated Tmrt at the Cantonment towers measurement site. However, a substantial underestimation is observed in areas with absence of solar radiation and in the late afternoon. This might be explained by a number of considerations in which our method is based. Firstly, we assumed clear sky conditions throughout the day. This is valid as long as one seeks to map temperature extremes. However, in a tropical city such as Singapore, the presence of clouds and episodes of rain have a major impact in the actual mean radiant temperature. To give an idea of this, we plotted the field observed Tmrt under different meteorological conditions over the study period in
Figure 7. The inclusion of clouds on DART simulations has been recently explored [
45]. However, this has not been implemented in our study. Atmospheric conditions such as water content and aerosols are highly variable over the course of a day. They influence the amount of radiation reaching the ground and consequently, Tmrt. However, in the case of Singapore there is not much variation in terms of water content. The annual average of relative humidity is 84.0%. Therefore, we only included real time (local) AOD observations obtained from the NASA AERONET website for each time step simulated.
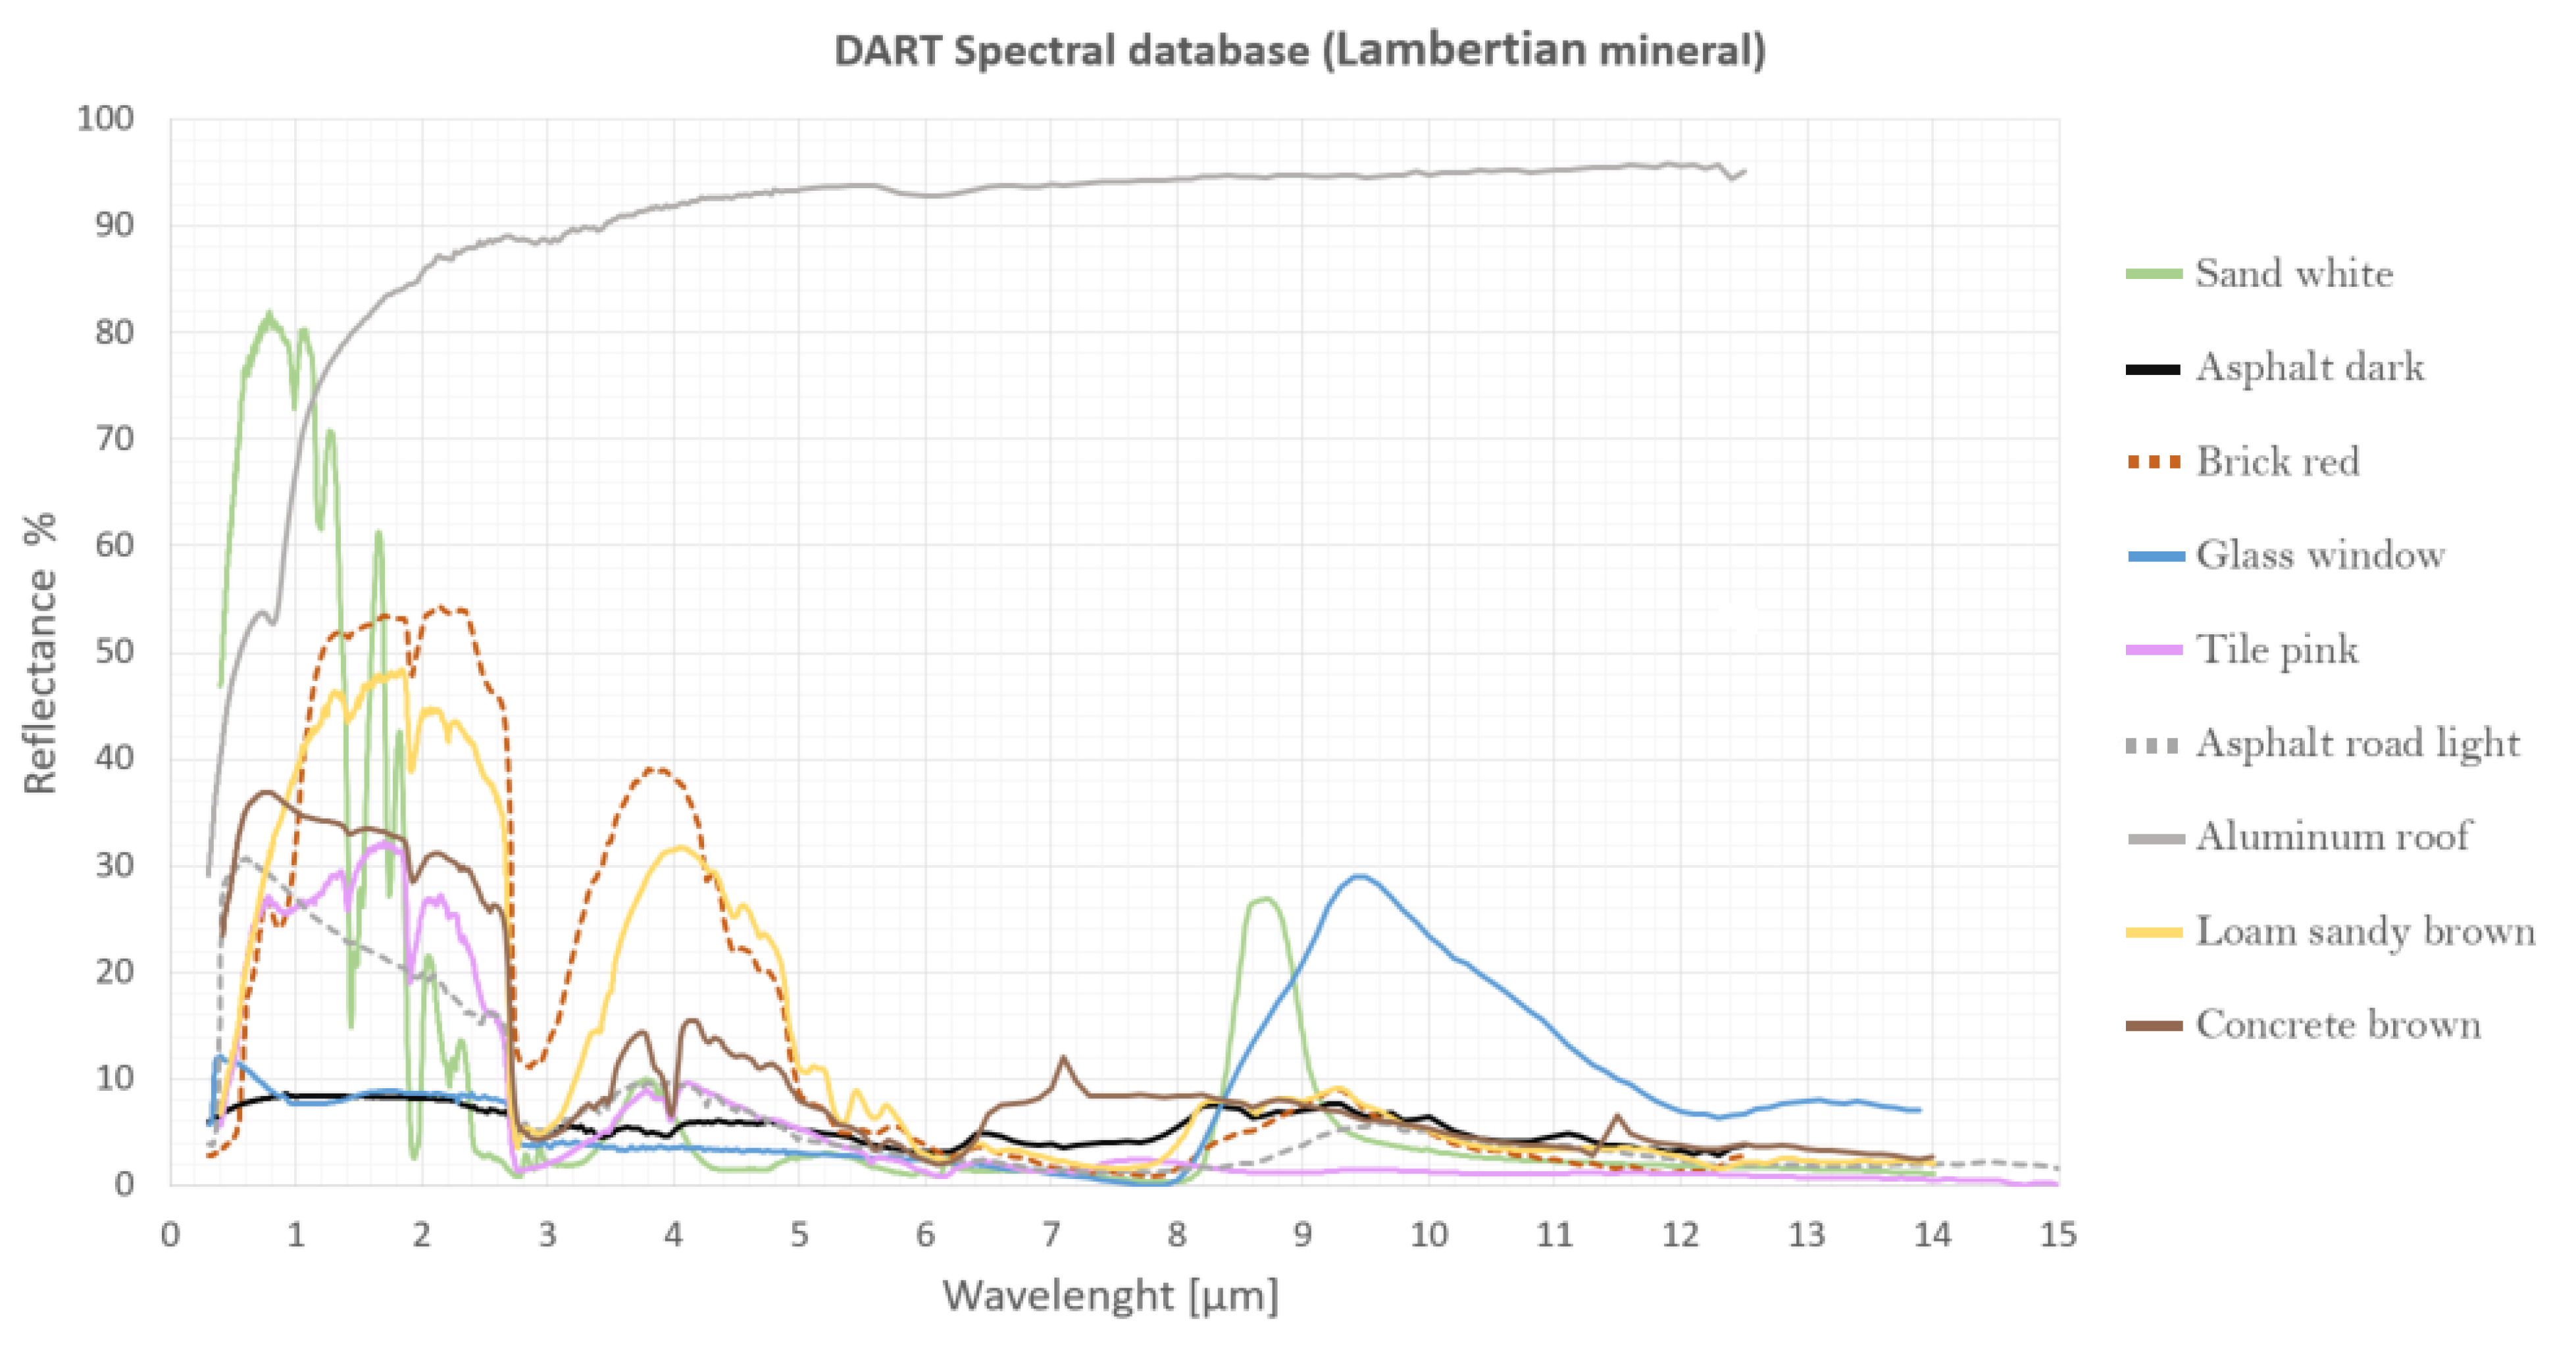
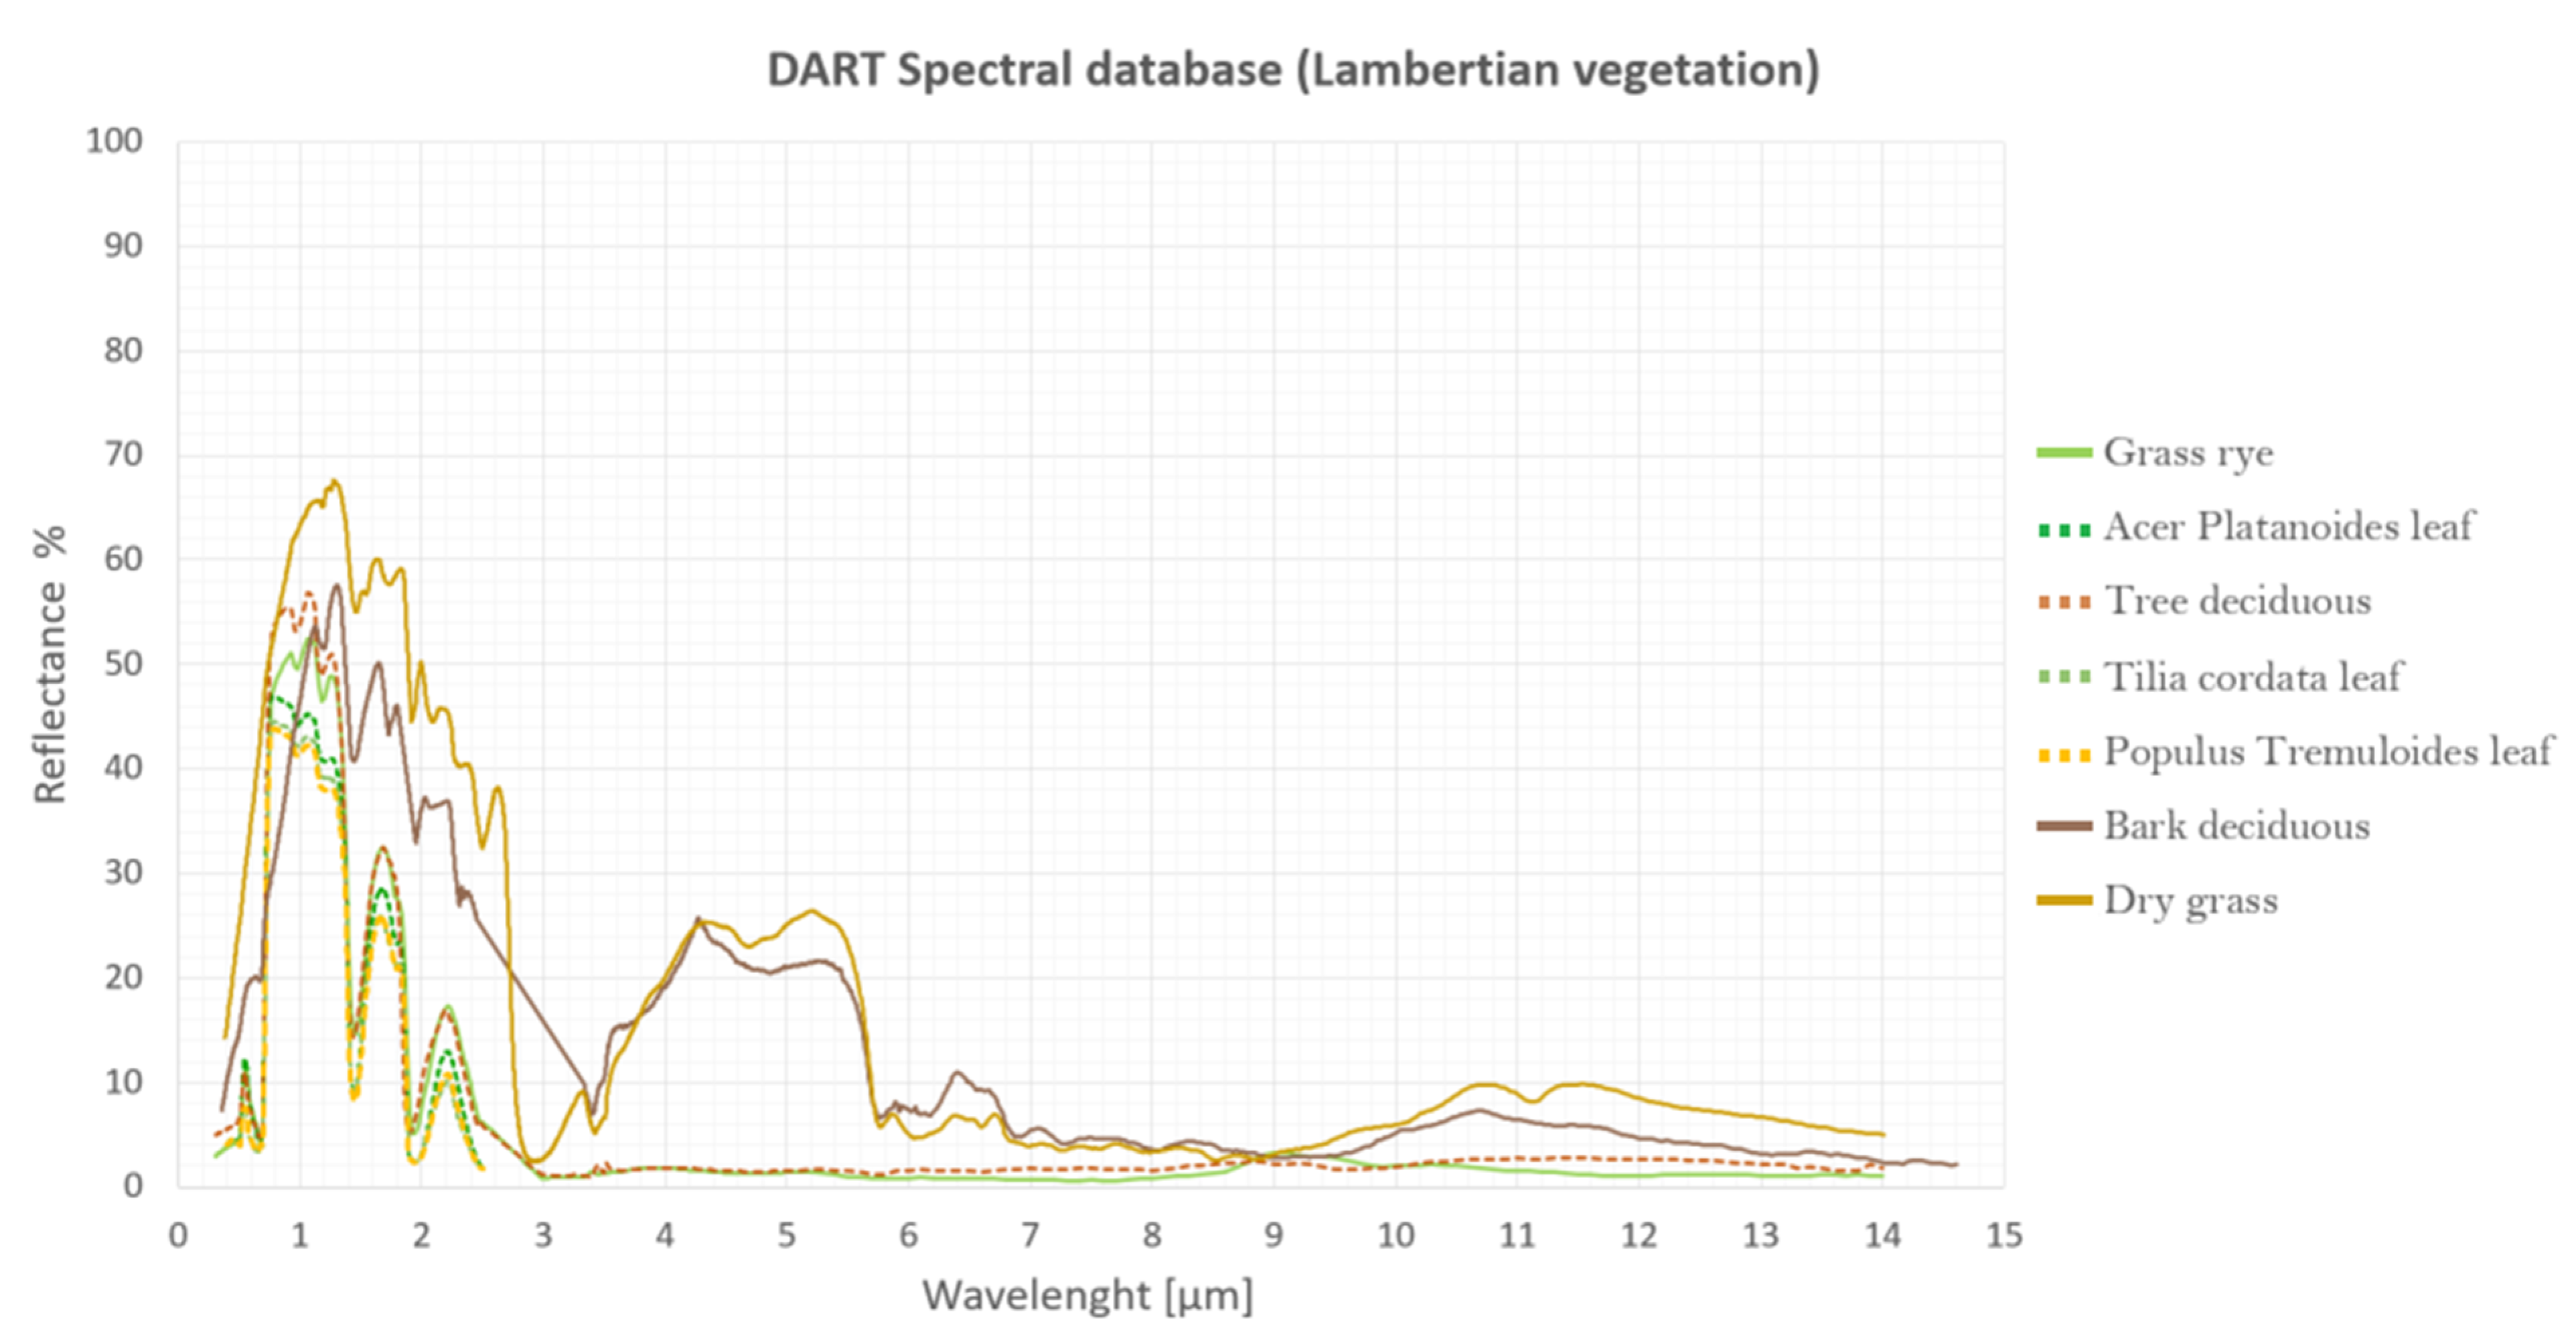
Secondly, the designation of optical properties was merely based on site inspection and matching with the closest material existing within the DART database, this, however, is a source of uncertainty since the spectral library of DART might not well represent the actual characteristics of the surfaces of our study area. An overview of the spectral signatures of construction materials and vegetation used on our simulations can be found in
Appendix D. The correct consideration of optical properties of surface materials play an important role in the radiative budget and thus, on Tmrt. To obtain a more accurate representation of optical properties, spectral signatures could be collected using a spectroradiometer and measuring the emissivity of the surfaces in the actual site. Unfortunately, we did not have access to such equipment. A detailed methodology on the derivation spectral signatures of urban materials through emittance and reflectance spectroscopy can be found in Kotthaus et al. 2014 [
46].
Thirdly, the variation of surface temperatures impacts pedestrian Tmrt, particularly in sunny conditions. This is expected since in sun hours the intensity of Tmrt is primarily driven by shortwave radiation. The influence of longwave emission tends to decrease with the distance between the emitting surface and the absorbing human body. The sensitivity analysis to changing the surface material of ground showed that the ground material greatly influences Tmrt. For instance, the maximum difference of Tmrt observed between the five materials was 7.5 °C when surface temperature = 20 °C. This difference decreases to 5 °C if surface temperature equals 60 °C. A possible reason of underestimation in the areas with no direct shortwave radiation is that the surface temperatures obtained from UT&C energy balance model were obtained considering all the hours with a cloudiness of less than 50% over the time period from 1 May 2013 to 30 April 2014. This resulted in relatively lower surface temperatures compared to the actual surface temperatures occurring on a day with no cloud cover.
Fourthly, the accuracy of LAI retrievals from indirect methods relies on the integrity of the data used and on the retrieval technique. The retrieval of biophysical properties of vegetation has received particular attention in recent years, nevertheless, important gaps still exist for example in the estimation of LAI of heterogeneous tropical vegetation and for individual urban trees [
35]. Further field investigations on the relationship between LAI and under canopy Tmrt would help to validate and improve the predictions of our proposed method. In our study over Tanjong Pagar, Singapore, a uniform LAI value was assumed for all the trees in the site. If local LAI/LAD data becomes available, for instance retrieved from ALS [
32], this information could be assimilated. Additionally, more evaluation sites are required to further assess the robustness of our method under different vegetation and urban settings, and in different climatic zones.
Finally, our method currently provides Tmrt at pedestrian level (1.5 m above the ground). Mapping 3-D Tmrt for instance on facades, balconies and elevated terraces could be possible since Tmrt is computed per vertical column of voxels of the scene. This would require to select the voxels in proximity to walls and roofs and to ignore the empty spaces where a person could not stand. Despite the advantages of using DART to perform analysis at different scales, a high level of detail over large scenes will result in long computation times. Therefore, it is crucial for the user to balance the trade-offs between scene size, level of detail and computation time. A table with examples of computation times is provided in
Table A2. With the continuous increase in computing power, this technical limitation will continue to decrease in the coming years.
5. Conclusions
The increasing availability of data of urban areas opens up new possibilities for detailed analysis in terms of urban microclimate and thermal comfort. Affordable laser scanners are being developed, opening opportunities for wide range of research on the processing and data retrieval for urban 3-D mapping. This unprecedented increase of data and computation capacity highlights the need for more detailed simulation tools and methods for planners and designers to evaluate the performance of existing areas and to assess future designs under different climatic scenarios. This study explored the potential of using the 3-D physically based RTM DART to model Tmrt. We presented a new method for the estimation and mapping Tmrt at different scales with a detailed consideration of surface materials and vegetation. The field evaluation showed good agreement between modelled and field estimated Tmrt. The impact of LAI on pedestrian Tmrt was explored as part of the sensitivity analysis. The results indicate a reduction of up to 38.2 °C Tmrt under canopy when LAI = 5.5 compared to an “exposed” setting. This highlights the importance of using accurate vegetation properties for simulations. The sensitivity analysis showed consistency across different resolutions and changing simulation parameters. We demonstrated a potential first application of our proposed method. Our approach can be used to visualize locations in need of interventions, to help to optimize climate sensitive urban design, and to support urban microclimate and outdoor thermal comfort studies when combined with adequate simulation tools for wind analysis and energy balance models.
A correct designation of surface temperatures is crucial to avoid erroneous simulations and wrong conclusions of the study. In future work, we will explore coupling our method with 3-D energy balance model such as DART EB [
47] for a more precise designation of surface temperatures and a detailed calibration of input parameters. Additional validation exercises in different urban settings and other climatic regions would contribute to improve the robustness and applicability of this newly proposed method.
Quantifying the influence of urban design, construction materials, and vegetation on Tmrt can be very helpful in order to evaluate urban planning scenarios to reduce heat stress in existing urban areas, to promote enhanced thermal comfort in future developments and to contribute in reducing the energy consumption for cooling systems. Future research could, for instance, explore the effect of building morphology and urban patterns; which species to plant and their optimal spatial arrangement such as in street-tree scenarios; as well as the effect of construction materials on Tmrt by using the existing DART spectral database or by adding the actual spectral information of the materials found on the site of interest.
