Article

The InflateSAR Campaign: Testing SAR Vessel Detection Systems for Refugee Rubber Inflatables

1
Department of Computing Science, Carl von Ossietzky University of Oldenburg, Ammerländer Heerstraße 114-118, 26129 Oldenburg, Germany
2
Institute for Applied Photogrammetry and Geoinformatics, Jade University Oldenburg, Ofener Str. 16/19, 26121 Oldenburg, Germany
3
Department of Biological and Environmental Sciences, University of Stirling, Stirling FK9 4LA, UK
4
Institute for AI Safety and Security, German Aerospace Center (DLR), Rathausallee 12, 53757 Sankt Augustin, Germany
5
Faculty for Humanities and Cultural Sciences, Otto-Friedrich-University of Bamberg, Am Kranen, 96045 Bamberg, Germany
*
Author to whom correspondence should be addressed.
Remote Sens. 2021, 13(8), 1487; https://doi.org/10.3390/rs13081487
Submission received: 15 March 2021 / Revised: 1 April 2021 / Accepted: 2 April 2021 / Published: 13 April 2021
(This article belongs to the Section Ocean Remote Sensing)

Abstract

:
Countless numbers of people lost their lives at Europe’s southern borders in recent years in the attempt to cross to Europe in small rubber inflatables. This work examines satellite-based approaches to build up future systems that can automatically detect those boats. We compare the performance of several automatic vessel detectors using real synthetic aperture radar (SAR) data from X-band and C-band sensors on TerraSAR-X and Sentinel-1. The data was collected in an experimental campaign where an empty boat lies on a lake’s surface to analyse the influence of main sensor parameters (incidence angle, polarization mode, spatial resolution) on the detectability of our inflatable. All detectors are implemented with a moving window and use local clutter statistics from the adjacent water surface. Among tested detectors are well-known intensity-based (CA-CFAR), sublook-based (sublook correlation) and polarimetric-based (PWF, PMF, PNF, entropy, symmetry and iDPolRAD) approaches. Additionally, we introduced a new version of the volume detecting iDPolRAD aimed at detecting surface anomalies and compare two approaches to combine the volume and the surface in one algorithm, producing two new highly performing detectors. The results are compared with receiver operating characteristic (ROC) curves, enabling us to compare detectors independently of threshold selection.

Graphical Abstract

1. Introduction

The ongoing humanitarian crisis in the Mediterranean Sea still sees refugees risking their lives in small rubber inflatables in their desperate attempt to flee from terror, rape, and persecution. Human traffickers pack these rubber inflatables with people and let them debark on a—at least—250 km journey to Europe. However, the overcrowded rubber boats are not seaworthy and cannot withstand the situation on the open sea. With our research, we want to test and validate the detection capabilities of satellite-based imaging radar to contribute to search and rescue efforts. In 2017, we collected the first Synthetic Aperture Radar (SAR) database of such 12 m × 3.5 m × 0.5 m (l/w/h) rubber inflatables using a lake as a test-bed. In a previous paper, we proved that under these simplified circumstances the visual identification of this target is possible and feasible, reaching visual identification rates of over 80% [1]. The study showed that the identification capabilities do greatly depend on several different sensor and scene parameters such as the vessel’s speed and heading and the local wind conditions.
To save precious time, some degree of automation in the detection process is very helpful when it comes to the processing of large amounts of data. For disaster mitigation applications, a semi-automatic approach where a human-based verification follows a code-based detection increases the results’ reliability. To pave the way to a semi-automatic detection workflow and infrastructure especially tailored for refugee inflatables, we test and benchmark an array of automatic vessel detection systems (VDS). We bring together different detection methodologies with a wide range from intensity-based detection to polarimetric approaches and a sub-look detector.
One of the most prominent intensity-based detectors is the Cell Averaging-Constant False Alarm Rate (CA-CFAR) detector, which searches for intensity anomalies with stronger backscattering than the surroundings. The main object’s properties that impact the intensity values of a SAR image are the following: surface roughness, the dielectric constant of the material, and the presence of corners (or large scale roughness). The CA-CFAR is highly usable for ship detection since ships are expected to have a relatively large backscattering compared to the background sea clutter [2]. CA-CFAR adaptively changes the threshold to fix the probability of false alarms throughout the dataset [3]. Polarimetric SAR (PolSAR) has been demonstrated to be very useful to identify objects by decomposing their radar return [4]. In this work, we tested the Polarimetric Match Filter (PMF; [5]), the Dual-pol Ratio Anomaly Detector (DPolRAD; [6]), the Geometrical Perturbation Polarimetric Notch Filter (PNF; [7]), a reflection symmetry detector (referred to as PolSym; [8]) and the polarimetric entropy detector (we call it here PolEntropy; [9]). Finally, spectral analysis was shown to be useful for ship detection. [10,11,12,13] developed detection techniques which exploit diversity in frequency and are called sub-look detectors. In this work, we applied the sub-look cross-correlation detector (abbreviated with SubCorr).
To begin, Section 2 delivers an overview of approaches and techniques developed for maritime object detection with SAR in recent decades with special concern for the state of the art of vessel detection. We open Section 3 with the description of the seven VDS we tested and evaluated together with a new variant of the iDPolRAD we want to introduce. Furthermore, we provide a short introduction to detection theory and to receiver operating characteristic (ROC) curves which is the visualization method we chose for our results. The results of the different detectors’ capabilities for small rubber inflatables are presented in Section 4. From tests we try to highlight their detection capabilities and try to interpret their reliability before the background of different sets of sensor and scene parameters. The paper closes with a discussion and a conclusion section.

2. Vessel Detection Systems: Developments, Approaches and Methods

SAR is still the leading technology for maritime monitoring. Furthermore, it is especially valuable for disaster monitoring, response and mitigation because of its all-day and all-weather capabilities [2,3]. Furthermore, SAR is the preferred sensor for ship detection from space because the achievable resolutions match ship sizes and it can cover comparatively wide areas. Consequently, there is a great number of research and literature on SAR ship detection. The challenges for a successful detection of maritime vehicles on the open ocean with SAR imagery have remained the same since its beginnings: small, moving vessels made from non-conductive materials are hard to detect. Ship classification and identification is even more difficult. Rough sea conditions and local winds can produce false alarms which are hard to remove. Furthermore, SAR imagery is subject to intrinsic noise (speckle) and a coherent coverage of large areas with a reasonable spatio-temporal resolution have not been realized so far with only the few dozen SAR satellites that exist now.
Comparable research on the detection of small, non-metallic maritime vehicles with SAR is scarce. Marino et al. show that small fishing boats made of fiberglass are hard to detect without ultra-high resolution SAR imagery [14,15]. Other research revealed that the Radar Cross Section (RCS) of non-metallic vessels (e.g., wooden) is much smaller than comparably-sized metal made ones and a reliable detection with SAR is hard to provide [16,17]. Gao and Shi used Along Track Interferometry (ATI) SAR data to successfully detect small vessels [18]. Recently, deep learning algorithms for small ship detection emerged with the drawback of high computational cost and the need for training data support [19]. Liu et al. [20] developed and tested a new polarimetric detector for small ships most recently. This algorithm was constructed using the differences between depolarization power and total power, as well as the difference between double-bounce scattering and surface scattering.
Single channel (single-pol) ship detectors exploit the fact that the radar cross section of maritime vehicles is in general higher than the one from the sea [21,22,23]. This assumption limits the detection to maritime vehicles with a high Target to Clutter Ratio (TCR). One of the first detecting techniques was a simple moving window adaptive thresholding to guarantee constant false alarm rates [24,25]. For the modelling of high resolution sea clutter backscattering a compound distribution model, such as the compound K-distribution, is well suited [26]. This is because the backscattering of the sea fluctuates quite rapidly due to waves and other phenomena [27]. Ref. [28] proposed CFAR to be used with various distributions of background statistics. H. Greidanus et al. developed the Search for Unidentified Maritime Objects (SUMO) algorithm which is a pixel-based CFAR detector for multilook radar images [29]. New CFAR developments consider object-based approaches [30] and a CFAR without any sliding window for multitarget situations based on variational Bayesian inference for very complex backgrounds [31].
The development of multichannel SAR (dual and quad-pol modes) enabled more sophisticated methods which explore and combine more than one feature, such as SAR polarimetry (PolSAR; [32]). An advantage of PolSAR techniques is that they are less affected by heterogeneity of sea surface [29]. A first approach to exploit polarimetric information is statistical. Additionally, it opens a spectrum of ways to decompose the polarimetric channels’ information into different combinations of backscattering mechanisms (e.g., [32,33,34]) occurring at the vessel and the surrounding water surface and to use them as distinctive feature [35,36,37,38]. The list below mentions several popular PolSAR concepts:
  • Model-based approaches such as the Generalized Likelihood Ratio Test (GLRT, such as in [39]) were successfully tested. Both can better handle rough sea states than the CFAR through improved false alarms rejection [40]. Liu et al. [41] proposed the GLRT methodology where the statistics for the sea are considered normal distributed and the covariance matrix of the target is unknown.
  • The Generalized Optimization of Polarimetric Contrast Enhancement (GOPCE, [42]) tries to identify the highest contrast through measuring the similarity in the scattering behaviour of an arbitrary target with a plane and a dihedral target.
  • The polarimetric reflection symmetry detector relies on the concept that surfaces have reflection symmetry and therefore a very low magnitude of the C12 element of the covariance matrix (complex inner product between the co- and the cross-polarized channels). On the other hand, it can be assumed that complex scatterers such as ships are likely to not own particular symmetric properties [8,43,44].
  • The Geometrical Perturbation Polarimetric Notch Filter (PNF) was proposed by [7] and further improved [45]. It is based on the idea of isolating the full-polarimetric return coming from the sea and detecting anomalies with different polarimetric signatures depending on orientation, material and structure of the vessel. The PNF approach focuses on targets lying in the complement orthogonal subspace of the sea vector. It was later picked up by [18] who tested it with ATI-SAR data.
  • The Polarimetric Match Filter (PMF), developed by [5], was picked up several times since (e.g., [42]). It intends to enhance the contrast between the covariance matrices of the clutter and the vessel over different scattering mechanisms. The algorithm returns the scattering mechanism that optimizes the diversity providing the highest contrast possible. In that very same publication Novak further describes the Polarimetric Whitening Filter (PWF) which uses the trace to minimise the speckle which will facilitate detection and the Optimal Polarimetric Detector (OPD).
  • Ref. [14] derived the entropy detector from the Cloude–Pottier decomposition [46] to quantify the possible dominance of one scattering mechanism over the others in small fishing boats at low incidence angles. In [9] the polarimetric entropy detector was as well used for ship detection at low incident angles.
Sub-look detectors follow a different methodological way which is based on the spectral analysis of single-look SAR data to extract the spectrum and analyse portions (sub-looks or sub-apertures) of it. This enables the detection of vessels which are correlated between looks before the background of an uncorrelated sea surface [11,12]. Through the attenuation of that uncorrelated radar returns the water surface’s clutter can be reduced while preserving the vessels’ signals, leading to a higher TCR. This method is combined with a variety of approaches, each named after the distinctive feature it uses: the sub-look entropy detector [47], the sub-look coherence detector [47], the sub-look cross-correlation detector [13,48], sub-look algorithms exploring variances of the phase [49,50] and sub-look detectors based on the GLRT [51]. In this way it is possible to enhance the TCR with the drawback of reduced spatial resolution according to the number of sub-looks employed [52].
Finally, the discrete Wavelet Transform (WT) takes advantage of differences in the statistical behaviour of the vessel and the water surface clutter. It increases the TCR by noise reduction through the addition of the mean and detected edges in different directions [22].
Given that the object is visible at all, we have to deal with typical issues in radar images such as azimuth displacement (“train-off-the-track effect”) triggered by object movement in range direction and explained by the Doppler effect. Dual channel Ground Moving Target Indication (GMTI) techniques have been developed to improve the detection of moving objects and even using their movement as an identification feature [53]. Among them are the classical approaches Displaced Phase Center Antenna (DPCA; [54,55]) and ATI-Along-Track Interferometry [56], as well as promising adaptive techniques such as extended DPCA (EDPCA; [57]) and Imaging Space-Time Adaptive Processing (ISTAP; [58]). Ref. [18] combined ATI with notch filtering and later [59] introduced Oceanic DPCA (ODPCA), an extension of DPCA where the statistics of the open ocean’s water surface in ATI-SAR data are taken into account for modelling. [60] designed a new ATI detector based on the complex interferometric dissimilarities in dual-channel data. Another well-known problem are azimuth ambiguity patterns which are image artefacts appearing as a weaker repetitions (’ghosts’) of a strong discrete scatterer shifted at a fixed distance in azimuth [61]. They can be caused by bright objects on land near the coast as well and much research was done to tackle this problem (e.g., [35,62,63]). Ref. [29] proposes to label them as recurrent false alarms if repeat-pass images are available.
Furthermore, moving maritime vehicles can be detected in an indirect way via the turbulent wakes and kelvin wakes they produce when in motion [21,64]. That approach is often used in combination with GMTI techniques. [65] investigated the influence of different environmental conditions such as sea state or local wind, ship properties such as ship speed or ship heading, and image acquisition parameters such as incidence angle or satellite heading on the probability of detection with SAR. New approaches are radon transform for wake component detection [66], the generalized minimax concave (GMC)-based method [67] and enhancement of detection using Cauchy distribution [68].
With increasing computational power and growing data resources available, ship detectors have been developed in the pattern recognition community. However, many of the traditional methods such as region selections, e.g., scale-invariant feature transform (SIFT), and histogram of oriented gradients (HOG), and classifiers, e.g., support vector machine (SVM) have a high computational cost. With deep learning, time performance increased since it directly taps GPU power [69]. Different approaches using convolutional neural networks (CNN) (e.g., [19]) began to evolve rapidly and we see different deep learning models for object detection: the region proposal classification (R-CNN; [70]) and the sliding window. R-CNN was followed by fast R-CNN [71] and faster R-CNN [72,73], reducing complexity and increasing performance by directly using the softmax function instead of SVMs and introducing Region of Interest (ROI) polling. Other approaches such as YOLO [74] and YOLOv2 try to embrace the whole image during the training and testing period [69]. Refs. [75,76] proposed the integration of contextual-based CNNs with deep architecture and the pixel-based multilayer perceptron (MLP) with shallow structures suitable for high resolution satellite imagery.
In our goal to identify reliable and robust detection algorithms for refugee rubber inflatables we evaluated a selection of intensity-based, polarimetric and sub-look VDSs for our special maritime vehicle. We could not use genetic algorithms, neural networks or deep learning algorithms due to the extremely limited amount of training data. Nor did we test wake detection or GMTI techniques for this paper because the target was mostly stationary.

3. Data and Methods

Our data collection covers a broad variety of combinations of different scene settings and sensor settings in comparably calm wind and water surface conditions of a small lake near Berlin. The test inflatable used in our campaign is an original refugee rubber boat, recovered from the central Mediterranean Sea (see [1]).
Our special target (Figure 1) is made of thin inflated rubber tubes which are parted into five chambers. The wooden parts form the floor and the transom where the outboard engine is attached to. Its roof is flat, it has no bilge or under water body and even when fully occupied has virtually no draught.
The majority of this work focuses on single-pol and dual-pol data from the TerraSAR-X mission operated by the German Aerospace Center (DLR) with High-Resolution SpotLight (HS) and StripMap (SM) modes (Table 1). Cross-pol data was only available in SM dual-pol mode. Quad-pol observations were not accessible for us at all so we had to adapt the detection algorithms accordingly. In addition, we run tests on a small collection of four dual-pol VV/VH datasets from S1’s Interferometric Wide Swath (IW) mode acquired during the campaign.
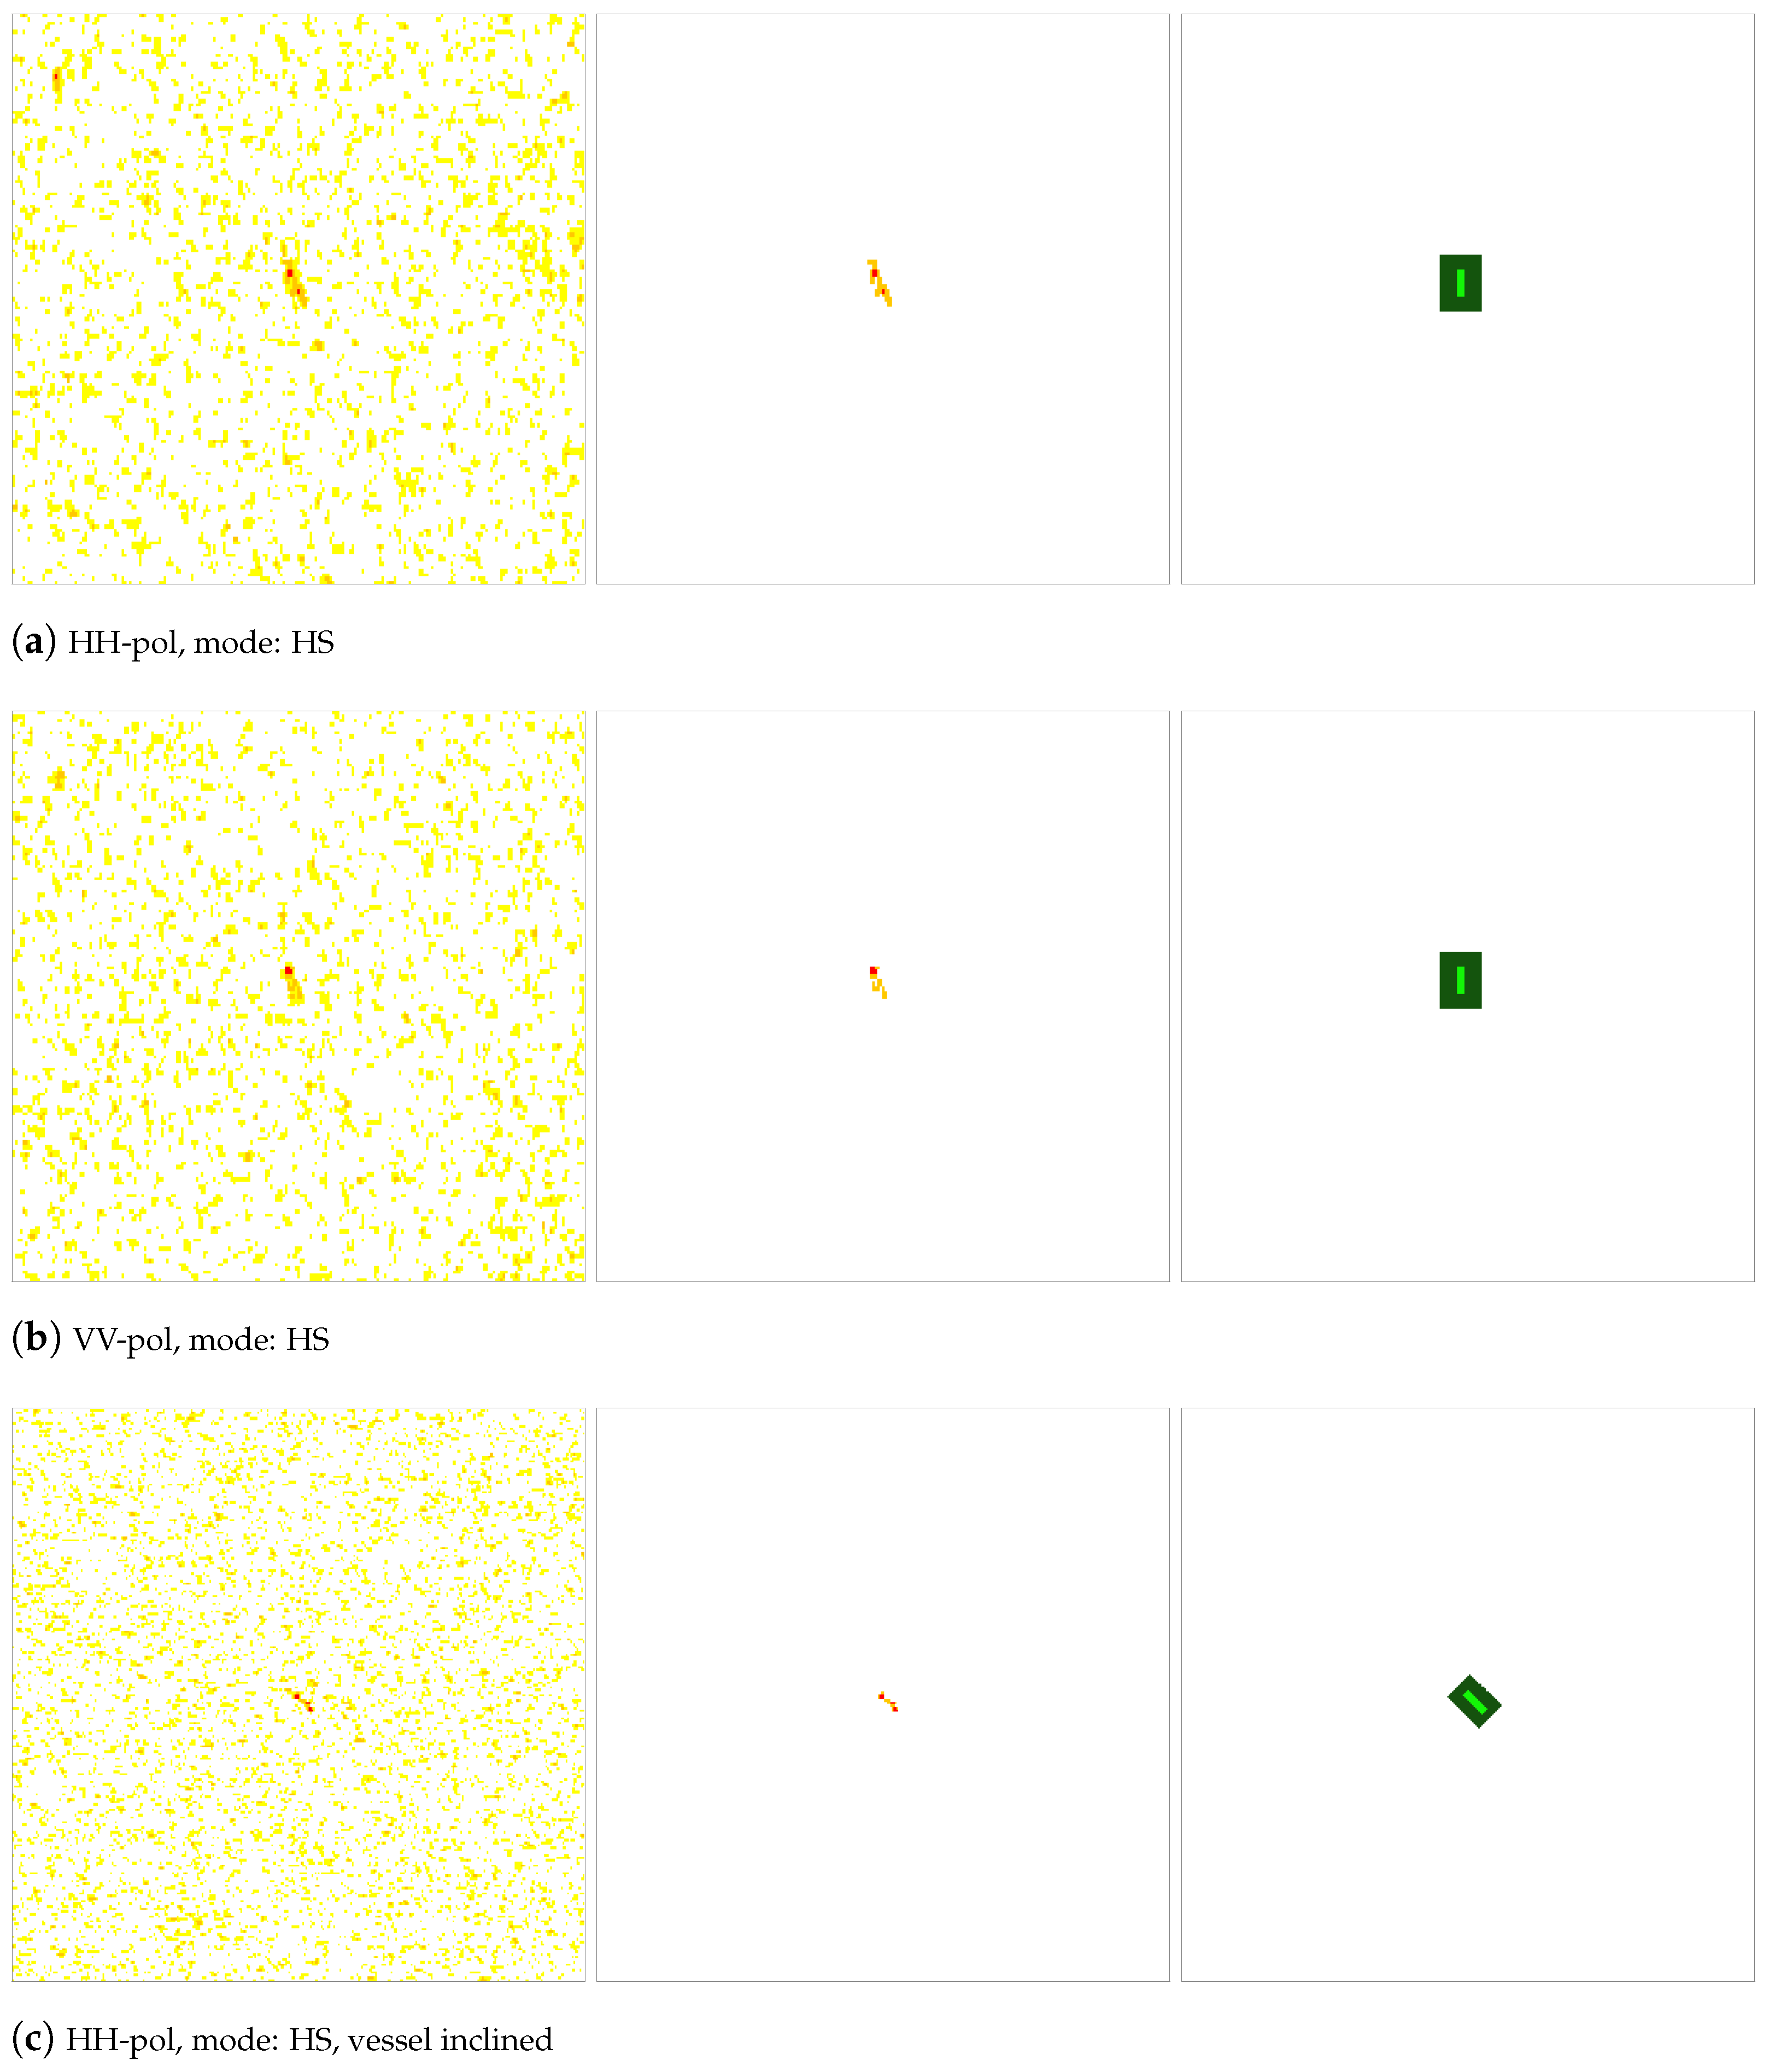
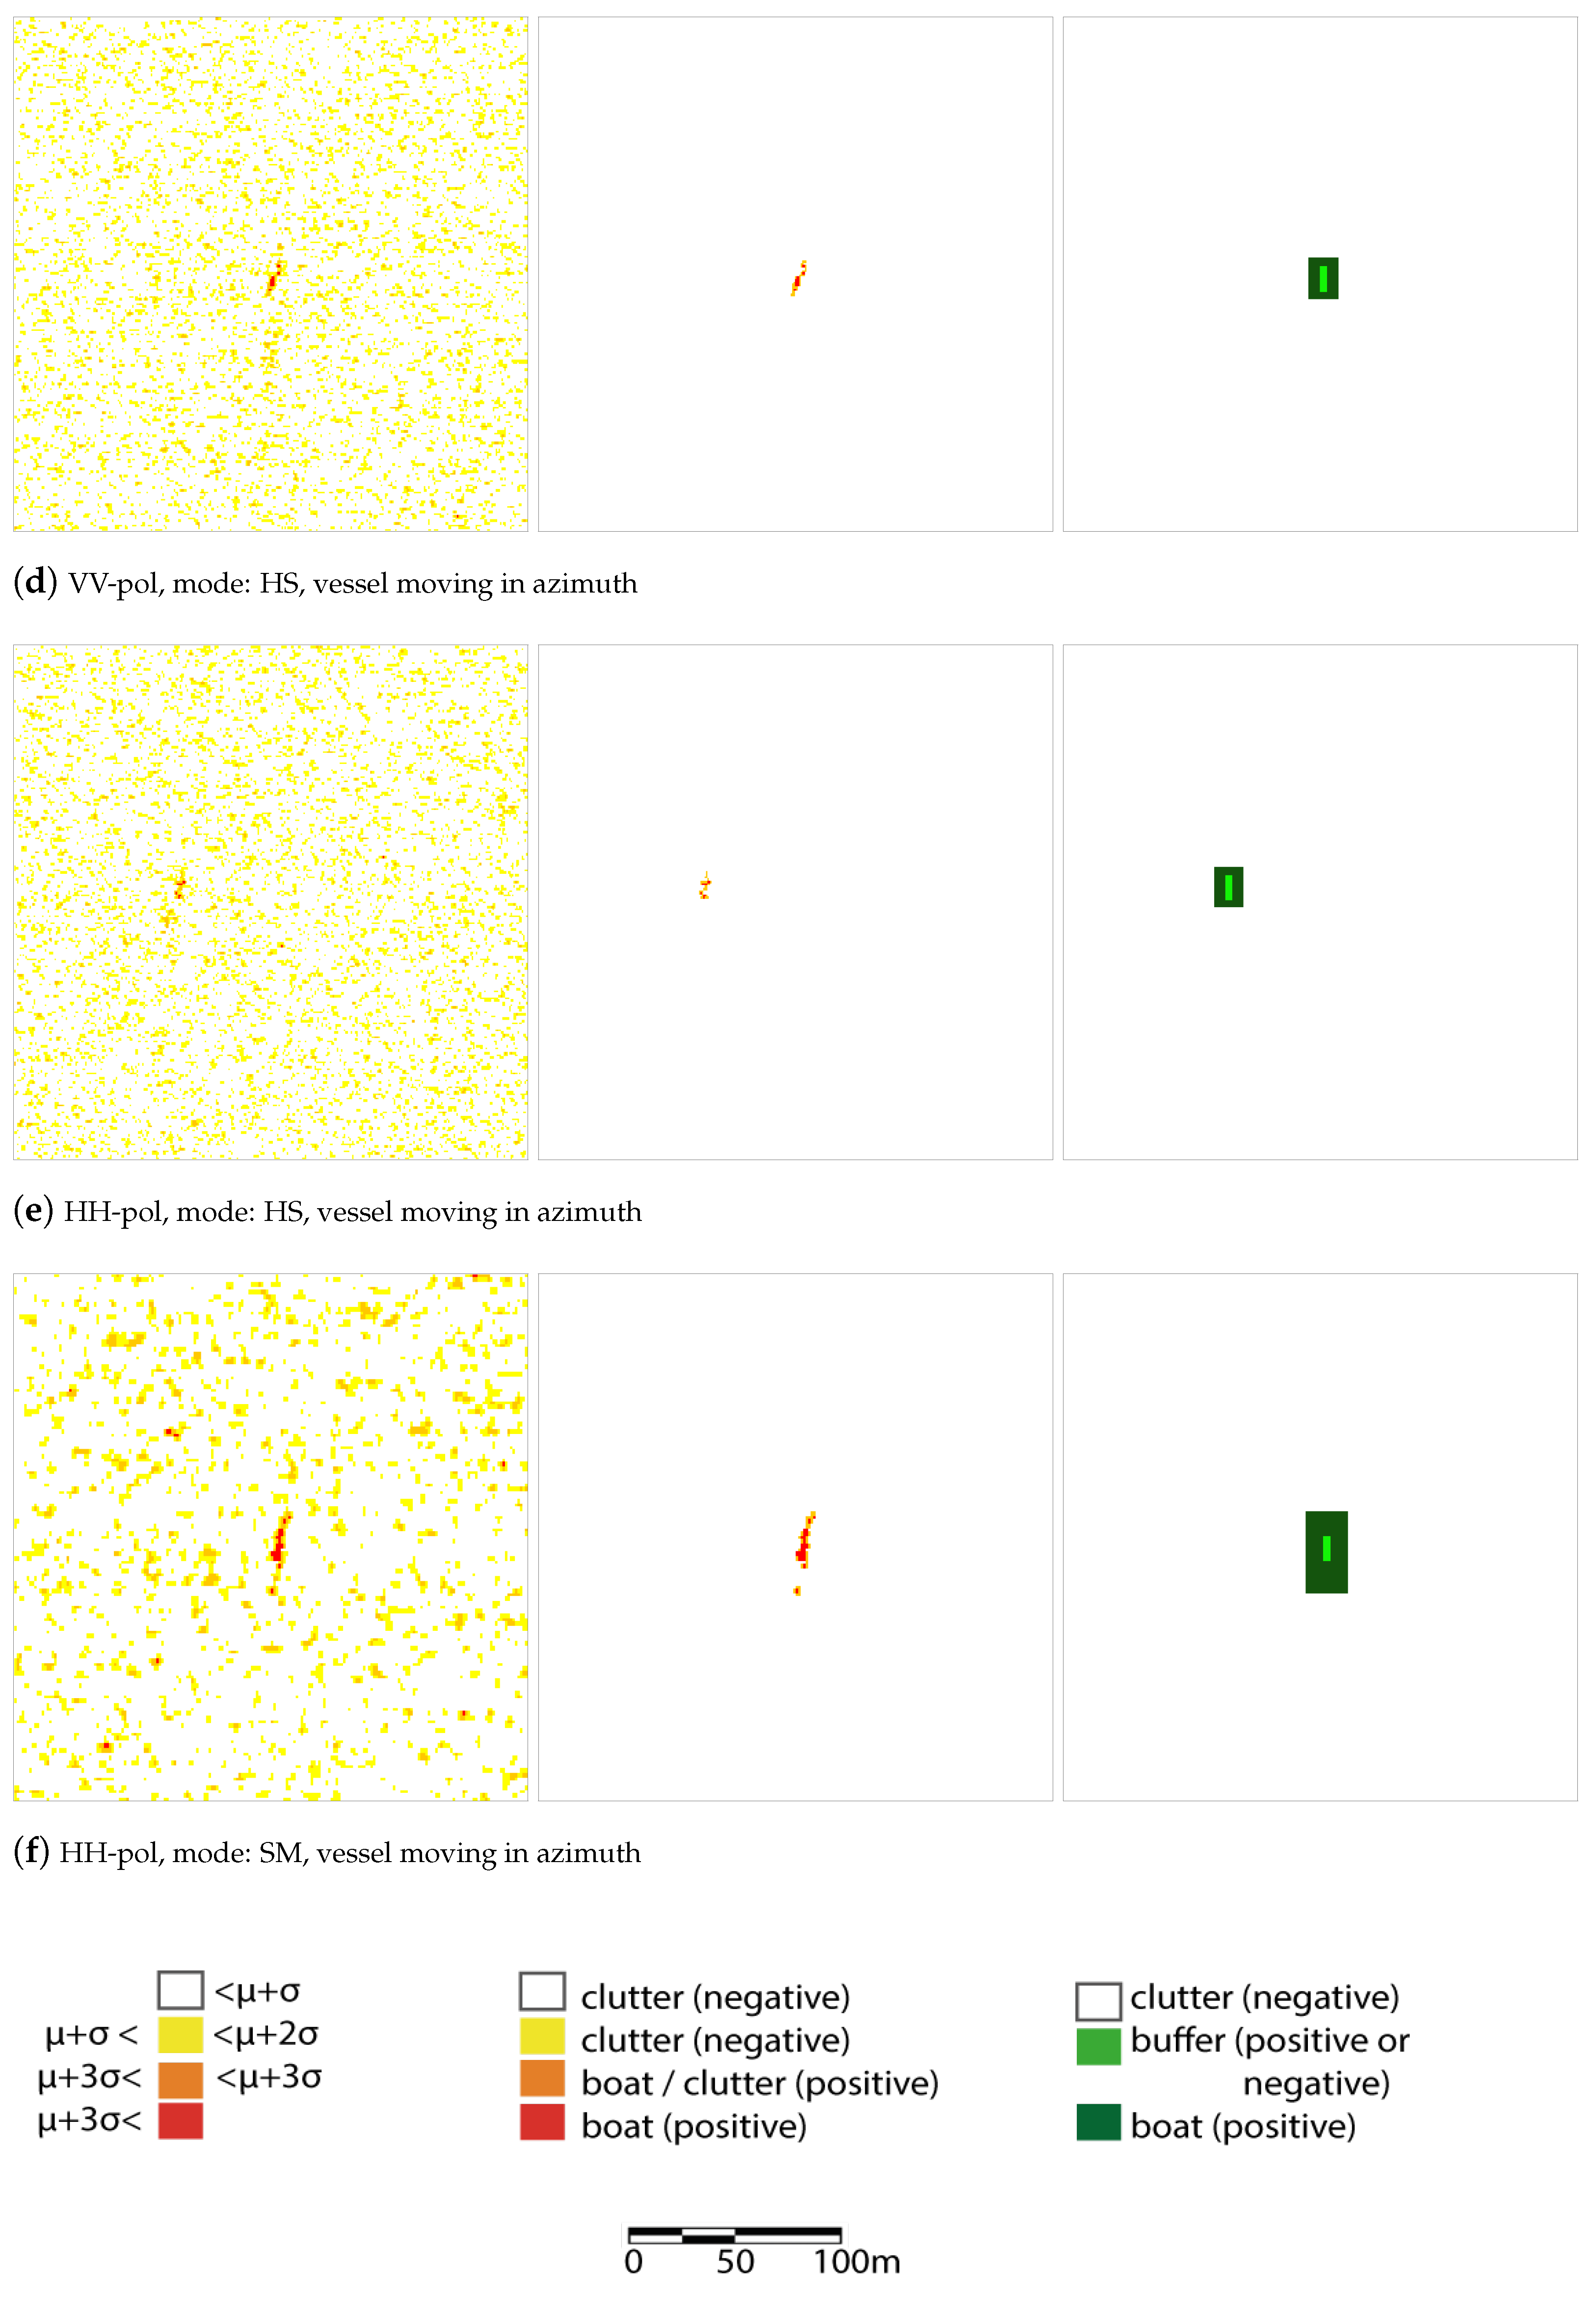
To visualize and compare the detectors’ performance we use the binary classification scheme called Receiver Operator Characteristics (ROC) curves. The ROC curve is created by plotting the true positive rate (TPR) against the false positive rate (FPR) at various threshold settings. The detector under test’s finding for each threshold is validated against the sea truth mask. To perform pixel-based and object-based validation we used two different way of counting true positive pixels. We created two sea truth masks for each of the SAR datasets. Figure 2 shows a series of example sea-truth masks for both the pixel-based and the object-based approach. In the pixel-based masks we select every pixel within a small distance to the boat’s real position with an intensity higher than the mean plus two times the standard deviation of the local clutter. Every pixel is then evaluated separately. Whereas for the object-based approach, we set all pixels to true within a rectangle of about 12 × 3.5 m plus an optional buffer zone of about 10m to compensate for GPS inaccuracies. In the object-based validation, the ship is called detected if at least one of its pixels are detected. The object-based approach is a more close to a result interesting to an operator because it assess the detection capability of the boat as a whole, while the pixel-based method is more important to assess the capability to delineate the size of the boat.
If the boat left no identifiable trace in a single-pol image (three cases), the sea truth mask for pixel-based detection is left empty. For the object-based approach, we placed the boat according to the GPS-coordinates recording during the acquisition.
We chose nine different vessel detection algorithms to test the detection capabilities of SAR data for small rubber inflatables. The range of detection techniques include an intensity-based approach, a sub-look detector and six polarimetric detectors (Table 2). For each VDS, two boxcar filters are applied to the training window (some of them using a guard window if this increases the performance) and the smaller test window (in some cases just one cell) to implement a moving average filter.
All VDS algorithms under test are taken from literature except the Co-SiDPolRAD (Formula (1)) which is an adaption of the volume detection algorithm iDPolRAD. The iDPolRAD algorithm (Formula (2)) was originally developed for the detection of small icebergs based on their polarization ratio which is different compared to the surrounding sea or sea ice background. For improving clarity, in this paper we rename the iDPolRAD as Cross-iDPolRAD. They can be written as
I = | c o - p o l | 2 t e s t | c o - p o l | 2 t r a i n | c r o s s - p o l | 2 t r a i n | c o - p o l | 2 t e s t
I = | c r o s s - p o l | 2 t e s t | c r o s s - p o l | 2 t r a i n | c o - p o l | 2 t r a i n | c r o s s - p o l | 2 t e s t
where t e s t and t r a i n are the spatial averages (or the value of the cell under test if just one single cell is tested) of the test and the training windows.
Both, the Co-SiDPolRAD and the Cross-iDPolRAD explore the intensity rate between cross-polarization and co-polarization channels and both consist of two parts: the first (to the left of the multiplication sign) works as a ’normalizer’ to enhance the contrast and reduce false alarms and we can defined it as the ’filtering’ component; the second (to the right of the multiplication sign) impacts the probability of detection and represents the ’filtered image’ component. The result is a detection map which can be evaluated against an array of thresholds to confront each true positive rate with its counterpart false positive rate. Where the Cross-iDPolRAD is capable of reducing false alarms from clutter that is not an homogeneous surface, his detection capability is limited for inflatable targets, since these are not very visible in HV. The Co-SiDPolRAD is tailored to detect anomalies of surface scattering, which is suspected to be a prominent scattering mechanism of our target [1].
To improve the iDPolRAD’s performance for our special target we combined the original detector with the new surface scattering version. The result are algorithms that take the occurrence of both volume and surface scattering mechanisms at or around the inflatable into account and use them for successful detection. Figure 3 shows our two different ways to pixel-wise integrate the two detectors: one that sums the two detector maps Figure 3a and the other with the combination of positive and negative detections via a logical operator Figure 3b.
While the entropy/alpha approach was originally designed for quad-pol data, it can also be applied to the simpler case of dual-polarization [77]. With dual-pol data the scattering matrix [S] cannot be reconstructed completely. Only a column of [S] can be derived which we then use to construct a 2 × 2 coherency matrix [T] to estimate depolarization and use that for the PolEntropy detector. For the inflatable rubber boats, we set it to look for low entropy values.
Sub-look detectors use the interlook cross-correlation property that fully developed speckle is uncorrelated while deterministic targets are correlated. Therefore, ships show a higher degree of correlation than the sea surface [11]. This can be done by using Fast Fourier Transform, split the azimuth or range spectrum in two, apply an inverse Fast Fourier Transform and correlate the resulting images. [12] has shown that both deliver similar results, only that the azimuth resolution is lower. Therefore we limit ourselves to the range variant to gain better results in terms of spatial resolution. Other than the original SubCorr detector described by Schneider [47] we use the non-normalized correlation coefficient (or coherence operator). This operator is given by the product of the first sub-look image and the complex conjugate of the second sub-look image.
All tested algorithms use an adaptive training. Adaptive training is designed to obtain the statistics of the clutter using local windows. The clutter is obtained from a ring in a sliding (or moving) window (“boxcar”) with the pixel(s) (or cell(s)) under test (CUT) in the centre surrounded by a guard ring. This guard ring excludes pixels of an extended target from the background ring around it and hence avoid contamination of the clutter statistics.

4. Results

4.1. Preliminary Analysis of Detectors

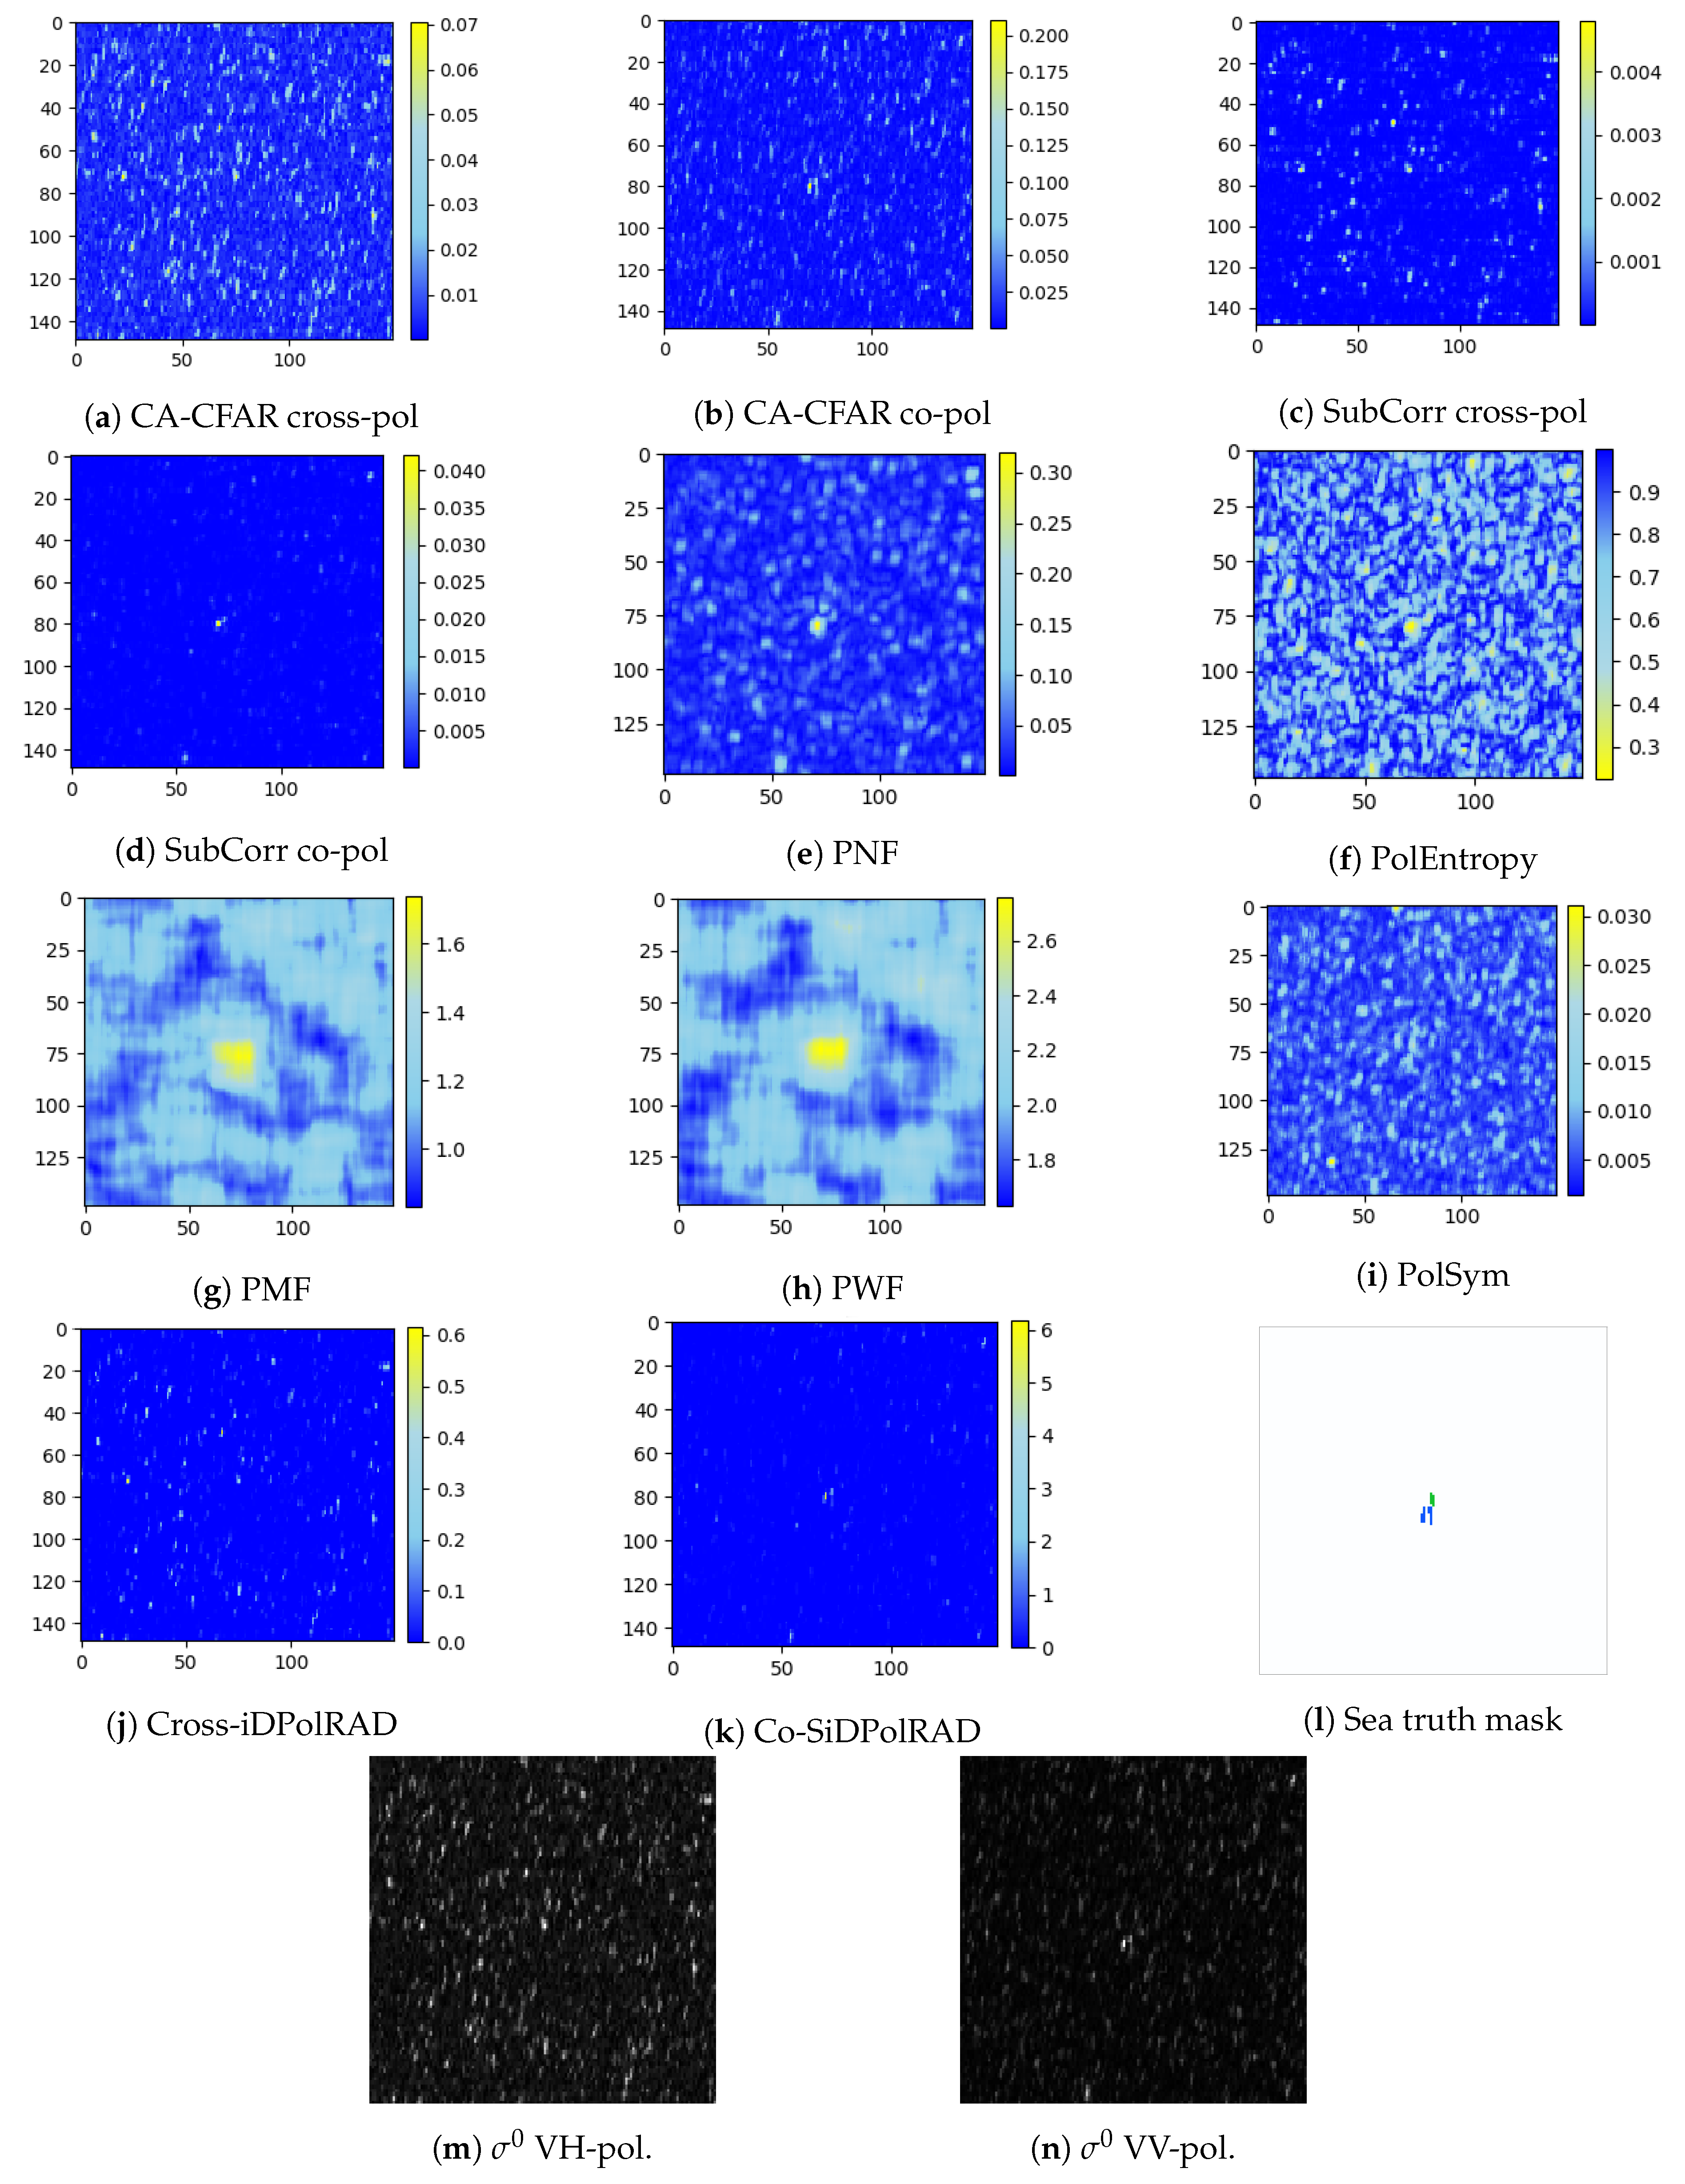
The following series of images in Figure 4, Figure 5 and Figure 6 provide a first visual overview of the detectors’ outputs. These outputs are needed to create the detection maps by filtering them with a given threshold (or array of thresholds) using three exemplary dual-cross-pol datasets from TSX’s SM mode. All detection maps are visualized using dimensionless colour maps of detector-specific ranges. The sea truth masks in the respective sub-figures ‘l’ shows the co-pol portion in blue and the share coming from the cross-pol channel in green. Subfigures ‘m’ and ‘n’ show original SAR data from σ m i n 0 (black) to σ m a x 0 (white).
The three example datasets used represent different sets of sensor settings (incidence angle: ‘low’ < 35° < ‘high’) and scene settings (the boat’s orientation relative to the line of sight (LoS) and its movement). Figure 4 has the boat non-moving in 45° inclined whereas in Figure 5 the boat moves in azimuth and in Figure 6 we see the non-moving inflatable oriented orthogonally to the LoS.
The direct comparisons provide an overview how different the algorithms perform and the impact of each detector’s settings regarding the sizes of the training window and the test window. Even small features on the rather calm test-bed’s water surface can produce scattering artefacts which, in turn, reduce the TCR. This is especially true for low incidence angles (Figure 6) and cross-polarization channels (e.g., Figure 4a compared to Figure 4b,c compared to Figure 4d). There are several reasons that could explain the differences in the detection masks and the detection performance. For instance, the PWF and the PMF produce a bigger detected area (a ’blob’). Possibly this is the case because they are based on optimisations (bigger CUT window size used compared to the other detectors, see Table 2) that maximise the detection performance in this problem. In the case of the PolEntropy the low return from the lake produces more false alarms. The PolSym is not designed to deal with this type of targets, while the PNF seems to not optimizing the target direction when the clutter is less polarised. The SubCorr detector is performing nicely maybe because it rings about a higher sensitivity for the vessel’s edges.

4.2. Comparing Well-Known Detectors

This part of the Results section is prepared in such a way that the detectors’ performance is extensively tested on TSX data before the background of the main sensor settings (incidence angle, polarimetric property and acquisition mode), the detection approach (pixel-based, object-based with/without buffer) and whether multilooking is switched on or off. The subsequent part describes the benefits of combining two of the algorithms used. Finally, the VDS are tested using S1 data.

4.2.1. Comparing Resolution Modes

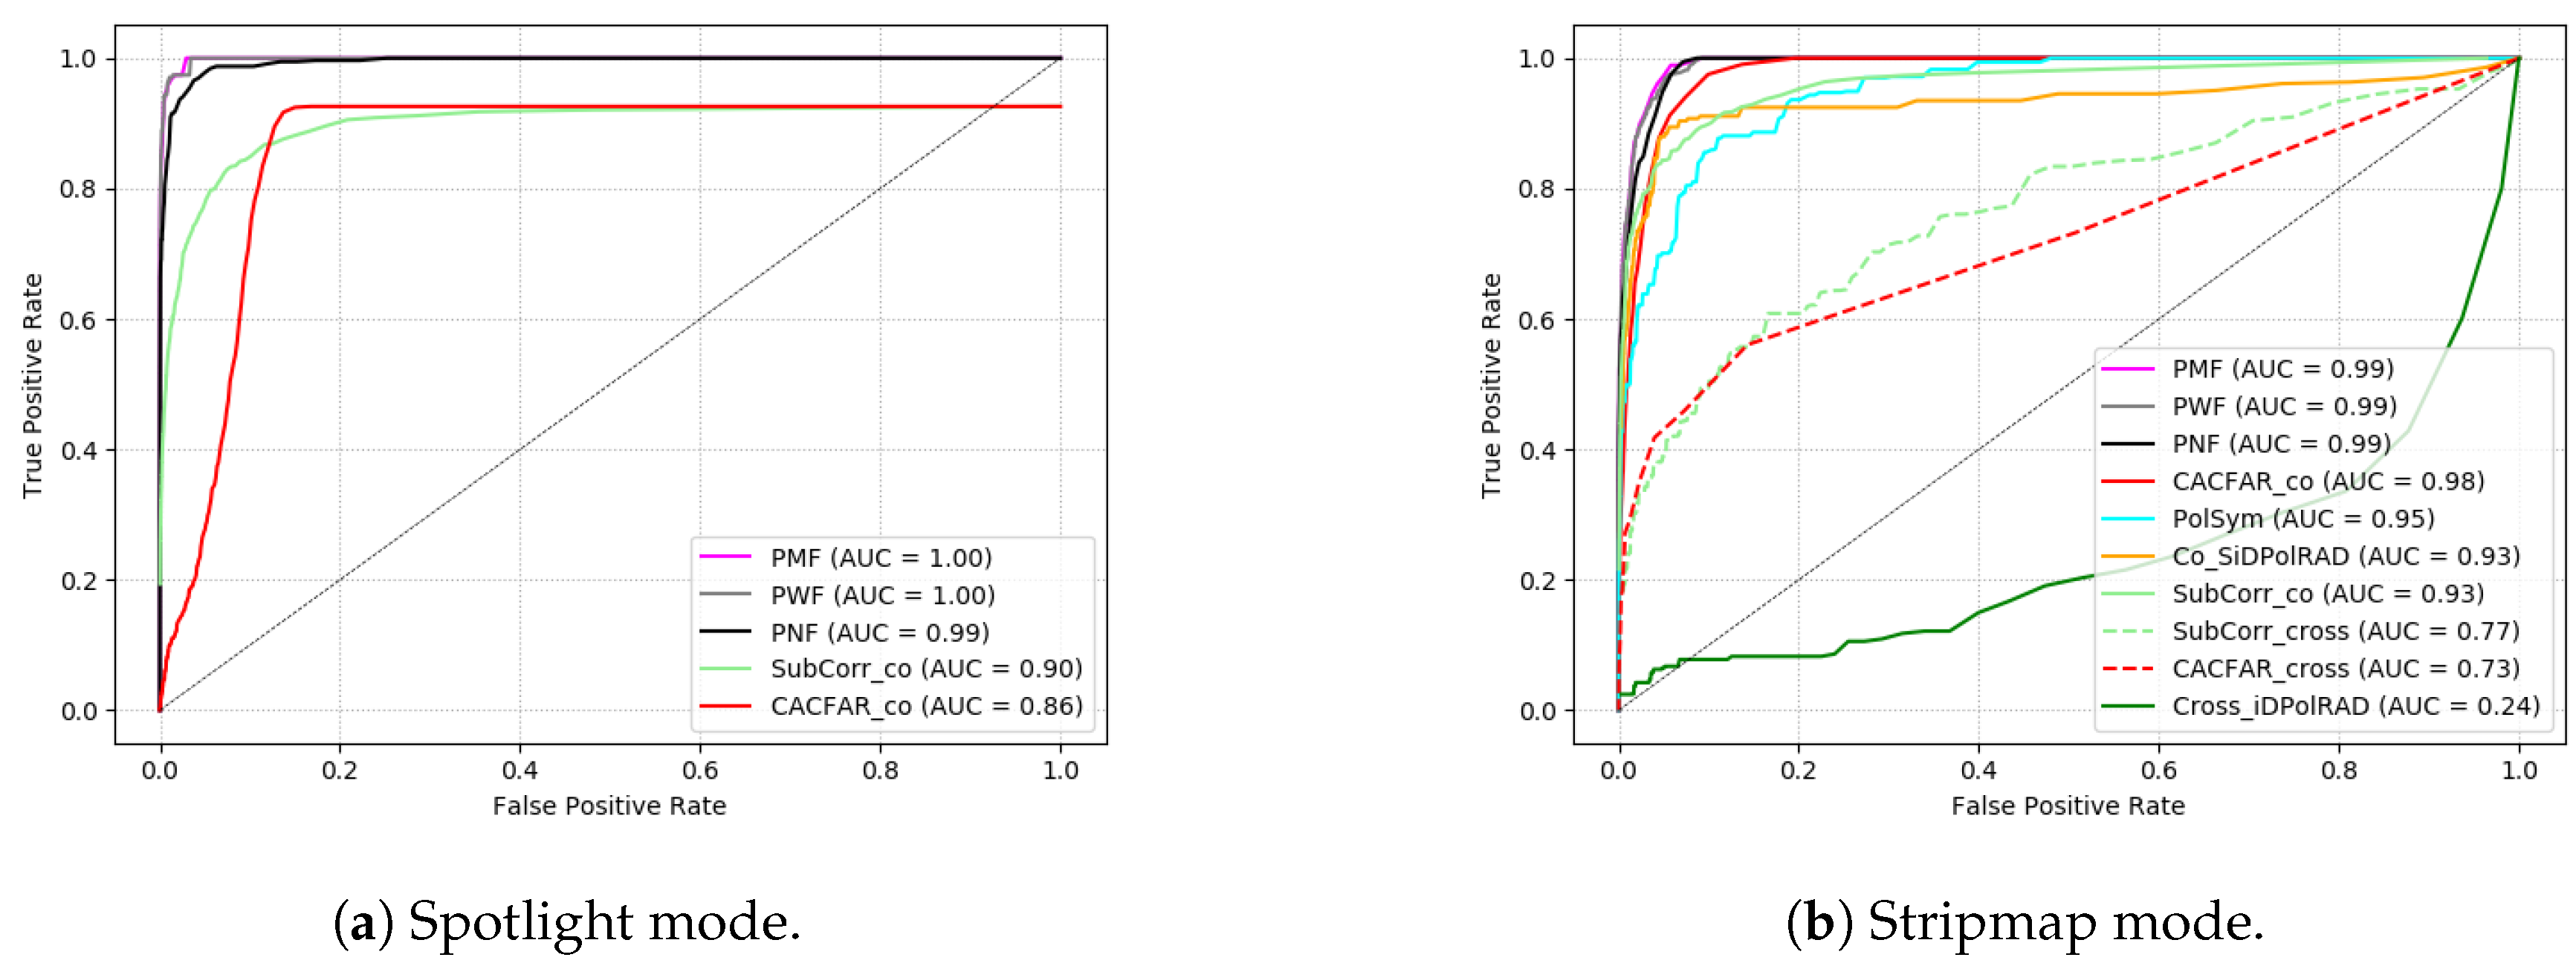
Figure 7 shows the ROC curves for SM and HM when we use pixel based evaluation of the TPR and detector perform filtering (multilooking). The dotted black diagonal line represent the worst possible performance when a completely random choice is made.
Figure 7a presents the result for HS where cross-pol data and therefore some detectors are missing. This ROC shows that the polarimetric detectors PWF, PNF and PMF perform best. The PolEntropy detector, which is set to find low entropy anomalies, provides a very weak performance because the lake has a low backscattering increasing its entropy (strong impact of thermal noise in the signal) and the boat is very small with a dominant scattering mechanism (surface) and occasional volume scattering, therefore it does not have stable entropy values throughout. The SubCorr and the CA-CFAR have discrete performance, but there are some boats that are always missing (TPR remains <0.926).
Figure 7b shows the SM mode where the full set of algorithms could be tested. Again the polarimetric detectors did well except for the iDPolRAD volume detector. The SubCorr and the CA-CFAR have low performance, showing that the polarimetric information layer is important for detecting these targets. The very high result of the Co-SiDPolRAD surface detector indicates that surface scattering is dominant at the inflatable. HH/VV data seems to support better detection results than HH/VH data for the CA-CFAR and the sub-look detector. The results of HS modes are not better than the SM mode, indicating that the decisive difference here is rather made by the polarimetric capability than by the resolution.

4.2.2. Comparing Polarimetric Modes

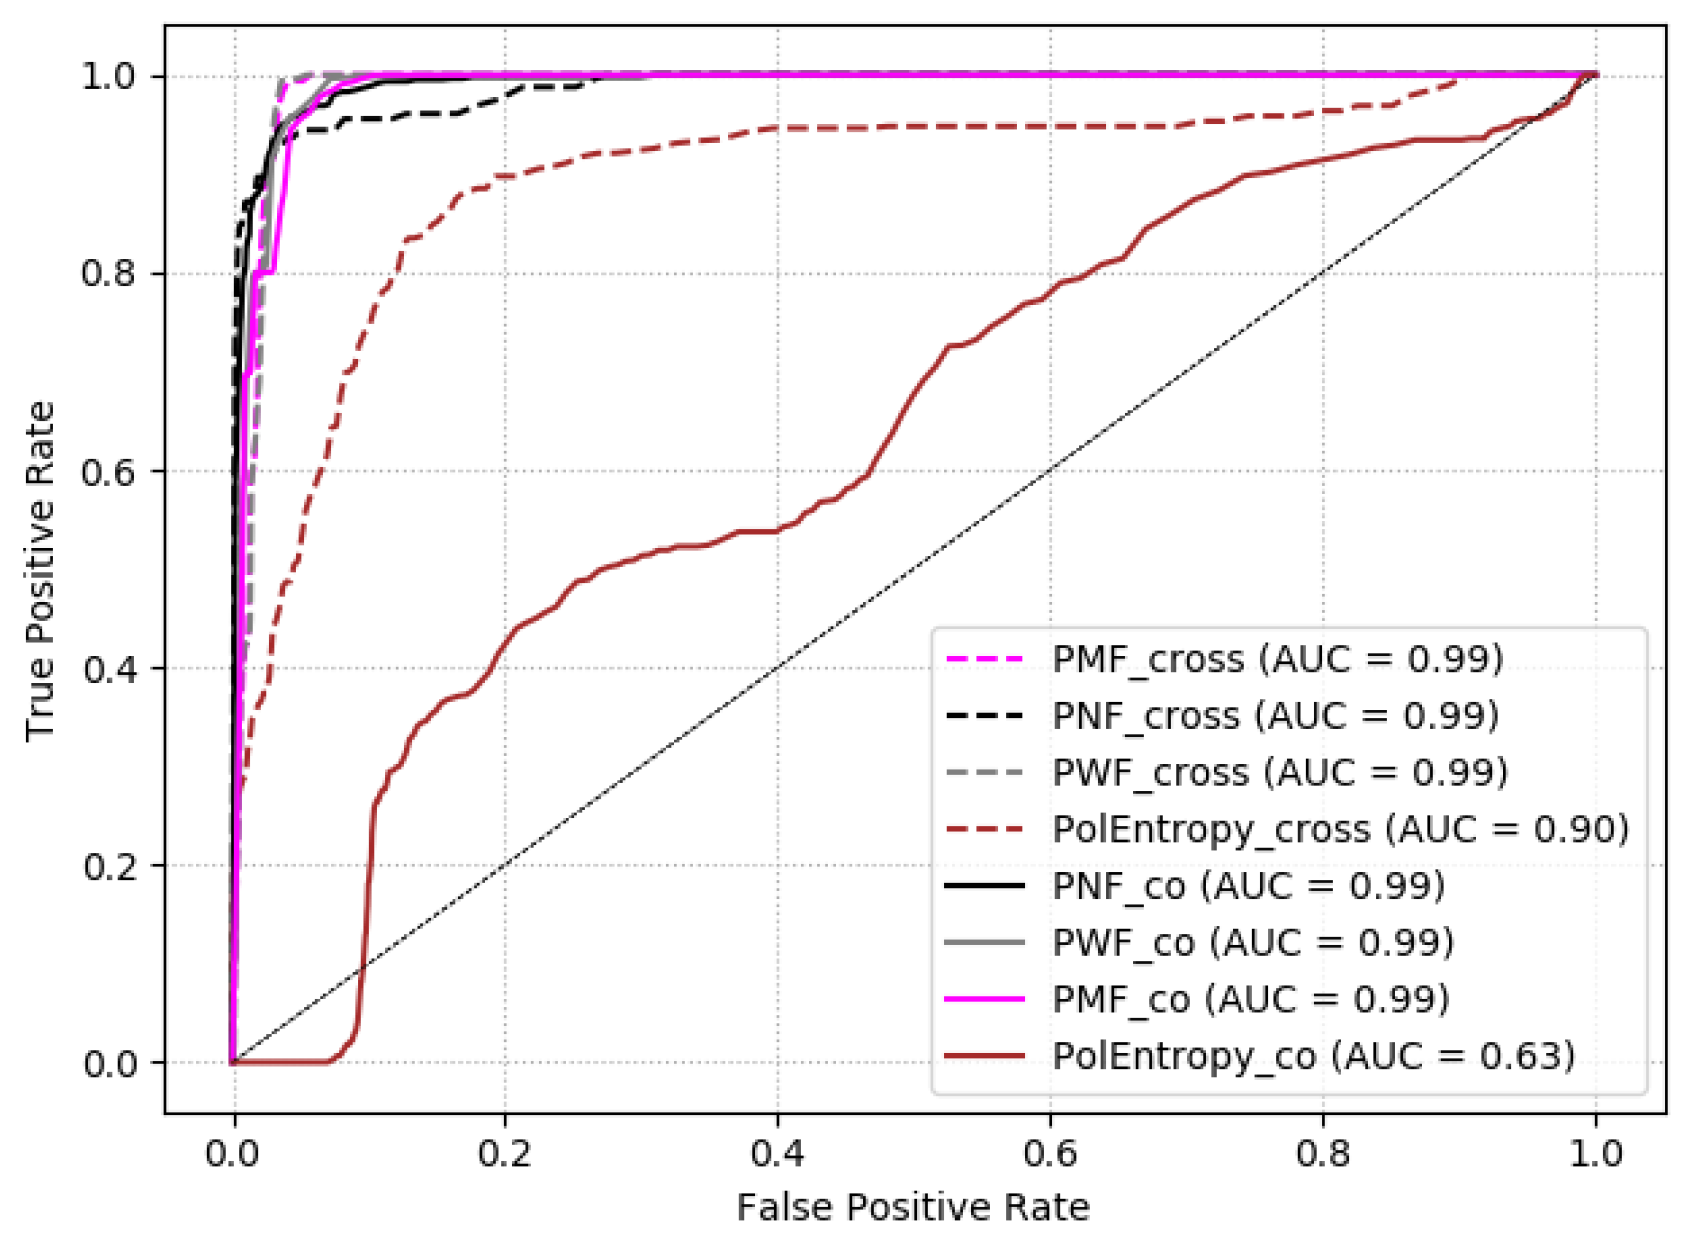
Figure 8 extends the comparison between HH/VV and HV/VH data to cover the polarimetric detectors. It is again a pixel-based approach with filtering and it shows that the detectors’ performance are at very similar levels for cross-pol and co-pol data.
Again, the PolEntropy detector show a different behaviour being more performant in the cross-pol data domain. It seems that its performance greatly depends on the polarimetry but this is, to a certain extent, misleading. It happens to be that in our data there is a pattern of co-pol data being taken under rather extreme low or high incidence angles. We would suspect the influence of the incidence angle on the entropy to be even greater than the polarization mode. Consequently, when we see PMF, PWF and PNF performing very well in this setting, we can assume their robustness with respect to the polarization but also to the incidence angle.

4.2.3. Assessing Filtering (Multilooking)

Figure 9 illustrates the loss of performance for all detectors when we do not perform speckle filtering (i.e., multilooking). The CA-CFAR and the SubCorr both perform slightly weaker in HS mode but very similar in SM mode. Only the SubCorr_cross reaches a clearly higher AUC in this cost-saving mode.
Among the polarimetric detectors, the PMF, PWF and PNF manage to maintain similar performance results as with multilooking. The PolSym and the surface detector lose a bit of performance, the volume detector clearly benefits from speckle filtering. The PolEntropy was taken out since its result would be unitary.

4.2.4. Counting the Boat as a Single Object

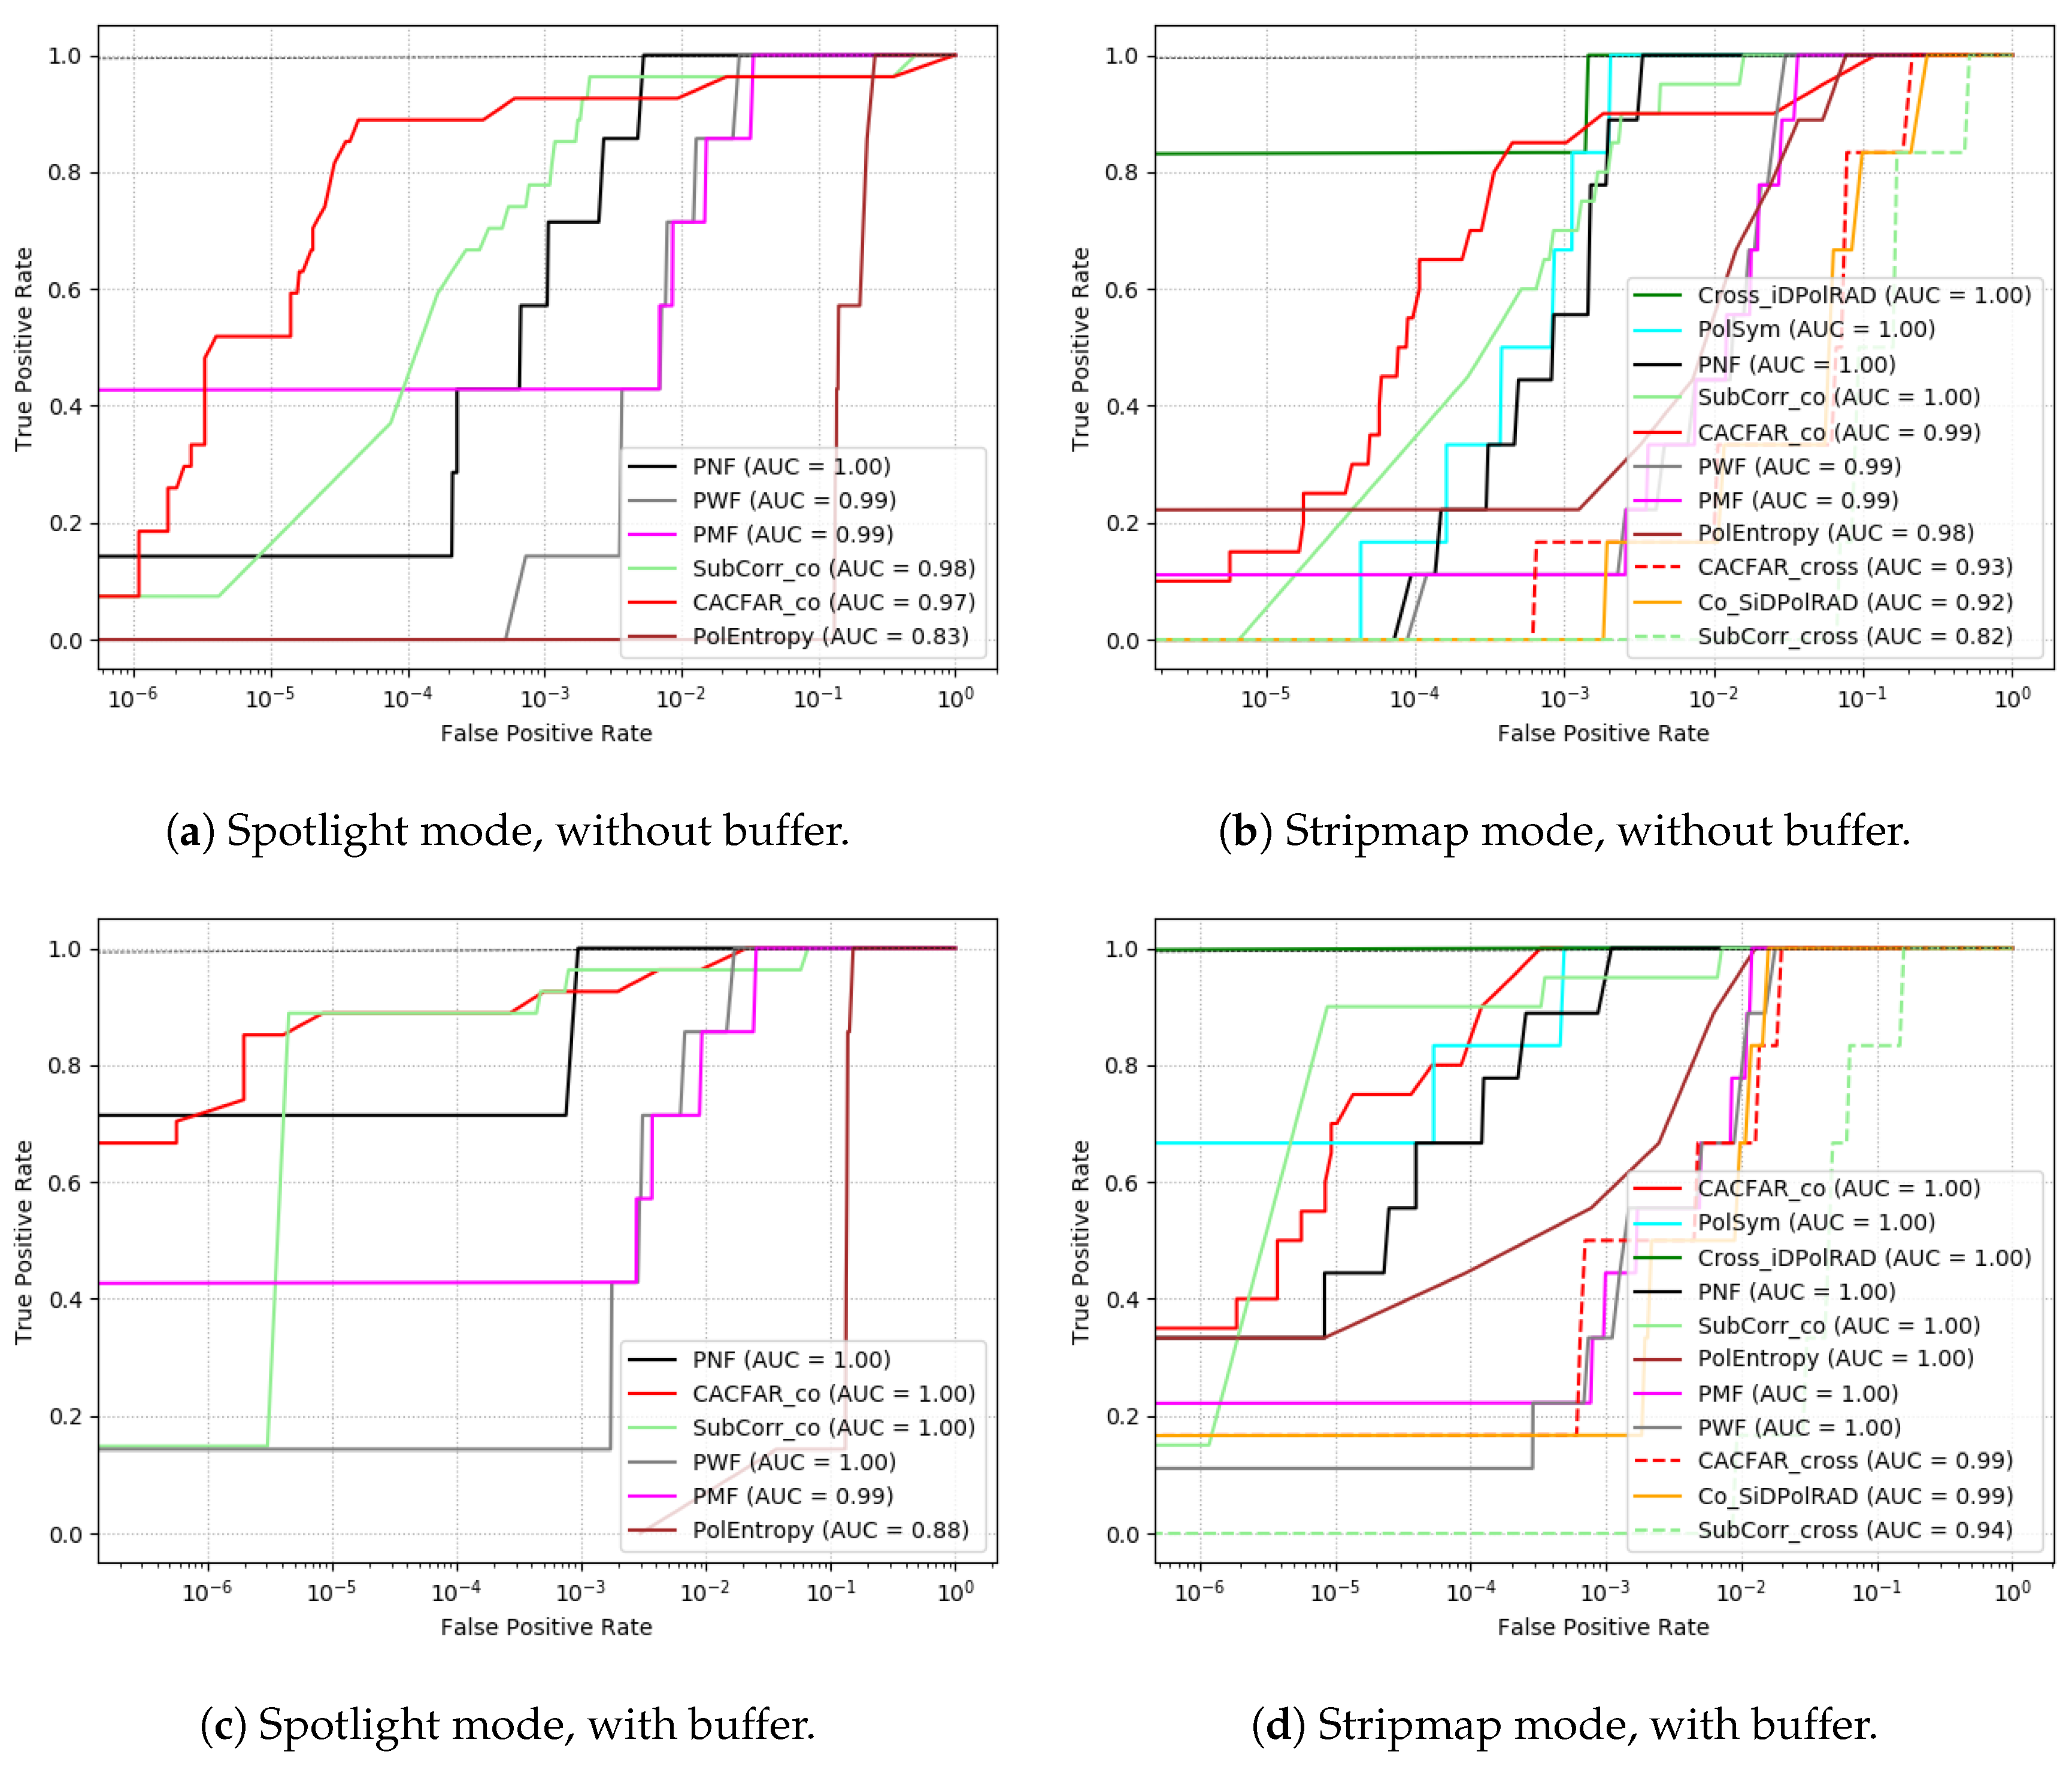
Figure 10 shows the results when we use the object-based approach to count TPR. As expected, the detectors’ performance increased since the detection task is less hard that the delineation task. Enlarging the object by using a buffer around the boat further improves the results of all detectors.
Very interestingly, whereas in pixel-based approach the Cross-iDPolRAD has the weakest performance, it becomes one of the strongest detectors in the object-based variant. That could be a sign of strong volume scattering processes going on around the inflatable. Their spatial extent seems to be rather small and a little dislocated from the high intensity pixels used for the pixel-based approach. This is a phenomena in reverse to what was observed in monitoring icebergs [6], where the surrounding pixels showed deeps of the iDPolRAD. This indicate that the edges are stronger for the opposite of the anomaly (i.e., a surface anomaly produces volume anomalies around the edges). Since we are only detecting the edges of the boat, we need further future analyses to evaluate the actual usefulness of the iDPolRAD for inflatable boats. This could as well considered a reason the PolEntropy detector works much better than in pixel-wise mode. The volume scattering occurring around the inflatable changes the relation between the scattering mechanisms at that locations and creates therefore an anomaly in the entropy space. It is notable that the Co-SiDPolRAD do not increase as much as the others. In Spotlight mode the PNF becomes the best detector.

4.2.5. Comparing Incidence Angles

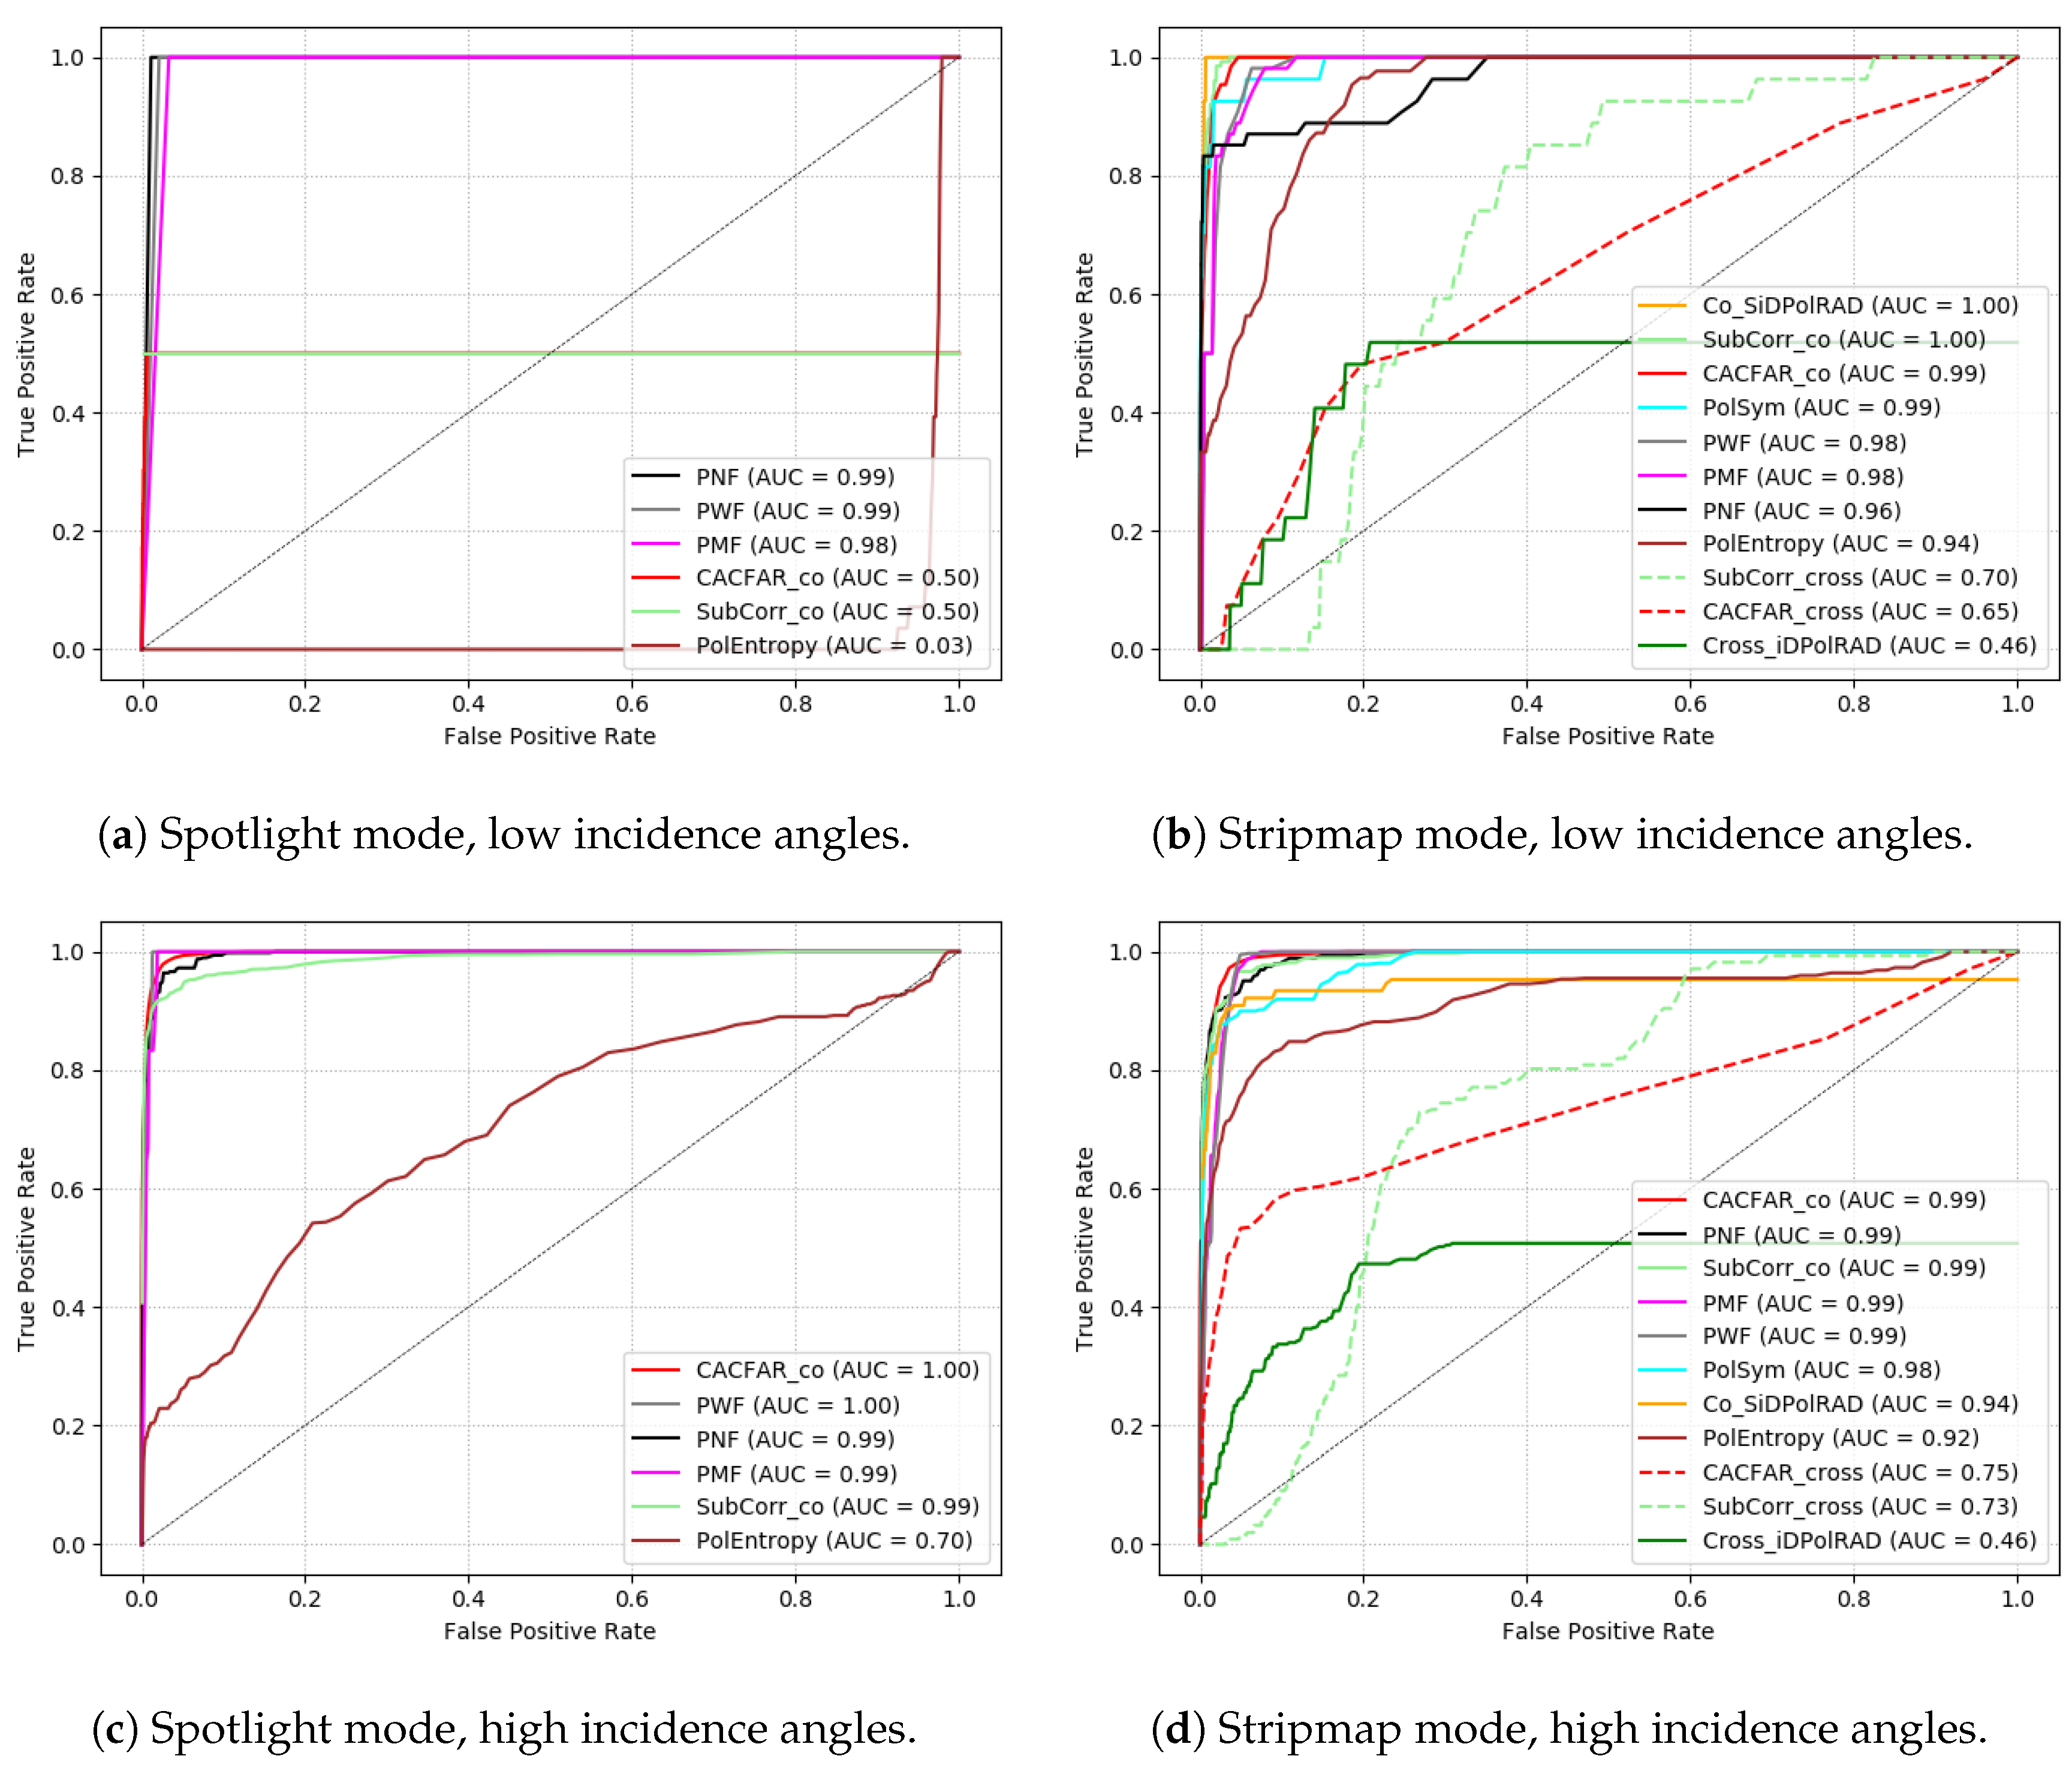
Figure 11 compares the performance of the algorithms with regard to different incidence angles (low < 35 ° < high), separated by the acquisition mode. The influence of the incidence angle alone cannot be shown isolated, but it seems that for most algorithms the incidence angle does not influence the detection performance to a great extent. The results of Figure 11a has to be taken with precaution due to the very small number of samples.
Lower incidence angles decrease the AUC when cross-pol data is used (Figure 11b). A low incidence angle triggers intensified surface scattering mechanisms at the flattened water surface below the target compared to the surrounding water surface and the surface detector Co-SiDPolRAD shows much better results in Figure 11b than in Figure 11d accordingly. Again, PolEntropy is especially weak at HS mode. Although, when set for anomalies with a low entropy, this detector sometimes could be promising for data acquired under moderate or rather high incidence angles. Figure 11a (an entropy detector set to search for high entropy would reach an AUC of 0.97 here) and Figure 11d, where it scores an AUC for 0.92 affirms that theory, whereas Figure 11b invalidates it. The PolEntropy seems very co-dependent on the polarization mode and presumably on scene parameters such as weather situation and vessel orientation as well.

4.2.6. Combining iDPolRAD Detectors

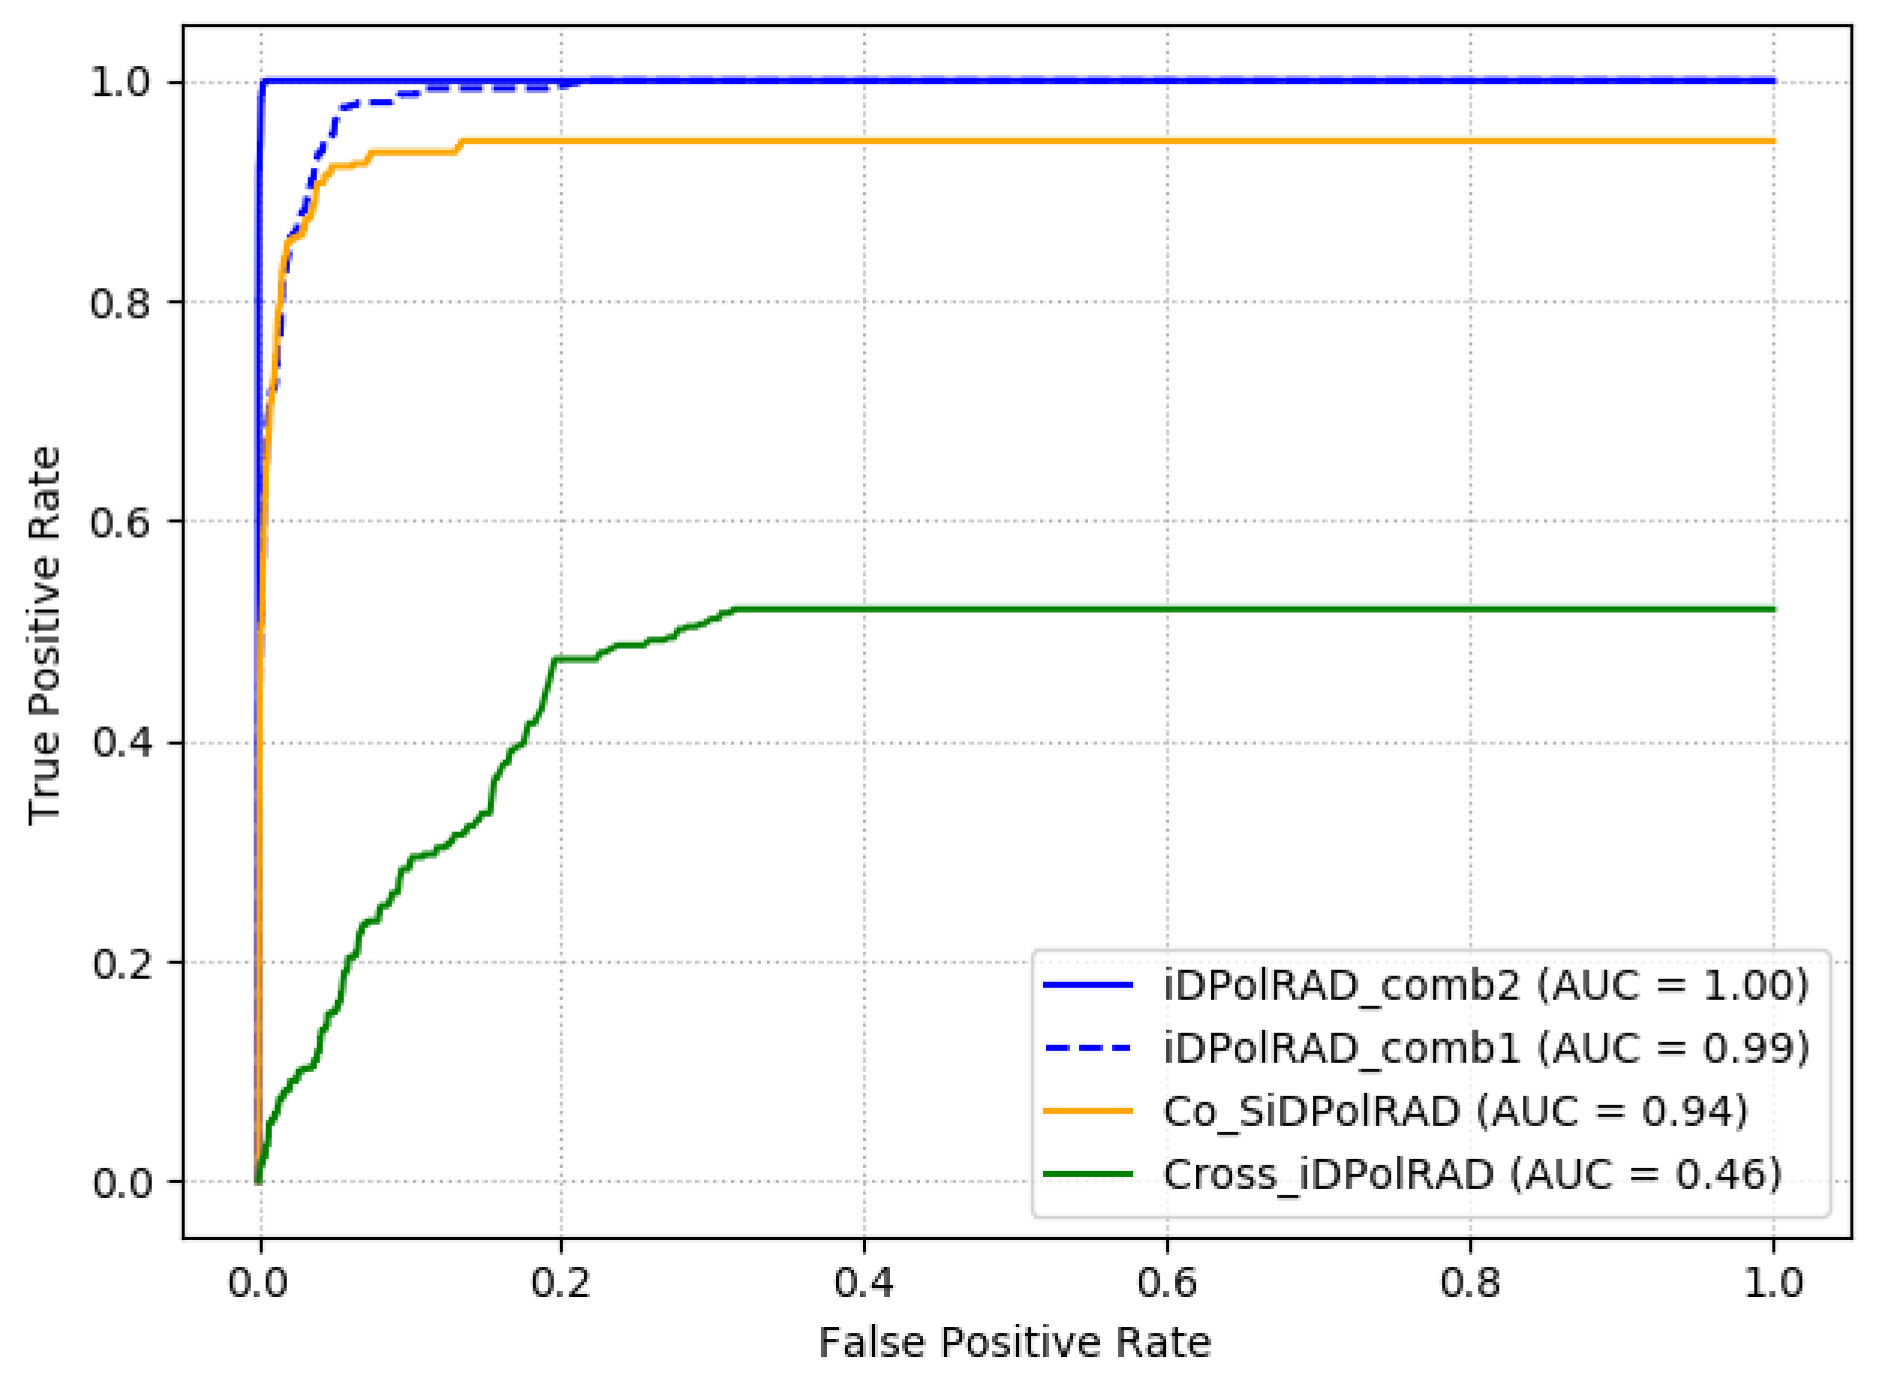
The combination of iDPolRAD detectors for surface and volume scattering improves the results for our special target as it can be seen in Figure 12. It enables the detector to search for surface scattering and volume scattering at the same time.
To create the iDPolRAD_comb2, we tested different logical operators. It turned out that using the ’or’ for the positives and the negatives in the two detectors’ detection masks respectively yields the best result. Table 3 illustrates that the AUCs for the other three possible combinations of the available logical operators ’or’ and ’and’ are much lower.

4.3. Summary of Results Using TerraSAR-X Data

Table 4 wraps up all the detectors’ performance comparison using TSX data and highlights selected scene parameters such as low incidence angles or cross-pol data which are found as being especially challenging for intensity-based detectors. To compute the overall performance, all available data is used which means that HH/VV and HH/HV data are put together. In the central three columns, light green cells mark AUCs of 98% or greater whereas dark green cells indicate the detector with the highest AUC for the respective category. Furthermore, we want to add the computational cost as a factor to the comparison as an expenditure of time normalized by the CA-CFAR time and acquired under the same size for the moving windows for all detectors.
It shows, that the CA-CFAR and the sub-look detector have the big advantages that only one single polarization channel is needed, their cost is quite low and their overall performance is quite high. As it is known for the intensity-based CA-CFAR, the SubCorr does not perform well neither in the “challenging” data categories.
From the remaining group of polarimetric detectors, in all of them, except the PolEntropy, the volume scattering detecting iDPolRAD and its surface detecting variant reach very high AUCs in all categories. Of that group of the remaining very high performing detectors, the two new iDPolRAD combinations appeared to perform at least one magnitude faster than the PMF and PWF and almost five times faster than the PNF. None of the polarimetric detectors is especially challenged by low acquisition angles or cross-polarization data. On the contrary, the PolEntropy manages to extract a way better TCR when having access to the cross-polarization channel. In terms of computational cost, it shows that the sub-look detector SubCorr, the polarimetric detectors PolSym and the group of iDPolRADs perform at the same order of magnitude whereas the PNF with it pixel-wise normalization is a little bit slower. The PolEntropy, PWF and PMF are more expensive in the scale of one to two orders of magnitude due to the fact that they need to use a for loop for the diagonalization.

Performance Tests Using Sentinel-1 Data

While until this point we only focused on TSX data, we want to add now an evaluation of the VDSs’ detection capabilities when using S1 data. Our S1 data collection consists of four Interferometric Wide Swath (IW) dual-pol sets with a spatial resolution of about 70 m²/pixel. Accordingly, the inflatable now is represented only by very few pixels (between one and five) in the binary masks for the sea truth. The methods used are similar to the workflow involving TSX data. Only, S1’s coarse spatial resolution reduced the maximum backscatter intensity from the inflatable. That is why when is came to generate the sea truth masks, the minimum TCR had to be lowered from μ + 3 σ of the local clutter which was used for TSX to μ + 2 σ . Otherwise the boat would not be visible at all. Finally, the preprocessing needed some extra steps (such as deburst).
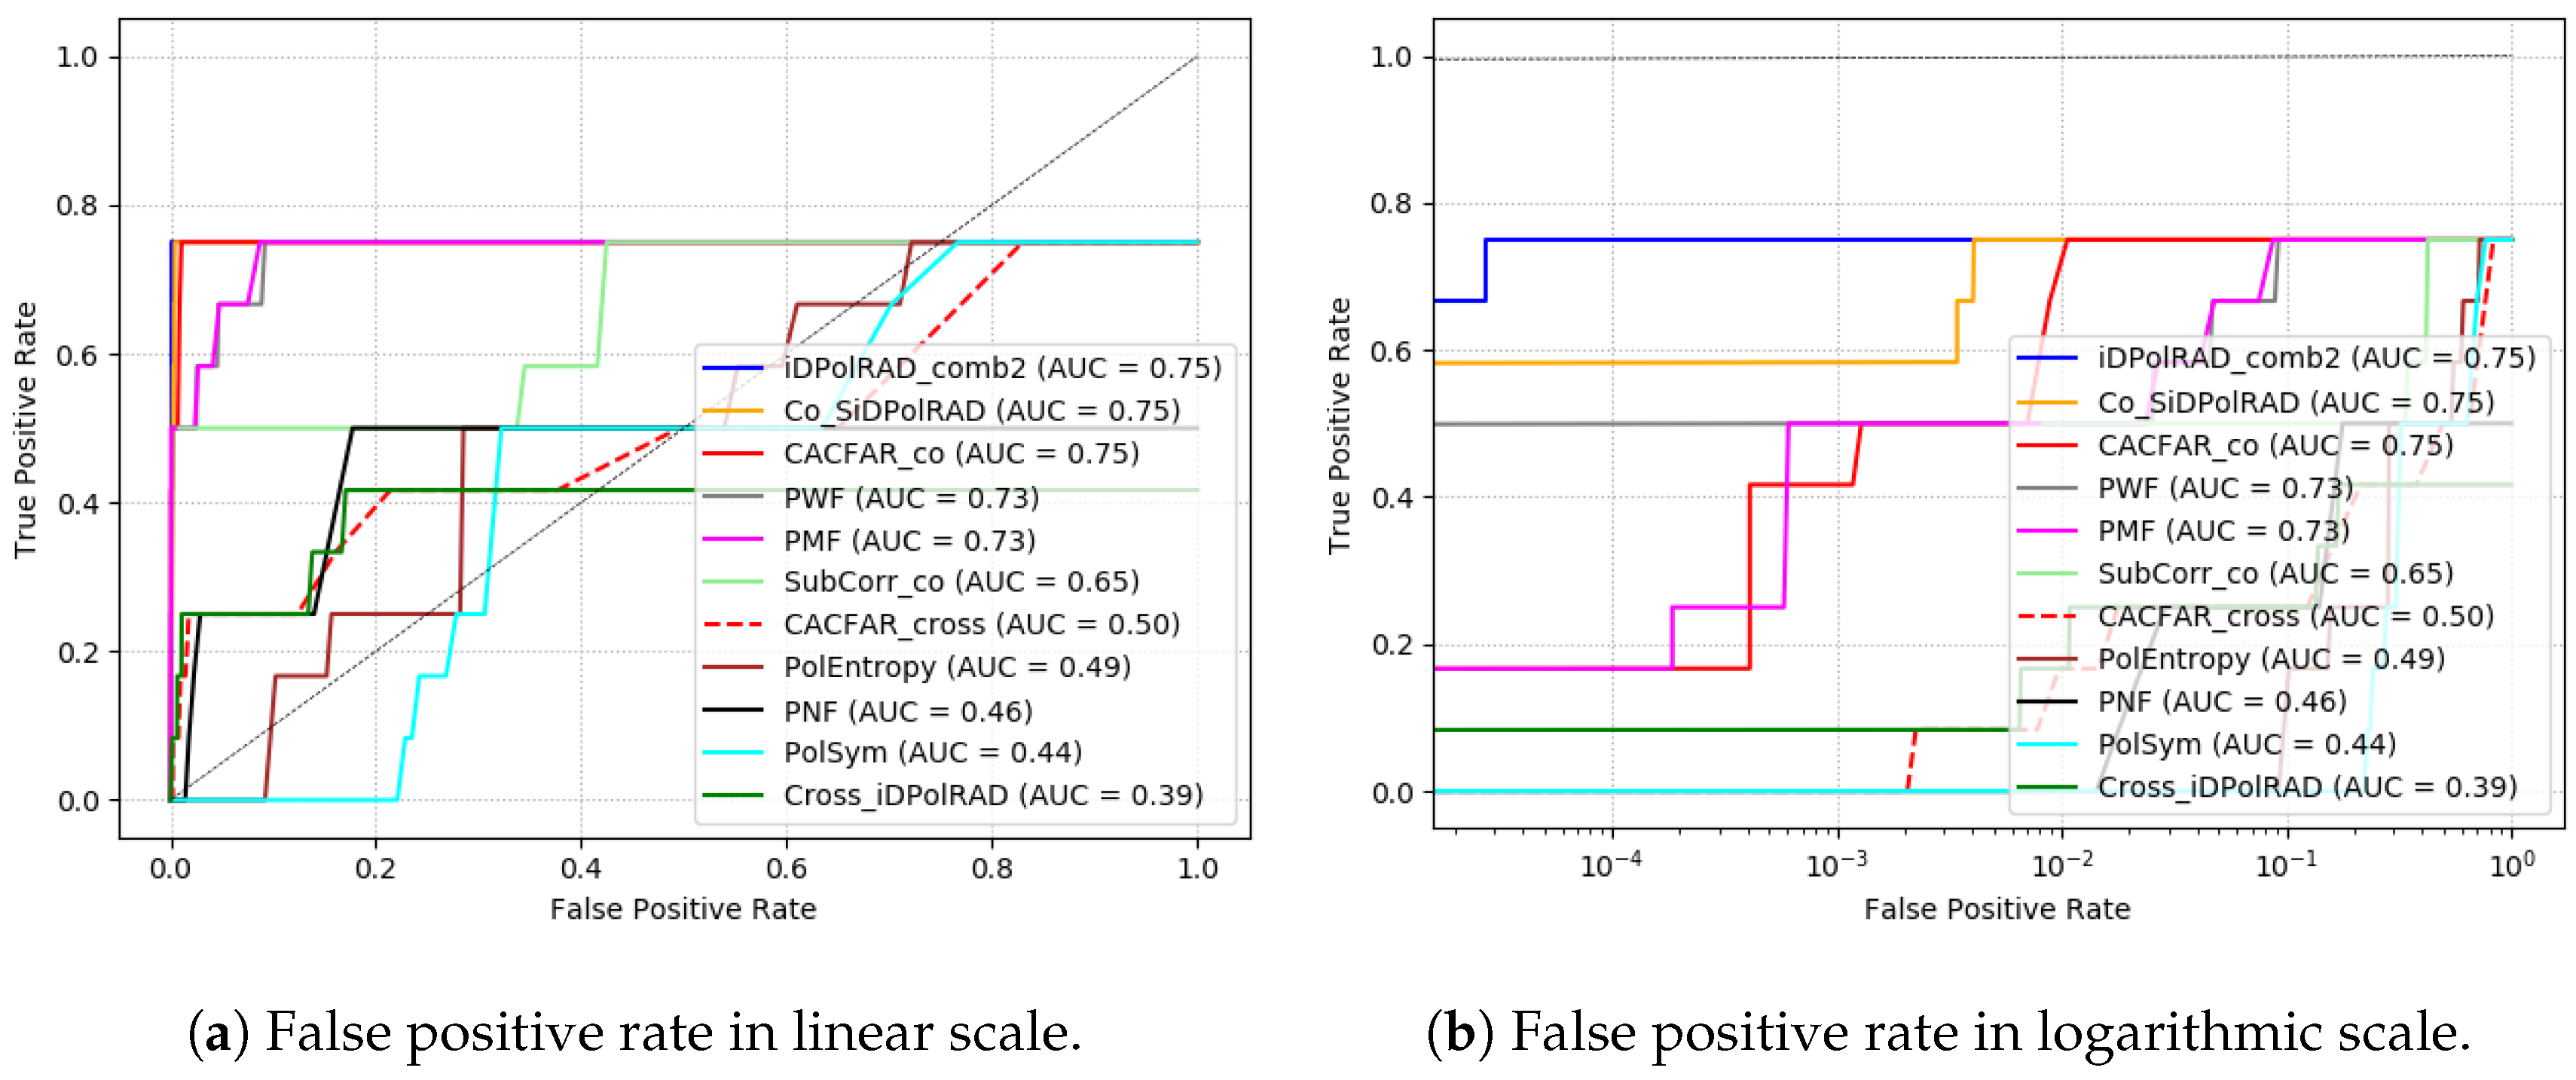
Figure 13 reveals that under the given circumstances of a calm sea state an automatic detection of our inflatable is possible with S1 data. Similar to the results obtained with TSX, the iDPolRAD_comb2 performs best. Similar good results can be seen from the surface detector, the CA-CFAR with co-pol data, the PWF, and the PMF. The PNF, the PolSym, and the SubCorr detector on the other hand seem to suffer more from coarse resolution and show very low AUCs. Due to the fact that the vessel cannot be identified in one of the four datasets, none of the VDS surpass an AUC of 0.75.

5. Discussion

Our experiments show that the detection of very small, non-metallic vessels such as our refugee inflatable is possible with high resolution SAR data and calm sea states (as represented by the lake experiment). Most of the detectors show very good results under the given presets. As expected, the detection task was revealed easier than the delineation task which we chose to do relying on the intensity values. This is questionable, but we found no other way to deal with the unknown GPS receiver’s inaccuracy.
All of the SAR imagery collected show an empty boat which reflects a more challenging scenario than real applications where these inflatables use to accommodate more than 100 people. The limited availability of a ’full’ vessel (30–40 passengers) can unfortunately not entirely describe the impact of these people on the vessel’s radar backscatter behaviour. For the empty boat, surface scattering dominates its inside with only occasional volume scattering presumably at its transom or around the inflatable’s tubes. However, in a realistic environment, such boats host tens of people that, reasonably, largely perturb the backscattered signal with respect to an empty boat. In order to accommodate for possible changes of backscattering when there are passengers we designed a new detector, combining surface and volume scattering.
Furthermore, the authors are aware of the fact that our lake only represents calm sea conditions and we could not test the detector with higher sea states. We would therefore expect the AUCs to reduce when facing stronger winds and higher waves. In order to extend the validity of these results for higher sea states, future research should aim at gathering more realistic data from the open sea.

6. Conclusions

In this paper, we compare the performance of different vessel detection systems for the detection of a small rubber inflatable using TerraSAR-X and Sentinel-1 data. The tests are structured such that the influence of different sensor settings can be observed. The study revealed that we can achieve discrete detection performance when the clutter is not too strong. Low incidence angles decrease the performance of many detectors but has little effect on the polarimetric approaches. Cross-pol data has a negative impact on the CA-CFAR and the sublook detector but all polarimetric detectors, except the PolEntropy, reach similar results on cross-pol and on co-pol data. Therefore, polarimetry seems to improve detection especially when it comes to what we defined as more challenging situations. As TerraSAR-X data is concerned, all algorithms perform better on multilooked data. The spatial resolution has a minor impact comparing TerraSAR-X’s HS mode (pixel size 1–2 m²) and SM mode (3–5 m²) since detectors’ performance are quite similar. Lowering the resolution further down to 70 m² by using Sentinel-1’s Interferometric Wide Swath mode brings about reduced target to clutter ratios, lowers the contrast of edges and hampers vessel detection capabilities and decreases the accuracy of vessel identification through delimitation from bigger ships by correct boat size estimation.
The introduced new version of the iDPolRAD aimed at anomalies in surface scattering worked better on the chosen target than the volume detection algorithm but the best results are delivered by the combination of the two iDPolRADs. That enables volume scattering and surface scattering detection at the same time leading to a further improvement of the detection performance for the chosen target. In the comparison with a range of ship detectors those new combinations proved to bebest suited for our test-bed data of small rubber inflatables. This is true for detection performance as well as for the computing costs.
For future research, the impact of the scene and target settings, for instance the vessel’s orientation, speed, heading and superstructure should be addressed. The new combinations of the iDPolRAD reach higher AUCs and it seems to be a promising way to go for further research. Since there are several SAR images of a moving vessel, wake detection and GMTI techniques could be explored to increase detection rates. Furthermore, the detector testing should be extended to quad-pol data, to different spatial resolutions (favourably between 5 and 10 m and to other wavelengths such as C-band RADARSAT-2) and to non-calibrated SAR or compact polarization SAR (e.g., ALOS-2). Finally, in order to extend this to higher sea states, future campaigns should be planned at sea.

Author Contributions

Conceptualization: P.L. and A.M. methodology: P.L. and A.M.; software: P.L. and A.M.; validation: P.L. and A.M.; formal analysis: P.L. and A.M.; investigation: P.L. and A.M.; resources: A.M., T.B., F.K. and M.M.; data curation: P.L.; writing–original draft: P.L.; writing–review and editing: A.M.; visualization: P.L.; supervision: A.M., T.B., F.K. and M.M.; project administration: P.L., A.M., T.B. and F.K.; funding acquisition: P.L., A.M., F.K. and M.M. All authors have read and agreed to the published version of the manuscript.

Funding

This research is a results of the PhD program Safe Automation of Maritime Systems-SAMS funded by the state of Lower Saxony (Niedersächsisches Ministerium für Wissenschaft und Kultur).

Data Availability Statement

Restrictions apply to the availability of these data. Data was obtained from the DLR and are available with the permission of the DLR and the authors.

Acknowledgments

We would like to thank everybody who has supported the theoretical and experimental/practical work described in this paper and in particular the DLR as it provided friendly cooperation and the satellite data. We would also like to thank Sea-Watch, Space-Eye and the Center for Political Beauty for their efforts in supporting the data campaign. The authors are very grateful for the ESA and the IETR (Institute of Electronics and Telecommunications of Rennes) providing free and open source software SNAP and PolSARPro.

Conflicts of Interest

The authors declare no conflict of interest. Furthermore, the funders had no role in the design of this study; in the collection, analyses, or interpretation of data; in the writing of the manuscript, or in the decision to publish the results.

References

  1. Lanz, P.; Marino, A.; Brinkhoff, T.; Köster, F.; Möller, M. The InflateSAR Campaign: Evaluating SAR Identification Capabilities of Distressed Refugee Boats. Remote Sens. 2020, 12, 3516. [Google Scholar] [CrossRef]
  2. Crisp, D.J.; Redding, N.J. Ship Detection in Synthetic Aperture Radar Imagery. In Proceedings of the 12th Australasian Remote Sensing and Photogrammetry Conference, Fremantle, Australia, 18–22 October 2004; p. 10. [Google Scholar]
  3. Vachon, P.W. Ship Detection in Synthetic Aperture Radar Imagery. In Proceedings of the OceanSAR, St. John´s, NL, Canada, 23–25 October 2006; pp. 1–10. [Google Scholar]
  4. Marino, A.; Nunziata, F.; Migliaccio, M.; Ouchi, K.; Sugimoto, M.; Hajnsek, I. PolSAR-Ap: The Use of Polarimetric SAR to Improve Detection of Targets at Sea. In Proceedings of the ESA Living Planet Symposium, St. John´s, NL, Canada, 9–13 September 2013. [Google Scholar]
  5. Novak, L.M.; Sechtin, M.B.; Burl, M.C. Algorithms for Optimal Processing of Polarimetric Radar Data; Massachusetts Inst of Tech Lexington Lincoln Lab: Lexington, MA, USA, 1989; p. 99. [Google Scholar]
  6. Marino, A.; Dierking, W.; Wesche, C. A Depolarization Ratio Anomaly Detector to Identify Icebergs in Sea Ice Using Dual-Polarization SAR Images. IEEE Trans. Geosci. Remote Sens. 2016, 54, 5602–5615. [Google Scholar] [CrossRef] [Green Version]
  7. Marino, A.; Walker, N.; Woodhouse, I. Ship Detection Using Sar Polarimetry. The Development of a New Algorithm Designed to Exploit New Satellite SAR Capabilities for Maritime Surveillance. In Proceedings of the SeaSAR, Frascati, Italy, 25–29 January 2010; p. 9. [Google Scholar]
  8. Nunziata, F.; Migliaccio, M.; Brown, C.E. A Physically-Based Approach to Observe Ships in Dual-Polarized Sar Data. In Proceedings of the IEEE International Geoscience and Remote Sensing Symposium, Honolulu, HI, USA, 25–30 July 2010; p. 3. [Google Scholar]
  9. Touzi, R.; Charbonneau, F.; Hawkins, R.K.; Murnaghan, K.; Kavoun, X. Ship-Sea Contrast Optimization When Using Polarimetric SARs. In Proceedings of the IGARSS 2001. Scanning the Present and Resolving the Future. IEEE 2001 International Geoscience and Remote Sensing Symposium (Cat. No.01CH37217), Sydney, Australia, 9–13 July 2001; Volume 1, pp. 426–428. [Google Scholar]
  10. Arnaud, A. Ship Detection by SAR Interferometry. In Proceedings of the IEEE 1999 International Geoscience and Remote Sensing Symposium. IGARSS’99 (Cat. No.99CH36293), Hamburg, Germany, 28 June–2 July 1999; Volume 5, pp. 2616–2618. [Google Scholar] [CrossRef]
  11. Ouchi, K.; Tamaki, S.; Yaguchi, H.; Iehara, M. Ship Detection Based on Coherence Images Derived From Cross Correlation of Multilook SAR Images. IEEE Geosci. Remote Sens. Lett. 2004, 1, 184–187. [Google Scholar] [CrossRef]
  12. Marino, A.; Sanjuan-Ferrer, M.J.; Hajnsek, I.; Ouchi, K. Ship Detection with Spectral Analysis of Synthetic Aperture Radar: A Comparison of New and Well-Known Algorithms. Remote Sens. 2015, 7, 5416–5439. [Google Scholar] [CrossRef]
  13. Brekke, C.; Anfinsen, S.N.; Larsen, Y. Subband Extraction Strategies in Ship Detection with the Subaperture Cross-Correlation Magnitude. IEEE Geosci. Remote Sens. Lett. 2013, 10, 786–790. [Google Scholar] [CrossRef] [Green Version]
  14. Marino, A.; Sugimoto, M.; Ouchi, K.; Hajnsek, I. Validating a Notch Filter for Detection of Targets at Sea with ALOS-PALSAR Data: Tokyo Bay. Select. Top. Appl. Earth Obs. Remote Sens. IEEE J. 2014, 7, 4907–4918. [Google Scholar] [CrossRef] [Green Version]
  15. Marino, A.; Hajnsek, I. Statistical Tests for a Ship Detector Based on the Polarimetric Notch Filter. Geosci. Remote Sens. IEEE Trans. 2015, 53, 4578–4595. [Google Scholar] [CrossRef] [Green Version]
  16. Yeremy, M.; Campbell, J.W.M.; Mattar, K.; Potter, T. Ocean Surveillance with Polarimetric SAR. Can. J. Remote Sens. 2001, 27, 328–344. [Google Scholar] [CrossRef]
  17. Stastny, J.; Cheung, S.; Wiafe, G.; Agyekum, K.; Greidanus, H. Application of RADAR Corner Reflectors for the Detection of Small Vessels in Synthetic Aperture Radar. IEEE J. Select. Top. Appl. Earth Obs. Remote Sens. 2014, 8, 1099–1107. [Google Scholar] [CrossRef]
  18. Gao, G.; Shi, G. Ship Detection in Dual-Channel ATI-SAR Based on the Notch Filter. IEEE Trans. Geosci. Remote Sens. 2017, 55, 4795–4810. [Google Scholar] [CrossRef]
  19. Zhao, J.; Guo, W.; Zhang, Z.; Yu, W. A Coupled Convolutional Neural Network for Small and Densely Clustered Ship Detection in SAR Images. Sci. China Inf. Sci. 2019, 62, 42301. [Google Scholar] [CrossRef] [Green Version]
  20. Liu, G.; Zhang, X.; Meng, J. A Small Ship Target Detection Method Based on Polarimetric SAR. Remote Sens. 2019, 11, 2938. [Google Scholar] [CrossRef] [Green Version]
  21. Eldhuset, K. An Automatic Ship and Ship Wake Detection System for Spaceborne SAR Images in Coastal Regions. IEEE Trans. Geosci. Remote Sens. 1996, 34, 1010–1019. [Google Scholar] [CrossRef]
  22. Tello, M.; López-Martínez, C.; Mallorqui, J.J. A Novel Algorithm for Ship Detection in SAR Imagery Based on the Wavelet Transform. IEEE Geosci. Remote Sens. Lett. 2005, 2, 201–205. [Google Scholar] [CrossRef]
  23. Brusch, S.; Lehner, S.; Fritz, T.; Soccorsi, M.; Soloviev, A.; van Schie, B. Ship Surveillance with TerraSAR-X. IEEE Trans. Geosci. Remote Sens. 2010, 49, 1092–1103. [Google Scholar] [CrossRef]
  24. Watts, S. A Practical Approach to the Prediction and Assessment of Radar Performance in Sea Clutter. In Proceedings of the International Radar Conference, IEEE, Alexandria, VA, USA, 8–11 May 1995; pp. 181–186. [Google Scholar]
  25. Crisp, D.J. The State-of-the-Art in Ship Detection in Synthetic Aperture Radar Imagery; Res. Rep. DSTO-RR-0272; Defence Science And Technology Organisation Info Sciences Lab: Edinburgh, Australia, 2004; p. 136. [Google Scholar]
  26. Parthiban, A.; Madhavan, J.; Radhakrishna, P.; Savitha, D.; Kumar, L.S. Modeling and Simulation of Radar Sea Clutter Using K-Distribution. In Proceedings of the SPCOM’04, 2004 International Conference on Signal Processing and Communications, Bangalore, India, 11–14 December 2004; pp. 368–372. [Google Scholar]
  27. Ward, K.D.; Baker, C.J.; Watts, S. Maritime Surveillance Radar. Part 1: Radar Scattering from the Ocean Surface. IEE Proc. F 1990, 137, 51–62. Available online: https://digital-library.theiet.org/content/journals/10.1049/ip-f-2.1990.0009 (accessed on 2 April 2021).
  28. Gierull, C.H.; Sikaneta, I. A Compound-plus-Noise Model for Improved Vessel Detection in Non-Gaussian SAR Imagery. IEEE Trans. Geosci. Remote Sens. 2017, 56, 1444–1453. [Google Scholar] [CrossRef]
  29. Greidanus, H.; Alvarez, M.; Santamaria, C.; Thoorens, F.X.; Kourti, N.; Argentieri, P. The SUMO Ship Detector Algorithm for Satellite Radar Images. Remote Sens. 2017, 9, 246. [Google Scholar] [CrossRef] [Green Version]
  30. Aiello, M.; Vezzoli, R.; Gianinetto, M. Object-Based Image Analysis Approach for Vessel Detection on Optical and Radar Images. J. Appl. Remote Sens. 2019, 13, 1. [Google Scholar] [CrossRef]
  31. Song, S.; Xu, B.; Li, Z.; Yang, J. Ship Detection in SAR Imagery via Variational Bayesian Inference. IEEE Geosci. Remote Sens. Lett. 2016, 13, 319–323. [Google Scholar] [CrossRef]
  32. Cloude, S. Polarisation: Applications in Remote Sensing; Oxford University Press: Oxford, UK, 2010. [Google Scholar]
  33. Lee, J.S.; Pottier, E. Polarimetric Radar Imaging: From Basics to Applications; CRC Press: Boca Raton, FL, USA, 2009. [Google Scholar]
  34. Hajnsek, I.; Pardini, M.; Papathanassiou, K.; Cloude, S.; Lopez-Sanchez, J.M.; Ballester-Berman, D.; Jagdhuber, T.; Koeniguer, E.; Trouve, N.; Migliaccio, M. PolSAR-Ap: Exploitation of Fully Polarimetric SAR Data for Application Demonstration. In Proceedings of the POLINSAR 2013, Workshop on Applications of SAR Polarimetry and Polarimetric Interferometry, Milan, Italy, 26–31 July 2013. [Google Scholar]
  35. Velotto, D.; Soccorsi, M.; Lehner, S. Azimuth Ambiguities Removal for Ship Detection Using Full Polarimetric X-Band SAR Data. IEEE Trans. Geosci. Remote Sens. 2014, 52, 76–88. [Google Scholar] [CrossRef]
  36. Margarit, G.; Mallorqui, J.; Fabregas, X. Single-Pass Polarimetric SAR Interferometry for Vessel Classification. IEEE Trans. Geosci. Remote Sens. 2007, 45, 3494–3502. [Google Scholar] [CrossRef]
  37. Hannevik, T.N.A. Combining Polarimetric Channels for Better Ship Detection Results; ESA Special Publication: Paris, France, 2013; Volume 713. [Google Scholar]
  38. Hu, C.; Ferro-Famil, L.; Kuang, G. Ship Discrimination Using Polarimetric SAR Data and Coherent Time-Frequency Analysis. Remote Sens. 2013, 5, 6899–6920. [Google Scholar] [CrossRef] [Green Version]
  39. Iervolino, P.; Guida, R.; Whittaker, P. A Novel Ship-Detection Technique for Sentinel-1 SAR Data. In Proceedings of the 2015 IEEE 5th Asia-Pacific Conference on Synthetic Aperture Radar (APSAR), Singapore, 1–4 September 2015; pp. 797–801. [Google Scholar] [CrossRef] [Green Version]
  40. Iervolino, P.; Guida, R.; Amitrano, D.; Marino, A. SAR Ship Detection for Rough Sea Conditions. In Proceedings of the IGARSS 2019–2019 IEEE International Geoscience and Remote Sensing Symposium, Yokohama, Japan, 28 July–2 August 2019; pp. 505–508. [Google Scholar] [CrossRef]
  41. Liu, C.; Vachon, P.W.; Geling, G.W. Improved Ship Detection Using Polarimetric SAR Data. In Proceedings of the IGARSS 2004. 2004 IEEE International Geoscience and Remote Sensing Symposium, Anchorage, AK, USA, 20–24 September 2004; pp. 1800–1803. [Google Scholar] [CrossRef]
  42. Yang, J.; Cui, Y. A Novel Method for Ship Detection in Polarimetric SAR Images Using Gopce. In Proceedings of the IET International Radar Conference, Guilin, China, 20–22 April 2009; pp. 1–5. [Google Scholar] [CrossRef]
  43. Nunziata, F.; Montuori, A.; Migliaccio, M. Dual-Polarized COSMO SkyMed SAR Data to Observe Metallic Targets at Sea. In Proceedings of the Geoscience and Remote Sensing Symposium (IGARSS), Vancouver, BC, Canada, 24–29 July 2011; pp. 2270–2273. [Google Scholar]
  44. Nunziata, F.; Migliaccio, M.; Brown, C.E. Reflection Symmetry for Polarimetric Observation of Man-Made Metallic Targets at Sea. Ocean. Eng. IEEE J. 2012, 37, 384–394. [Google Scholar] [CrossRef]
  45. Marino, A.; Walker, N. Ship Detection In Variable Sea States And Depolarized Sea Clutter: A Polarimetric Notch Filter. PolinSAR 2011 Sci. Appl. SAR Polarim. Polarim. Interferom. 2011, 695, 8. [Google Scholar]
  46. Cloude, S.R.; Pottier, E. A Review of Target Decomposition Theorems in Radar Polarimetry. IEEE Trans. Geosci. Remote Sens. 1996, 34, 498–518. [Google Scholar] [CrossRef]
  47. Schneider, R.Z.; Papathanassiou, K.P.; Hajnsek, I.; Moreira, A. Polarimetric and Interferometric Characterization of Coherent Scatterers in Urban Areas. IEEE Trans. Geosci. Remote Sens. 2006, 44, 971–984. [Google Scholar] [CrossRef]
  48. Anfinsen, S.N.; Brekke, C. Statistical Models for Constant False Alarm Rate Ship Detection with the Sublook Correlation Magnitude. In Proceedings of the Geoscience and Remote Sensing Symposium (IGARSS), Munich, Germany, 22–27 July 2012; pp. 5626–5629. [Google Scholar]
  49. Sanjuan-Ferrer, M.J.; Hajnsek, I.; Papathanassiou, K.P.; Moreira, A. A New Detection Algorithm for Coherent Scatterers in SAR Data. IEEE Trans. Geosci. Remote Sens. 2015, 53, 6293–6307. [Google Scholar] [CrossRef]
  50. Zhang, B.; Li, X.; Perrie, W.; Garcia-Pineda, O. Compact Polarimetric Synthetic Aperture Radar for Marine Oil Platform and Slick Detection. IEEE Trans. Geosci. Remote Sens. 2017, 55, 1407–1423. [Google Scholar] [CrossRef]
  51. Sanjuan-Ferrer, M.J. Detection of Coherent Scatterers in SAR Data: Algorithms and Applications. Ph.D. Thesis, ETH Zurich, Zurich, Switzerland, 2013. [Google Scholar] [CrossRef]
  52. Souyris, J.C.; Henry, C.; Adragna, F. On the Use of Complex SAR Image Spectral Analysis for Target Detection: Assessment of Polarimetry. IEEE Trans. Geosci. Remote Sens. 2003, 41, 2725–2734. [Google Scholar] [CrossRef]
  53. Raney, R.K. Synthetic Aperture Imaging Radar and Moving Targets. IEEE Trans. Aerosp. Electron. Syst. 1971, AES-7, 499–505. [Google Scholar] [CrossRef]
  54. Ender, J.H. Space-Time Processing for Multichannel Synthetic Aperture Radar. Electron. Commun. Eng. J. 1999, 11, 29–38. [Google Scholar] [CrossRef]
  55. Ender, J.H.G.; Gierull, C.H.; Cerutti-Maori, D. Improved Space-Based Moving Target Indication via Alternate Transmission and Receiver Switching. IEEE Trans. Geosci. Remote Sens. 2008, 46, 3960–3974. [Google Scholar] [CrossRef]
  56. Chiu, S.; Livingstone, C. A Comparison of Displaced Phase Centre Antenna and Along-Track Interferometry Techniques for RADARSAT-2 Ground Moving Target Indication. Can. J. Remote Sens. 2005, 31, 37–51. [Google Scholar] [CrossRef] [Green Version]
  57. Makhoul, E.; Baumgartner, S.V.; Jager, M.; Broquetas, A. Multichannel SAR-GMTI in Maritime Scenarios With F-SAR and TerraSAR-X Sensors. IEEE J. Select. Top. Appl. Earth Obs. Remote Sens. 2015, 8, 5052–5067. [Google Scholar] [CrossRef] [Green Version]
  58. Cerutti-Maori, D.; Sikaneta, I. Optimum GMTI Processing for Space-Based SAR/GMTI Systems-Theoretical Derivation. In Proceedings of the 8th European Conference on Synthetic Aperture Radar, VDE, Aachen, Germany, 7–10 June 2010; pp. 1–4. [Google Scholar]
  59. Gao, G.; Huang, K.; Gao, S.; He, J.; Zhang, X. Ship Detection Based on Oceanic Displaced Phase Center Antenna Technique in Along-Track Interferometric SAR. IEEE J. Select. Top. Appl. Earth Obs. Remote Sens. 2019, 12, 788–802. [Google Scholar] [CrossRef]
  60. Tian, M.; Yang, Z.; Duan, C.; Liao, G.; Liu, Y.; Wang, C.; Huang, P. A Method for Active Marine Target Detection Based on Complex Interferometric Dissimilarity in Dual-Channel ATI-SAR Systems. IEEE Trans. Geosci. Remote Sens. 2020, 58, 251–267. [Google Scholar] [CrossRef]
  61. Werle, D. RADARSAT SAR Azimuth Ambiguity Patterns-The Ghost Fleet of Halifax Harbour and Implications for Applications. In Proceedings of the International Symposium Geomatics in the Era of RADARSAT (GER’97), Ottawa, ON, Canada, 25–30 May 1997; p. 10. [Google Scholar]
  62. Hu, C.; Xiong, B.; Lu, J.; Li, Z.; Zhao, L.; Kuang, G. SAR Azimuth Ambiguities Removal for Ship Detection Using Time-Frequency Techniques. In Proceedings of the Geoscience and Remote Sensing Symposium (IGARSS), Quebec City, QC, Canada, 13–18 July 2014; pp. 982–985. [Google Scholar]
  63. Avolio, C.; Costantini, M.; Di Martino, G.; Iodice, A.; Macina, F.; Ruello, G.; Riccio, D.; Zavagli, M. A Method for the Reduction of Ship-Detection False Alarms Due to SAR Azimuth Ambiguity. In Proceedings of the Geoscience and Remote Sensing Symposium (IGARSS), Quebec City, QC, Canada, 13–18 July 2014; pp. 3694–3697. [Google Scholar]
  64. Alpers, W.; Romeiser, R.; Hennings, I. On the Radar Imaging Mechanism of Kelvin Arms of Ship Wakes. In Proceedings of the IGARSS ’98. Sensing and Managing the Environment. 1998 IEEE International Geoscience and Remote Sensing. Symposium Proceedings. (Cat. No.98CH36174), Seattle, WA, USA, 6–10 July 1998; Volume 4, pp. 1932–1934. [Google Scholar] [CrossRef]
  65. Tings, B.; Pleskachevsky, A.; Velotto, D.; Jacobsen, S. Extension of Ship Wake Detectability Model for Non-Linear Influences of Parameters Using Satellite Based X-Band Synthetic Aperture Radar. Remote Sens. 2019, 11, 563. [Google Scholar] [CrossRef] [Green Version]
  66. Graziano, M.; D’Errico, M.; Rufino, G. Wake Component Detection in X-Band SAR Images for Ship Heading and Velocity Estimation. Remote Sens. 2016, 8, 498. [Google Scholar] [CrossRef] [Green Version]
  67. Karakuş, O.; Rizaev, I.; Achim, A. Ship Wake Detection in SAR Images via Sparse Regularisation. IEEE Trans. Geosci. Remote Sens. 2020, 58, 1665–1677. [Google Scholar] [CrossRef] [Green Version]
  68. Yang, T.; Karakuş, O.; Achim, A. Detection of Ship Wakes in SAR Imagery Using Cauchy Regularisation. arXiv 2020, arXiv:2002.04744. [Google Scholar]
  69. Chang, Y.L.; Anagaw, A.; Chang, L.; Wang, Y.; Hsiao, C.Y.; Lee, W.H. Ship Detection Based on YOLOv2 for SAR Imagery. Remote Sens. 2019, 11, 786. [Google Scholar] [CrossRef] [Green Version]
  70. Girshick, R.; Donahue, J.; Darrell, T.; Malik, J. Rich Feature Hierarchies for Accurate Object Detection and Semantic Segmentation. In Proceedings of the IEEE Conference on Computer Vision and Pattern Recognition, Columbus, OH, USA, 23–28 June 2014; pp. 580–587. [Google Scholar] [CrossRef] [Green Version]
  71. Girshick, R. Fast R-Cnn. In Proceedings of the IEEE International Conference on Computer Vision, Santiago, Chile, 7–13 December 2015; pp. 1440–1448. [Google Scholar]
  72. Ren, S.; He, K.; Girshick, R.; Sun, J. Faster R-CNN: Towards Real-Time Object Detection with Region Proposal Networks. In Advances in Neural Information Processing Systems 28; Cortes, C., Lawrence, N.D., Lee, D.D., Sugiyama, M., Garnett, R., Eds.; Curran Associates, Inc.: New York, NY, USA, 2015; pp. 91–99. [Google Scholar]
  73. Li, J.; Qu, C.; Shao, J. Ship Detection in SAR Images Based on an Improved Faster R-CNN. In Proceedings of the SAR in Big Data Era: Models, Methods and Applications (BIGSARDATA), Beijing, China, 13–14 November 2017; pp. 1–6. [Google Scholar] [CrossRef]
  74. Redmon, J.; Divvala, S.; Girshick, R.; Farhadi, A. You Only Look Once: Unified, Real-Time Object Detection. In Proceedings of the IEEE Conference on Computer Vision and Pattern Recognition (CVPR), Las Vegas, NV, USA, 27–30 June 2016; pp. 779–788. [Google Scholar] [CrossRef] [Green Version]
  75. Kang, M.; Ji, K.; Leng, X.; Lin, Z. Contextual Region-Based Convolutional Neural Network with Multilayer Fusion for SAR Ship Detection. Remote Sens. 2017, 9, 860. [Google Scholar] [CrossRef] [Green Version]
  76. Sharifzadeh, F.; Akbarizadeh, G.; Seifi Kavian, Y. Ship Classification in SAR Images Using a New Hybrid CNN–MLP Classifier. J. Indian Soc. Remote Sens. 2019, 47, 551–562. [Google Scholar] [CrossRef]
  77. Cloude, S. The Dual Polarization Entropy/Alpha Decomposition: A PALSAR Case Study. ESASP 2007, 644, 2. [Google Scholar]
Figure 1. The vessel on its way to the test-bed lake.
Remotesensing 13 01487 g001
Figure 2. Example images of sea truth masks. Left column: TSX SAR images (@DLR 2017) coloured according to each image’s statistics; centre column: pixel-based sea truth mask; right column: object-based sea truth mask.
Remotesensing 13 01487 g002aRemotesensing 13 01487 g002b
Figure 3. New combinations of the polarimetric detectors Cross-iDPolRAD (volume detector) and Co-SiDPolRAD (surface detector).
Remotesensing 13 01487 g003
Figure 4. Incidence angle: high; boat: inclined; mode: SM; polarization: dual-pol VH and VV (scale in meters, colour ramps are without units).
Remotesensing 13 01487 g004
Figure 5. Incidence angle: high; boat: orthogonal, moving in azimuth; mode: SM; polarization: dual-pol HV and HH (scale in meters, colour ramps are without units).
Remotesensing 13 01487 g005
Figure 6. Incidence angle: low; boat: orthogonal, non-moving; polarization: low; mode: SM; dual-pol HV and HH (scale in meters, colour ramps are without units).
Remotesensing 13 01487 g006
Figure 7. Comparing resolution: ROC curves for different acquisition modes (Pixel-based, multilooked).
Remotesensing 13 01487 g007
Figure 8. Comparing polarimetric modes: ROC curves for dual co-pol and cross-pol data in SM mode (pixel-based, multilooked).
Remotesensing 13 01487 g008
Figure 9. Assessing multilooking: ROC curves for different TSX-modes (pixel-based, not multilooked).
Remotesensing 13 01487 g009
Figure 10. Object-detection: impact of the usage of a buffer around the boat on ROC curves for different TSX-modes (multilooked, false positives in log10 scale).
Remotesensing 13 01487 g010
Figure 11. Impact of the incidence angle on the ROC curves for different acquisition modes (pixel-based, multilooked).
Remotesensing 13 01487 g011
Figure 12. ROC curves for the iDPolRAD volume detector (green), its “surface” variant (orange) and the two new combinations in dark blue (pixel-based, multilooked).
Remotesensing 13 01487 g012
Figure 13. VDS performance test on S1 data (pixel-based, multilooked).
Remotesensing 13 01487 g013
Table 1. Available data according to acquisition mode and polarization.
TSX-HSImages from...TSX-SMImages from...
Single-Pol ModeDual-Pol ModeSingle-Pol ModeDual-Pol Mode
Co-pol1314Co-pol812
Cross-pol00Cross-pol06
Table 2. VDSs under test, applicable polarimetric channels and total number of samples (n) per detector.
DetectorCategorySingle
Co-Pol
Dual
Co-Pol
Dual
Cross-Pol
N
(HS, SM)
Fixed Parameters:
RR (Dimensionless),
All Others in m
Cell Averaging Constant
False Alarm Rate
(CA-CFAR)
intensity
based
🗸🗸🗸27,26training window size: 36
guard window size: 24
CUT: 1 cell
0.94,0.94,0.94 Sub-look Correlation
(SubCorr)
sub-look🗸🗸🗸27,26training window size: 12
CUT: 1 cell
Polarimetric Notch Filter
(PNF)
polari-
metric
🗸🗸7,9training window size: 96
CUT 1 cell
RR: 0.02
0.94,0.94,0.94 Polarimetric Entropy
(PolEntropy)
polari-
metric
🗸🗸7,9training window size: 7
CUT: 1 cell
Polarimetric Match
Filter (PMF)
polari-
metric
🗸🗸7,9training window size: 120
guard window size: 24
CUT window size: 24
0.94,0.94,0.94 Polarimetric Whitening
Filter (PWF)
polari-
metric
🗸🗸7,9training window size: 120
guard window size: 24
CUT window size: 24
Polarimetric Symmetry
(PolSym)
polari-
metric
🗸0,6training window size: 5
guard window size: 2
CUT: 1 cell
0.94,0.94,0.94 Cross-pol Intensity Depolarization
Ratio Anomaly "volume"
Detector (Cross-iDPolRAD)
polari-
metric
🗸0,6training window size: 36
guard window size: 12
CUT: 1 cell
Co-pol Surface Intensity
Depolarization Ratio
Anomaly Detector
(Co-SiDPolRAD)
polari-
metric
🗸0,6training window size: 36
guard window size: 12
CUT: 1 cell
Table 3. AUCs for different combinations of logical operators used for the iDPolRAD-comb2.
Negatives
andor
Positivesand0.490.7
or0.981
Table 4. Detectors’ performance comparison (pixel-based, multilooked).
DetectorApplicability to Single-Pol ModeOverall PerformanceChallengesCost per Step
(Norm = CA-CFAR)
Low Incidence AngleCross-Pol
CA-CFAR🗸9576731
SubCorr🗸9478752.8
PNFx9896993.8
PolEntropyx69639042.3
PMFx99979970.6
PWFx99979914.9
PolSymx9999980.4
Cross-iDPolRADx4645460.4
Co-SiDPolRADx94100940.4
iDPolRAD_comb1x99100990.8
iDPolRAD_comb2x1001001000.8
Publisher’s Note: MDPI stays neutral with regard to jurisdictional claims in published maps and institutional affiliations.