1. Introduction
The transport of clastic sediments and solutes by rivers occurs in the form of the bed load, suspended load, and dissolved load. The importance of the bed load transport is that it determines the use of the river for inland shipping, it affects the level of flood risk, and it controls abiotic factors of the river’s ecology. The bed load’s contribution to the total transport of sediments by the river is usually small, about 5% [
1]. Babiński [
2] has estimated, according to the literature search, that in the rivers of the world, the clastic load is about four times larger than the dissolved load. In the total transport, the clastic sediments’ suspended load comprises 85–99%.
To measure the bed load with instruments is difficult, due to the fact that the bed material is transported by multiple processes operating at various scales—from a single grain movement to the mass transport through shifting of sandbars. A common practice is to use empirical formulas for the bed load transport, based on laboratory measurements. Formulas for the bed load transport estimation represent existing theories of the critical shear stress or velocity, statistics and probability, and energy exchange. The examples of such formulas for the bed load calculation are: DuBoys, Shield, Schoklitsch, Meyer–Peter–Muller, Einstein, and Vanoni–Brooks [
3]. The empirical formulas can be used for a calculation of the bed load on the active part of the river channel bottom but do not take into account the temporal storage of the sediments in the different bed forms of the river channel.
The analysis of the channel bars and emerged channel forms’ deformation ratio is also used for the study of the sediment transport. Such an approach implies that the channel bars are capable of capturing a substantial amount of the sediment transported during floods. An example of the detection of the emerged channel bar area changes on the Mississippi River, by the analysis of the sequence of the Landsat satellite images, was presented by Wang and Xu [
4]. Landsat images were also used to trace a deformation of a large sandbar in the middle Yangtze River [
5].
The detection of the alternate bars on the river can be assisted by the remote sensing methods, based on the satellite multi-spectral image processing. It is possible to detect and delineate the sandbars in the river channel by using spectral indices, defined as mathematical expressions with a minimum of two wavelengths of spectral reflectance. An application of the water indices makes the automation of image processing possible. The equations contain universal variables, which do not depend on the sensors of the image recording device. The water indices used for the delineation of water from the background also require the definition of the fixed threshold values [
6]. In the literature, their researchers report a variety of spectral indices used for the land-water delineation. One frequently used is Normalized Difference Water Index (NDWI), developed by McFeeters [
7]. Another important index is Modified Normalized Difference Water Index (MNDWI), which was proposed by Xu [
8]. Other indices frequently appearing in the literature are Automated Water Extraction Index shadow (AWEIsh) and Automated Water Extraction Index no shadow (AWEInsh), developed by Feyisa [
9]. Indices such as Land Surface Water Index (LSWI) and Modified Land Surface Water Index (MLSWI) are also used to detect water surfaces [
10,
11]. An overview of the land-water detection remote sensing indices was performed by Robak et al. [
12], as well as Kryniecka and Magnuszewski [
13].
The motivation of this study was to investigate unique conditions of the sediment transport in the regulated lower Vistula River. This study seeks to determine whether remote sensing data from the Sentinel-2 satellite could be used to study the movement of sandbars. The regulation works at the lower Vistula River created a straight and narrow river channel, while natural rivers have meandering or braiding channels. Regulated rivers with a large sediment transport face the problem of formation of a very dynamic channel with alternate sandbars [
1].
2. Description of the Study Area
The Vistula River is the second largest river in the Baltic Sea Basin with a catchment area of 194 × 10
3 km
2. The length of the river is 1047 km, and its sources are located in the Carpathian Mountains, while its mouth is in the Bay of Gdansk (
Figure 1).
The lower Vistula River has a longtime series of hydrological observations, collected at Toruń (735 km), Grudziądz (835 km), and Tczew (909 km), from gauges operated by the Institute of Meteorology and Water Management (IMGW). Characteristic discharges and channel geometry metrics of the lower Vistula River are shown in
Table 1. In the hydrological regime of the river, there are characteristic spring floods, originating from snow thawing in March and April, and summer floods caused by rainfall in May–July. A low flow period starts at the end of the summer and continues until the winter.
The lower Vistula River was regulated in the 19th century, starting from the border between Russia and Prussia, to the mouth of the river at the Bay of Gdansk. River regulating works were established in the years 1856–1878, at 718–939 km, with 599 groins, 91 side arm closings, and 2173 km of longitudinal dams built. According to the design, the width of the regulated channel was set to 375 m for mean discharge. In natural conditions before the regulation, the average width of the Vistula River channel, at the reach 719–814 km, was 785 m (without islands), while recently, after the regulation, it is 410 m [
16]. At the beginning of the 20th century, it became clear that the effects of regulation were not being met. The river channel was left too wide for the low flow conditions and the river channel was straightened too much. During the low flow, the thalweg is very sinuous and the depths of the runs between the alternate sandbars drop to 0.7–0.8 m [
17].
Sediments forming sandbars on the lower Vistula River mainly comprise a sand fraction. The fine sand percentage share in the samples under study amounts to 99.6%, whereas gravels constitute the remaining 0.3% fraction [
18]. The representative bed load grain diameter (median value from sieve curve) is d
50 = 0.5 mm [
19]. Suspended sediments of the lower Vistula River contain fractions of clay, silt, and fine sand. The dominating fraction is silt, making up 55–70% of the sample’s weight. The fine sand fraction constitutes 20–30% of the weight of the sample. The representative diameter (median value from sieve curve) of the suspended sediments at the lower reach of the Vistula River is d
50 = 0.02 mm [
20].
The transport of the suspended sediments in the years 1956–1965, at the longitudinal profile of the Vistula River, shows that the average annual transport of suspended sediment at 877 km was 1.3 × 10
6 t, while close to the mouth of the river, at 908.6 km, it was 1.2 × 10
6 t [
21].
According to Babiński and Habel [
22], an average annual mass of the bed load transported on the lower Vistula River in the regulated reach around the city of Toruń (732 km), in the period 1971–1995, did not exceed 1.0 × 10
6 t. The intensity of transport during the wet year of 1975 was higher and reached 1.5 × 10
6 t.
Average parameters of the lower Vistula River channel in the regulated reach were calculated by Łajczak [
15], from the results of hydrometric measurements performed by the Institute of Meteorology and Water Management (
Table 1). Field measurements on the regulated reach of the Vistula River between Silno and Toruń (721–735 km), performed by Habel [
18], showed that a slope is in the range of 0.000165–0.000176 and does not change with the increase of discharge.
The shear stress forming the force moving the river’s sediment can be calculated by Du Boys’ [
3] formula:
where τ is shear stress (N × m
−2), ρ is water density (kg × m
−3), g is the Earth’s gravity (m × s
−2), h is the depth of the water (m), and I is the hydraulic slope. Values of the shear stress calculated using Formula (1), for characteristic discharges of the lower Vistula River, are shown in
Table 1. Comparison of shear stress, τ, and representative bed load diameter, d
50, indicates that in the regulated lower Vistula River channel there are conditions for the formation of dunes as a dominating bed form [
1].
According to common classifications of the position and shape of the channel meso-forms, the study area includes alternate bars and point bars. The term, channel meso-form, means that the sandbar length is of a similar size to the channel width. In this study, we focus on the alternate bars freely migrating down the lower Vistula River’s regulated channel.
The morphology of the alternate sandbars may change multiple times a year, depending on water levels [
16]. At the low flow conditions, the edges of the alternate bars tend to erode, while even minor floods and submergences of the sandbars lasting a few hours tend to alter the sandbar surfaces and move them downstream. In the relief of the sandbars, the coexistence of the sandbars with smaller forms occurring at their surfaces, such as dunes and ripple marks, can be seen.
3. Materials and Methods
After the visual inspection of the Sentinel-2 image, recorded on 20 August 2015, the following reaches were selected for analysis: 852–866 km, 870–874 km, and 879–885 km (
Figure 1). The short reaches of 866–870 km and 874–879 km were excluded from the analysis, since they are located at the bends of the lower Vistula River channel where stationary point bars develop.
3.1. Data Sources
Level 1C images were obtained from the Copernicus Open Access Hub. The criteria for the search were to find a scene covering the whole range of the lower Vistula River, showing a low cloud coverage and recording during the late summer period, corresponding to the time of low flows, when the alternate bars are not submerged. Additional criteria of the satellite image selection were similar time intervals between the dates of registration. A time interval being approximately equal to 12 months guarantees that the full seasonal changes of the Vistula River flow regime are represented, including floods in the spring and summer times, which are important for sediment transport. The results of the query provide five Sentinel-2 images recorded on 20 August 2015 (Vistula River discharge at Grudziądz gauge Q = 571 m3 × s−1), 4 September 2016 (Q = 306 m3 × s−1), 30 July 2017 (Q = 581 m3 × s−1), 20 September 2018 (Q = 659 m3 × s−1), and 30 July 2019 (Q = 712 m3 × s−1). Hydrological conditions expressed by the daily discharge (Q) during the registration of the selected images are similar (except for the date of 4 September 2016), remaining between the average low flow discharge (MLQ = 359 m3 × s−1) and average mean flow discharge (MMQ = 992 m3 × s−1). Discharge, as an indicator of hydrological conditions, is independent of the changing channel geometry and longitudinal slope.
3.2. Methods
The images were processed with the Sentinel Application Platform (SNAP) and QGIS software. The flow chart of the applied processing steps on the Sentinel-2 satellite data is shown in
Figure 2.
In the first stage, Sentinel-2 Level 1C satellite images were obtained and opened in SNAP. In the next step, a resampling to 10 m resolution was done on individual channels, so as it was possible to calculate and generate the water indices. Next, the water indices were calculated using the Band Math tool in SNAP. For the purpose of the analysis, Sentinel Water Mask (SWM) (3) and Automated Water Extraction Index no shadow (AWEInsh) (4) were used.
where B represents Band 2 (wavelength 490 nm), G represents Band 3 (560 nm), NIR represents Band 8 (842 nm), SWIR1 represents Band 11 (1610 nm), and SWIR2 represents Band 12 (2190 nm).
The next step was to define the threshold value (t) of a pixel value on the histogram, according to the Otsu [
23] method. The threshold values used in this study are t = 0.9 for SWM and t = −0.1 for AWEInsh. Examples of the indices’ calculation results are shown graphically in
Figure 3.
To delineate the alternate sandbars, the binary classification was done using the Band Math tool in SNAP. It was assumed that the pixels with a similar spectral reflection corresponded to the same objects [
24]. The image was divided into two classes, the first being water, and the second being everything but water. All binary images were cut using the Spatial Subset tool. Having defined the two classes, a procedure of polygonising raster images to vector layers was done.
Borders of the alternate sandbars, obtained by the image processing method, were stored as polygons. For comparison to the automatic delineation of borders of the altered sandbars, a manual delineation (MD) on the basis of visual interpretation on the color composite images (bands 4, 3, and 2) was also done.
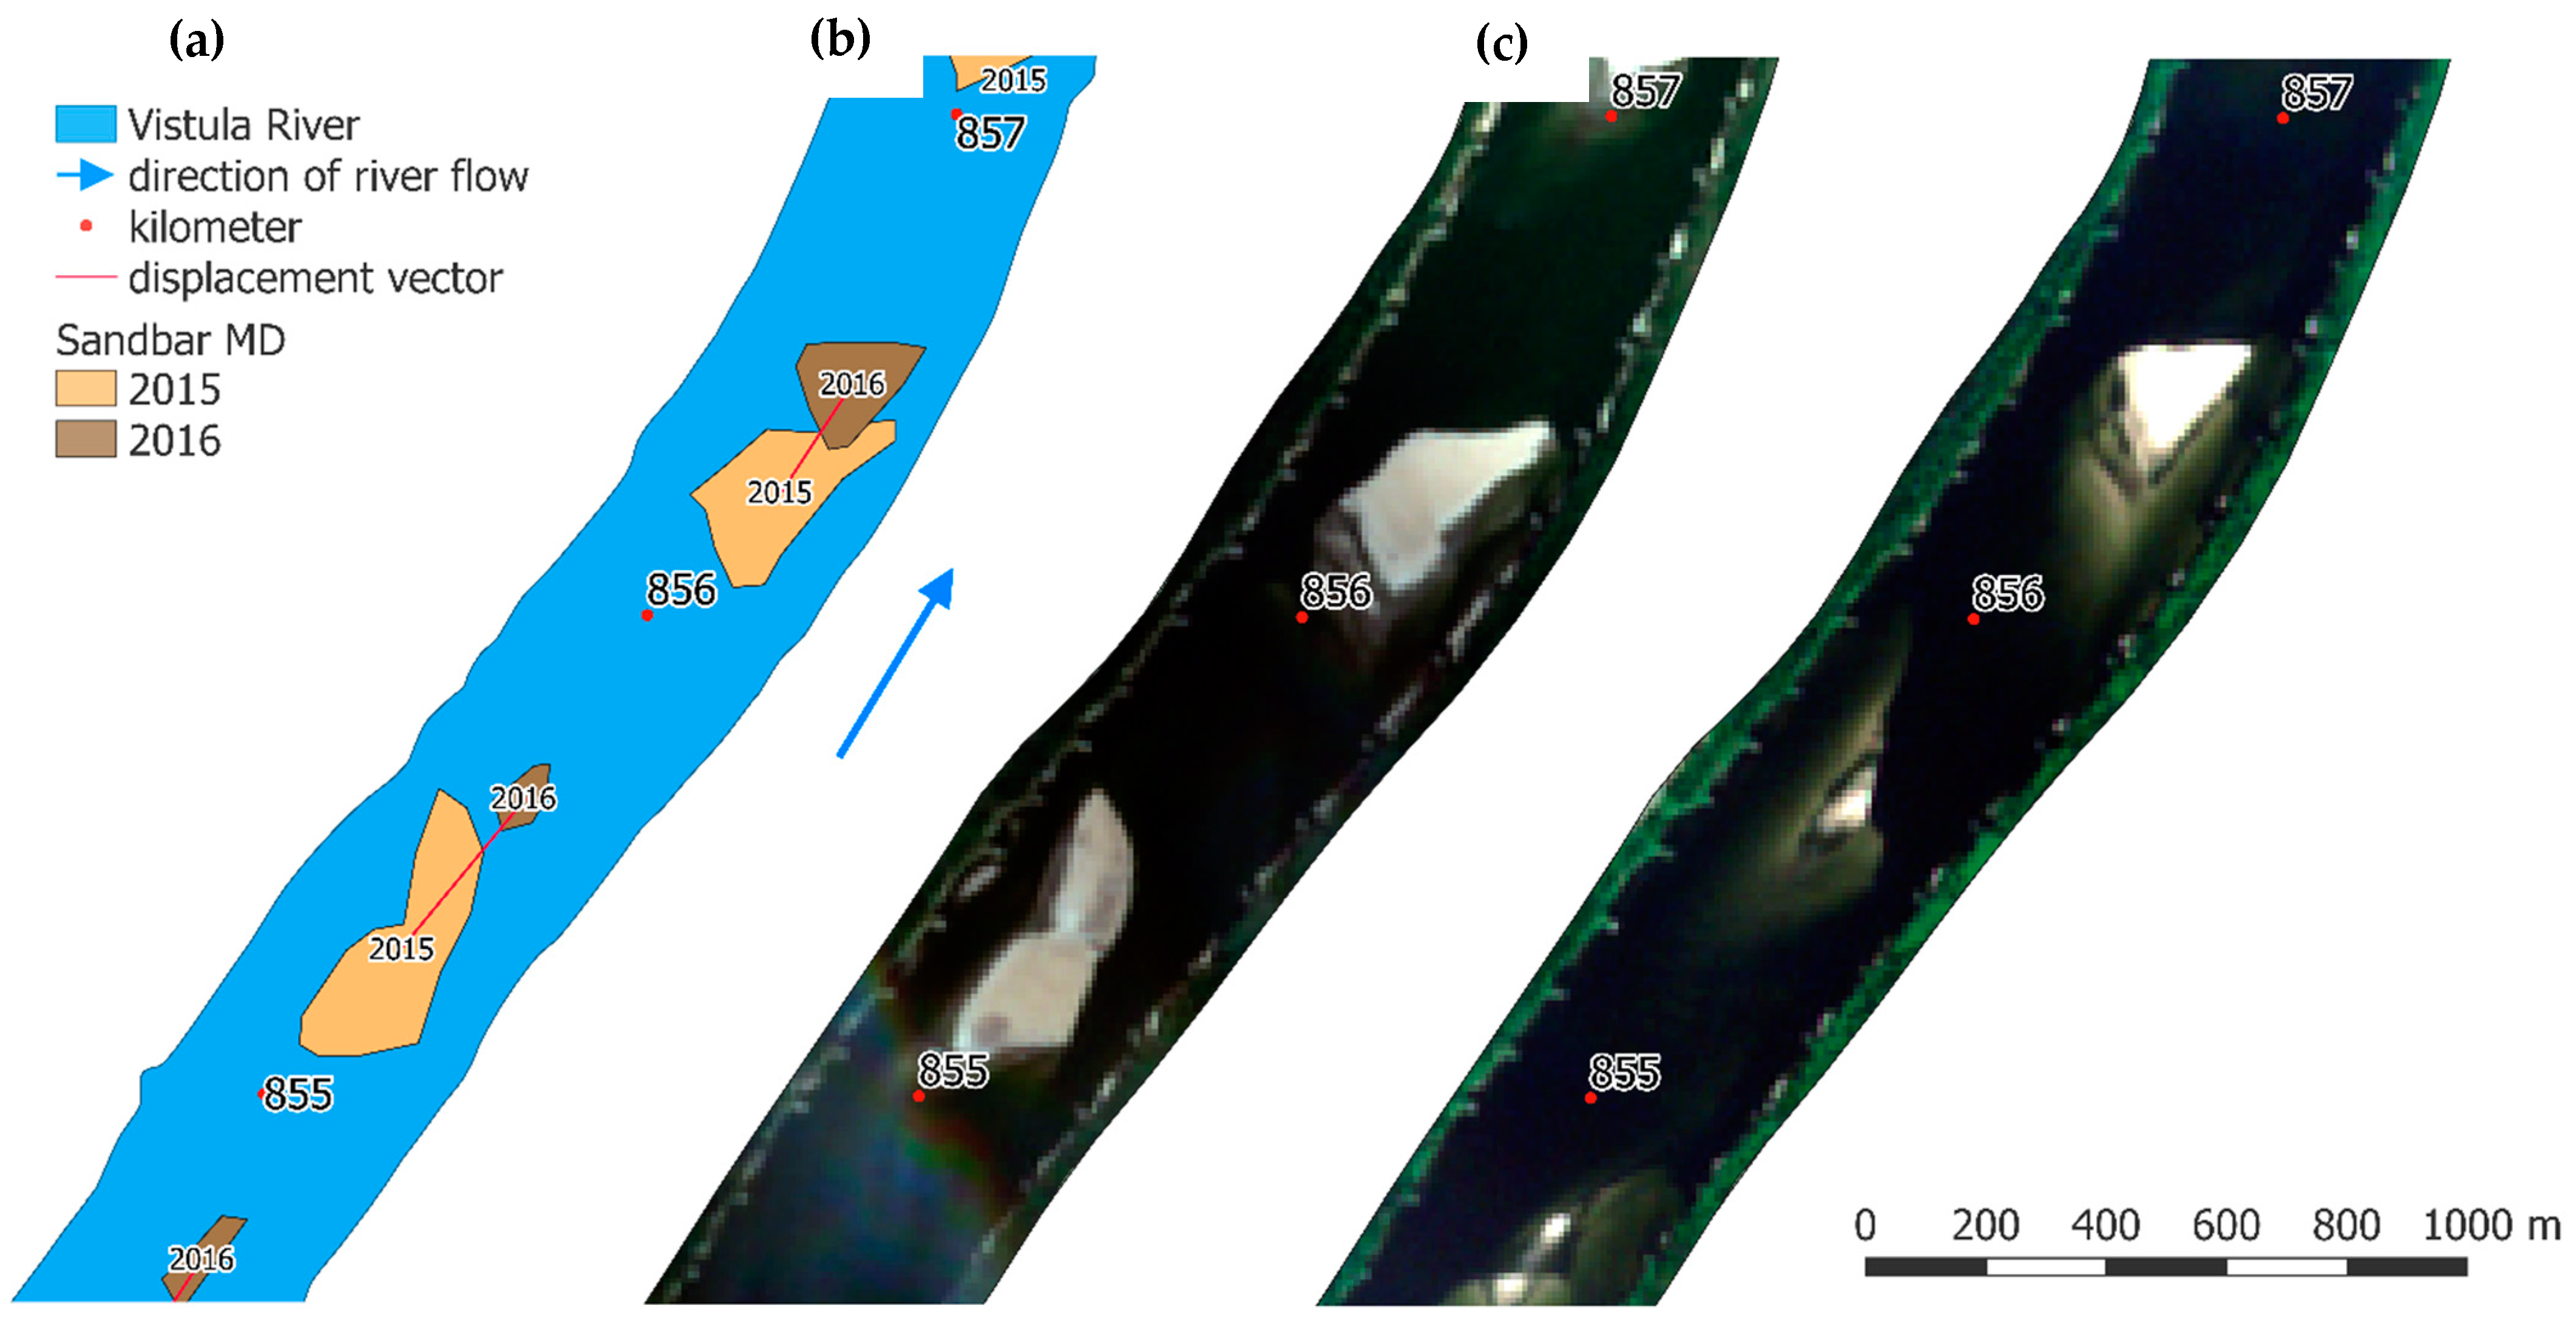
To detect changes in the riverbed channel in the analyzed time intervals, the vectors of the alternate sandbar shifts were calculated as the distance between the geometric centers of the polygons (
Figure 4). The velocity of the sandbars’ movements in m × day
−1 was calculated by dividing the average distance of the sandbar shift by the number of days in the time intervals.
4. Results and Discussion
To estimate the absolute compatibility between the three methods of sandbar delineation (AWEInsh, SWM, and MD), 32 sandbars were selected in the Sentinel-2 image, recorded on 20 August 2015. For statistical analysis, an interclass correlation coefficient (ICC) was applied to compare the alternate sandbar areas. The results of the ICC analysis (
Figure 5) showed that there is a high degree of reliability and homogeneity of the areas obtained with AWEInsh, SWM, and MD methods of the sandbar delineation (statistical significance level:
p < 0.001). The measurement reliability is ICC
single = 0.550, while the measurement reliability, being the mean of the three methods used, is slightly higher and amounts to ICC
average = 0.786. The data were prepared by sorting, to better illustrate the correlations and relationships between them. Greater compliance applies to the SWM and AWEInsh spectral index methods, while a lower compliance is obtained in the case of the MD. The results are more consistent in the domain of smaller sandbar areas. The tendency of oversizing of sandbar areas obtained by automatic methods, based on SWM and AWEInsh indices, is visible. It can be explained by the fact that a large sandbar’s visual interpretation, with the use of a true color composite image (bands 4, 3, and 2), often leads to the delineation of separate forms, while automatic methods merge smaller forms into one unit.
Table 2 provides the results of the analysis of the shift and velocity distance of the sandbars’ movement using SWM, AWEInsh, and MD methods of the sandbar delineation. The largest average annual shift of sandbars took place from 30 July 2017 to 20 September 2018 and, depending on the method used for delineation, it ranged from 509 to 548 m. Velocity of the movement calculated as an average shift for one day was between 1.2 and 1.3 m × day
−1. The smallest average shift of the alternate sandbars was characteristic of the period from 20 August 2015 to 4 September 2016, depending on the adopted method from 279 to 310 m, and an average shift from 0.7 to 0.8 m × day
−1. The biggest differences in the average length of alternate sandbar shifts are characteristic of the period from 4 September 2016 to 30 July 2017. Results obtained by SWM and MD methods differ by 90 m. This high difference can be explained by the fact that the first image was recorded on 4 September 2016, at the time of very low flow (Q = 306 m
3 × s
−1). Images show underwater parts of the sandbars, due to high transparency of water and low turbidity. Automatic methods, SWM and AWEInsh, applied on the image gave longer and more complicated bank lines than obtained by the MD method. Consequently, geometric centers were different on automatically and manually delineated polygons. ICC analysis of sandbar area and comparison of shift length obtained by SWM, AWEInsh, and MD methods shows that the delineation of sandbars by spectral water indices is more objective and gives less biased results.
To confirm the movement of alternate sandbars, a location of the shipping waterway on the lower Vistula River was measured with an echosounder. The measurements were done with a Lowrance HDS5 sonar and GPS receiver for two consecutive years: 4 September 2016 and 14 July 2017. The sonar was mounted on a motorboat following the thalweg in a shipping lane, shown by bank navigation marks. The sonar georeferenced data were transformed in the ReefMaster program to a vector shape format and displayed on the river channel map in
Figure 6. The comparison of the alternate sandbar locations on the studied range of the lower Vistula River shows that their location and the pattern of the shipping lane is repeating approximately every 3 years. This is an approximation because the time interval between image registrations is about one year. It was an intention to analyze images recorded in low flow conditions in time intervals covering complete phases of the hydrological regime of the river. The movement of the alternate sandbars controls the thalweg position and shipping lane geometry.
The alternate sandbars move down the river channel in response to excessive shear stress during floods and morpho-hydrodynamic instability. The intensity of sediment transport and distance of the alternate sandbar shift can be related to hydrological precedent conditions (average discharge and maximum discharge). To study this relationship, the average distance of the sandbar shift measured by the MD method was compared to the average discharge of MQ and maximum discharge of Q
max, calculated for the Grudziądz gauge in the time intervals between subsequent image recordings (
Table 3).
The long-term average discharge for the analyzed range of the Vistula River is MMQ = 992 m3 × s−1 (years 1951–1990 at the Torun gauge located at the 734 km of the river’s course). Comparing the average discharge from the studied intervals to the long-term average discharge, we may notice that the period from 30 July 2017 to 20 September 2018 was wet (MQ = 1140 m3 × s−1). This created conditions for greater distances of the alternate sandbar shift; in contrast, the period from 20 August 2015 to 4 September 2016 was very dry (MQ = 325 m3 × s−1) and that was reflected in the minimal shift of alternate sandbars.
A similar rate of the alternate sandbar movement is reported by Babiński and Habel [
22], and Habel et al. [
25]. From repeated echo sounding measurements of the meso-form movement in the bridge cross section in the city of Toruń, they estimated the rate of the shift of alternate bars as 0.4–2.4 m × day
−1 (on average 1.1–1.2 m × day
−1).
5. Conclusions
Sentinel-2 images provide a valuable source of information on the channel morphology of the lower Vistula River in the regulated reach. The spatial resolution of the data is acceptable for the detection of the alternate sandbars on the river. Recorded in late summer, the images from consecutive years have been sufficient to detect changes to the river channel, originating from winter and summer floods. Our study has confirmed that there is a direct relationship between hydrological conditions (average discharge) and the intensity of bed load transport, expressed by the distance of the shift of the alternate sandbars.
The inland navigation faces the problem of keeping the minimum transit depths and the passages between the pools, and the waterway plan is tortuous with the sharp turns of a small curvature. The pattern of the alternate sandbar shift shows around 3 year cycles, and this pattern may be useful in planning river training works or delineating the position of the thalweg on the waterway. The presented method of the automated alternate sandbar detection by the remote sensing indices, SWM and AWEInsh, makes the operational use of Sentinel-2 images as a navigation aid in inland shipping possible.
An overly straightened river channel provides the conditions for the continuous movement of the alternate bars. These meso-forms make navigation difficult, but they are very important to the natural environment, serving as the habitats for migrating birds, and providing refuge for nesting, among other roles. Looking forward, Sentinel-2 images with SWM and AWEInsh spectral indices may be used to study the velocity of the alternate sandbar movement, significant for building a better understanding of the phenomena itself, and also bearing important implications for navigation, ecosystem dynamics, and water management generally.


