Abstract
The Landsat 7 (L7) spacecraft and its instrument, the enhanced thematic mapper plus (ETM+), have been consistently characterized and calibrated since its launch in April of 1999. These performance metrics and calibration updates are determined through the U. S. Geological Survey (USGS) Landsat image assessment system (IAS), which has been performing this function since launch. Starting in 2016, the USGS adopted a tiered collection management structure for its Landsat data products that ensures a consistent method of processing for the Landsat archive within a given collection while allowing a set of calibration updates to be performed between any two given collections. The time frame between 2016 and the end of 2020 was part of the Landsat data Collection 1, in the middle of 2020 was the start of the Landsat Collection 2 data products. The start of a given collection initiates the reprocessing of the Landsat archive, which may involve one or more of a set of updated calibration parameters, improvements in the support data needed for product generation, and improved algorithms used in both the processing flow of products along with the characterization and calibration of the Landsat instruments and spacecraft. This paper discusses only the ETM+ geometric spacecraft and instrument calibration improvements for Collection 2. Three ETM+ calibration updates were made for the ETM+; updates to the thermal band odd-to-even detector alignment, sensor to attitude control system (ACS) alignment, and a cold-to-warm focal plane alignment adjustment. The sensor alignment updates impact only the accuracy of the systematic terrain products (L1GT), which are the products generated before applying any corrections based on the ground control used in registration. The band alignment changes impacted only bands 5, 6, and 7 within the focal plane. Other geometric calibration updates, such as scan mirror alignment, are done on a routine basis and are not part of the Collection 2 updates due to their more dynamic characteristics.
1. Introduction
The data products from The Landsat 7 (L7) enhanced thematic mapper (ETM+) have been high quality, well-calibrated, multi-temporal registered since its launch in April of 1999 [1]. The Landsat 7 image assessment system (IAS) ground processing system was designed and built to perform characterization and calibration of the instrument post-launch [2]. With the help of the IAS, the geometric characterization and calibration of the ETM+ instrument have been an ongoing effort, with several calibration updates being performed throughout the instrument’s lifetime [3,4]. In late 2020, several geometric calibration updates were performed concerning its focal plane, impacting the internal coregistration of the detectors and bands and the alignment between the focal plane and the attitude control system (ACS). The ETM+ image data contain three band resolutions: a 15-m panchromatic (pan) band, six 30 m multispectral bands (three visible, one near-infrared, two shortwaves infrared), and a 60 m thermal band. Detectors for the visible bands, near-infrared, and the panchromatic band are located on the primary focal plane, while detectors for the shortwave infrared and thermal bands are located on the thermally controlled cold focal plane [5].
Three calibration updates were performed before the reprocessing of the ETM+ data for Collection 2 product generation. These updates to the Landsat 7 ETM+ calibration parameters would be part of the Collection 2 reprocessing of the Landsat archive.
- (1)
- An update to the thermal band detector alignment. A detector-to-detector misalignment was determined to be present within the thermal band just after generating the Collection 1 data set. Upon inspection, the prelaunch detector alignment values for the thermal band appeared to contain small residual errors, less than 15 micro-rdaians (µrad). This misalignment, which was part of the prelaunch characterization of the thermal band, was small and only visible under ideal situations. A complicating factor in this odd–even detector alignment is the fact that the current geometric correction of the ETM+ data does not account for the change in scan mirror velocity caused by the switch from scan angle monitor (SAM) to bumper mode operation [6]. Although this effect is also very small, when combined with the error arising from the prelaunch alignment calibration, it would allow for the offsets between odd and even detectors to be at times visually identifiable. For Collection 2, only the prelaunch calibration portion of this effect was accounted for. The correction due to the velocity change for the switch in the mirror’s operational mode will be part of a subsequent collection reprocessing. This detector-to-detector alignment adjustment will improve upon the thermal band co-registration to the other ETM+ bands, remove the visual artifact of jagged edges on features that otherwise would be a smooth edge, and improve upon its internal geometric accuracy.
- (2)
- An update to the warm to cold focal plane adjustment. Like the thermal band odd-to-even detector calibration, this adjustment was also small, less than 5 µrad. These changes, which occurred throughout the mission, were most likely caused by changes within the program and how the instrument was managed. The first change was attributed to the scan line corrector (SLC) failure. The second to the switch from the SAM to the bumper mode control of the scanning mechanism. The third occurred after the launch of the Landsat 8 (L8) system, at which point the duty cycle of the ETM+ changed based upon the success of the L8 instruments. This adjustment was performed to improve consistency in time of the band-to-band alignment across the full mission timeline.
- (3)
- An update to the ETM+ sensor to attitude control system alignment. Prior to the switch to bumper mode, this alignment was stable, except for a shift that occurred during the launch of the spacecraft itself, as the calibration parameters remained stable during normal SAM mode operations. After the switch to bumper mode, a consistent change has been shown to occur with this alignment. Finding whether this alignment was due to the coupling between the switch to this mode of operating the mirror and the sensor alignment parameters has not been determined. This adjustment improves upon the level-1 systematic terrain ETM+ products, products, which perform a terrain correction to the data in the absence of being able to apply an adjustment based on ground control. This adjustment also achieves a better relative placement of the systematic image before correlating the image against the Landsat ground control library, which could, in turn, improve upon the correlation measurements.
Starting in 2016, the USGS adopted a data processing collection management structure for its Landsat data products that ensures a consistent set of processing for the Landsat archive within a given collection while allowing a set of calibration updates to be performed between any two given collections. In late 2020, the USGS began processing and distributing its second series of collections, which is referred to as Collection 2. The changes listed above were part of the Collection 2 reprocessing of the Landsat archive. These three changes only represent a portion of the geometric and radiometric changes that were made between Collection 2 and Collection 1 [7]. The thermal band detector alignment changes would only impact the user community, which directly uses this band within their application. The band alignment changes adjusted bands 5, 6 and 7 concerning bands 1, 2, 3, 4, and 8. As such, users whose applications only use the later listed bands (1, 2, 3, 4, 8) would see no impact in their applications due to these changes. The sensor alignment changes would only impact users, which use the L1GT products within their application. The band alignment changes are less than 0.1 multispectral pixels. The expected changes due to improvements in the ground control and DEM would be considered as additional geometric changes, are global changes, and although less than a pixel in the majority of locations would be of greater magnitude concerning geometric differences between Collection 1 and Collection 2 and the band alignment listed within this paper.
Figure 1 shows the focal plane layout of the ETM+ sensor. Within the figure, one instantaneous field of view (IFOV) is displayed, used as an indication of the distances between bands and detectors, and is associated with a multispectral detector. One multispectral detector has a nominal IFOV value of 42.5 µrad. The three calibrations discussed within this paper are based on the detector, band and optical axis placement within the focal plane. This figure demonstrates the mirror’s bidirectional scanning along with the inherent along track scanning component derived from the orbital motion of the spacecraft. Furthermore, shown in the figure is the separation of the bands and primary (warm) and Cold focal planes.
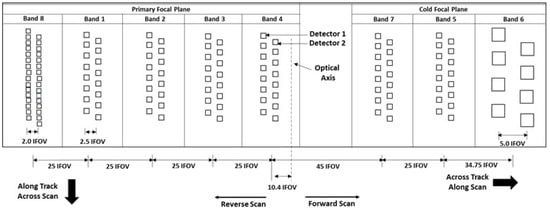
Figure 1.
Enhanced thematic mapper plus (ETM+) focal plane layout. The pan band and its 32 detectors, the multispectral bands and their 16 detectors, and the thermal band and its 8 detectors are shown, along with the placement of these bands within the focal plane. Instantaenous Field of View (IFOV) refers to the instantaneous field of view for a multispectral detector. The designation of even detectors, whose number is divisible by 2, and odd detectors whose number is not divisible by 2, is used throughout the document.
2. Materials and Methods
Geometric calibration of the ETM+ involves band-to-band registration accuracy, detector-to-detector alignment, and sensor to ACS alignment. These three calibration activities were performed for the ETM+ instrument, whose changes would be used in product generation towards the end of 2020 as part of the release of Collection 2 products in December of 2020. These calibration activities to determine the new calibration coefficients for this reprocessing of the Landsat archive are further explained within this paper and are considered updates to existing calibration parameters that have been used throughout the instrument’s lifetime. The thermal band detector-to-detector alignment discussed in Section 2.1 is a new calibration adjustment that had not been previously performed in the mission as the adjustment is small and went undetected for a number of years. The band-to-band alignment is a small adjustment that was made based on the longer trends achieved in the data processed and done in a manner so as to not directly impact users for the given Landsat archive at the time (within a collection). The sensor to ACS adjustment is done periodically based on the bias threshold that needs to be achieved in the alignment.
The thermal band detector alignment calibration is performed by simulating imagery with the expected focal plane detector placement of the detectors. Comparing these simulated results against the imagery acquired from the instrument indicates any difference between the focal plane locations used in the processing and the relative physical location of the detectors on the focal plane. Band coregistration calibration is performed by correlating band pairs over multiple data sets over the mission’s length. Residuals and trends are calculated to determine if adjustments to the focal plane are needed. These measurements are mapped back into the focal plane based on the currently known focal plane location of the bands, and the residuals measured are used as adjustments applied to the previously known locations within the focal plane. Sensor-to-ACS alignment is measured by long-term trends in the adjustments needed to generate precision and terrain products within the archive based on ground control. These measurements used for the precision correction of the systematic imagery, which includes a roll, pitch, and yaw adjustment of the spacecraft telemetry, are used in determining any biases that are present in the updates that in turn are determined as new orientation parameters needed between the sensor focal plane and the attitude control system. Further details are provided in Section 2.1, Section 2.2 and Section 2.3.
2.1. Thermal Band Odd to Even Detector Alignment
Before Collection 2 generated products, an odd-to-even detector misalignment has been present within the thermal band ETM+ products. This misalignment is small and only visible under ideal circumstances, for example, along a sharp edge with a strong contrast aligned perfectly with the along scan direction of the instrument or the acrosstrack direction of the spacecraft. This offset is likely due to a set of imperfect prelaunch calibration coefficients for the thermal band detector locations. An example of this offset for Collection 1 products can be seen in Figure 2, where a jagged edge is visible along the dark to light transition. The image shown in the upper left corner is zoomed by a factor of 4 to better demonstrate the detector-to-detector offset present.

Figure 2.
ETM+ thermal band image demonstrating the odd-to-even detector misalignment. The darker features and the jagged edge associated with this feature show the odd-to-even detector misalignment present in the data.
To test and verify the IAS algorithms of the ETM+ before launch, a method was developed to simulate the ETM+ sensor geometry using its known geometric characteristics. This process creates a simulated image data set that would be geometrically equivalent to it being directly downlinked from the spacecraft. This process is known as the ETM+ geometric simulator due to its’ ability to simulate the raw geometric state of the instrument. The process that was developed uses an orthorectified reference image, a coregistered digital elevation model (DEM), and an analytical geometric model of the ETM+ sensor to map pixels within the reference image into the ETM+ level 0R geometrically raw pixel coordinate system [8]. The analytical geometric model is a static file that contains all the spacecraft and instrument information, such as the focal plane layout, and dynamic information, such as spacecraft position and orientation, which is needed to map a given level 0R pixel to a location on a given Earth model. This geometric model is created by using calibration parameters stored within the instrument and spacecraft calibration parameter file (CPF) and an L7 level 0R file that contains the spacecraft and instrument telemetry for a given acquisition [9]. The CPF is a file, which contains spacecraft and instrument calibration parameters that are required for product generation. The CPF is nominally produced on a quarterly basis and valid for one-quarter. However, parameters within the file can either be one per quarter or for a limited number of parameters; a value is given per day for that quarter. The instrument and spacecraft telemetry are stored in the L7 level 0R mirror scan correction data (MSCD) and payload correction data (PCD) files, respectively. The MSCD contains scan timing information that makes it possible to relate the ETM+ imagery to the associated spacecraft position and orientation information stored in the PCD. The geometric model is then used in the simulation step of generating the level 0R to project detector lines-of-sight, defined by the detector location and scan mirror position, from the spacecraft position and orientation that corresponds to the image sampling time; to iteratively match a geographic location on the Earth with the correct elevation from the DEM. The reference image intensity at the resulting geographic location is then used to populate the geometrically raw sensor pixel value in the level 0R data. The level 0R data set thus created is termed a simulated level 0R data set as it simulates a level 0R file based on the dynamic and static states defined within the geometric model file and CPF. To ensure a good absolute reference with well-aligned detectors and good internal geometry is used, the coincident (same acquisition time) band 5 file is used as a reference image for simulating the band 6 (thermal band) L0R. The nominal 30 m band 5 pixels are resampled to a 60-m level 0R resolution using cubic convolution. Images are chosen that show a good correlation response between these two bands and that have a good crisp edge responses in the thermal data. The DEM used in simulation is chosen to match the DEM used to create the band 5, terrain, and precision corrected reference image. These steps provide an absolute reference for the thermal band concerning detector to detector within scan alignment, thus improving the internal within scene geometry of the imagery only. A simulated image with high absolute geometric accuracy is not needed as it is the detector to detector alignment of the thermal band that is to be measured.
To measure the thermal band detector alignment, a level 0R file is simulated based on the known calibration parameters for the ETM+ instrument and spacecraft. If these calibration parameters represent the correct geometric state of the instrument and spacecraft, then the level 0R simulated image should be geometrically the same as the actual level 0R file from which the geometric model was created. As long as there are no systematic errors built into the simulated level 0R data, measuring the differences between the original level 0R and the simulated level 0R will only show very small random differences that represent the error in the measurement steps used to compare the two data sets. As the actual level 0R file is associated with the raw imagery acquired, it contains the actual physical detector placement within the focal plane. The simulated level 0R thus represents only the expected offsets and placement within the focal plane. Since the object is to measure any residual errors within the CPF’s along scan focal plane detector locational values, image-to-image correlation is performed between the actual and simulated level 0R in only the sample direction for each detector for all scans. As the ETM+ instrument is a bidirectional scanning mechanism, with each image containing both forward and reverse scans, correlation differences are binned by the detector and the scan direction. These binned measurements are then averaged after the removal of outliers, and any nonzero value found shows the Collection 1 errors in the calibration parameters for the focal plane detector locations. The steps of this processing flow are shown in Figure 3.
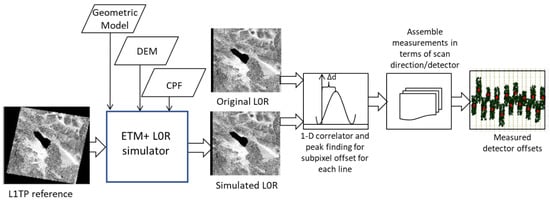
Figure 3.
The ETM+ level 0R simulation processing flow. A precision terrain corrected image (L1TP) is used as a reference, and its pixels are mapped back into a geometrically raw image space creating a file that represents a geometrically untouched, by any resampling, state of the data acquired during an orbit acquisition. A geometric model defining the mapping between geographic latitude and longitude and a raw geometric pixel, a digital elevation model (DEM), and a set of calibration parameters (CP) files are needed for determining the mapping between pixels. The misregistration between the simulated image and the actual image (level 0R) determines any detector-to-detector misalignment that would be present in the data product generation.
2.2. Focal Plane Alignment
The Landsat-7 design specification requires the relative alignment of the eight ETM+ spectral bands to be 0.28 pixels or better at the 90% linear error confidence level (LE 90). The results measured within the IAS are much smaller than this, within the 0.08-pixel range for a given direction (along or across track), not including the thermal band with the largest multispectral value falling in the range of 0.07 pixels and 0.11 pixels for the thermal band. The band-to-band alignment within each ETM+ focal plane is very stable, so the band registration accuracy results are limited by two factors: the alignment between the cold and warm focal planes and the ability to measure the thermal band against the other bands present within the image. Within the warm and cold focal planes, movement is limited by their design, fabricated to individual pieces of hardware. Changes between the cold and warm focal plane, however, have been observed over time. As discussed previously within this paper, these changes have most likely been driven by changes in instrument operations or due to the stress during launch. Changes in apparent band alignment are monitored and corrected using the focal plane alignment calibration process provided by the IAS.
The ETM+ focal plane alignment process involves four major steps. The first involves measuring the band-to-band registration for each band pair. This step provides any misregistration between bands in the existing products. This measurement of any misregistration is done using image correlation between each band pair and determining the subpixel offset for each band pair. The higher resolution bands are resampled to match the resolution of the lower resolution band in this process. The second step involves converting these measurements, in the map projection space into the along- and across scan instrument coordinate system. This process transforms the residual band offsets measured in a map projection space into the focal plane of the instrument, where any calibration adjustments would be performed. A least-squares fit is then used to update the existing focal plane locations based upon the measured band offsets. This least-square fitting of the residual measurements gives a set of calibration updates for each individual band in the along and across scan directions of the instrument based on all the measured residuals for all band pairs of a given scene. The final step involves taking these individual scene results and determining new alignment parameters over the given time frame of interest. This final step allows for a reduction of any error or short-term bias that may be present in any one individual measurement taken from a given scene.
Characterization of the Collection 1 ETM+ products showed small, cold to warm focal plane misalignments. These misalignments were found to lie between events within the ETM+ program that was either instrument-driven or programmatic-driven. These events included the scan line corrector failure, the switch to the bumper mode for operations of the scan mirror mechanism, and the launch of Landsat 8, at which time the duty cycle of the ETM+ instrument was increased. For Collection 2 ETM+ products, this small misalignment was accounted for based on the characterization results produced from the Collection 1 products.
2.3. Sensor Alignment
Sensor alignment calibration estimates the orientation of the ETM+ optical axis concerning the spacecraft attitude control reference coordinate system. Sensor alignment calibration is driven by the geodetic accuracy characterization results, representing the ability of the spacecraft and instrument telemetry, when used with the Landsat 7 calibration parameters, to geolocate a given geometrically raw level 0R pixel. These results are determined during the line-of-sight precision correction processing step, which involves adjusting the spacecraft telemetry based upon measuring the systematic image against a set of ground control points. The precision correction step calculates the offset between the systematic image and the ground control, factoring out the effects of elevation during these steps, and adjusts the spacecraft position, velocity, attitude and attitude rate such that an orthorectified image can be created. Due to the spacecraft position and attitude corrections being highly correlated, a nonlinear weighted least-squares algorithm is used for the correction step allowing the appropriate level of correction to be given to each parameter based on the expected error for each.
Using multiple scenes and their correction parameters over time, the short-term variability due to random orbit and attitude knowledge errors can be removed, and any long-term pointing bias can be found. As the satellite ephemeris provide a net offset of zero over time, any bias found over time can be attributed to an alignment bias between the ETM+ sensor and the attitude control system. Biases above 50–70 m in the geodetic accuracy pre-fit measurements, which equates to a 70–100 µrad attitude adjustment, are used as the threshold for updating the CPF sensor alignment calibration parameters. The IAS uses two sets of ground control, a set of 30 m GCPs extracted from the global land survey (GLS) 2000 [10,11], which provides global coverage for product generation, and a set of GCPs extracted from high-resolution reference images produced from either USGS digital orthorectified quadrangles (DOQ) or Satellite Pour l’Observation de la Terre (SPOT) data. For the DOQ and SPOT data, the higher resolution images are resampled to a 15 m resolution such that they can be measured against the ETM+ pan band. The locations where these 15 m images are available are referred to as geometric supersites. The geometric supersite ground control points are the reference used for the sensor alignment calibration. Both sets of ground control can be used to monitor the need for performing a sensor alignment calibration, but only the geometric supersites are used for determining the new orientation parameters. These geometric supersites are limited in coverage and are only within the conterminous United States (US) and Australia but are set up to allow for both northern and southern hemisphere calibration locations. The geometric supersites are chosen to perform the calibration, as the GLS control lacks the kind of accuracy required for calibration, which is estimated at 35 m 2σ for the Collection 1 products, while the horizontal root-mean-square (RMS) accuracy of the DOQs is approximately 6 m.
A small upward trend in the pre-fit geodetic accuracy along scan was found to have started near the end of 2013 in the Collection 1 ETM+ product. This trend grew to near 80 m in magnitude toward the end of 2019. Based on these Collection 1 trends, new ETM+ to spacecraft attitude control system roll, pitch and yaw alignment parameters were determined and applied to the ETM+ Collection 2 products.
3. Results
3.1. Thermal Band Odd to Even Detector Alignment
As stated previously, since the launch of Landsat 7, there has been an odd-to-even detector misalignment within the ETM+ thermal band. For Collection 2 products, this misalignment was removed by calibrating new detector-by-detector locations within the focal plane. To determine new thermal band detector locations, eleven scenes were processed covering a date range from the start of the mission (April 15, 1999) up to the switch to bumper mode operations in 2007. Scenes were chosen that were in both the northern and southern hemispheres to determine if there could be any correlation, within orbit changes, of the characteristics associated with the detector alignment. The scenes were chosen to have a good set of sharp edges within the image, which could provide features for a strong image-to-image correlation between the reference image band used (band 5) and the thermal band. This characteristic of good sharp edges was determined through visual inspection of scenes, along with these scenes being part of a known list of calibration sites for band-to-band characterization of the ETM+ instrument. Even though the detector misalignment was thought to be an issue with the prelaunch measurement of the detectors, a time range of data was processed and inspected to verify that this was true. Results were assembled for each scene, removing outliers by determining the mean offset for each detector for forward and reverse scans. Figure 4 and Table 1 are shown to demonstrate the offsets for each detector for a given scene. Values in the table are given in terms of the IFOV for the thermal band and are the mean values calculated. The plot gives the measurements determined in IFOVs, within the image-to-image correlation step. For Figure 4, individual line-by-line measurements are shown with green triangles. The means of these individual line measurements of each individual detector and scan direction are shown with red squares. Table 1 and Figure 4 show that the mean measured offsets are small subpixel errors. The staggered pattern within the plot gave rise to the term odd/even detector alignment as the differences were binned by whether they were an odd or even-numbered detector. The scattering of the individual measurements shown with the green triangles demonstrates the variability of the line-by-line measurements for each detector and both scan directions.

Figure 4.
Thermal band detector displacements for the ETM+ for Collection 1 products. The results for the Landsat scene ID LE70390372003116EDC00 are shown in the plot. Measured offsets are shown. Individual measurements are displayed using green triangles, while the mean of those measurements is shown with red squares. Forward and reverse scan values for each detector are shown. Values are given concerning a thermal band detector Instantaneous Field of View (IFOV) and are prior to calibration.

Table 1.
ETM+ thermal band detector misalignment displacements for Collection 1 products for the Landsat scene ID LE70390372003116EDC00. Measured mean offsets are shown within the table for each detector for forward and reverse scans. Values are given concerning a thermal band detector (60 m) IFOV.
After processing all eleven scenes and finding the mean offsets for the detectors for each scan direction of each scene, new detector focal plane locations were determined by choosing the scene, which produced offsets that were within the family of the other 10 scenes, but had the smallest standard deviation from the mean when compared to the other scenes. These mean offsets representing residuals based on the existing calibration parameters were used to determine new values, then replaced the existing calibration values stored within the CPF and were used with the original ETM+ level 0R telemetry to create newly generated products for all eleven data sets. This process was repeated three times, with each step producing a smaller set of parameter updates to the detector locations and was discontinued when no measurable change could be determined. This iterative set of steps was performed to eliminate any correlation bias that may have been present within the process. Visual inspection was also performed on these newly created products, and no discernable detector misalignment could be determined. Image examples demonstrating the detector alignment pre- and post-calibration are shown in Figure 5 and Figure 6.
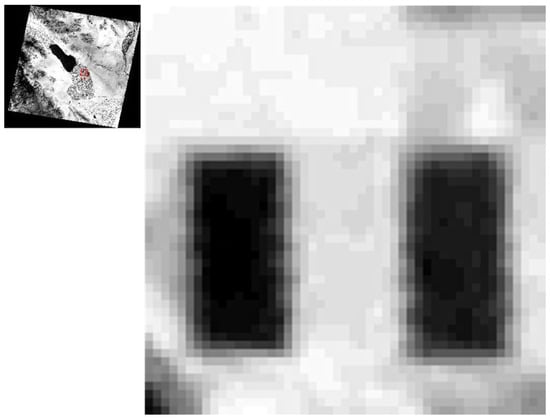
Figure 5.
ETM+ thermal band image prior to detector calibration. Image is zoomed by a factor × 8. The dark to bright transition brings out the detector alignment issues present.

Figure 6.
ETM+ thermal band post detector calibration. Image is zoomed by a factor × 8. When compared to Figure 5, the detector-to-detector issues have been resolved.
An updated plot of the detectors measured offsets using the new CPF detector alignment parameters is shown in Figure 7. The individual detector measurements per line for the odd, even, forward and reverse scans for the scene whose results are shown in Figure 4 are also shown in Figure 7. The odd/even detector binning of offsets that were present in Figure 4 has flattened out, showing no measurable displacement between the odd and even detectors.

Figure 7.
Thermal band detector displacements for the ETM+. Collection 2 post-calibration measured offsets for the Landsat scene ID LE70390372003116EDC00 are shown for individual line-by-line measurements using green triangles, while the mean of those measurements is shown with red squares. Forward and reverse scan values for each detector are shown. Values are given concerning a thermal band detector IFOV.
An updated set of CPF odd and even detector offsets based on the calibration steps performed are shown in Table 2. These values represent the new calibration odd-to-even detector locations stored within the CPF and used in product generation. Within the CPF band locations and detector, offsets are listed in units of multispectral detector IFOVs to keep the units consistent across all bands. The values shown are offsets from the center location of the thermal band within the ETM+ focal plane, a nominal offset from the center of the focal plane being 2.5 multispectral IFOVs (30 m).
Table 2.
Thermal band detector locations post-calibration. These values would be placed within the calibration parameter file to be used for product generation.
3.2. Focal Plane Alignment
Characterization of the Collection 1 ETM+ products indicated small, event-driven, cold to warm focal plane misalignments for the instrument. These updates to the focal plane were applied to the Collection 2 Landsat ETM+ products. Initial results for Collection 2 updates indicated no change needed to the focal plane alignment parameters prior to the ETM+ scan line corrector (SLC) failure [12]. Therefore, the calibration concentrated on the date range starting at the SLC failure and continuing to the current date. SLC-off data refers to all Landsat images collected after 31 May 2003. Figure 8 shows the along and across scan band alignment results prior to the Collection 2 calibration updates. These plots show the adjustments needed for each band location to align all bands within the focal plane.

Figure 8.
Band focal plane measured offsets for Collection 1 data is shown. Values are given in micro-radians and are prior to calibration. Band 5 and 7, which are both located on the cold focal plane, are offset concerning bands 1–4, 8, which are located on the warm focal plane.
As seen in Figure 8, only the cold focal plane bands 5 and 7 show an offset being measured within the data. This is due to the fact that the pan band is used as the reference location for all the other ETM+ bands, and the bands within the primary (warm) focal plane for which the pan band resides were stable. These two bands (5 and 7) also show consistent results between each other. The offset values that are in the 3–4 µrad range are small as 42.5 µrad represents one multispectral IFOV. Missing from the plot are the measurements associated with the thermal band. These results are omitted from the plot as the variability of these measurements due to the varying pixel size (30 m multispectral compared to 60 m thermal) and the different spectral signatures between the thermal band and the other bands was too large to determine any adjustment needed. Therefore, we decided to adjust the relationship between the cold and warm focal plane rather than individual bands. The calculations made for the adjustment to bands 5 and 7 were scaled appropriately to numbers that could then be applied to the thermal band adjustment. As stated previously, the decision was made to break the update to the cold focal plane alignment into discrete time periods based upon on-orbit events. Close visual inspection of the results suggested changes related to three events; time of the start of SLC failure, the switch to bumper mode, and following the launch of Landsat 8. In the first two of these events, the mechanical operation of the ETM+ was changed by a reconfiguration of the scanning process. Once Landsat 8 became operational, changes to Landsat 7 operations resulted in a change to the ETM+ duty cycle with corresponding changes to the instrument’s internal thermal environment.
Even though it is possible that a small linear trend could be present in the data within some of these time periods, the magnitude of the change and complexity that would come about from implementing a per quarter set of focal plane alignment adjustments drove the decision to produce three sets of new numbers for the ETM+ cold focal plane adjustment for Collection 2. Figure 9 shows the band 5 and 7 measured displacement results for the 551 scenes that were processed for focal plane calibration. Acquisition times of the scenes were chosen such that an adequate number of data points would be available for each time range of calibration updates. The results in Figure 9 are color-coded to help identify the time ranges where updates were grouped for determining new focal plane parameters.

Figure 9.
Band 5 and 7 focal plane measurements for Collection 1 data are shown. Values are color-coded to represent time frames, which will be broken out for calibration. These color-coded time periods will have the same corrections applied across the time range. A-scan refers to the along scan direction of the instrument, while X-scan refers to the across scan direction of the instrument.
A set of 293 independent scenes were chosen for validation of the new focal plane parameters. The acquisition dates of these scenes were chosen to split the total number between the three date ranges for which new calibration parameters were calculated. These results, color-coded as was done in Figure 9, are shown in Figure 10.

Figure 10.
Band focal plane measurements for Collection 2 data are shown. Values are color-coded to represent time frames, which were broken out for calibration. The values displayed are after focal plane calibration. The offsets that were present in Figure 9 have been reduced. A-scan refers to the along scan direction of the instrument, while X-scan refers to the across- scan direction of the instrument.
Although the focal plane calibration did not completely flatten out the alignment from the perspective of the date ranges that were used for calibration, the 0.5 micro radian discontinuities that are given by the averages plotted within figures are small, a little more 0.01 pixels. This 0.01 pixel variation is also what could be expected as well within the limit to which the offsets can be measured for the correlation and fitting methods used in the calibration mensuration step. The inability to measure changes to the resolution that would be necessary to calculate any slope or remaining trend present in the final band alignment results, along with the desire to limit the number of calibration parameters needed for a lifetime model to be used in product generation, lead to the determination that the results shown in Figure 10 were sufficient for product generation.
3.3. Sensor Alignment
As stated towards the beginning of this paper, a small upward trend in the geodetic accuracy pre-fit mean (prior to ground control be applied) results are present in the Collection 1 ETM+ products. Figure 11 shows this upward trend in mean geodetic accuracy error that partly drove the Collection 2 sensor alignment calibration updates. The figure shows the mean geodetic accuracy results for the along and across track for products using the GLS ground control. As noted previously, the GLS control is not as accurate as of the DOQ control. Furthermore, Figure 11 represents the pre-fit means of all ETM+ data sets that produced a precision-terrain corrected product. Seasonal dependencies, such as winter months that can decrease the accuracy of these measurements and operational considerations create the varying states of the pre-fit mean results in the figure. However, a consistent bias can be seen to have occurred starting around 2012 along with an upward trend occurring around 2015. Prior to the sensor alignment discussed within this paper, the most recent sensor alignment calibration update was performed in late 2011. This calibration update created more accurate geodetic accuracy results for the period prior to the update, but the improved performance going forward post-calibration did not persist as alignment errors continued to accumulate. Therefore, an upward trend, essentially starting after the last calibration update in 2011 and reaching a mean offset of just over 80 m by late 2018, can be seen within the plot.

Figure 11.
Geodetic accuracy pre-fit means based on Collection 1 products and global land survey (GLS) control. The upward trend in the across-track means shows the change in sensor alignment of the ETM+. Xt refers to the across-track direction, while At refers to the along track direction.
The sensor calibration process itself involves three major steps. The first is the previously mentioned calculation of the geodetic accuracy results. The second step involves taking these offsets, determined in terms of along and across track directions, and converting them into interior orientation roll, pitch and yaw sensor alignment parameters for each given scene. The final step takes these individual scene results and determines long-term trends associated with the roll, pitch and yaw values that can ultimately be used within the CPF for product generation. To perform the calibration update, scenes were chosen from the date range of the last quarter of 2011 up through the first quarter of 2018. The calibration scenes were selected such that no two scenes were farther apart than 10 days and were distributed between the US and Australia geometric supersites. In all, 271 scenes were used. As Figure 11 shows, the upward trend started soon after the last calibration update was performed, late 2011, and reached a value of just over 80 m by early 2018, therefore. These scenes were acquired between late 2011 and early 2019. The mean along and across track geodetic accuracy results for the geometric supersites using the DOQ and SPOT control are shown in Figure 12.

Figure 12.
Geodetic accuracy for along and across track means prior to sensor alignment calibration. An upward trend in the across track direction is shown by the solid black line.
The solid black line in Figure 12 shows the trend in the across track mean, while the solid red line shows the trend in the along track mean directions. This black line and its trend that the sensor alignment calibration attempts to remove, flattening out the trend present in the across track direction. The small individual bars on each scene’s results give the standard deviation of the measured means. The sensor alignment algorithm determines a set of roll, pitch, and yaw interior orientation parameters for each scene’s geodetic accuracy results. It uses a moving average window over these individual attitude alignment parameters to determine a new set of calibration parameters to be stored in the CPF for use in product generation. Although the scene-specific alignment parameters are fairly consistent, the smoothing is used to take out the aforementioned short-term scene-to-scene variability. The individual per scene roll, pitch, and yaw alignment values are shown in Figure 13. The quarterly CPF roll, pitch, and yaw alignment parameters used for product generation are also shown within the plot. These numbers are based on a moving average window passed over the calculated scene values, which are then further reduced through averaging to a single value per quarter to match the frequency of calibration parameter files.

Figure 13.
Plot of the attitude interior orientation parameters for the ETM+ sensor alignment. The yaw parameter has much more variability than that of the roll and pitch axis due to the difficulty measuring this parameter within the ETM+ instrument. The quarterly calibration parameter file (CPF) parameters calculated are displayed with a red x (roll), purple diamond (pitch), and crimson hexagon (yaw).
These new quarterly CPF parameters were used to recalculate the geodetic accuracy for the scenes used in the sensor alignment calibration. These new geodetic accuracy results are shown in Figure 14. As in Figure 13, a solid black line is shown in Figure 14 for the trend of the across track means from the geodetic accuracy. The upward trend that was visible in Figure 13 is no longer present in Figure 14.

Figure 14.
Geodetic accuracy for along and across track means after sensor alignment calibration. The trend for the across track direction is shown by the solid black line. The upward trend in the across track direction that was present in Figure 13 is now gone.
One verification scene was run per quarter with the new CPF parameters. The total number of verification scenes processed was 49. These scenes were not part of the calibration process and are considered as an independent verification of the alignment results. The pre calibration results for these verification scenes are shown in Figure 15, while the post calibration results are shown in Figure 16. Due to the limited number of geometric supersites, cloud cover preventing sites from being able to be used as a calibration source on occasion, and the desire to use as many good geometric Sites as possible for calibration; the verification scenes contained several results that had a limited number of GCPs used in the geodetic accuracy characterization, resulting in some scenes with larger than the desired standard deviation. Nevertheless, the post-calibration results show that the across track trend is reduced, and the mean offsets in both directions are less than 50 m.
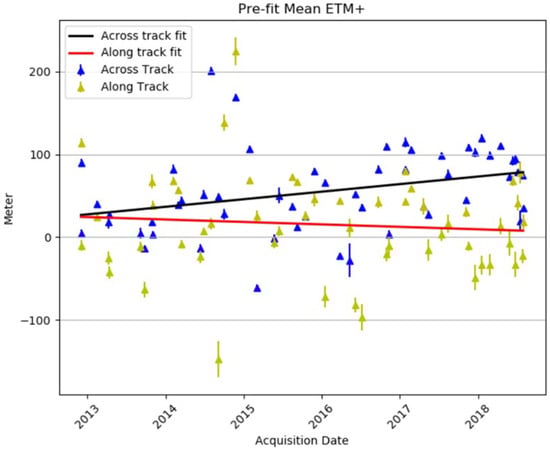
Figure 15.
Geodetic accuracy pre-fit mean results for the verification scenes prior to calibration. An upward trend for the across track direction is shown as a black line within the plot and follows the trend shown in Figure 12.

Figure 16.
Geodetic accuracy pre-fit mean results for the verification scenes after calibration. The trend associated with the across track means is shown as a black line. The upward trend for the across track direction that was present in Figure 15 is no longer present.
4. Conclusions
The geometric calibration and characterization of the Landsat 7 spacecraft and ETM+ instrument have been an ongoing activity within the USGS at the Earth Resource Observation Science (EROS) Center since its launch. Presented within this article are three of the geometric calibration activities performed based on the Collection 1 products that will be used to yield improved accuracy in the Collection 2 products. The thermal band detector locations were adjusted, the cold to warm focal planes were better aligned for specific time frames, and an update was made to the ETM+ focal plane-to-attitude-control-system alignment matrix. An adjustment of less than 0.17 of a thermal detector IFOVs (60 m) was performed on the thermal band odd-to-even detector locations. This small detector-to-detector misalignment had been present since the start of the Landsat 7 mission (15 April 1999). An ETM+ to ACS sensor alignment was performed to account for a gradual increase in measured offset within the geodetic accuracy from late 2013 to late 2019 that had reached an offset of approximately 80 m. These new alignment parameters brought the expected geodetic accuracy results down to the 25 m range. These new alignment changes impact the accuracy of the L1GT products. This change has no impact on the precision terrain (L1TP) corrected products, which have the Landsat ground control library applied for registration. A band focal plane update was performed with cold to warm focal plane adjustments of less than 0.1 IFOVs of a 30 m multispectral pixel, driven by events within the Landsat program. These events included the scan line collector failure, the switch to bumper mode operations, and the launch of Landsat 8, which had an impact on the duty cycle of Landsat 7′s ETM+ instrument. This update impacted only bands 5, 6, and 7, applying the adjustment to better locate these bands-to-bands 1, 2, 3, 4 and 8. These Collection 2 updates will improve thermal band image quality (detector-to-detector alignment), VNIR band to SWIR/ (thermal infrared) TIR band registration, and level 1 systematic terrain corrected product’s absolute accuracy. For Collection 2 and the ETM+ instrument, the products generated from the GLS ground control have an absolute and relative accuracy of 65.3 and 4.8 m, respectively. Overall, the Landsat 7 spacecraft and instrument meet or exceed performance requirements and the adjustment presented here was not driven by a failure to meet requirements but a desire to produce the most accurate, highly calibrated Landsat ETM+ products possible. These Collection 2 calibration adjustments are part of the mission goal of performing the best possible calibration for the spacecraft and instrument, providing the user community with the best-calibrated set of products possible.
Author Contributions
Writing—oringinal darft: M.J.C. and R.R.; Supervision: J.C.S.; Data curation: M.L. All authors have read and agreed to the published version of the manuscript.
Funding
Work performed under USGS contract G15PC00012.
Institutional Review Board Statement
Not applicable.
Informed Consent Statement
Not applicable.
Data Availability Statement
Not applicable.
Conflicts of Interest
The authors declare no conflict of interest.
References
- Goward, S.N.; Masek, J.G. Landsat 30 years and counting. Remote. Sens. 2001, 78, 1–2. [Google Scholar] [CrossRef]
- USGS. Landsat 7 Image Assessment System Geometric Algorithm Theoretical Basis Document. U.S. Geological Survey: Sioux Falls, SD, USA. 2006. Available online: https://www.usgs.gov/media/files/landsat-7-image-assessment-system-geometric-atbd (accessed on 21 February 2021).
- Lee, S.L.; Storey, J.C.; Choate, M.J. Four years of landsat-7 on-orbit geometric calibration and performance. IEEE Trans. Geosci. Remote Sens. 2004, 42, 12. [Google Scholar] [CrossRef]
- Markham, B.L.; Haque, O.; Barsi, J.A. Landsat-7 ETM+: 12 years on-orbit reflective-band radiometric performance. IEEE Trans. Geosci. Remote Sens. 2011, 50, 2056–2062. [Google Scholar] [CrossRef]
- USGS. Landsat 7 Data Users Handbook. U.S. Geological Survey; Sioux Falls, SD, USA. 2019. Available online: https://www.usgs.gov/media/files/landsat-7-data-users-handbook (accessed on 20 April 2021).
- Storey, J.C.; Choate, M.J. Landsat-5 bumper-mode geometric correction. IEEE Trans. Geosci. Remote Sens. 2004, 42, 12. [Google Scholar] [CrossRef]
- USGS. Landsat Collections. Available online: https://www.usgs.gov/core-science-systems/nli/landsat/landsat-collection-2?qt-science_support_page_related_con=1#qt-science_support_page_related_con (accessed on 20 April 2021).
- USGS. Landsat 7 ETM Level 0 Reformatted Product Data Format Control Book; Technical Report; Department of the Interior, U.S. Geological Survey, EROS: Sioux Falls, SD, USA. 2018. Available online: https://www.usgs.gov/media/files/landsat-7-etm-level-0-reformatted-product-data-format-control-book (accessed on 21 February 2021).
- USGS. Landsat 7 Calibration Parameter File Definition. Technical Report; Department of the Interior, U.S. Geological Survey, EROS: Sioux Falls, SD, USA. 2018. Available online: https://www.usgs.gov/media/files/landsat-7-calibration-parameter-file-definition (accessed on 21 February 2021).
- Rengarajan, R.; Sampath, A.; Storey, J.C.; Choate, M.C. Validation of geometric accuracy of global land survey (GLS) 2000 data. Photogramm. Eng. Remote Sens. 2015, 81, 2. [Google Scholar] [CrossRef]
- Storey, J.; Roy, D.P.; Masek, J.; Gascon, F.; Dwyer, J.; Choate, M. A note on the temporary misregistration of landsat-8 operational land imager (OLI) and sentinel-2 multi spectral instrument (MSI) imagery. Remote Sens. Environ. 2016, 186, 121–122. [Google Scholar] [CrossRef]
- USGS. Preliminary Assessment of the Value of Landsat 7 ETM+ Data following Scan Line Corrector Malfunction. Technical Report; Department of the Interior, U.S. Geological Survey, EROS: Sioux Falls, SD, USA. 2003. Available online: https://www.usgs.gov/media/files/preliminary-assessment-value-landsat-7-etm-slc-data (accessed on 29 March 2021).


Publisher’s Note: MDPI stays neutral with regard to jurisdictional claims in published maps and institutional affiliations. |
© 2021 by the authors. This work was authored as part of the Contributor’s official duties as an Employee of the United States Government and is therefore a work of the United States Government. In accordance with 17 U.S.C. 105, no copyright protection is available for such works under U.S. Law. This is an Open Access article that has been identified as being free of known restrictions under copyright law, including all related and neighboring rights (https://creativecommons.org/publicdomain/mark/1.0/). You can copy, modify, distribute and perform the work, even for commercial purposes, all without asking permission.