Abstract
The relationship between the physic features of the Earth’s surface and its temperature has been significantly investigated for further soil moisture assessment. In this study, the spatiotemporal impacts of surface properties on land surface temperature (LST) were examined by using Landsat-8 Operational Land Imager (OLI) and Thermal Infrared Sensor (TIRS) and meteorological data. The significant distinctions were observed during a crop growing season through the contrast in the correlation between different multi-spectral satellite indices and LST, in which the highest correlation of −0.65 was found when the Normalized Difference Latent heat Index (NDLI) was used. A new index, named as Temperature-soil Moisture Dryness Index (TMDI), is accordingly proposed to assess surface moisture and evapotranspiration (ET) variability. It is based on a triangle space where NDLI is set as a reference basis for examining surface water availability and the variation of LST is an indicator as a consequence of the cooling effect by ET. TMDI was evaluated against ET derived from the commonly-used model, namely Surface Energy Balance Algorithm for Land (SEBAL), as well as compared to the performance of Temperature Vegetation Dryness Index (TVDI). This study was conducted over five-time points for the 2014 winter crop growing season in southern Taiwan. Results indicated that TMDI exhibits significant sensitivity to surface moisture fluctuation by showing a strong correlation with SEBAL-derived ET with the highest correlation of −0.89 was found on 19 October. Moreover, TMDI revealed its superiority over TVDI in the response to a rapidly changing surface moisture due to water supply before the investigated time. It is suggested that TMDI is a proper and sensitive indicator to characterize the surface moisture and ET rate. Further exploitation of the usefulness of the TMDI in a variety of applications would be interesting.
1. Introduction
Surface moisture plays a significant role in land-surface processes by modulating the exchanges of water and energy between land and atmosphere [1,2,3,4]. Understanding surface moisture and evapotranspiration (ET) can provide valuable information for a variety of subsequent applications, such as hydro-meteorological predictions, drought monitoring, and agriculture management [5,6]. Various techniques have been proposed to assess surface moisture and quantify ET. Ground instruments have long been used. However, the limitation in spatial coverage of point-wise measurements, ground instruments cannot sufficiently provide complete coverage of surface signature over a large region or on a global scale [7]. ET estimation based on the surface energy balance theory using ground observations and remotely sensed data has been broadly demonstrated [8,9]. However, they still cannot be conveniently implemented globally due to the sparsely distributed ground observations and the complexity of integration models. In the recent decades, the approaches based on empirical parameterization of the LST and surface properties have been proposed for soil moisture monitoring. Temperature vegetation dryness index (TVDI) has been widely used for soil moisture assessment and drought monitoring [10,11]. This method is based on an interpretation of the simplified NDVI-LST space. That is, NDVI is sensitive to the appearance of vegetation and its influence on LST through transpiration and evaporation from plants and soil, respectively [12]. Many studies indicated that TVDI can reveal the soil moisture status and closely associated with ET [13,14]. However, TVDI is severely affected by the rapid water supply due to an immediate change in surface water availability and a delay in the response of vegetation. Moreover, no correlation between LST and NDVI was revealed when NDVI is less than 0.1 as presented by Du et al. [12], with open water and crop in the inundated regions excluded from the analysis.
Surface water has a great potential to moderate LST through absorbing solar radiation and converting it into latent heat in the form of ET [15]. The reduction of water coverage and decrease in surface water availability lead to increased sensible heat transfer as latent heat transfer is constrained, resulting in rising LST. Thus, the surface water availability indicators and their correlation with LST variability have the potential to reveal more complete information on surface moisture and ET rate from bare soil to highly vegetated cover. Thermal infrared satellites provide a straightforward and consistent method to derive the LST at regional scales with the different spatial and temporal resolutions [16,17,18]. Many studies have been proposed to estimate LST by using remotely sensed thermal infrared data with different methods to tackle the atmospheric effects, such as radiative equation-based method [19], split window algorithm [20], and single channel method [21]. On the other hand, multi-spectral remote sensing has been widely utilized to extract and analyze surface properties of top layer by taking the advantage in optimizing the spectral sensitivity on certain characteristic of surface materials [22]. Accordingly, various indices have been widely used for the purpose of drought and water status assessment in certain situations. Since the appropriate index selection is of particular importance, five frequently used drought indices are examined in this study as addressed hereafter. Normalized Difference Vegetation Index (NDVI) is widely used because of its sensitivity to the interaction between solar radiation and vegetation cover [23]; Normalized Difference Moisture Index (NDMI) is considered as a complementary index for remote sensing of vegetation water content because of its sensitivity to the parameter of interest with less influence by the atmospheric effect [23,24]; Normalize Difference Water Index (NDWI) is used to delineate open water features because it can enhance water signature due to nearly complete absorption of infrared light by water [24]; Bare Soil Index (BI) is used to collect the information of bare soil areas, fallow lands, and vegetation by using four different bands of satellite images [25]; and Normalized Difference Latent heat Index (NDLI) is proven to be an effective indicator in extracting surface latent heat information by examining water availability of the Earth’s surface. The advantage of the NDLI is its uniqueness in optimizing the spectral sensitivity on biophysical land surface parameters by incorporating three commonly-used channels chosen for the satellite missions, including green, red, and shortwave-infrared [26].
This study aims to: (1) provide a reference for selecting the appropriate indicators for characterizing surface properties and their correlation with LST variability; and (2) propose a new and advantageous index for rapid surface moisture status and ET assessment by using remote sensing data, in which a potential multi-spectral index was set as a reference basis for examining surface water availability and the variation of LST was set as the parameter of ET cooling effect. It is expected to provide a potential indicator for further studies related to the large-scale assessment of Earth’s surface properties, especially plant water stress and physical surface water scarcity, by using different spatial-temporal resolution images from the great number of available Earth observation satellites.
2. Materials and Methods
2.1. Study Area
The study area is an alluvial plain located along the south-west coast of Taiwan, including the Yunlin and Chiayi counties, and Chiayi and Tainan cities as shown in Figure 1: Geographic locations of the study area. This area faces the Taiwan Strait on the west and lies to the west of foothills that extend from the Alishan Mountain. It is known as a largely flat landform created by alluvial deposits derived from the eastern foothill area through fluvial transportation [27]. It is of monsoon-influenced humid subtropical climate region with high humidity all year round, even during winter. It is once a place plenty of salt production, but most of it has been abandoned in the recent years. Additionally, many fish farms are located along the seacoast. Paddy rice is a major crop of the study region. The other primary crops include sugarcane, peanuts, corn, sweet potato, and some floricultural plants and vegetables. This study was conducted in the second growing season of 2014 since a significantly low amount of precipitation was recorded, especially in the southwest Taiwan. According to Taiwan’s Central Weather Bureau (CWB), a lack of rainfall caused severe droughts and water scarcity for the needs of agricultural practice in the second half of 2014.
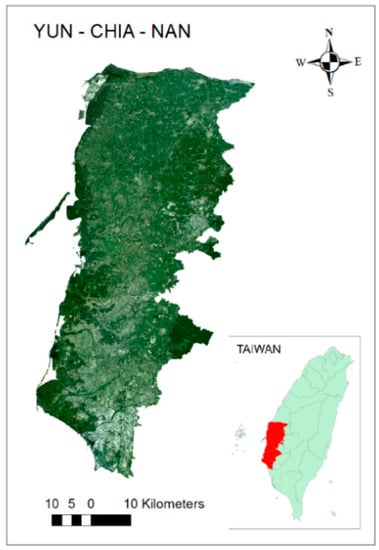
Figure 1.
Geographical location of study area with Standard True Color Composite generated from Landsat 8 OLI data (19 October 2014).
2.2. Data and Image Pre-Processing
Remote sensing imageries data used in this study were acquired by the operational land imager (OLI) and thermal infrared sensor (TIRS) onboard the Landsat 8 satellite (Table 1). Satellite images were acquired from the United States Geographical Survey website (http://earthexplorer.usgs.gov/, accessed on 19 October 2014, 4 November 2014, 20 November 2014, 6 December 2014, and 22 December 2014). Landsat 8 OLI/TIRS images were captured on the primary winter growing season in 2014 over different stages of crop growth, namely day of year = 292, 308, 324, 340, and 356. The surface reflectance data (Landsat Surface Reflectance Level-2 Science Products) were directly used in this study since atmospheric correction was done by Landsat Ecosystem Disturbance Adaptive Processing System (LEDAPS). Thermal bands that are useful in providing LST information were first captured with 100-m resolution, but are registered and delivered as the 30-m spatial resolution data product. Hourly average weather data were collected from the meteorological station over the entire Yun-Chia-Nan area. The station was set up by CWB with measurements taken at 1.25–2.00 m above the ground level with sensors sheltered from direct solar radiation (e-service.cwb.gov.tw, accessed on 19 October 2014, 4 November 2014, 20 November 2014, 6 December 2014, and 22 December 2014).

Table 1.
Description of Landsat data used in this study.
2.3. Land Use/Land Cover Mapping
As an agricultural region, the phenological stages of cultivation are associated with the changes of land cover characteristics. Several types of land covers, such as built-up, open water, and long-term vegetation, do not experience significant changes during a crop growing season. Croplands corresponding to high dynamic agriculture activities are related to crop rotation, including annual crops and semi perennial crops. A time series of spectral signatures from five Landsat images were analyzed to overcome single data weakness for land use/land cover (LULC) mapping in order to better capture the different phenology of land cover types over Yun-Chia-Nan Plain. The fieldworks, high-resolution images from Google Earth, and expert knowledge were integrated to collect training samples by digitization in Landsat 8 OLI images. ENVI 5.3 software was used for image classification. Theory of supervised classification maximum likelihood method was applied to classify study area into five general classes, including water, built-up, forest, bare soil, and cropland, in which, the cropland class includes all main crops that were planted in one crop season.
2.4. Calculation of Spectral Indices
Multispectral remote sensing indices, including NDVI, NDWI, NDMI, BI, and NDLI were used to characterize the biophysical land surface parameters and quantify the relationships between land cover and thermal environment. These indices are expressed in the following equations:
where ρ2, ρ3, ρ4, ρ5, and ρ6 correspond to the reflectance of blue (0.45–0.51 μm), green (0.53–0.59 μm), red (0.64–0.67 μm), near-infrared (0.85–0.88 μm) and shortwave-infrared (1.57–1.65 μm) bands of Landsat 8 OLI image, respectively.
2.5. Land Surface Temperature Retrieval
The radiative transfer model was used to estimated LST from Landsat 8 TIRS [28,29]. Digital numbers of thermal band (10.62–12.51 μm) were firstly converted to Top of Atmosphere (TOA) radiance using radiometric rescaling coefficients provided in the product metadata file [30]. TOA radiance of thermal infrared band was then converted to LST by integrated with atmospheric simulation using radiative transfer equation. In this study, the atmospheric profile parameters, such as atmospheric transmittance, upwelling, and downwelling radiances, were required from the Moderate Resolution Atmospheric Transmission model for TIRS using the online calculator is available at https://atmcorr.gsfc.nasa.gov, accessed on 19 October 2014, 4 November 2014, 20 November 2014, 6 December 2014, and 22 December 2014 [31,32]. The equation can be expressed as:
where is 14,387.7 μm·K; is 1.19104 × 10⁸ W·μm4·m−2·sr−1; is top of atmosphere (TOA) radiance W/(m2 ster μm); is effective band wavelength for band i; is upwelling path radiance; is downwelling path radiance; is atmospheric transmittance for channel i when view zenith angle is θ; and is land surface emissivity for channel i.
2.6. Calculations of the Temperature-Surface Moisture Dryness Index
The spatial patterns of NDLI and LST and their interrelationships were used to characterize the surface properties and understand the response of surface water availability to the thermal environment. The scatter plot is established in the LST-NDLI triangle space to propose an advantageous method for assessing the surface moisture and ET through the deviation in LST with its minimum and maximum at the given NDLI intervals. The dry and wet edges were defined as the minimum and maximum LSTs, respectively, in the small NDLI interval of 0.02. TMDI is calculated using the approach of VIs-LST triangle as expressed below:
where LSTmin is the minimum LST given NDLI along the wet edge; LSTmax is the maximum LST given NDLI along the dry edge; and LSTi is the LST in any given pixel (K).
The triangle space formed because LST decreases as ET increases at the given amount of water availability due to surface cooling by ET. This approach would enable us to understand the linkages between the surface water status and LST as the consequence of the cooling effect by ET at the earth’s surface, and, thus, helping in the identification of the application potentials of TMDI in estimating ET rate and further monitoring the regional drought. The climate information and irrigation schedule were checked to make sure the fairness analysis throughout the entire process. In this study, ET derived from a simple surface energy balance model was used as reference data for comparison in order to demonstrate the ability of TMDI in terms of investigating surface moisture and ET [33,34]. The Surface Energy Balance Algorithm for Land (SEBAL) has been widely used and validated to estimate ET accurately using different satellite data. The advantages of SEBAL in terms of deriving ET was confirmed under the various conditions of different countries by ground-based measurements [35,36,37]. Following the SEBAL model, ET can be theoretically computed in terms of latent heat flux through a residual of land surface energy balance equation at the time of the satellite overpass as following equation:
where Rn is the net radiation (W m−2), G is the soil heat flux (W m−2), H is the sensible heat flux (W m−2), ET is the evapotranspiration (mm h−1), and λ is the latent heat of vaporization (MJ kg−1).
λET = Rn − G − H
3. Results and Discussion
3.1. Land Cover Map and Validation
LULC of Yun-Chia-Nan Plain was aggregated into five major types, including built-up, vegetation, bare soil, water, and agriculture. Characteristics of LULC have been clearly shown in Figure 2. The visual interpretation shows that classification result is basically consistent with land surface features extracted from high spatial resolution image interpretation and information from field observations. Time-series data showed an additional source of information to identify land use types. This advantage is used to recognize the spectral signatures in accordance with the change in the surface canopy, which is not detectable in a single-date data. For instance, by using single-date data, the cultivated areas could be misidentified as built-up/dryland or water body in the land preparation stage and planting or after harvesting stage, respectively. Results indicated that the cropland dominates land cover, covering 59.86% of total area. Cropland consists of paddy field, dry land farming, and other agriculture purposes. Water bodies (lake, river, and aquaculture systems), mostly located along coast, are the second dominant land cover of this region, comprising approximately 16.62% of the land. Built-up, bare soil, and forest occupy 14.7%, 5.89%, and 2.92% of the land area, respectively. In order to make a quantitative analysis of land cover classification results, Google Earth Pro and expert knowledge of authors were used to understand the land surface characteristics as reference data for validation based on an independent set of training points randomly chosen from different sub-areas of the entire study area. Results show that time-series of Landsat 8 OLI can capture surface characteristics over different periods for LULC classification with overall accuracy of 88.6% and Kappa statistics of 0.83.
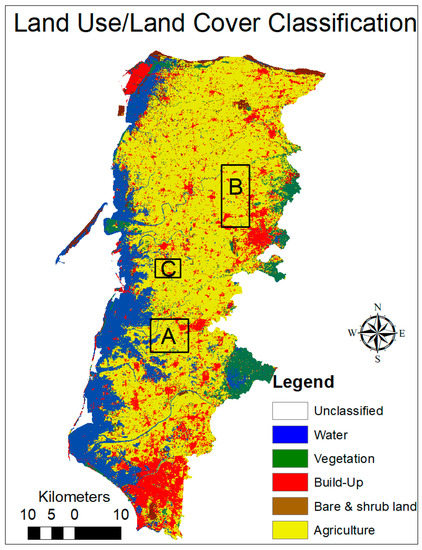
Figure 2.
Land use/land cover map over Yun-Chia-Nan, Taiwan, Landsat-8/OLI images.
3.2. Spatio-Temporal Variation of LST
Time series variation of LST over Yun-Chia-Nan Plain was retrieved from Landsat 8 OLI/TIRS data. Figure 3 shows the spatial distribution of LST over five time-points, which were conducted during 2014 winter growing season. Results indicated that average LSTs are decreased over time across the study area as evidenced from its trend at 307.75 °K, 303.28 °K, 301.4 °K, 294.35 °K, and 292.06 °K corresponding to 19 October, 4 November, 20 November, 6 December, and 22 December, respectively. LST values were then evaluated by the near-surface air temperature measured by CWB meteorological stations at 2-m height (Tair). Although there exist different physical meanings, the significant relationship between LST and Tair has been reported in the literature [38,39]. Results indicated that the LST values are sufficiently accurate for further applications. LST and Tair presented the strong correlation r2 of 0.94 with RMSD of 5.13 Kelvins in the difference between LST and Tair. The previous studies indicated that the difference between LST and Tair can reach 20 (Kelvins) at noon under an extremely hot day [40].
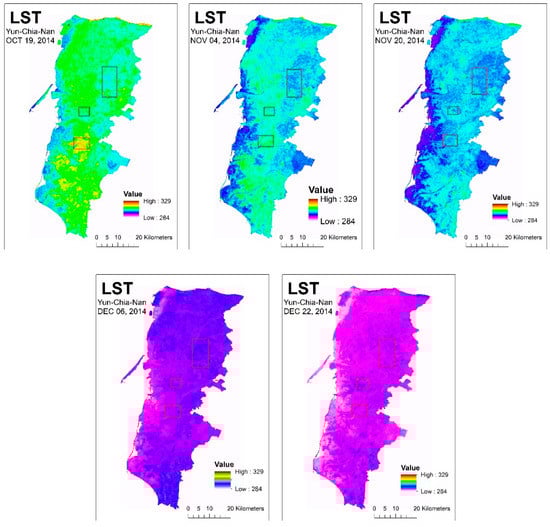
Figure 3.
Land Surface Temperature images over Yun-Chia-Nan on 19 October, 4 November, 20 November, 6 December, and 22 December 2014.
Results indicated that even the intensity of solar radiation varied with time, both day and season, the highest LSTs in all five time-points were mostly located in the northern region that covers some parts of Zhuoshui River basin with appearance of rock and sand. The relatively higher LST signatures mostly appeared in the built-up areas, such as the city centers of the two counties (Yunlin and Chiayi) and two cities (Chiayi and Tainan). Lower LST portions concentrated in the high vegetation coverage areas in the eastern study area. Water features, such as the lakes, rivers, and aquaculture systems in the western part of the study area, always correspond to the lowest LST in all five-time points. The significant variation of LST is recorded in cropland. Three areas of homogeneous agricultural zones are chosen and labeled as A, B, and C (as shown in Figure 2) for further examination. These three areas largely correspond to, respectively, maize, paddy, and sugarcane fields, which experience significant changes in the phonological stage during a growing season. The winter rice-growing season typically starts in early August and the harvest period is from late November to early December. While the major corn season is from September to February of the next year and the season of sugarcane starts in February and lasts for a year. Results indicated that (1) paddy rice field can be clearly seen as it has lower LST compared to the other croplands, such as corn and sugarcane, on 19 October and 4 November. This is in good accordance with the fact that, at these two time points, rice plants were at its vegetative growth stage, while corn maize field in the early stage. The paddy rice field often has a lower surface temperature than that of dry-soil planting areas due to evaporative cooling. (2) The similarity in the value of LST over three selected areas was observed on 20 November. That is, the growth and development of the corn plant enhance latent heat flux and decrease LST because vegetation often has a higher ET rate than dry land and absorbs more energy. While the paddy rice field is converted to the reproductive stage, which is associated with the decrease of surface ET rate and increase of LST. (3) On 6 and 22 December, LST values of paddy rice field were relatively higher than both corn and sugarcane fields. On these days, the paddy rice field is usually drained out of water before harvest, the surface water availability was significantly decreased, resulting in lower LST over paddy rice field compared to corn and sugarcane areas at their vegetative stage.
3.3. Comparison of LST Retrievals with Spectral Indices
Five different multi-spectral indices, including NDVI, BI, NDMI, NDWI, and NDLI, were derived from Landsat 8 OLI images. These indices were then used to establish and quantify their correlations with LST in order to understand the relationship between surface properties and thermal environment variability. These correlations were assessed against an independent set of reference pixels randomly chosen from the entire study area. To characterize the changes of cropland status and its driver on LST variability, we firstly explore the relationship between LST and multi-spectral indices within stable areas where land covers do not suffer significant change during a growing season, including built-up, water, bare soil, and long-term vegetation. Afterwards, cropland was included in the relationship analysis over a crop growing season. We found that the correlations between indices and LSTs over stable land covers are relatively higher than that over the entire study area. LST is influenced by soil moisture, crop types, and crop plant condition. The changes in cropland canopies lead to variation in solar energy absorption and significantly influence LST through ET, which can be suddenly changed between different periods of crop growth and agricultural transformation.
The different correlations between multi-spectral indices and LST are presented in Table 2. Results indicated that the properties of vegetation cover, open water, and bare soil represented, respectively, by NDVI, NDWI, and BI, exhibited insignificant impacts on near-surface thermal environment variability, as evidenced by their low correlations with LST. While the characteristics of vegetation water content and surface water availability represented, respectively, by NDMI and NDLI exhibited a significant impact on the temperature at the land-air interface, resulting in higher correlations with LST. This is in good accordance with the fact that the cooling effect as the consequence of ET is significantly controlled by the amount of water content in the surface canopies. The highest correlations between indices and LST at all five-time points are represented by NDLI with reliable negative correlation coefficients of −0.654, −0.608, −0.529, and −0.393 corresponding to 19 October, 4 November, 20 November, 6 December, and 22 December, respectively. It can be concluded that the characteristic of surface property related to both soil moisture and vegetation water content can be noticeably presented by NDLI as a sensitive and reliable indicator to determine the variation of near-surface temperature.
Table 2.
Correlation between near-surface thermal and biophysical land surface parameters.
3.4. Integrating NDLI and LST for ET Examination
Integration between NDLI and LST provided an advantageous method for monitoring surface moisture and ET rate, in which NDLI was set as a reference basis for examining surface water availability, while the variation of LST is an indicator of the cooling effect by ET at the earth’s surface. Figure 4 presents the scatter plot of the dry and wet edges in LST/NDLI triangle in order to determine the surface moisture and ET. The dry and wet borders represent the minimum and maximum of LSTs at the given NDLI intervals, respectively. The edges were obtained by linear functions of NDLI. We found that, although the LST and slopes of the edges at all 5-time points are different, they all tend to be closed as NDLI increases and can be overlapped as NDLI may saturate at later stages. Results show that, in the dry edge, LSTmax has a significant negative correlation with NDLI with correlation coefficients ranging from −0.88 to −0.96. All dry edges that have negative slopes with the driest points mostly appear close to the straight lines. That is, the linear model provided a decent fit to the data. In the wet edge, relatively small variation of minimum LST was exhibited at different NDLI values. The fluctuations are based on the differences in ET rate from land cover types. There exist some outlier points under special conditions of saturated air.
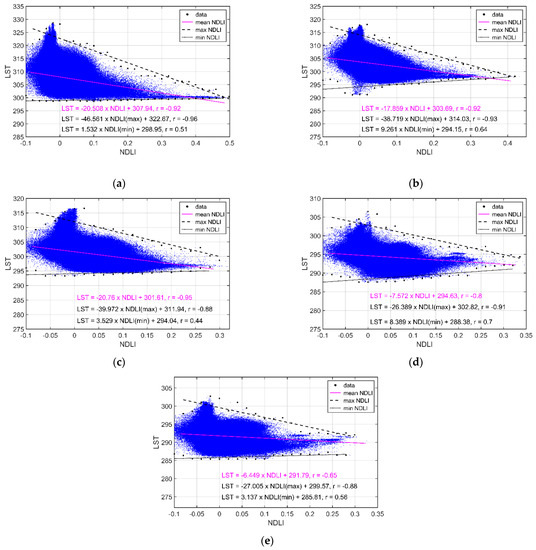
Figure 4.
Dry/wet edges and their fitting equations derived from scatterplots of NDVI and LST on 19 October (a), 4 November (b), 20 November (c), 6 December (d), and 22 December 2014 (e).
Based on the dry/wet edge fitting equations and the feature space of LST/NDLI, the TMDI was simulated for all of five days (as presented in Figure 5). Results indicated that temporal variation of TMDI do not change much in the areas of built-up and water surface due to the fact that water availability of these areas does not suffer a significant change during a growing season. At all five time points, relatively high TMDI appeared in the dry surface, such as built-up, bare land areas, and, especially, rock/sand of Zhuoshui River basin as dry season, while low and very low TMDIs were highly concentrated in vegetation and water areas, respectively. It fluctuated as the consequence of the cooling effect by ET due to the fact that ET of water and vegetative areas is considerably higher than the dry surface. Spatial and temporal variations of the TMDI in the cropland exhibited a distinctive change in the apparent property of crop during the growing process. The transformation of land-cover in the farmland during crop season leads to variation of surface water condition, resulting in difference of surface ET. Very low TMDIs were observed in the paddy rice fields, especially during the periods of growth, corresponding to very high value of ET compared to the other land cover types. Relative low TMDIs appear in the farmland during the vegetative period, such as maize, sugarcane, and pineapple, when canopy reaches its full coverage. The lower TMDI in these areas is a consequence of transpiration from crop plants. Meanwhile, high and very high TMDIs of croplands are mainly corresponding to dry farming or the areas at land preparation phase. We found that, over large open water surfaces, dry and wet edges tend to overlap since LST may be equal or lower than the upper-air temperature. Consequently, in some water areas of aquaculture systems, TMDI appears lower than the theoretical values.
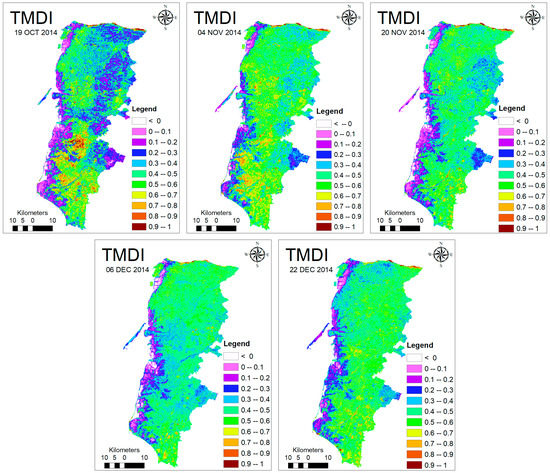
Figure 5.
Temperature-soil Moisture Dryness Index (TMDI) over Yun-Chia-Nan on 19 October, 4 November, 20 November, 6 December, and 22 December 2014.
To assess the sensitiveness of TMDI in terms of determining the surface moisture and rate of surface ET, SEBAL-derived ET (Figure 6) was used as reference data for comparison to evaluate the performance of TMDI as compared to TVDI. The comparisons were performed against an independent set of reference points chosen randomly. Results showed that both TVDI and TMDI have strong negative correlations with the SEBAL-derived ET (Table 3). Thus, both of them correspond well with surface moisture. Surface water scarcity leads to lower ET and reduces the cooling effect of surface, resulting in increase of TVDI and TMDI. In all five days, higher correlations with SEBAL-derived ET were presented by TMDI compared to TVDI. That is, TMDI more effectively reflects the surface water status and appropriately presents the rate of surface ET than TVDI in the southern parts of Taiwan. In addition, the rapid water supply, as the irrigation or rain occurred before the investigated time-points, can lead to sudden changes in surface water availability, surface ET rate, and LST. The time lag of the surface canopy’s response to water supply leads to difficulties in surface property investigation by remote sensing. This study exhibits the superiority of TMDI in reflecting the rapid variation of surface water status. As compared to TVDI, the dramatic improvement in the correlation with SEBAL-derived ET was presented by TMDI in the time-points with the rain recorded in the few days before the days of concern. Resulting in R-value’s increase from −0.593 to −0.647, −0.734 to−0.88, and −0.8 to −0.852 is observed on the rain-affected days of 20 November, 6 December, and 22 December, respectively. Meanwhile, slighter increases in correlations with SEBAL-derived ET were presented by TMDI in the time-points with no water supply during the previous days. Resulting in R-values slightly improved from −0.856 to −0.89 and −0.8 to −0.823 is seen on 19 October and 4 November, respectively.
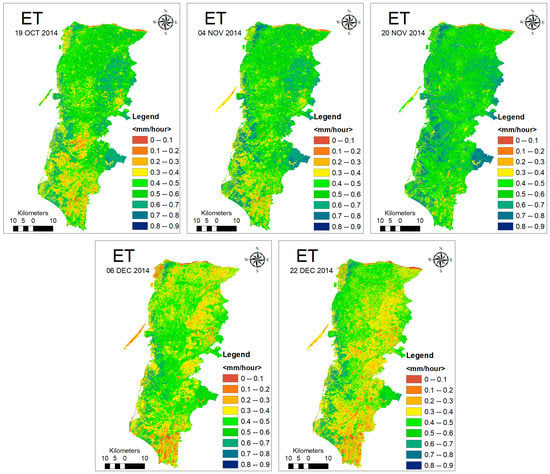
Figure 6.
SEBAL-Derived ET over Yun-Chia-Nan on 19 October, 4 November, 20 November, 6 December, and 22 December 2014.
Table 3.
Correlation between TMDI/TNDI and SEBAL-derived ET over Yun-Chia-Nan on 19 October, 4 November, 20 November, 6 December, and 22 December 2014.
4. Conclusions
This study aims to characterize surface properties and its contribution to the LST variability in order to propose an advantageous indicator for assessing surface moisture and ET rate. The spatio-temporal LST maps of Yun-Chia-Nan area presented the significant variability in the agriculture areas during the second crop growing season of 2014. It corresponds to different characteristics of the canopies and surface water availability at different crop growing stages. The correlation of thermal variability and surface biophysical properties was subsequently determined via quantitative correlations between LST and multi-spectral satellite indices under investigation, i.e., NDVI, BI, NDMI, NDWI, and NDLI. The highest correlation coefficient was observed between LST and NDLI with the negative correlations of −0.617, −0.654, −0.608, −0.529, and −0.393 corresponding to 19 October, 4 November, 20 November, 6 December, and 22 December, respectively. This shows the superiority of NDLI over the other four indices in representing the variation of near-surface thermal signatures. The LST-NDLI triangle space-based, Temperature-surface Moisture Dryness Index (TMDI), was accordingly proposed for assessing the surface moisture and ET. It is based on the deviation of LST with its min/max LST at the given NDLI intervals. The TMDI exhibits good performance in representing surface moisture and ET by showing strong correlations with SEBAL-derived ET. TMDI also exhibited its improvement compared to TVDI in revealing the signatures of immediate surface water variability by presenting the slight and significant improvements in correlations with SEBAL-derived ET on the days no-water/water supply nearby, respectively. Correlations were found to be significantly increased in the investigated times with rains recorded in the previous days (R-values are increased from −0.593 to −0.647, −0.734 to −0.88, and −0.8 to −0.852 on 20 November, 6 December, and 22 December, respectively). The superiority of TMDI has been proven by its effective responses to the surface water status over the region of diverse land cover types, extreme conditions, and different time points. The use of TMDI gives a significant advantage in quickly investigating the thermal environment variability, taking into account the surface moisture and ET, and providing the information for fast decision-making, especially farming management decisions, such as precision irrigation. With diverse remotely-sensed data available, the TMDI is potentially helpful for a variety of practical applications related to the Earth’s surface properties over a large scale since its formula is simple to be easily implemented and does not require any ground-based data.
Author Contributions
Conceptualization: M.S.L., Y.-A.L.; Methodology: M.S.L.; Writing Manuscript: M.S.L., Y.-A.L.; Supervision: Y.-A.L.; Review & Editing: Y.-A.L. All authors have read and agreed to the published version of the manuscript.
Funding
This research was funded by Ministry of Science and Technology (MOST) of Taiwan, under the codes MOST 109-2923-E-008-004-MY2 and MOST 108-2111-M-008-036-MY2.
Data Availability Statement
In this study, satellite data were downloaded from United States Geological Survey (USGS) and weather data were collected from Central Weather Bureau (CWB), Taiwan.
Acknowledgments
The authors would like to thank Hydrology Remote Sensing Laboratory (HRSL), Center for Space and Remote Sensing Research, National Central University (NCU), Taiwan and Remote Sensing Application Department, Space Technology Institute (STI), Vietnam Academy of Science and Technology (VAST).
Conflicts of Interest
The authors declare no conflict of interest.
References
- Allen, R.G.; Pereira, L.S.; Raes, D.; Smith, M. FAO Irrigation and Drainage Paper No. 56; Food and Agriculture Organization of the United Nations: Rome, Italy, 1998; Volume 56, p. e156. [Google Scholar]
- Wang, L.; Qu, J.J. Satellite remote sensing applications for surface soil moisture monitoring: A review. Front. Earth Sci. China 2009, 3, 237–247. [Google Scholar] [CrossRef]
- Zhu, W.; Lv, A.; Jia, S.; Sun, L. Development and evaluation of the MTVDI for soil moisture monitoring. J. Geophys. Res. Atmos. 2017, 122, 5533–5555. [Google Scholar] [CrossRef]
- Liou, Y.-A.; Galantowicz, J.; England, A. A land surface process/radiobrightness model with coupled heat and moisture transport for prairie grassland. IEEE Trans. Geosci. Remote Sens. 1999, 37, 1848–1859. [Google Scholar] [CrossRef]
- Jackson, T.J., III. Measuring surface soil moisture using passive microwave remote sensing. Hydrol. Process. 1993, 7, 139–152. [Google Scholar] [CrossRef]
- Liou, Y.-A.; England, A.W. A land surface process radiobrightness model with coupled heat and moisture transport in soil. IEEE Trans. Geosci. Remote Sens. 1998, 36, 273–286. [Google Scholar] [CrossRef]
- Anderson, M.; Norman, J.; Kustas, W.; Houborg, R.; Starks, P.; Agam, N. A thermal-based remote sensing technique for routine mapping of land-surface carbon, water and energy fluxes from field to regional scales. Remote Sens. Environ. 2008, 112, 4227–4241. [Google Scholar] [CrossRef]
- Li, Z.-L.; Tang, R.; Wan, Z.; Bi, Y.; Zhou, C.; Tang, B.; Yan, G.; Zhang, X. A review of current methodologies for regional evapotranspiration estimation from remotely sensed data. Sensors 2009, 9, 3801–3853. [Google Scholar] [CrossRef] [PubMed]
- Liou, Y.-A.; Kar, S.K. Evapotranspiration estimation with remote sensing and various surface energy balance algorithms—A review. Energies 2014, 7, 2821–2849. [Google Scholar] [CrossRef]
- Li, Z.; Wang, Y.; Zhou, Q.; Wu, J.; Peng, J.; Chang, H. Spatiotemporal variability of land surface moisture based on vegetation and temperature characteristics in Northern Shaanxi Loess Plateau, China. J. Arid Environ. 2008, 72, 974–985. [Google Scholar] [CrossRef]
- Gao, S.; Zhu, Z.; Liu, S.; Jin, R.; Yang, G.; Tan, L. Estimating the spatial distribution of soil moisture based on Bayesian maximum entropy method with auxiliary data from remote sensing. Int. J. Appl. Earth Obs. Geoinf. 2014, 32, 54–66. [Google Scholar] [CrossRef]
- Du, L.; Song, N.; Liu, K.; Hou, J.; Hu, Y.; Zhu, Y.; Wang, X.; Wang, L.; Guo, Y. Comparison of Two Simulation Methods of the Temperature Vegetation Dryness Index (TVDI) for Drought Monitoring in Semi-Arid Regions of China. Remote Sens. 2017, 9, 177. [Google Scholar] [CrossRef]
- Sandholt, I.; Rasmussen, K.; Andersen, J. A simple interpretation of the surface temperature/vegetation index space for assessment of surface moisture status. Remote Sens. Environ. 2002, 79, 213–224. [Google Scholar] [CrossRef]
- Younis, S.M.Z.; Iqbal, J. Estimation of soil moisture using multispectral and FTIR techniques. Egypt. J. Remote Sens. Space Sci. 2015, 18, 151–161. [Google Scholar] [CrossRef]
- Qiu, G.-Y.; Li, H.-Y.; Zhang, Q.-T.; Chen, W.; Liang, X.-J.; Li, X.-Z. Effects of Evapotranspiration on Mitigation of Urban Temperature by Vegetation and Urban Agriculture. J. Integr. Agric. 2013, 12, 1307–1315. [Google Scholar] [CrossRef]
- Sobrino, J.A.; Jiménez-Muñoz, J.C.; Paolini, L. Land surface temperature retrieval from LANDSAT TM 5. Remote Sens. Environ. 2004, 90, 434–440. [Google Scholar] [CrossRef]
- Kerr, Y.H.; Lagouarde, J.P.; Nerry, F.; Ottlé, C. Land surface temperature retrieval techniques and applications: Case of the AVHRR. In Thermal Remote Sensing in Land Surface Processing; CRC Press: Boca Raton, FL, USA, 2004; pp. 55–131. [Google Scholar]
- Sobrino, J.A.; Li, Z.-L.; Stoll, M.P.; Becker, F. Multi-channel and multi-angle algorithms for estimating sea and land surface temperature with ATSR data. Int. J. Remote Sens. 1996, 17, 2089–2114. [Google Scholar] [CrossRef]
- Jiménez-Muñoz, J.C.; Sobrino, J.A. A generalized single-channel method for retrieving land surface temperature from remote sensing data. J. Geophys. Res. Space Phys. 2003, 108. [Google Scholar] [CrossRef]
- Qin, Z.; Karnieli, A.; Berliner, P. A mono-window algorithm for retrieving land surface temperature from Landsat TM data and its application to the Israel-Egypt border region. Int. J. Remote Sens. 2001, 22, 3719–3746. [Google Scholar] [CrossRef]
- Jiménez-Muñoz, J.C.; Sobrino, J.A. Error sources on the land surface temperature retrieved from thermal infrared single channel remote sensing data. Int. J. Remote Sens. 2006, 27, 999–1014. [Google Scholar] [CrossRef]
- Ogashawara, I.; Bastos, V.D.S.B. A Quantitative Approach for Analyzing the Relationship between Urban Heat Islands and Land Cover. Remote Sens. 2012, 4, 3596–3618. [Google Scholar] [CrossRef]
- Knipling, E.B. Physical and physiological basis for the reflectance of visible and near-infrared radiation from vegetation. Remote Sens. Environ. 1970, 1, 155–159. [Google Scholar] [CrossRef]
- McFeeters, S.K. The use of the Normalized Difference Water Index (NDWI) in the delineation of open water features. Int. J. Remote Sens. 1996, 17, 1425–1432. [Google Scholar] [CrossRef]
- Jamalabad, M. Forest canopy density monitoring using satellite images. In Proceedings of the Geo-Imagery Bridging Continents XXth ISPRS Congress, Istanbul, Turkey, 12–23 July 2004. [Google Scholar]
- Liou, Y.-A.; Le, M.S.; Chien, H. Normalized Difference Latent Heat Index for Remote Sensing of Land Surface Energy Fluxes. IEEE Trans. Geosci. Remote Sens. 2019, 57, 1423–1433. [Google Scholar] [CrossRef]
- Reza, A.S.; Jean, J.-S.; Lee, M.-K.; Kulp, T.R.; Hsu, H.-F.; Liu, C.-C.; Lee, Y.-C. The binding nature of humic substances with arsenic in alluvial aquifers of Chianan Plain, southwestern Taiwan. J. Geochem. Explor. 2012, 114, 98–108. [Google Scholar] [CrossRef]
- Yu, X.; Guo, X.; Wu, Z. Land Surface Temperature Retrieval from Landsat 8 TIRS—Comparison between Radiative Transfer Equation-Based Method, Split Window Algorithm and Single Channel Method. Remote Sens. 2014, 6, 9829–9852. [Google Scholar] [CrossRef]
- García-Santos, V.; Cuxart, J.; Martínez-Villagrasa, D.; Jiménez, M.A.; Simó, G. Comparison of three methods for estimating land surface temperature from Landsat 8-tirs sensor data. Remote Sens. 2018, 10, 1450. [Google Scholar] [CrossRef]
- Ahmed, B.; Kamruzzaman, M.; Zhu, X.; Rahman, M.S.; Choi, K. Simulating Land Cover Changes and Their Impacts on Land Surface Temperature in Dhaka, Bangladesh. Remote Sens. 2013, 5, 5969–5998. [Google Scholar] [CrossRef]
- Li, H.; Liu, Q.; Du, Y.; Jiang, J.; Wang, H. Evaluation of the NCEP and MODIS Atmospheric Products for Single Channel Land Surface Temperature Retrieval With Ground Measurements: A Case Study of HJ-1B IRS Data. IEEE J. Sel. Top. Appl. Earth Obs. Remote Sens. 2013, 6, 1399–1408. [Google Scholar] [CrossRef]
- Coll, C.; Caselles, V.; Valor, E.; Niclòs, R. Comparison between different sources of atmospheric profiles for land surface temperature retrieval from single channel thermal infrared data. Remote Sens. Environ. 2012, 117, 199–210. [Google Scholar] [CrossRef]
- Yettella, V.; England, M.R. The Role of Internal Variability in Twenty-First-Century Projections of the Seasonal Cycle of Northern Hemisphere Surface Temperature. J. Geophys. Res. Atmos. 2018, 123, 13149–13167. [Google Scholar] [CrossRef]
- Dwyer, J.G.; Biasutti, M.; Sobel, A.H. Projected Changes in the Seasonal Cycle of Surface Temperature. J. Clim. 2012, 25, 6359–6374. [Google Scholar] [CrossRef]
- Senay, G.B.; Friedrichs, M.; Singh, R.K.; Velpuri, N.M. Evaluating Landsat 8 evapotranspiration for water use map-ping in the Colorado River Basin. Remote Sens. Environ. 2016, 185, 171–185. [Google Scholar] [CrossRef]
- Mkhwanazi, M.; Chávez, J.L.; Andales, A.A. SEBAL-A: A Remote Sensing ET Algorithm that Accounts for Advection with Limited Data. Part I: Development and Validation. Remote Sens. 2015, 7, 15046–15067. [Google Scholar] [CrossRef]
- Allen, R.; Morse, A.; Tasumi, M.; Bastiaanssen, W.; Kramber, W.; Anderson, H. Evapotranspiration from Landsat (SE-BAL) for water rights management and compliance with multistate water compacts. In Proceedings of the Geoscience and Remote Sensing Symposium, IGARSS’01, Sydney, NSW, Australia, 9–13 July 2001; pp. 830–833. [Google Scholar]
- Mutiibwa, D.; Strachan, S.; Albright, T. Land Surface Temperature and Surface Air Temperature in Complex Terrain. IEEE J. Sel. Top. Appl. Earth Obs. Remote Sens. 2015, 8, 4762–4774. [Google Scholar] [CrossRef]
- Mildrexler, D.J.; Zhao, M.; Running, S.W. A global comparison between station air temperatures and MODIS land surface temperatures reveals the cooling role of forests. J. Geophys. Res. Space Phys. 2011, 116. [Google Scholar] [CrossRef]
- Good, S.A.; Corlett, G.K.; Remedios, J.J.; Noyes, E.J.; Llewellyn-Jones, D.T. The Global Trend in Sea Surface Temperature from 20 Years of Advanced Very High Resolution Radiometer Data. J. Clim. 2007, 20, 1255–1264. [Google Scholar] [CrossRef]


Publisher’s Note: MDPI stays neutral with regard to jurisdictional claims in published maps and institutional affiliations. |
© 2021 by the authors. Licensee MDPI, Basel, Switzerland. This article is an open access article distributed under the terms and conditions of the Creative Commons Attribution (CC BY) license (https://creativecommons.org/licenses/by/4.0/).