Article

Analysis Ready Data of the Chinese GaoFen Satellite Data

1
State Key Laboratory of Remote Sensing Science, Aerospace Information Research Institute, Chinese Academy of Sciences, Beijing 100101, China
2
Faculty of Geographical Science, Beijing Engineering Research Center for Global Land Remote Sensing Products, Institute of Remote Sensing Science and Engineering, Beijing Normal University, Beijing 100875, China
*
Author to whom correspondence should be addressed.
Remote Sens. 2021, 13(9), 1709; https://doi.org/10.3390/rs13091709
Submission received: 19 March 2021 / Revised: 24 April 2021 / Accepted: 26 April 2021 / Published: 28 April 2021

Abstract

:
Analysis Ready Data (ARD) has been greatly recommended by the Committee on Earth Observation Satellites (CEOS) for simplifying and fostering long time series analysis at large scale with minimum additional user effort. Landsat ARD has been successfully made and widely used for large scale analysis. Subsequently, the Chinese satellite data similar to Landsat data have been processed and will be processed into ARDs to promote the use of the Chinese satellite data. At the first stage of the mission, the 4 Wide Field Viewing (WFV) data on GaoFen 1 (GF1) covering the whole of China and the surrounding areas have been processed into ARD. The ARD is provided as standard tiles under a common and unified projection with per pixel quality assurance and metadata for tracing back and further processing data, which are finally stored into a Hierarchical Data File (HDF); furthermore, all spectral bands are georegistered and radiometrically cross-calibrated as top of atmosphere (TOA) reflectance and are atmospherically corrected as surface reflectance (SR). Therefore, the ARD can be further used easily to produce land cover and land cover change maps and retrieve geophysical and biophysical parameters.

1. Introduction

Since Landsat 1 was launched in 1972, the Landsat series of satellites have provided the longest temporal record of space-based Earth observations globally at 30 m resolution for over 40 years. The sensors including the Multi-Spectral Scanner (MSS), the Thematic Mapper (TM), the Enhanced Thematic Mapper Plus (ETM+), and the Operational Land Imager (OLI) onboard Landsat series of satellites have been evolving with increasing spectral and spatial fidelity. Since the Landsat archive was released to the public for free through the internet in 2008 [1], Landsat data utilization has dramatically increased [2]. However, large scale applications and analysis using long time series Landsat data [3,4,5,6] always requires extra processing of the data to construct highly consistent data both in time and space, which is very complex and highly costly even for commercial and institutional users, let alone individual users. The extra processing includes georegistration to satisfy the spatial consistency, radiometric calibration to ensure the radiometric consistency, atmospheric correction to remove the influence of the quickly varied atmosphere as much as possible, and per pixel quality control for the exclusion of bad pixels. Under this background, analysis ready data (ARD) for remote sensing data was proposed by the Committee on Earth Observation Satellites (CEOS) and it was defined as “satellite data that have been processed to a minimum set of requirements and organized into a form that allows immediate analysis with a minimum of additional user effort, and, interoperability both through time and with other datasets” (http://ceos.org/ard/, accessed on 25 April 2021). As the pioneer of this issue and in order to make it easier for users to analyze large scale and long-term land cover/land-cover change, and better discover geophysical and biophysical phenomena, the United States Geological Survey (USGS) has made a great effort to process all archived data from the Landsat 4, 5, 7, and 8 over the conterminous United States, Alaska, and Hawaii, into Landsat ARD in 2017 [7]. The ARD has the top of the atmosphere and atmospherically corrected reflectance products accompanied by per pixel quality assessment information with a common equal area projection, which is further georegistered and standardized as predefined tiles. In addition, the metadata file is also equipped for tracing the data back and further processing it [7]. The ARD greatly lowered the difficulty and reduced the time and labor expenses of users on Landsat data pre-processing.
Since the HuanJing-1/A&B (HJ-1/A&B) loaded with 4 CCD cameras, which are Landsat-like, were launched in 2008, several Landsat-like satellites, such as GaoFen-1 (GF-1), Gaofen-6 (GF-6), and Huanjing-2/A&B (HJ-2/A&B), have been put into operation in succession. Therefore, a large amount of data with 30 and 16 m spatial resolution have been archived and their information is listed in Table 1. However, only level 1A/B data have been provided to the public and extra processing has been required while using these data for applications, especially for long-term analysis at large scale. In order to ensure that the Chinese satellite data can be more directly and easily used large scale automated analysis as the Landsat ARD has been, we made the GF1 ARD data available for China and its surrounding areas in 2020, which greatly reduced the users’ burden by skipping pre-processing such as geometric alignment, radiometric recalibration, and atmospheric correction. Similar to the Landsat ARD, the GF1 ARD are provided as standard tiles under a common and unified projection with per pixel quality assurance and metadata for data tracing back and further processing, which is stored into a Hierarchical Data File (HDF); furthermore, all spectral bands are georegistered and radiometrically cross-calibrated as top of atmosphere (TOA) reflectance and are atmospherically corrected as surface reflectance (SR). This paper overviews the main characteristics of the GF1 ARD and future plans. The availability of the ARD for other Chinese satellite data similar to Landsat data will be conducted in several stages. The first stage has focused on the 16 m data from four Wide Field Viewing (WFV) sensors onboard GF1 satellite. The GF6/WFV, HJ1/CCD, and HJ2/WFV will be made available at the second stage.

2. Processing Procedures and Tile Structure for the GF-1 ARD

2.1. Input GF1/WFV Data and Processing

The GF1 ARD are generated from the archived level 1A WFV data of GF1 from China Center for Resources Satellite Data and Application (CRESDA), which are composed of 137,120 acquisitions from April 2013. Level 1A WFV data only provide TOA radiance after systematic geometric processing, whose geolocation accuracy is about 2 Landsat-TM pixels. Subsequently, the geodetic accuracy is not satisfied for reliable information extraction from time series, particularly for change detection [8]. In addition, the radiometric coefficients are provided once a year, which greatly degrades the radiometric accuracy of GF1-WFV and influences the quantitative analysis based on it. The major problems of GF1-WFV stopping it used as ARD are summarized as follows:
(1) The geolocation offset
Due to the subpixel geolocation accuracy of the Landsat data, it was chosen as the reference image to evaluate the relative geometric accuracy of GF1-WFV, and the Sentinel2-MSI is also evaluated for comparison purpose. Table 2 shows the geolocation offset in pixels of the two datasets compared to the Landsat-TM referencing image. Figure 1 shows three different satellite images from Sentinel2A-MSI, Landsat8-OLI, GF1-WFV, respectively before geometric normalization, whose central location is set at 116.39°E, 39.94°N. The geolocation accuracy of Sentinel2-MSI is excellent and it is very similar to that of Landsat-TM. Although the GF1-WFV’s geolocation accuracy (1~2 pixels) is very close to that of Sentinel2 and Landsat, it is still larger and cannot be used for time series analysis directly.
(2) The radiometric inconsistency
The EO instruments’ calibration accuracy and consistency over time are critical parameters that directly impact the quality of the data products derived from these observations [9]. These instruments, even with very similar characteristics, have operated on different platforms for different purposes and they could be developed and built with different technologies. Therefore, calibration traceability or stability could not be established. In addition, it is hardly possible for satellite instruments to not change their radiometric characteristics during the lifetime of its mission. Therefore, high quality on-orbit calibration intercomparisons among different instruments and improved calibration accuracy requirements for individual instruments have become increasingly important and demanding. Yang et al. reported the radiometric difference between CCDs onboard HJ-1A/B [10]. The calibration difference among sensors subsequently needs to be taken into serious consideration.
(3) Remote sensing imagery are the signature of land surface which comes from the solar illumination modulated twice by atmosphere; the quick variation of the atmosphere is included in remote sensing imagery, so most remotely sensed images cannot be used without removing the atmospheric effect.
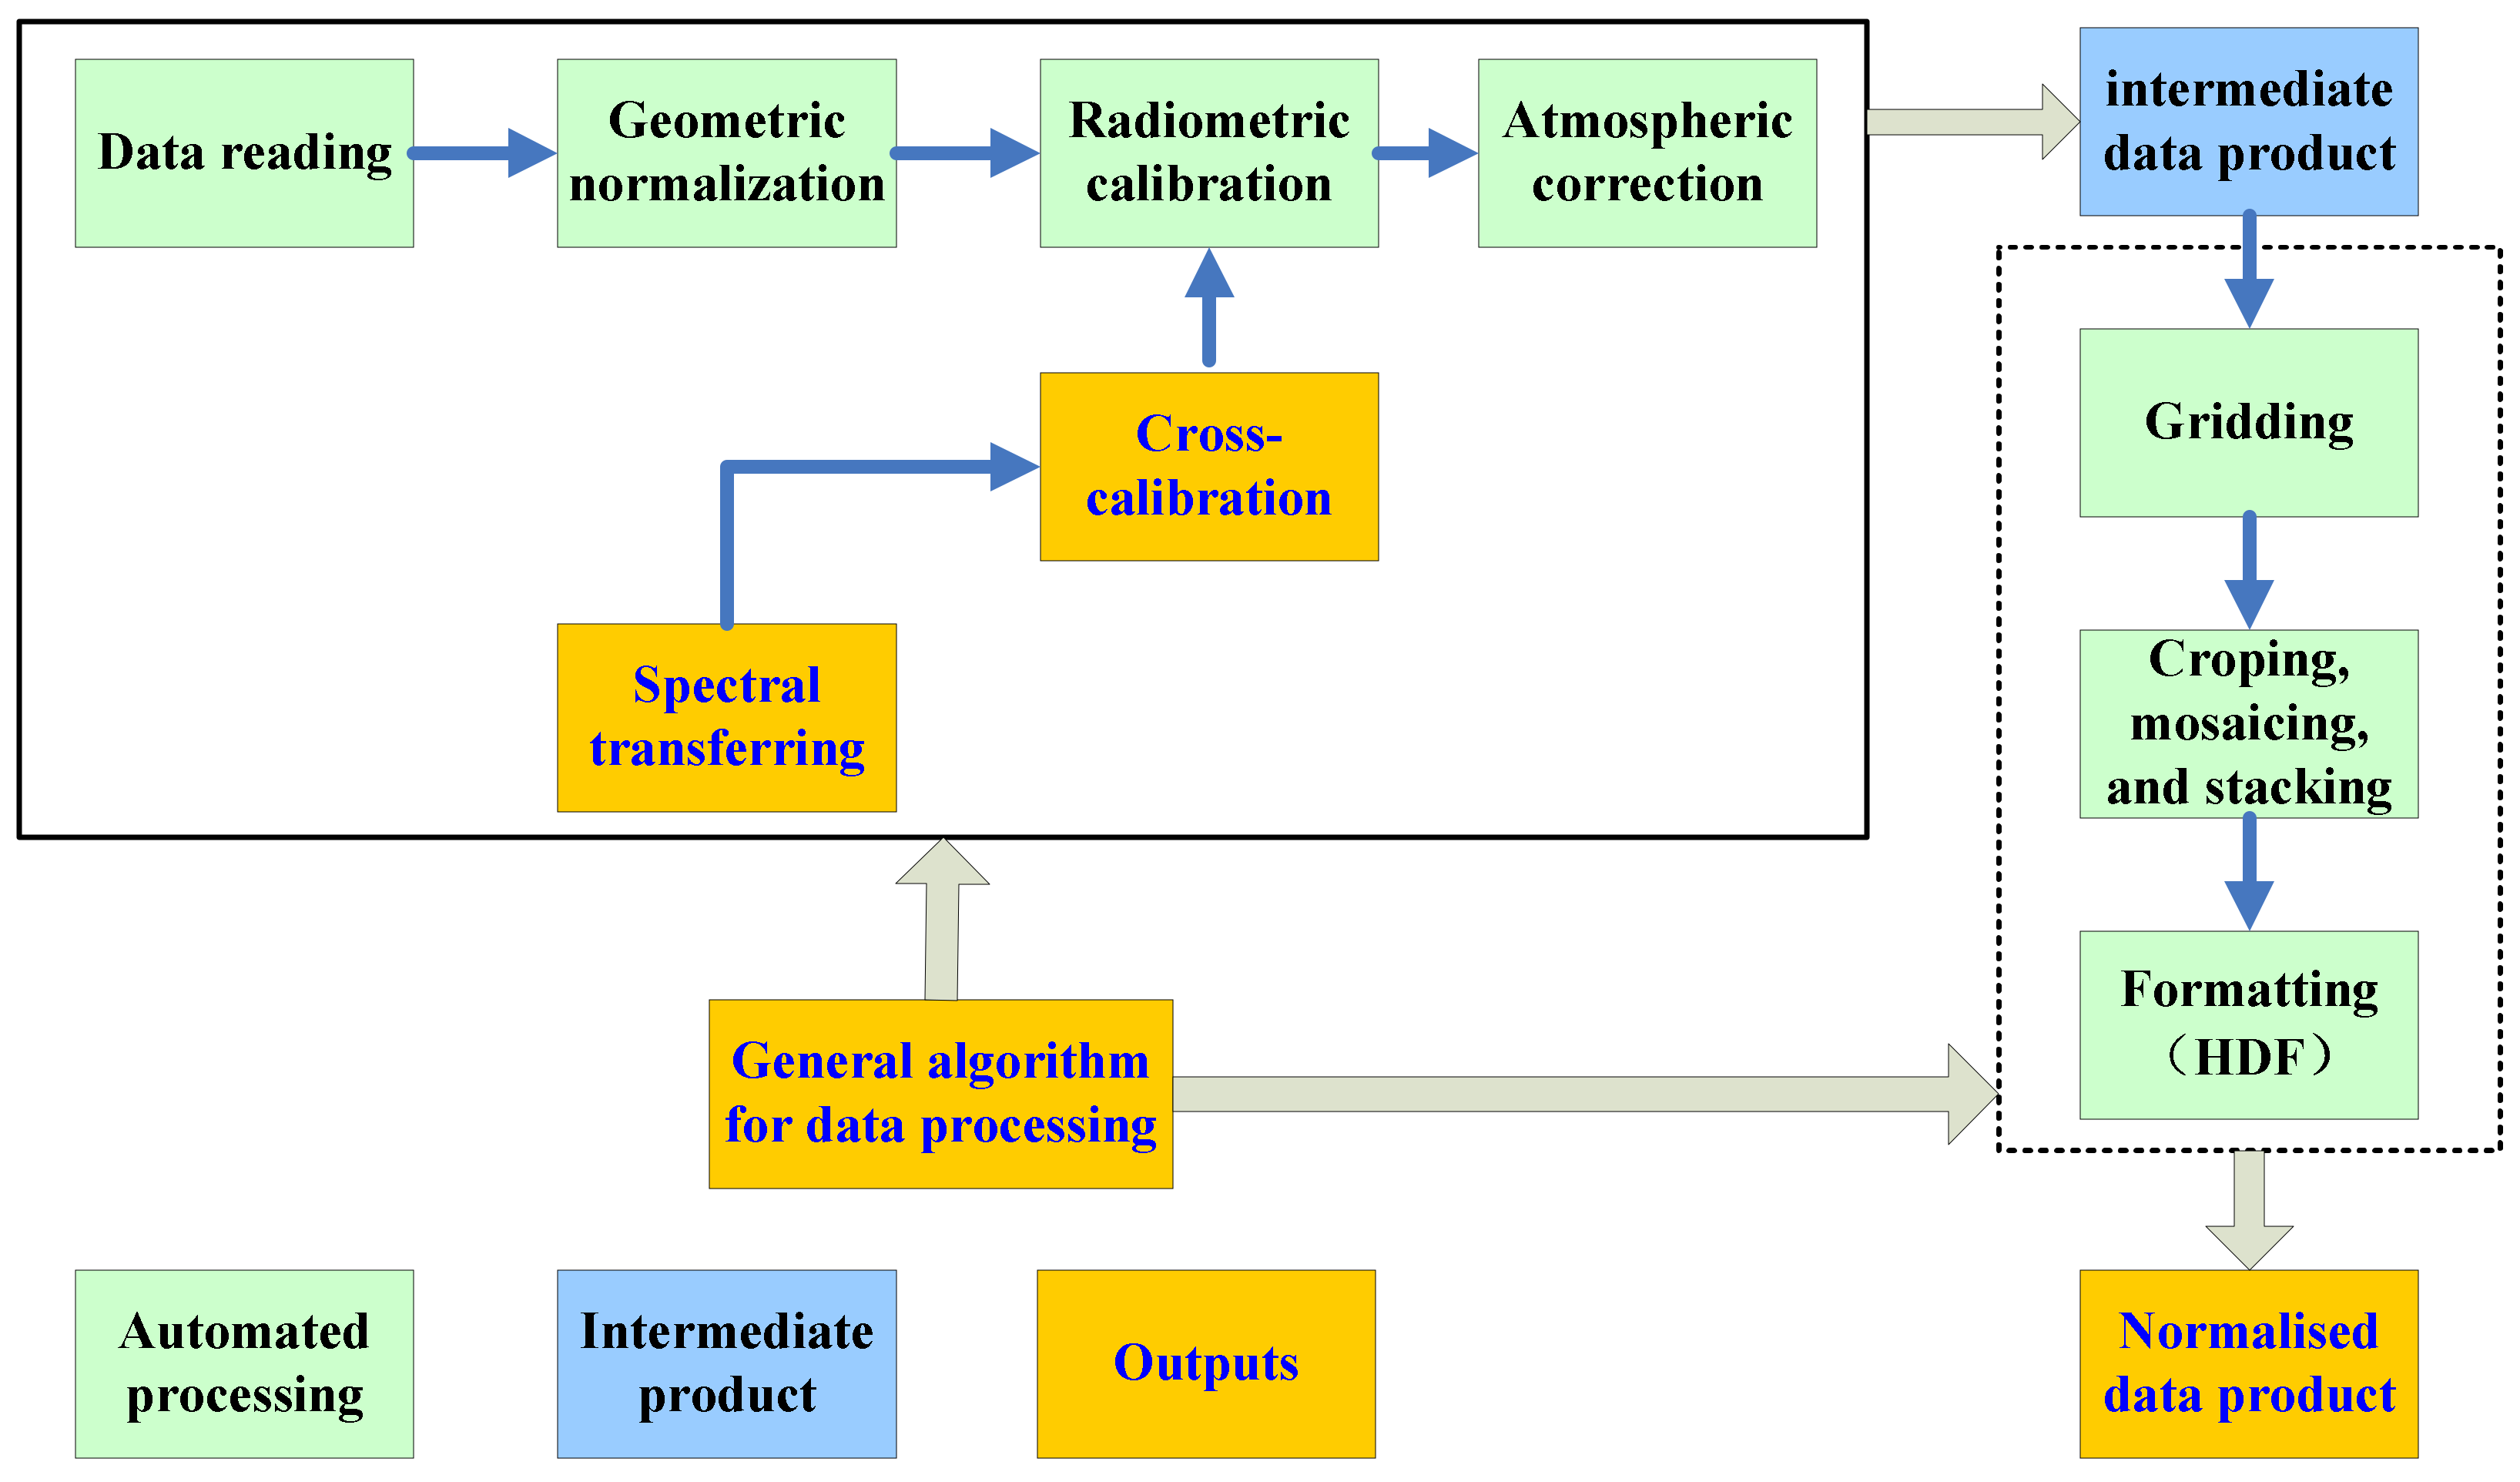
In order to solve the above problems to generate a good GF1-WFV ARD for a better time series analysis, a framework for Chinese satellite ARD generation is proposed in this study. The framework incorporates a set of data processing algorithms dealing with the technical and scientific problems of Chinese satellite data on the geometric, radiometric and spectral difference, which correct the Chinese satellite data using Landsat-TM/OLI as standard. With the support of automation and high-performance computers, the algorithms are integrated into a software called System for MUlti-source data SYnergized Quantitative remote sensing production system (MuSyQ). The major idea of the proposed framework is presented in Figure 2.
The ultimate objective for this framework is to fully process all the data listed in Table 1 and the future data to construct Chinese Satellite data ARD (TOA and surface reflectance) to support the production of better biophysical and geophysical products at moderate to high spatial resolution. Consequently, a set of algorithms for solving the problems above have been developed under the proposed framework with a lot of effort from many scientists and engineers. These algorithms are detailed as follows.

2.1.1. Geometric Normalization

The Landsat GeoCover Mosaics (1984–1997) are used as the referencing images, which is generated using the band 742 combinations. The procedure developed by Shan et al. [11] is adopted for the geometric normalization of the GF1-WFV data. A hierarchical image matching strategy based on the combination of SIFT feature points and template matching is employed. This approach decomposes a matching problem of a whole image into numerous matching problems of image blocks. Hierarchical RANSAC based on DEM (H-RANSAC) is used to remove incorrect controlling points (CPs). The approach can obtain a large number of CPs with high precision and even distribution, which effectively improve the geometric precision of the Chinese satellite images. In addition, Delaunay TIN is used to rectify local distortions. This approach is automatic and supports the batch processing of the GF1-WFV images. After being registered using the hierarchical matching method, the geolocation accuracy has a significant improvement. The evaluation shows that the registration RMSE is less than one pixel. The detail of this method is given in reference [11].

2.1.2. Radiometric Normalization

The radiometric normalization is realized through cross-calibrating with the Landsat TM/OLI, which has extrusive radiometric performance [12]. Since most of the MHR data from Chinese satellites have very large swath width, the Bidirectional Reflectance Distribution Function (BRDF) effect needs to be considered while performing cross-calibration. A technique taking advantage of a desert site with a uniform surface material and natural topographic variation is employed to simulate the site’s BRDF model using near nadir Landsat ETM+ observations and ASTER GDEM data altogether [13]. The simulated BRDF is then used to simulate the surface and TOA reflectance under HJ1-CCD’s solar illumination and view geometries and the cross-calibration of HJ1-CCD is subsequently performed. A validation using four ground campaigns synchronized with all the four CCDs onboard HJ1 A/B in three consecutive years from 2009–2011 has been performed and it shows that the proposed cross-calibration method performs very well for different HJ1-CCD cameras in consecutive years and is satisfied with the requirements of 5% error from ground measurements for radiometric calibration procedure. The detail of this method is given in reference [13]. This method has been evolved and applied to the other MHSR Chinese data, such as GF1-WFV [14], GF4-PMS [15] and GF6-WFV [16].

2.1.3. Atmospheric Correction

Due to lacking the 2.1 μm band for most of the Chinese moderate to high resolution satellite data, the DDV [17,18] and the Landsat Ecosystem Disturbance Adaptive Processing System (LEDAPS) method [19] cannot be applied. The coarse resolution of the retrieved AOD from the MODIS-based method [20] is not sufficient for the MHSR data. Therefore, an algorithm that can effectively estimate the spatial distribution of atmospheric aerosols and retrieve surface reflectance from major MHSR data under general atmosphere and land surface, including bright surfaces, was developed [21]; furthermore, this approach is completely automatic and it is therefore suitable for operational applications. The derived AODs from over 200 images around the Beijing area were validated by a comparison with AErosol Robotic NETwork (AERONET) measurements at the Beijing and Xianghe sites, which indicated that the AOD data derived from the new algorithm agreed well with AERONET ground measurements. The detailed information of this algorithm is given in reference [21].

2.2. The ARD Tiling and Projection

As both GF1-WFV and Sentinel2-MSI have similar spatial resolution (16 m and 10 m) and higher revisiting periods (4-day and 5-day), the combined use of both datasets will further reduce the revisiting period and retrieve more usable observations, subsequently decreasing the influence of clouds and other atmospheric conditions. In order to combinedly use the two ARD easily in the near future, the ARD tiling system for Sentinel2-MSI is employed by the GF1-WFV ARD.
The tiling system is directly inherited from the Military Grid Reference System (MGRS), which can represent any location on the surface of the Earth using an alphanumeric string and is a complete and comprehensive framework for global data collection, management, visualization, and analysis. Although the MGRS was used for military purposes at the beginning, its advantages in data management and visualization, and data representation at global scale have made it popular in a variety of disciplines, such as disaster response and global remote sensing data gridding.
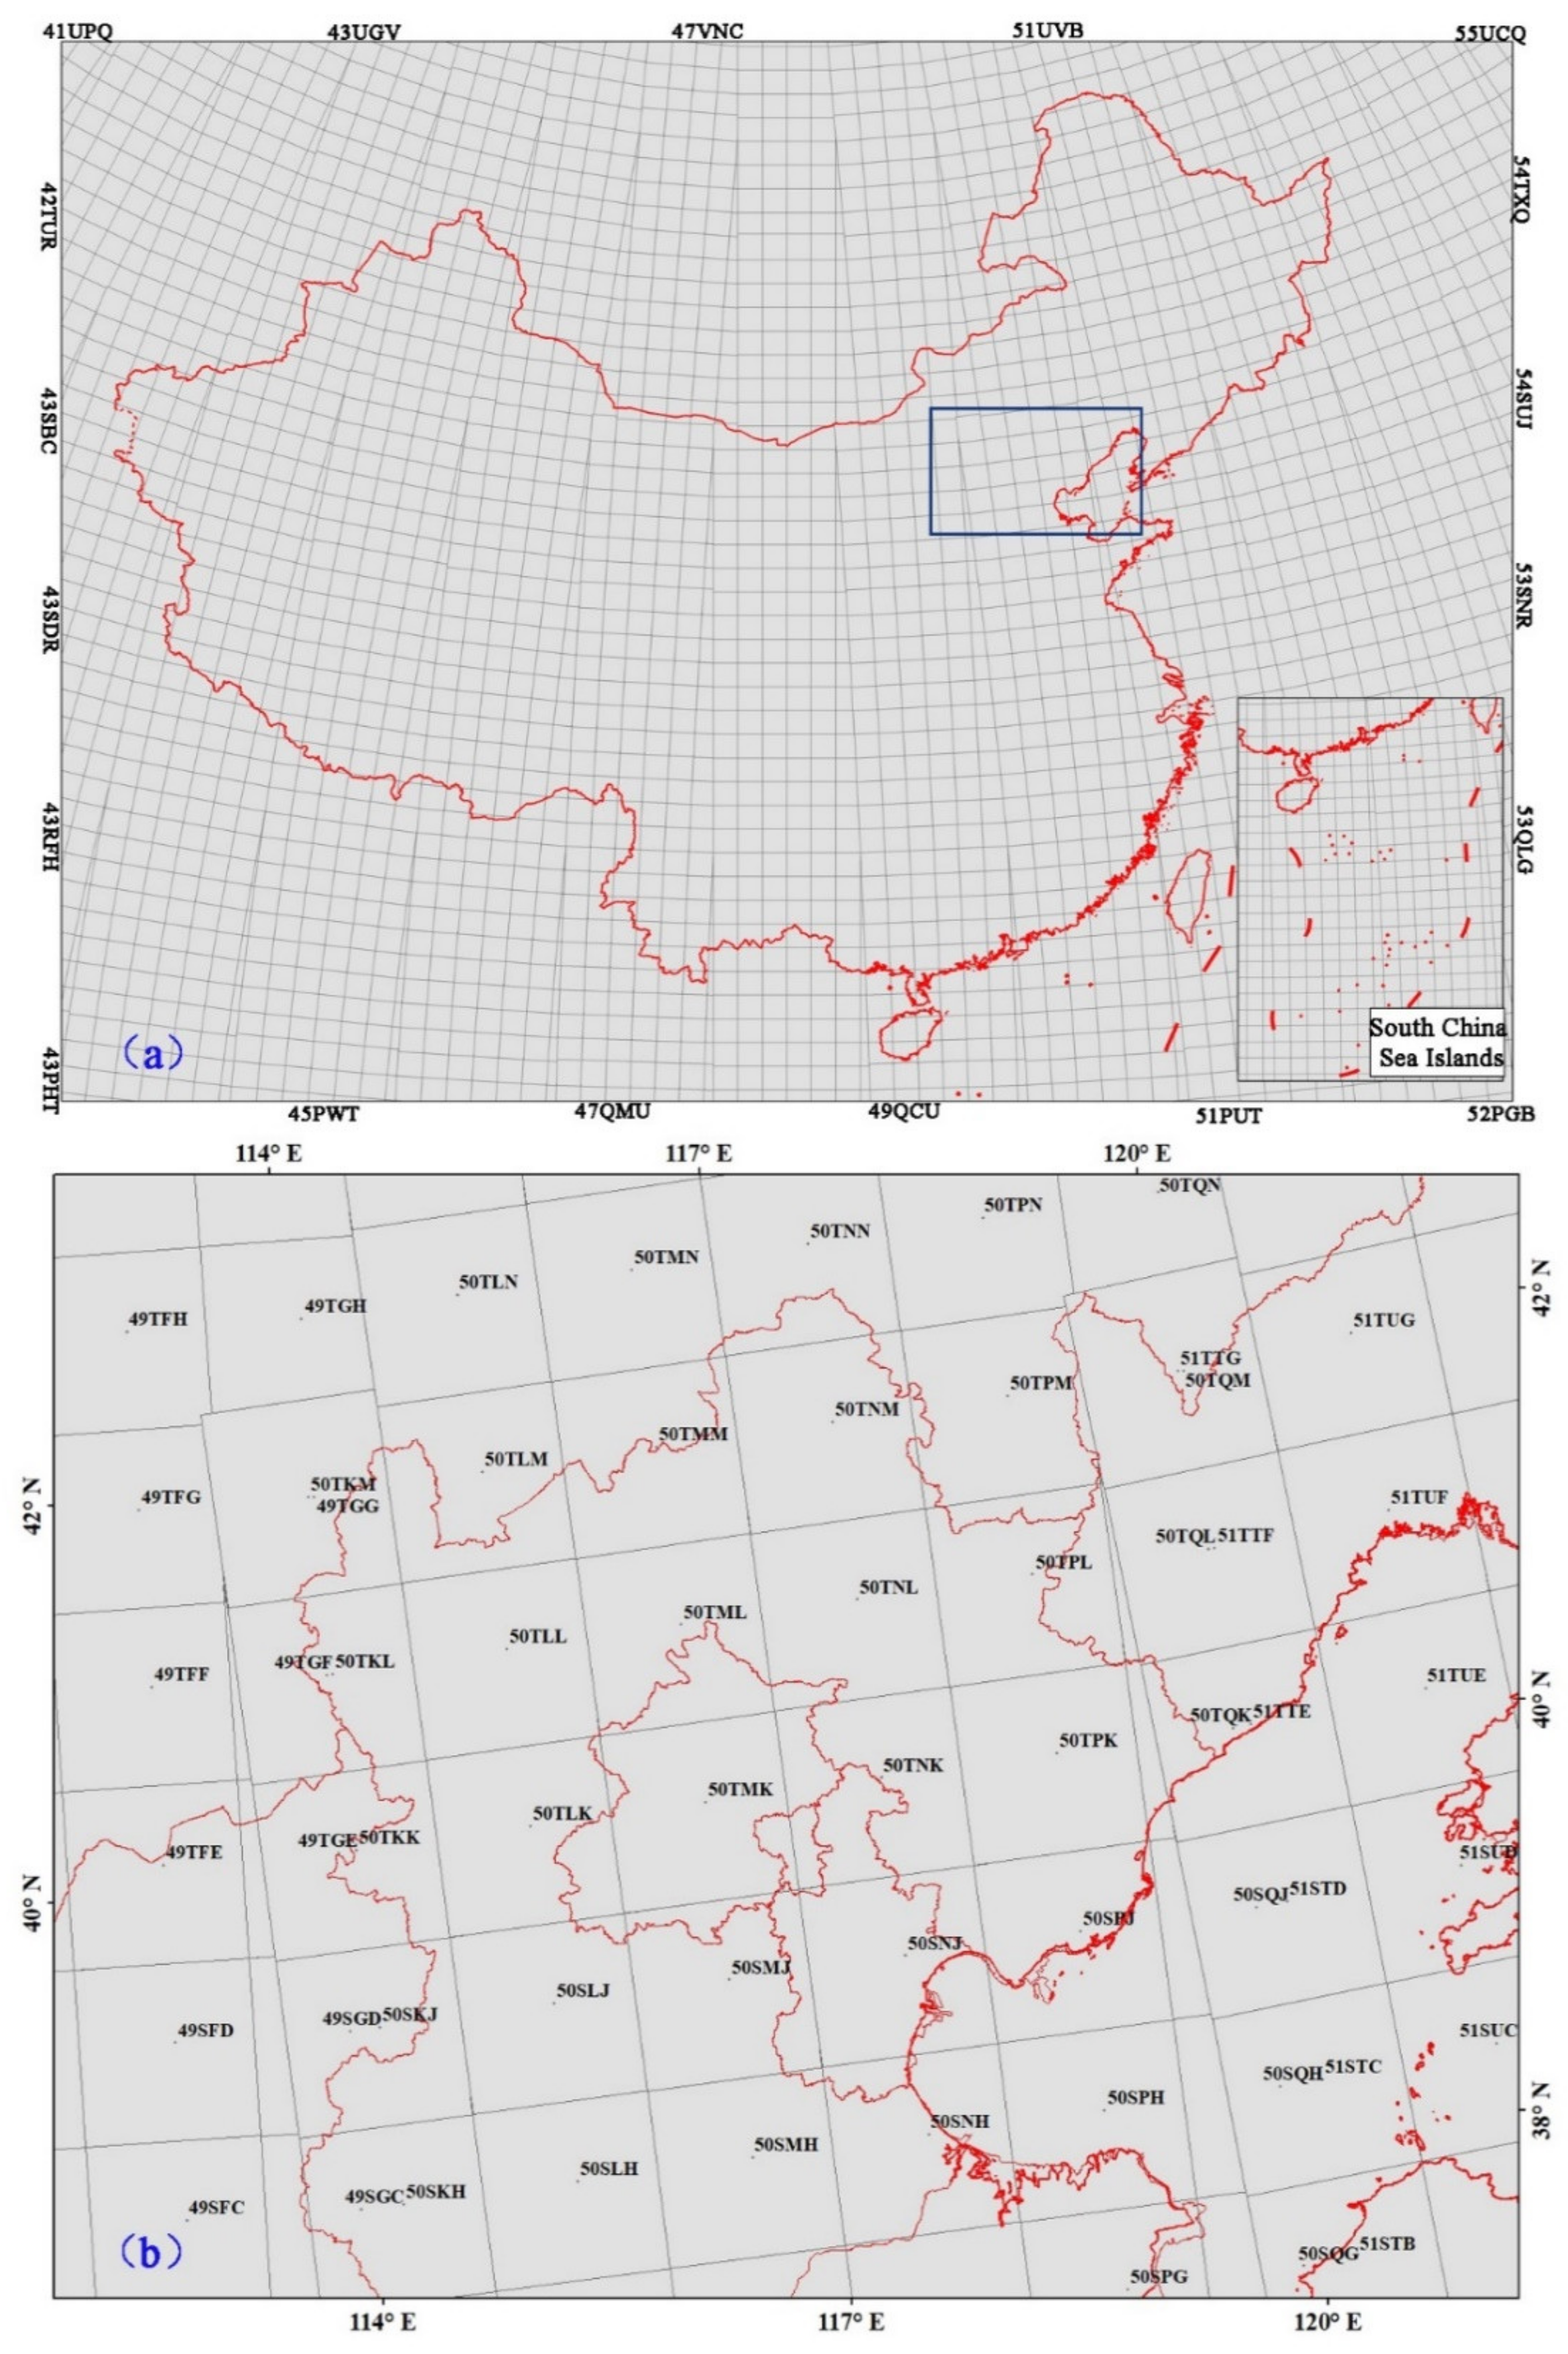
MGRS is hierarchically referenced from the Universal Transverse Mercator (UTM) coordinate system. The UTM system divides the Earth’s surface into 60 zones. Each UTM zone as a square area has a vertical width of 6° of longitude and horizontal width of 8° of latitude, which is the smallest scale in MGRS; subsequently, the projection within this square area is directly defined by the specific UTM zone under WGS84. The detailed information on MGRS can be checked at http://mgrs-data.org/ (accessed on 21 January 2021). Although the largest scale under MGRS can be up to 1m square, the 100 × 100 km2 squares in UTM/WGS84 projection are used for gridding both the Sentinel2-MSI and GF1-WFV. The gridding structure in KML file can be downloaded from https://sentinels.copernicus.eu/documents/247904/1955685/S2A_OPER_GIP_TILPAR_MPC__20151209T095117_V20150622T0 00000_21000101T000000_B00.kml (accessed on 25 April 2021). For GF1-WFV ARD, only the grids covering China and its surrounding areas are used and Figure 3 illustrates the ARD tile coordinates. Each ARD tile is composed of 6863 × 6863 16 m pixels (100 × 100 km) and the tiles are referenced in each region by horizontal and vertical tile coordinates based on MGRS.

3. ARD Contents

3.1. ARD Filename Convention, Format, Metadata and Documentation

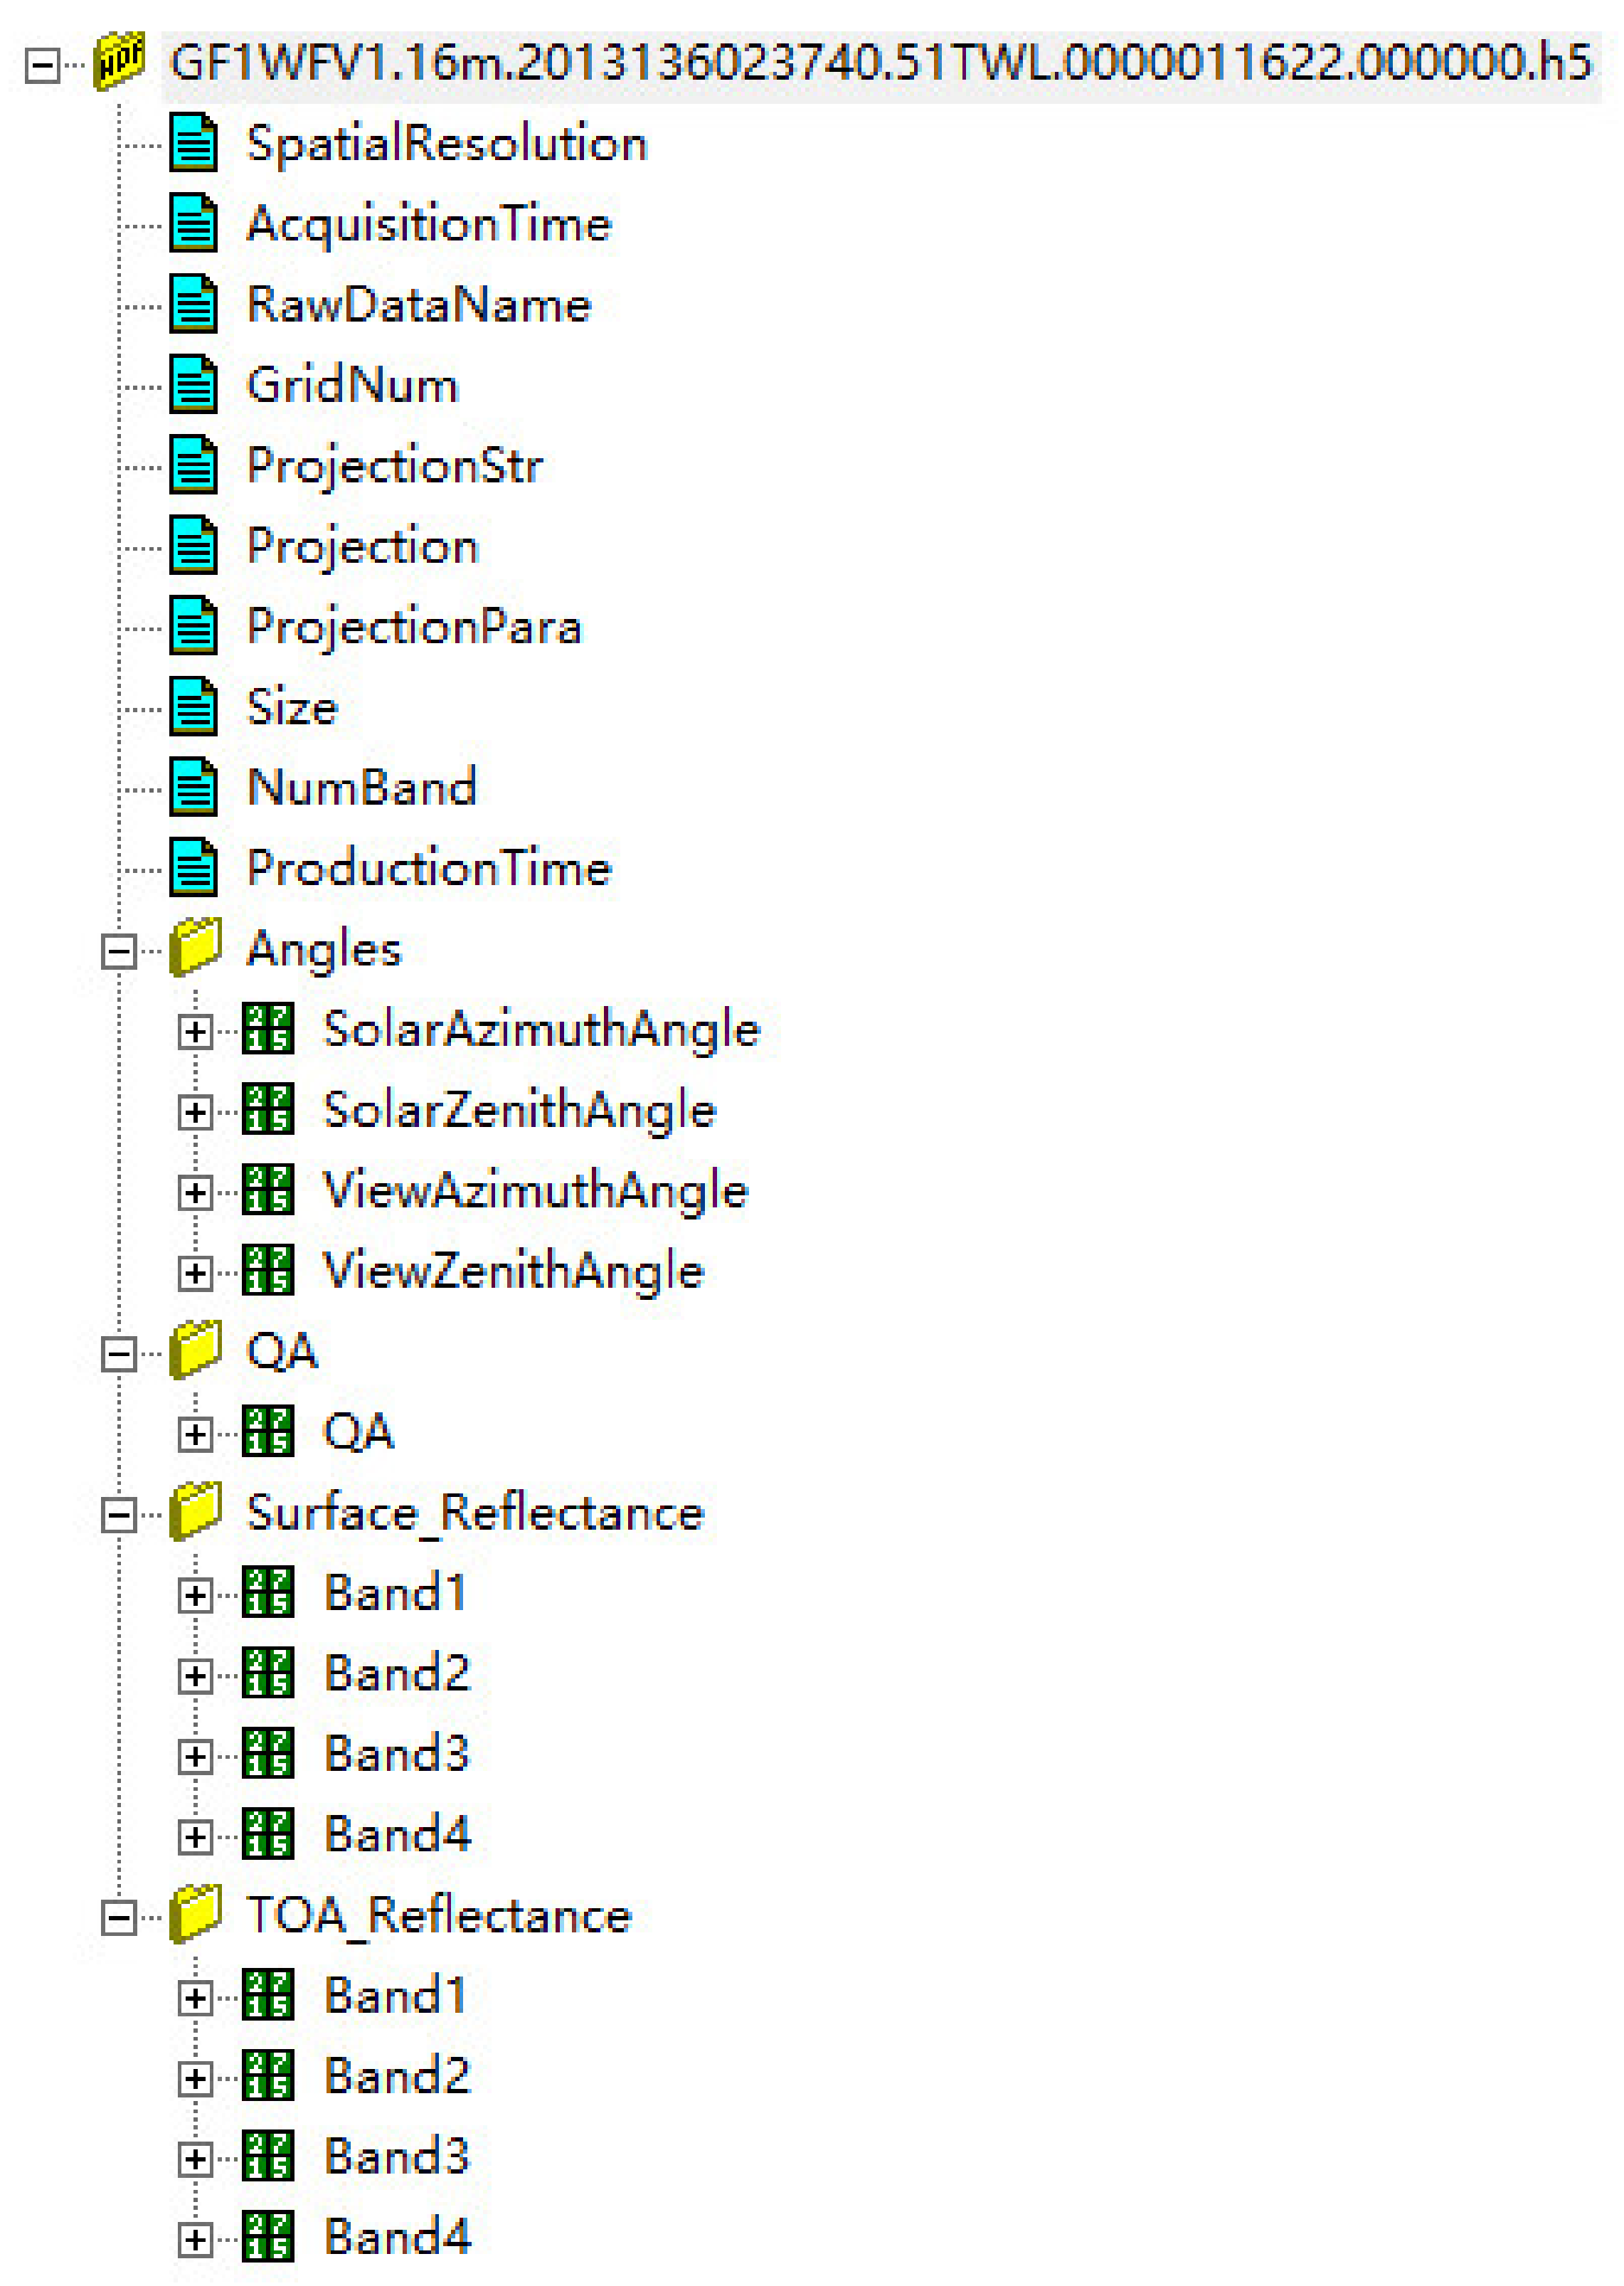
The ARD stores the GF1-WFV reflectance values for every band at each tiled pixel location for purpose of ease of use. In addition, the ARD includes a per pixel quality assessment (QA) band at each ARD. Users usually require surface reflectance after atmospheric correction; however, certain users may have better atmospheric correction choices to produce surface reflectance, so top of atmosphere (TOA) reflectance as separate ARD tile bands are also provided in the ARD. Therefore, four separated datasets are provided in each ARD HDF file, which are: viewing and solar geometry data, TOA reflectance, surface reflectance, and QA. In addition, the metadata of the ARD file and each dataset are also recorded for tracing back purposes. Figure 4 is an example of the ARD HDF file. The metadata for the file document the tile spatial and temporal attributes, band numbers, projection information, provenance, and processing information.
The ARD are stored into HDF5 files and self-compressible HDF5 files can greatly reduce storage volume. Each ARD file has a human-readable filename that can be parsed by programming scripts. The convention of ARD filename is as follows:
GF1WFVX.16m.YYYYDAYHHMMSS.51TWL.0000011622.000000.h5
where GF1 refers to the GaoFen 1 mission; WFV refers to the sensor (Wide Field Viewing); since there are 4 WFV sensors, X refers to the number of sensors (1~4 only); 16 m is the spatial resolution; YYYYDAYHHMMSS is the sensor acquisition year, Julian calendar day, and the overpassing time; 51TWL is the gridding code from MGRS at scale of 100 km; 0000011622 is the series number inheriting from the original GF1-WFV data; 000000 is preserved for the ARD processing version updating; h5 refers to the file format (HDF version 5).

3.2. The Viewing and Solar Geometry Dataset

The solar and viewing geometries (view and azimuth angles) for each 16 m pixel are also calculated and provided as ARD tile bands to retrieve biophysical and geophysical parameters quantitatively, such as albedo and leaf area index, for advanced applications and further processing, such as topographic correction and compensation for BRDF effect. The solar angles are derived using the NOVAS version 3.1 software from the U.S. Naval Observatory, which is configured to access the JPL DE421 planetary ephemeris, and are parametrized with the location, date and time of each pixel acquisition. The view geometry is derived as part of the standard GF1-WFV geometric processing. Table 3 summarizes the angular dataset of the ARD.

3.3. ARD TOA Reflectance Dataset

Level 1A data with only digital numbers (DN) provided by CRESDA are firstly geometric normalized using the method at Section 2.1.1; DN values are then calculated using the cross-calibration coefficients from the method at Section 2.1.2 and the calibrated ARD TOA reflectance for each reflective band pixel is normalized with respect to the cosine of the solar zenith angle. Subsequently, the TOA reflectance for each GF1-WFV reflective band is provided as a separate ARD tile band. Table 4 summarizes the TOA reflectance dataset of the ARD.

3.4. ARD Surface Reflectance Dataset

Compared to TOA reflectance, surface reflectance is preferred by most of users for further applications, because the biophysical and geophysical parameters are significantly influenced by atmospheric absorption and scattering induced by aerosols, gases and water constituents. Among these components in the atmosphere, aerosols are the most difficult ones to remove reliably due to their high variability, spatially uneven distribution, and significant impacts on the visible bands, especially at shorter wavelengths, such as the blue and green bands [20,22,23]. The GF1-WFV ARD reflectance dataset is provided in the GF1-WFV ARD, which is calculated from the TOA reflectance and angular datasets (Section 3.1) using the atmospheric correction method in Section 2.1.3. The surface reflectance bands in ARD are stored in the same way as the TOA reflectance bands but in a separate dataset within the same HDF file. The data type (INT16), scaling factors (0.0001), fill values (−9999), and valid ranges (0~10000) are all the same.

3.5. ARD Quality Assessment Bands

Although per pixel quality assessment (QA) information is not necessary, this kind of information can be very convenient for scientists and for applications’ users to improve their analysis, especially for time series analysis involving a large amount of data, by automatically discarding unsuitable and low-quality data through inspecting per pixel QA information. Considering QA becoming a standard in most satellite products [24,25], they are provided in the GF1-WFV ARD, too.
In order to make the QA information simple and easy to use, only one QA band is designed in this ARD. The QA band stores the information in a bit-packed format with a 16-bit unsigned integer (UINT 16). It contains information that is passed through from the level 1A data processing and also includes information pertaining to the atmospheric correction, using the method at Section 2.1.3, while the surface reflectance bands are used. The Pixel QA band is a bit-packed band with bits set to 1 to denote the cloud information, aerosol information, or fill value (Table 5). These cloud information are based on the object-oriented cloud detection algorithm described in [26]. In addition, a cloud dilation is performed to label pixels adjacent to clouds and cloud shadows, in order to further reduce the influences of the possible cloud and cloud shadow. The aerosol information is based on the algorithm at Section 2.1.3. The standard bit-packing convention is used for this band. For example, if an ARD tile pixel is flagged as a filled pixel then at that pixel location all bits of the Pixel QA band are set to zero except bit 0, which is set to 1 (providing a decimal Pixel QA band value of 10 = 1). Similarly, for example, if an ARD tile pixel is flagged as cloud then bit 4 is set as 1 and the other bits are set to 0 (providing a decimal Pixel QA band value of 23 = 8).

3.6. The Preliminary Application of the GF1-WFV ARD

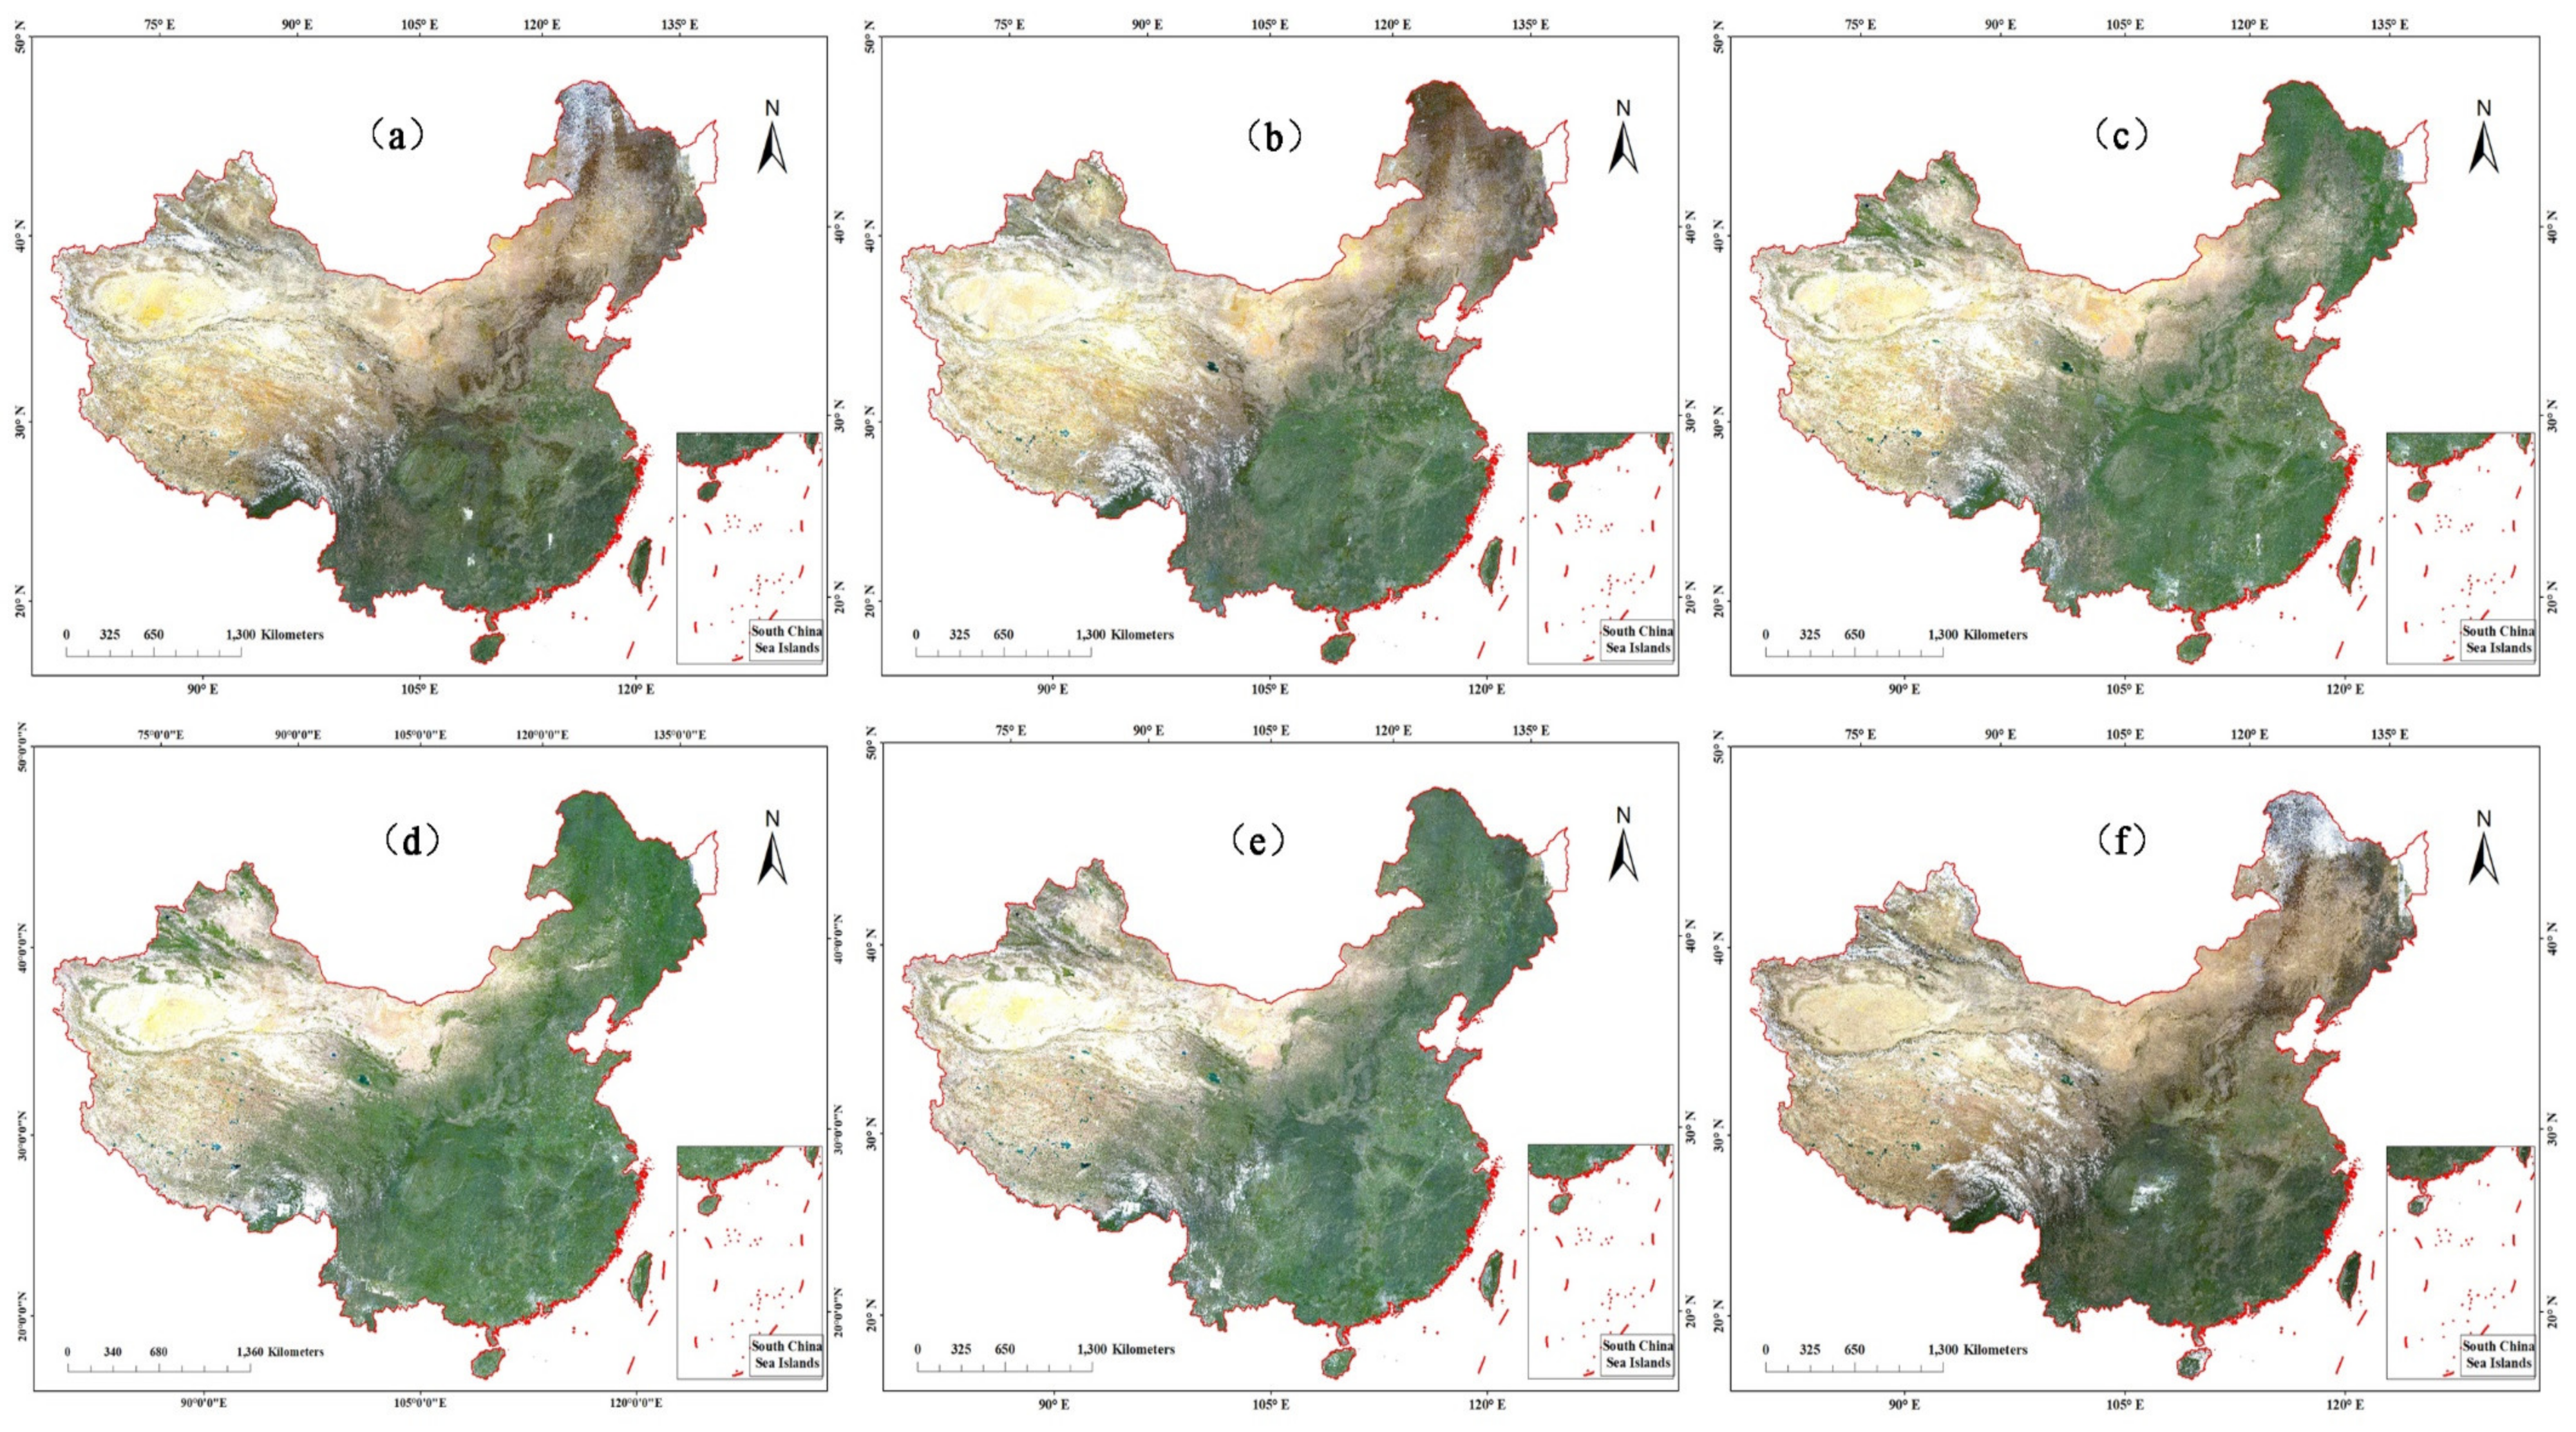
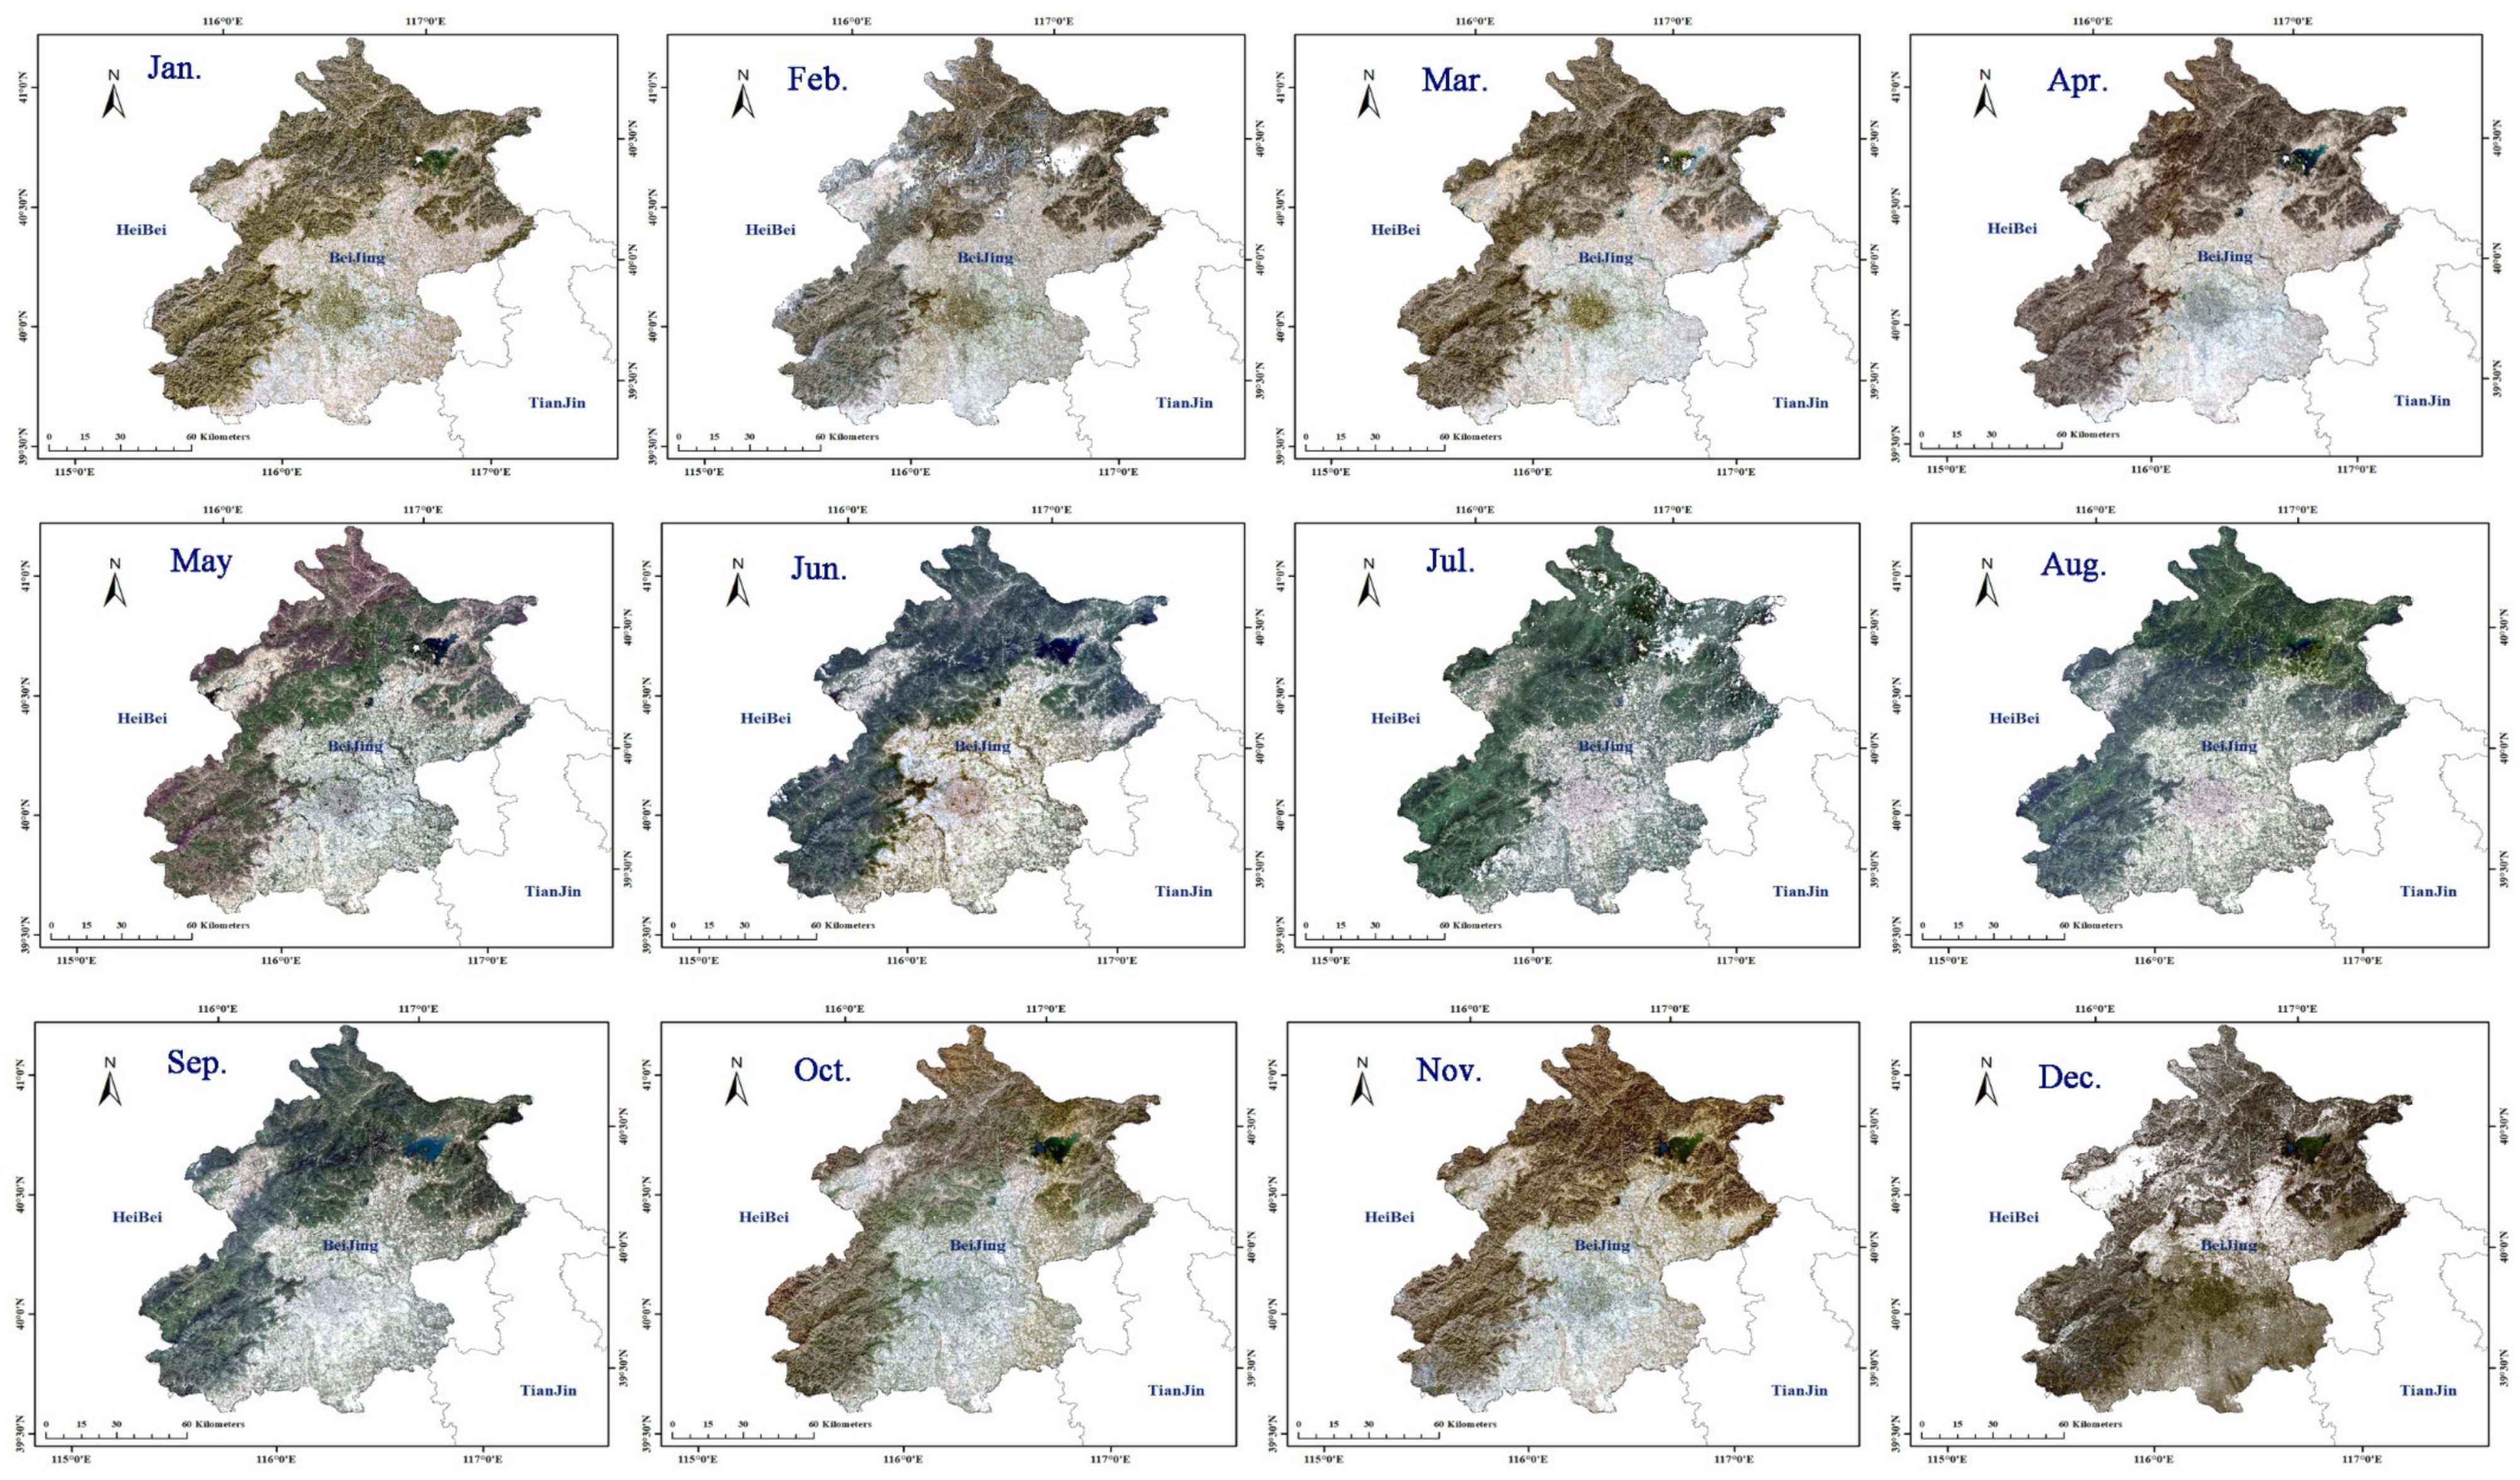
After being processed following the ARD procedures, the GF1-WFV ARD during a period of time, such as a month, can be easily stacked to produce a surface reflectance mosaic. The monthly surface reflectance data can be used for time series analysis and to produce corresponding biophysical and geophysical parameters. Although monthly surface reflectance maps of China in 2019 can be composited, the bimonthly surface reflectance maps are provided instead in this study due to that the data from GF1-WFV only have been enough to composite surface reflectance mosaics at national scale (China) without cloud contamination (Figure 5). However, the combined use of GF1-WFV, Sentinel2-MSI, and GF6-WFV in near future will greatly solve this problem and produce composite surface reflectance images with even lower temporal intervals, such as monthly and even 10-day. Since the weather conditions in Beijing are dry and therefore surface reflectance mosaics could be better produced. The monthly mosaics of Beijing at a closer view are plotted in Figure 6 to better illustrate the possibility for further applications and the advantages of the GF1-ARD for time series analysis.
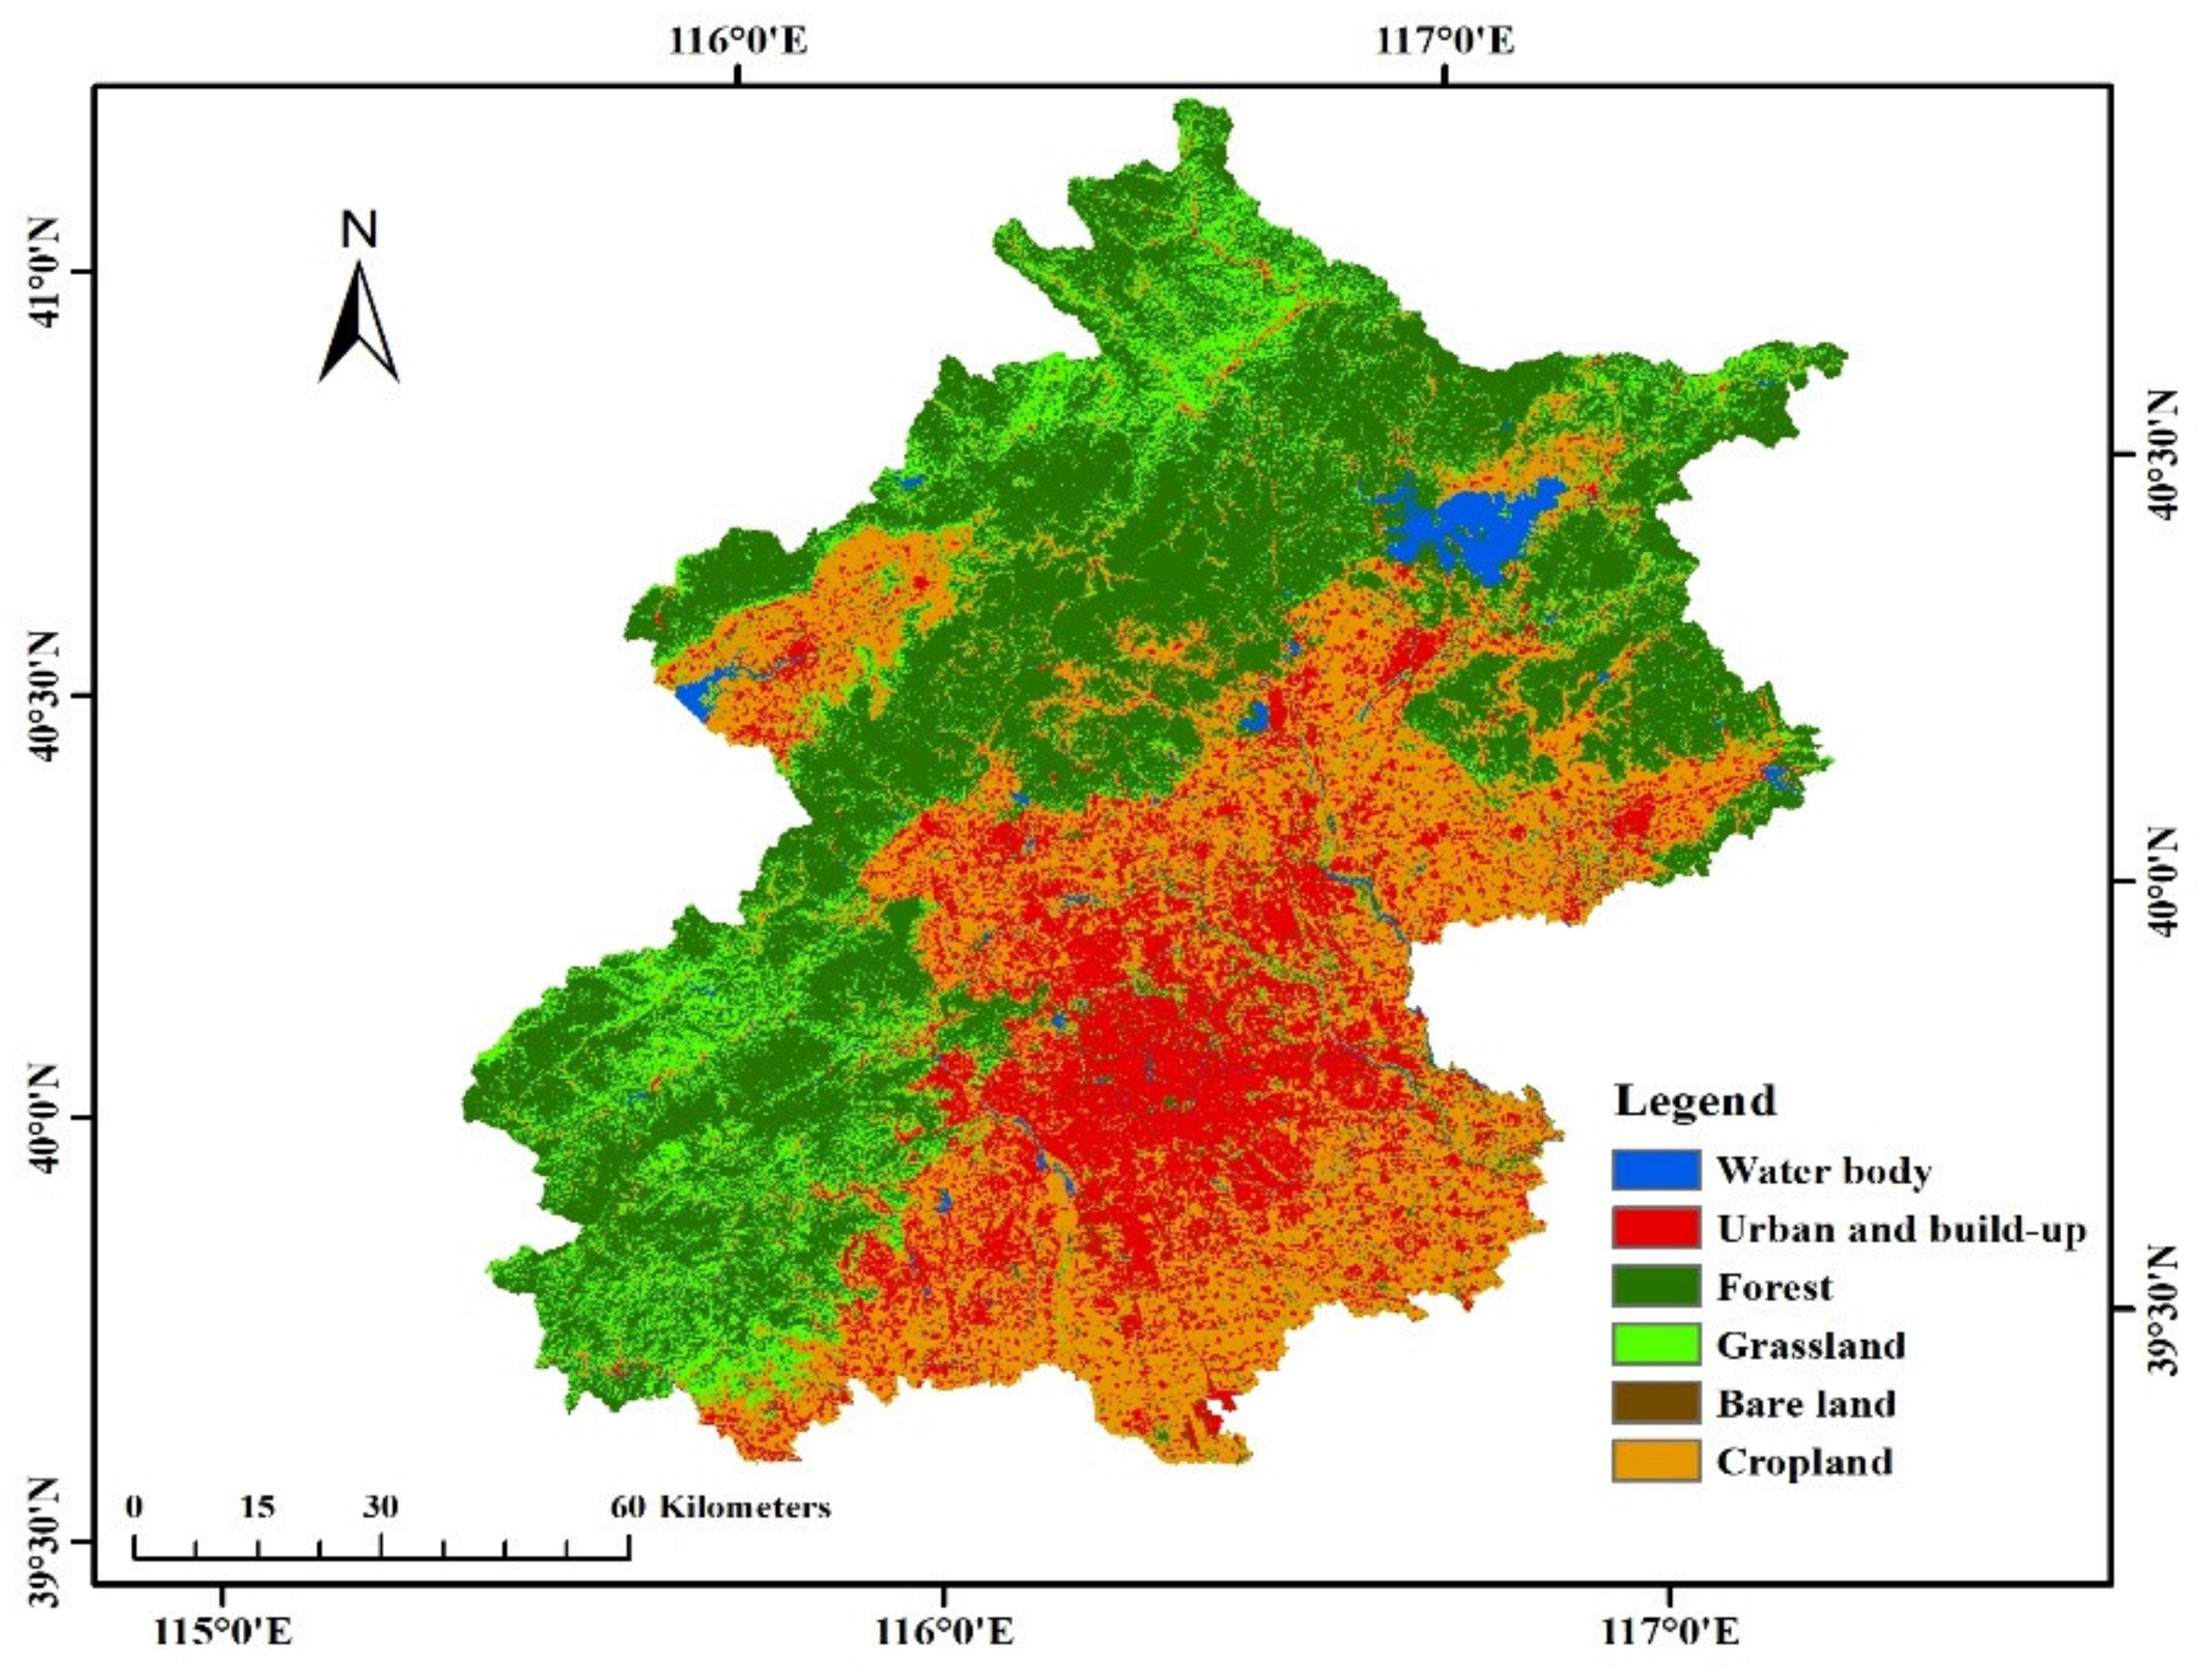
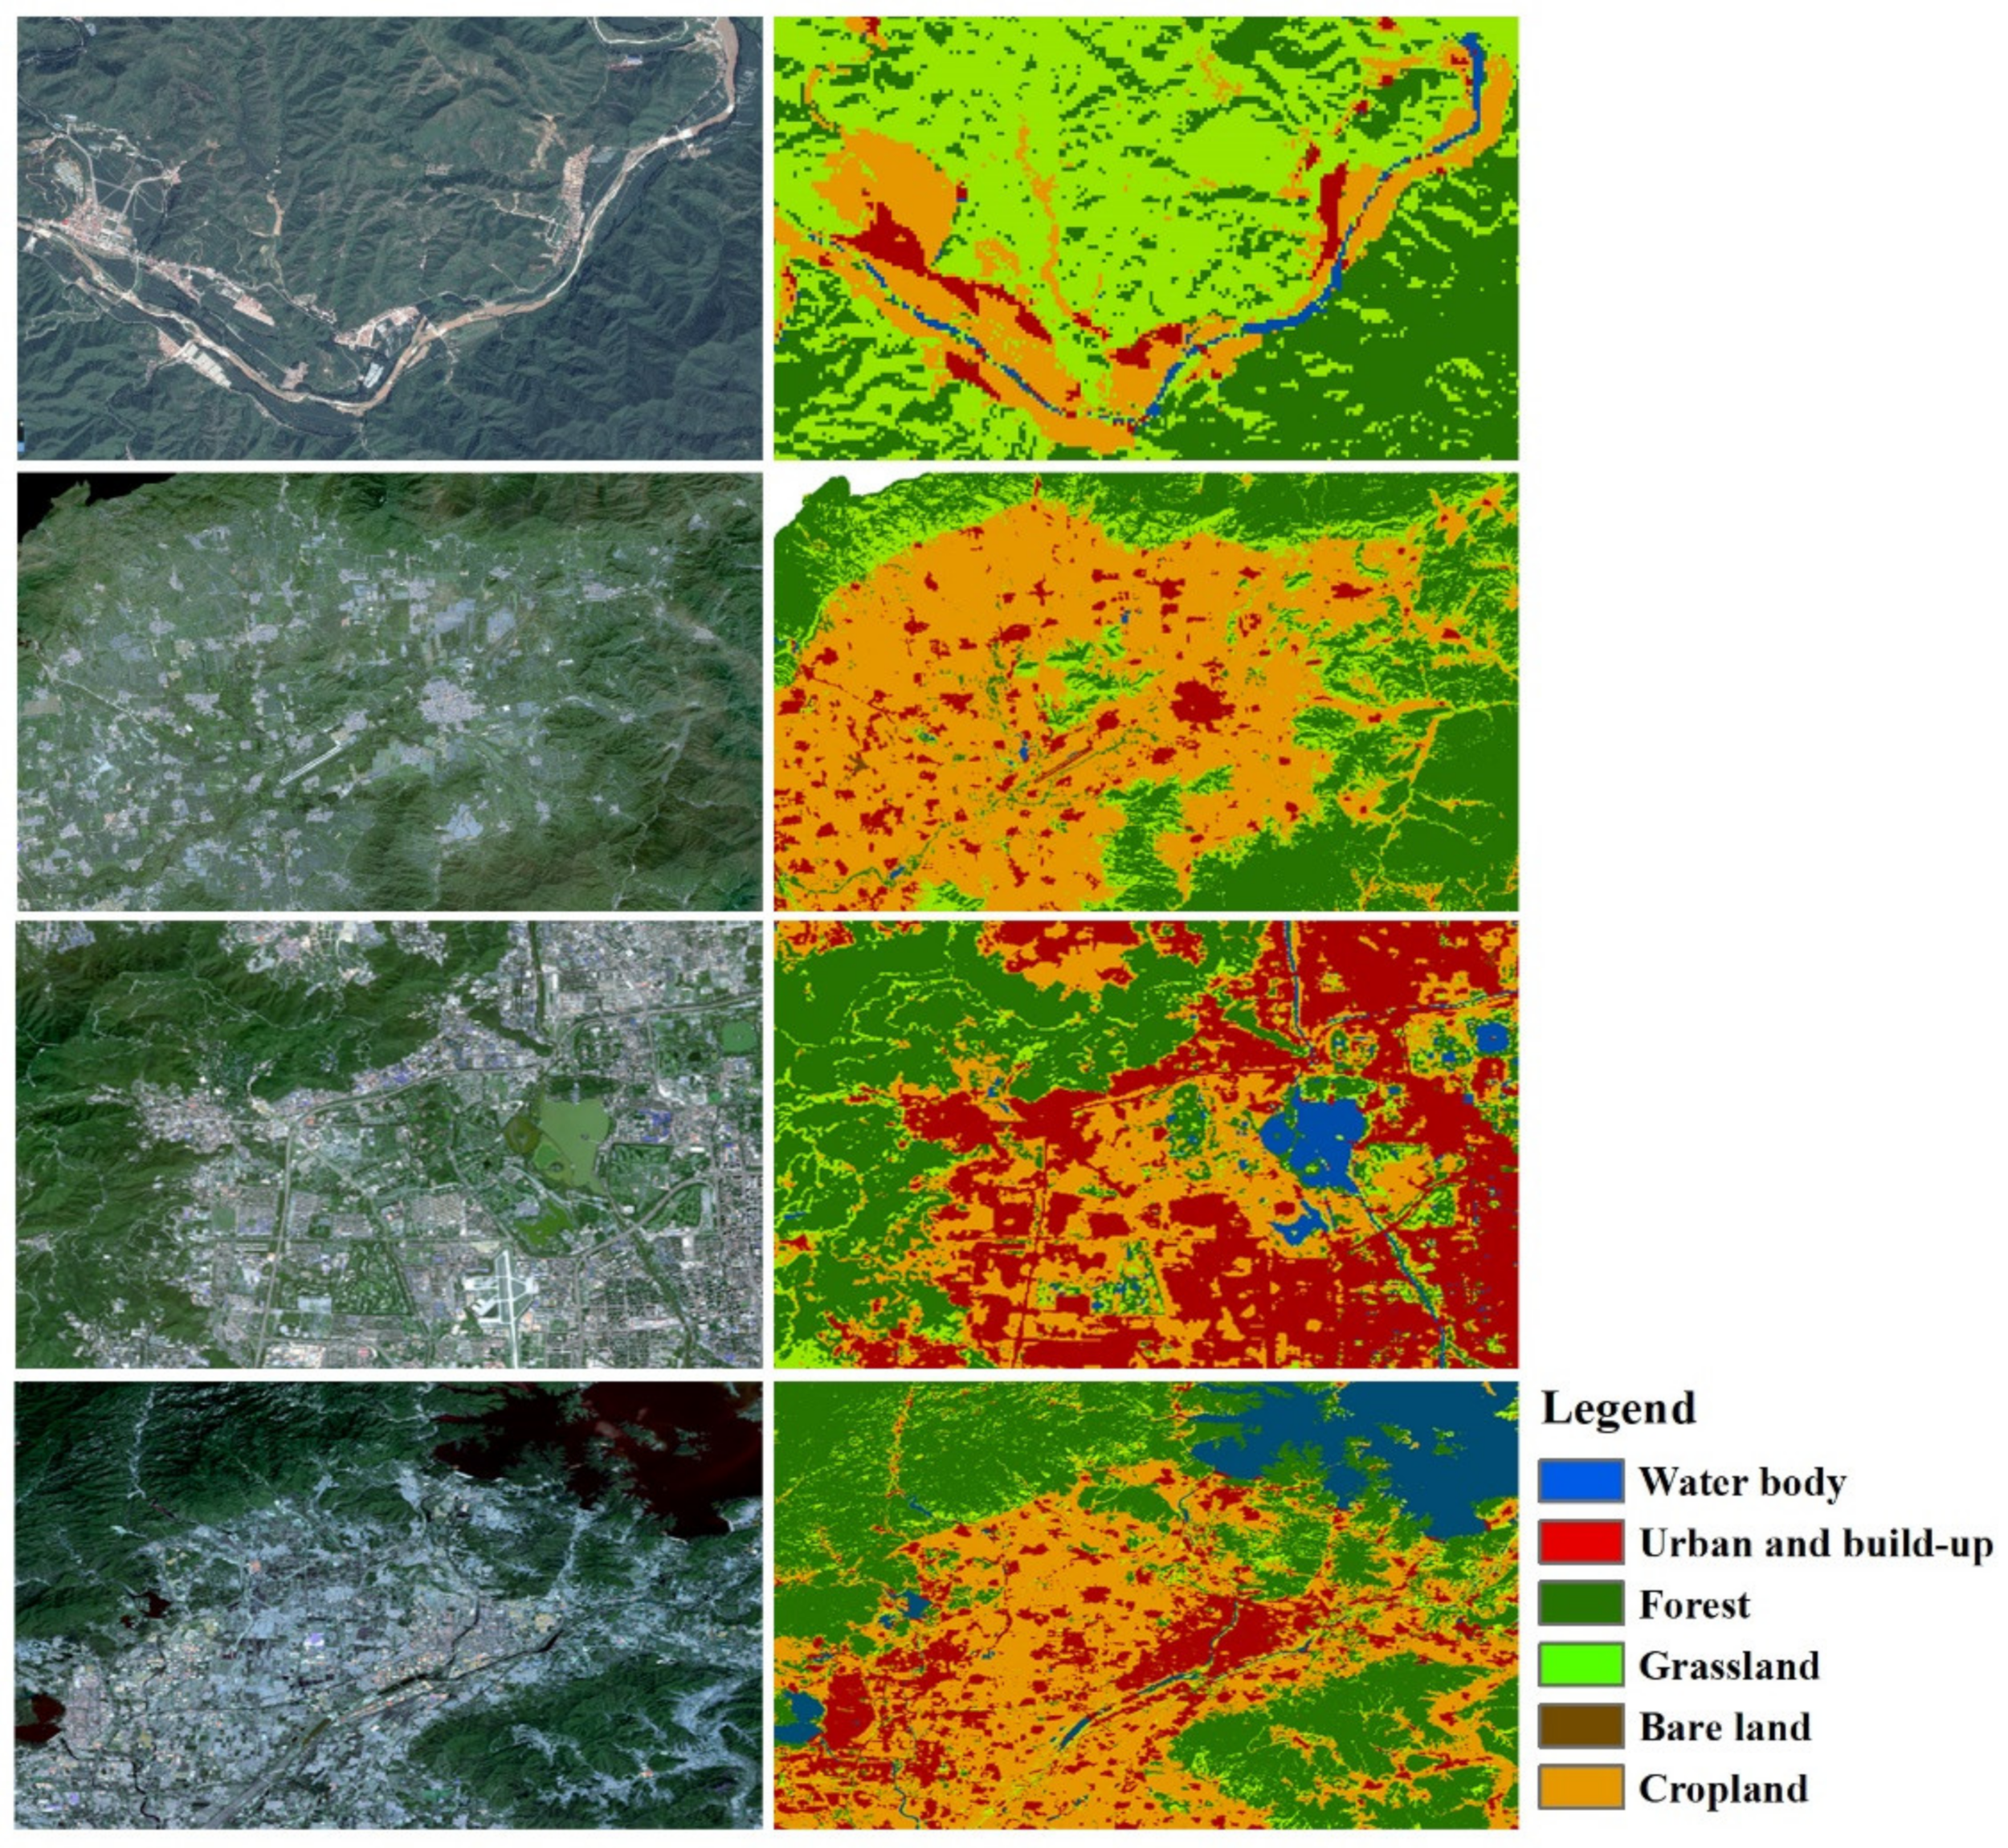
Furthermore, the ARD could be used to produce many quantitative remote sensing products, such as vegetation index (NDVI), leaf area index (LAI), vegetation coverage (FVC), net primary productivity (NPP), land cover (LC), albedo, etc. Take the land cover classification as an example. With the monthly time series surface reflectance data, high precision land cover products can be easily obtained, even using the simplest pixel based supervised classification method. Figure 7 shows the landcover map of Beijing in 2019 by using the monthly ARD shown in Figure 6. The overall accuracy is about 91.20% and the confusion matrix is shown at Table 6. Figure 8 shows some details of the landcover map and the classification result is highly consistent with the satellite imagery.

3.7. ARD Future Revision Schedule

Although the GF1-WFV ARD are defined for GF1-WFV1~4 and are generated from level 1A of GF1-WFV data, The ARD will slowly incorporate more Chinese MHSR data including GF6-WFV, HJ1-CCD, and the coming HJ2-CCD, which make up a significant portion of the early Chinese MHSR data record acquired from 2008 to 2013 systematically by HJ1-CCD and realizes the continuity of the Chinese MHSR data by HJ2-WFV, GF6-WFV and the others. ARD processing for HJ1-CCD is challenging because the geometric and radiometric qualities of the CCD are significantly lower than the WFV sensors onboard the later satellites. In addition, the later WFV has better quality, but more bands with more recording digits require more computation capability and higher efficient processing algorithms. In particular, none of the Chinese MHSR data had shortwave infrared or thermal wavelength bands, which raises a much higher claim to the algorithms for atmospheric correction and cloud masking [27,28]. The ARD will be reprocessed while the processing algorithms are improved.

4. Discussion

Although the GF1-WFV ARD have not been put into large-scale applications, the Landsat ARD made available in 2017 has already been used for 30 m percent tree cover mapping at Washington State and crop evolution monitoring at six different ARD tiles by employing different harmonic time series models of five years’ Landsat ARD data [29]. As expected, the GF1-WFV ARD and the upcoming Chinese MSHR ARD will greatly expand the existing ARD and more data will definitely increase the observations, which will greatly improve the analysis. The GF1-WFV ARD and the upcoming Chinese MSHR ARD can also be used as inputs to produce more land biophysical and geophysical products similar to those from the MODIS and Landsat ARD, which have greatly supported the research and application of global change [30]. Furthermore, the Chinese MSHR ARD have a medium to high resolution, which are much higher than that of the MODIS and more detailed discoveries will be expected.
Similar to the MODIS surface reflectance and land products, the Chinese MSHR ARD will be reprocessed while the processing techniques are improved to reflect the capabilities on better radiometric calibration and georegistration. In addition, with the rapid development of computing capability and its largely reduced cost, more sophisticated processing algorithms will be developed for better processing accuracy with even much lower time cost. Since there are only limited data receiving stations, only the data covering China and its surrounding areas have been acquired and the total acquisitions sensed by GF1-WFV are 137,120; however, with the receiving station near the North Pole being put to work, hundreds of times more data will be accumulated in the coming years. At that time, more efficient algorithms and more computing capabilities will be in demand to make global ARD production available by using Chinese satellite data.
In order to improve the interoperability of the rapidly increasing volumes of moderate resolution optical imagery (http://ceos.org/ard/, accessed on 25 April 2021) from different space agencies, the ARD for different moderate spatial resolution data are greatly encouraged by the CEOS ARD for Land (CARD4L) working group. Under this background, the successful release of the Landsat ARD marked the very important first step. The GF1-WFV ARD have made a further step at this direction. Furthermore, research on interoperability and seamless sensor combination for moderate spatial resolution data, such as Landsat, Sentinel 2, and the Chinese data is underway [31,32,33,34]. These actions on ARD will provide users with more easy-to-use data and more chances for scientific discoveries. However, the difficulties are also obvious concerning algorithms, computing capabilities, combining the use of different ARDs, etc.

5. Conclusions

Although the level 1A GF1-WFV data have been freely released to the public by CRESDA since 2013, the practical uses of the data have been much less than Landsat and Sentinel 2 data, and the major barrier has been the pre-processing of the data. The GF1-WFV ARD provides a consistent set of TOA reflectance and surface reflectance with per pixel quality assessment and metadata for tracing back. Therefore, not only users with data pre-processing expertise but also other users who are not good at pre-processing can carry out scientific analysis and applications at large area and with long time series without worrying about the costs of either computation or time by skipping GF1-WFV data preprocessing, such as geometric registration and atmospheric correction. Furthermore, as more GF1-WFV ARD are put into practice, the discrepancy induced by data pre-processing will be reduced. The GF1-WFV ARD is a significant project in the history of Chinese satellite data, and capable to making scientific discoveries through long-time series analysis, whether at a national or a global scale, which will definitely make global users aware of the usefulness of Chinese satellite data.

Author Contributions

Conceptualization, B.Z. and Q.L.; methodology, B.Z. and A.Y.; software, B.Z., A.Y., S.W., X.S., X.M. and L.H.; validation, B.Z., A.Y., S.W. and J.W.; writing—original draft, B.Z.; writing—review and editing, A.Y., Q.L., S.W., X.S. and X.M. All authors have read and agreed to the published version of the manuscript.

Funding

This research was funded by National Key R&D Program of China grant number 2018YFA0605500 and 2017YFA0603000.

Acknowledgments

The GaoFen imagery used in this research is supported by the China Centre for Resources Satellite Data and Application (http://www.cresda.com, accessed on 25 April 2021). The Landsat data were downloaded from the USGS website (http://landsat.usgs.gov, accessed on 25 April 2021). The Sentinel2 MSI data were downloaded from the ESA website (https://earth.esa.int, accessed on 25 April 2021). The authors sincerely thank the reviewers who provided helpful comments to the manuscript.

Conflicts of Interest

The authors declare no conflict of interest.

References

  1. Woodcock, C.E.; Allen, R.; Anderson, M.; Belward, A.; Bindschadler, R.; Cohen, W.; Gao, F.; Goward, S.N.; Helder, D.; Helmer, E.; et al. Free access to Landsat imagery. Science 2008, 320, 1011. [Google Scholar] [CrossRef] [PubMed]
  2. Wulder, M.A.; White, J.C.; Loveland, T.R.; Woodcock, C.E.; Roy, D.P. The global Landsat archive: Status, consolidation, and direction. Remote Sens. Environ. 2016, 185, 271–283. [Google Scholar] [CrossRef] [Green Version]
  3. Roy, D.P.; Ju, J.; Kline, K.; Scaramuzza, P.L.; Kovalskyy, V.; Hansen, M.; Loveland, T.R.; Vermote, E.; Zhang, C. Web-enabled Landsat data (weld): Landsat etm+ composited mosaics of the conterminous united states. Remote Sens. Environ. 2009, 114, 35–49. [Google Scholar] [CrossRef]
  4. Roy, D.P.; Wulder, M.; Loveland, T.R.; Woodcock, C.; Allen, R.; Anderson, M.; Helder, D.; Irons, J.; Johnson, D.; Kennedy, R.; et al. Landsat-8: Science and product vision for terrestrial global change research. Remote Sens. Environ. 2014, 145, 154–172. [Google Scholar] [CrossRef] [Green Version]
  5. Lewis, A.; Oliver, S.; Lymburner, L.; Evans, B.; Wyborn, L.; Mueller, N.; Raevksi, G.; Hooke, J.; Woodcock, R.; Sixsmith, J.; et al. The Australian geoscience data cube—Foundations and lessons learned. Remote Sens. Environ. 2017, 202, 276–292. [Google Scholar] [CrossRef]
  6. Wulder, M.A.; Coops, N.C.; Roy, D.P.; White, J.C.; Hermosilla, T. Land cover 2.0. Int. J. Remote Sens. 2018, 39, 4254–4284. [Google Scholar] [CrossRef] [Green Version]
  7. Dwyer, J.L.; Roy, D.P.; Sauer, B.; Jenkerson, C.B.; Lymburner, L. Analysis ready data: Enabling analysis of the Landsat archive. Remote Sens. 2018, 10, 1363. [Google Scholar]
  8. Townshend, J.R.G.; Justice, C.O. The impact of misregistration on change detection. IEEE Trans. Geosci. Remote Sens. 1992, 30, 1054–1060. [Google Scholar] [CrossRef] [Green Version]
  9. Chander, G.; Helder, D.L.; Aaron, D.; Mishra, N.; Shrestha, A.K. Assessment of spectral, misregistration, and spatial uncertainties inherent in the cross-calibration study. IEEE Trans. Geosci. Remote Sens. 2013, 51, 1282–1296. [Google Scholar] [CrossRef]
  10. Yang, A.; Zhong, B.; Wu, S.; Liu, Q. Evaluation on radiometric capability of Chinese optical satellite sensors. Sensors 2017, 17, 204. [Google Scholar] [CrossRef] [Green Version]
  11. Shan, X.; Tang, P.; Hu, C. An automatic geometric precision correction system based on hierarchical registration for HJ-1 A/B CCD images. Int. J. Remote Sens. 2014, 35, 7154–7178. [Google Scholar] [CrossRef]
  12. Guenther, B.; Xiong, X.; Salomonson, V.V.; Barnes, W.L.; Young, J. On-orbit performance of the earth observing system moderate resolution imaging spectroradiometer; first year of data. Remote Sens. Environ. 2002, 83, 16–30. [Google Scholar] [CrossRef]
  13. Zhong, B.; Zhang, Y.; Du, T.; Yang, A.; Lv, W.; Liu, Q. Cross-calibration of HJ-1/CCD over a desert site using Landsat ETM+ imagery and ASTER GDEM product. IEEE Trans. Geosci. Remote Sens. 2014, 52, 7247–7263. [Google Scholar] [CrossRef]
  14. Yang, A.; Zhong, B.; Lv, W.; Wu, S.; Liu, Q. Cross-calibration of GF-1/WFV over a desert site using Landsat-8/OLI imagery and ZY-3/TLC data. Remote Sens. 2015, 7, 10763–10787. [Google Scholar] [CrossRef] [Green Version]
  15. Yang, A.; Zhong, B.; Wu, S.; Liu, Q. Radiometric Cross-Calibration of GF-4 in Multispectral Bands. Remote Sens. 2017, 9, 232. [Google Scholar] [CrossRef] [Green Version]
  16. Yang, A.; Zhong, B.; Hu, L.; Wu, S.; Xu, Z.; Wu, H.; Wu, J.; Gong, X.; Wang, H.; Liu, Q. Radiometric cross-calibration of the wide field view camera onboard gaofen-6 in multispectral bands. Remote Sens. 2020, 12, 1037. [Google Scholar] [CrossRef] [Green Version]
  17. Kaufman, Y.J.; Tanre, D.; Remer, L.A.; Vermote, E.F.; Chu, A.; Holben, B.N. Operational remote sensing of tropospheric aerosol over land EOS moderate resolution imaging spectroradiometer. J. Geophys. Res 1997, 102, 17051–17067. [Google Scholar] [CrossRef]
  18. Remer, L.A.; Kaufman, Y.J.; Tanré, D.; Mattoo, S.; Chu, D.A.; Martins, J.V.; Li, R.-R.; Ichoku, C.; Levy, R.C.; Kleidman, R.G.; et al. The MODIS aerosol algorithm, products, and validation. J. Atmos. Sci. 2005, 62, 947–973. [Google Scholar] [CrossRef] [Green Version]
  19. Masek, J.G.; Vermote, E.F.; Saleous, N.E.; Wolfe, R.; Hall, F.G.; Huemmrich, K.F.; Gao, F.; Kutler, J.; Lim, T.-K. A Landsat surface reflectance dataset for North America, 1990–2000. IEEE Geosci. Remote Sens. Lett. 2006, 3, 68–72. [Google Scholar] [CrossRef]
  20. Ju, J.; Roy, D.P.; Vermote, E.; As Ek, J.M.; Kovalskyy, V. Continental-scale validation of modis-based and ledaps Landsat ETM+ atmospheric correction methods. Remote Sens. Environ. 2012, 122, 175–184. [Google Scholar] [CrossRef] [Green Version]
  21. Zhong, B.; Wu, S.; Yang, A.; Liu, Q. An improved aerosol optical depth retrieval algorithm for moderate to high spatial resolution optical remotely sensed imagery. Remote Sens. 2017, 9, 555. [Google Scholar] [CrossRef] [Green Version]
  22. Dubovik, O.; Holben, B.N.; Eck, T.; Smirnov, A.; Slutsker, I. Variability of absorption and optical properties of key aerosol types observed in worldwide locations. J. Atmos. 2002, 59, 590–608. [Google Scholar] [CrossRef]
  23. Claverie, M.; Vermote, E.F.; Franch, B.; Masek, J.G. Evaluation of the Landsat-5 tm and Landsat-7 ETM+ surface reflectance products. Remote Sens. Environ. 2015, 169, 390–403. [Google Scholar] [CrossRef]
  24. Lutz, B.; Roy, D.P.; Leff, C.; Lewicki, S.; Chu, A. A review of EOS Terra quality assessment. IEEE Int. Geosci. Remote Sens. Symp. 2000, 5, 2092–2095. [Google Scholar]
  25. Roy, D.P.; Borak, J.S.; Devadiga, S.; Wolfe, R.E.; Min, Z.; Descloitres, J. The modis land product quality assessment approach. Remote Sens. Environ. 2000, 83, 62–76. [Google Scholar] [CrossRef]
  26. Bo, Z.; Chen, W.; Wu, S.; Hu, L.; Luo, X.; Liu, Q. A cloud detection method based on relationship between objects of cloud and cloud-shadow for chinese moderate to high resolution satellite imagery. IEEE J. Sel. Top. Appl. Earth Obs. Remote Sens. 2017, 10, 4898–4908. [Google Scholar]
  27. Forster, B.C. Derivation of atmospheric correction procedures for Landsat MSS with particular reference to urban data. Int. J. Remote Sens. 1984, 5, 799–817. [Google Scholar] [CrossRef]
  28. Braaten, J.D.; Cohen, W.B.; Yang, Z. Automated cloud and cloud shadow identification in Landsat MSS imagery for temperate ecosystems. Remote Sens. Environ. 2015, 169, 128–138. [Google Scholar] [CrossRef] [Green Version]
  29. Roy, D.P.; Yan, L. Robust Landsat-based crop time series modelling. Remote Sens. Environ. 2018, 238, 110810. [Google Scholar] [CrossRef]
  30. Justice, C.O.; Vermote, E.; Townshend, J.; Defries, R.; Roy, D.P.; Hall, D.K.; Salomonson, V.V.; Privette, J.L.; Riggs, G.; Strahler, A.; et al. The moderate resolution imaging spectroradiometer (modis): Land remote sensing for global change research. IEEE Trans. Geosci. Remote Sens. 1998, 36, 1228–1249. [Google Scholar] [CrossRef] [Green Version]
  31. Storey, J.; Roy, D.P.; Masek, J.; Gascon, F.; Dwyer, J.; Choate, M. A note on the temporary misregistration of Landsat-8 operational land imager (OLI) and Sentinel-2 multi spectral instrument (MSI) imagery. Remote Sens. Environ. 2016, 186, 121–122. [Google Scholar] [CrossRef] [Green Version]
  32. Zhang, H.K.; Roy, D.P.; Yan, L.; Li, Z.; Huang, H.; Vermote, E.; Skakun, S.; Roger, J.-C. Characterization of Sentinel-2a and Landsat-8 top of atmosphere, surface, and nadir BRDF adjusted reflectance and NDVI differences. Remote Sens. Environ. 2018, 215, 482–494. [Google Scholar] [CrossRef]
  33. Claverie, M.; Ju, J.; Masek, J.G.; Dungan, J.L.; Vermote, E.F.; Roger, J.-C.; Skakun, S.V.; Justice, C. The harmonized Landsat and Sentinel-2 surface reflectance data set. Remote Sens. Environ. 2018, 219, 145–161. [Google Scholar] [CrossRef]
  34. Lafrance, B. Observations and Recommendations for the Calibration of Landsat 8 OLI and Sentinel 2 MSI for Improved Data Interoperability. Remote Sens. 2019, 10, 1340. [Google Scholar]
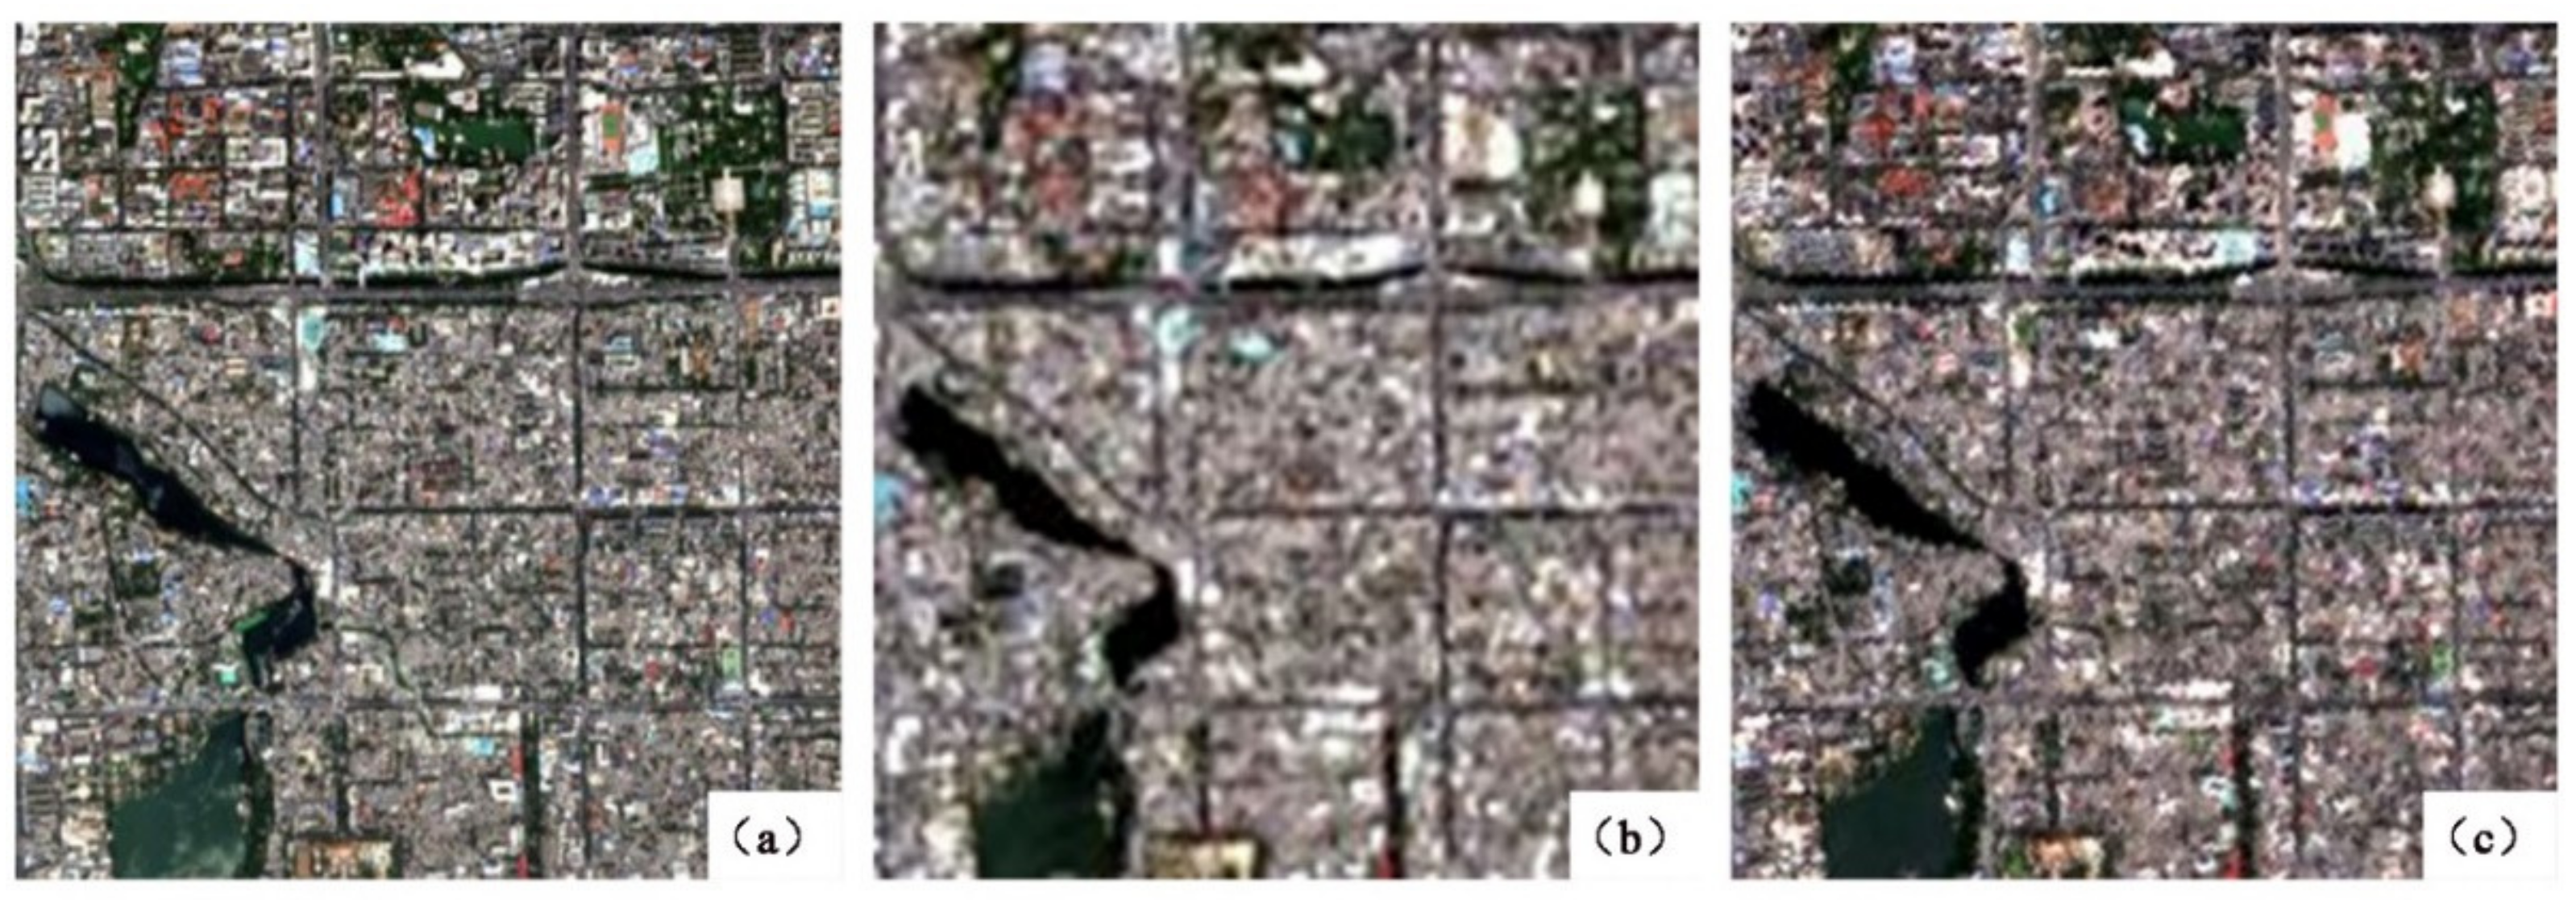
Figure 1. The true color composites are from Sentinel2A-MSI (a), Landsat8-OLI (b), and GF1-WFV (c), respectively before geometric normalization. The central location of these images is 116.39°E, 39.94°N.
Remotesensing 13 01709 g001
Figure 2. The illustration of the major idea of the proposed framework for the Chinese data processing.
Remotesensing 13 01709 g002
Figure 3. Horizontal and vertical ARD tile coordinate maps of GF1-WFV in China and its surrounding areas, each tile covers an area of 100 × 100 km and is composed of 6863 × 6863 16 m pixels. (a) Tiles in China. (b) Details of tiles cover the blue box area in (a).
Remotesensing 13 01709 g003
Figure 4. The structure of a typical GF1-WFV ARD HDF file.
Remotesensing 13 01709 g004
Figure 5. The bimonthly 16 m surface reflectance mosaics in the most of China in 2019 composited from the GF1-WFV ARD. (af) are January–February, March–April, May–June, July–August, September–October, and November–December, respectively.
Remotesensing 13 01709 g005
Figure 6. The monthly surface reflectance mosaics in 2019 of Beijing at a closer view from the GF1-WFV ARD.
Remotesensing 13 01709 g006
Figure 7. An application example of ARD: land cover classification result.
Remotesensing 13 01709 g007
Figure 8. Details of Beijing land cover product produced using ARD (left: satellite image; right: land cover result).
Remotesensing 13 01709 g008
Table 1. Major Chinese satellite/sensor similar to Landsat/TM.
Sensor(s)Platform(s)Spatial ResolutionSwathSpectraLaunching Year
2 CCDsHJ1/A30m700km (2 cams)VIS, NIR2008
2 CCDsHJ1/B30m700km (2 cams)VIS, NIR2008
4 WFVsGF116m800km (4 cams)VIS, NIR2013
1 WFVGF616m800kmDB, VIS, NIR, Red edge2018
1 WFVHJ2/A16m800kmDB, VIS, NIR, Red edge2020
1 WFVHJ2/B16m800kmDB, VIS, NIR, Red edge2020
Table 2. The geolocation offset in pixel compared to Landsat-TM.
Image No12345678910
Sensor
GF1-WFV1.91.82.31.81.01.42.21.72.21.0
Sentinel2-MSI0.70.71.00.60.50.80.70.91.10.6
Table 3. ARD angular bands for GF1-WFV. INT16 means 16-bit signed integer.
Band NameData TypeUnitsValid RangeFill ValueSaturated ValueScale Factor
Solar ZenithINT 16Degree−9000~9000−32,768NA0.01
Solar AzimuthINT 16Degree−18,000~180,000−32,768NA0.01
Viewing ZenithINT 16Degree−9000~9000−32,768NA0.01
Viewing AzimuthINT 16Degree−18,000~180,000−32,768NA0.01
Table 4. ARD TOA reflectance bands for GF1-WFV and angular bands. INT16 means 16-bit signed integer.
Band NameData TypeUnitsValid RangeFill ValueSaturated ValueScale Factor
Band n TOA reflectanceINT 16--0~10,000−999920,0000.0001
Table 5. GF1-WFV ARD quality assessment bit-packing detail. Bits are numbered from right to left where bit 0 = the Least Significant Bit and bit 7 = the Most Significant Bit.
BitInterpretation
0Fill
1Clear
2, 3Aerosol opacity; 00 =low (<0.5); 01 = Medium (<1.0); 10 = High (<2.0); 11 = Very High (>=2.0)
4Cloud
5Possibly cloud
6Cloud shadow
7Possibly cloud shadow
Table 6. Confusion matrix for the land cover map of Beijing in 2019.
TypeWater BodyUrban BuildupGrasslandBare LandCropland
Water body1511101
Urban buildup15740124
Forest00475012
Grassland032221
Bare land0380630
Cropland214101484
Publisher’s Note: MDPI stays neutral with regard to jurisdictional claims in published maps and institutional affiliations.