Article

Global Analysis of Atmospheric Transmissivity Using Cloud Cover, Aridity and Flux Network Datasets

1
Center for Water Security and Environmental Sustainability and School of Engineering, The University of Newcastle, Callaghan 2308, Australia
2
Eurasia Institute of Earth Sciences, Istanbul Technical University, Maslak, Istanbul 34469, Turkey
*
Author to whom correspondence should be addressed.
Remote Sens. 2021, 13(9), 1716; https://doi.org/10.3390/rs13091716
Submission received: 24 March 2021 / Revised: 17 April 2021 / Accepted: 27 April 2021 / Published: 29 April 2021
(This article belongs to the Section Biogeosciences Remote Sensing)

Abstract

:
Atmospheric transmissivity (τ) is a critical factor in climatology, which affects surface energy balance, measured at a limited number of meteorological stations worldwide. With the limited availability of meteorological datasets in remote areas across different climatic regions, estimation of τ is becoming a challenging task for adequate hydrological, climatic, and crop modeling studies. The availability of solar radiation data is comparatively less accessible on a global scale than the temperature and precipitation datasets, which makes it necessary to develop methods to estimate τ. Most of the previous studies provided region specific datasets of τ, which usually provide local assessments. Hence, there is a necessity to give the empirical models for τ estimation on a global scale that can be easily assessed. This study presents the analysis of the τ relationship with varying geographic features and climatic factors like latitude, aridity index, cloud cover, precipitation, temperature, diurnal temperature range, and elevation. In addition to these factors, the applicability of these relationships was evaluated for different climate types. Thus, empirical models have been proposed for each climate type to estimate τ by using the most effective factors such as cloud cover and aridity index. The cloud cover is an important yet often overlooked factor that can be used to determine the global atmospheric transmissivity. The empirical relationship and statistical indicator provided the best performance in equatorial climates as the coefficient of determination (r2) was 0.88 relatively higher than the warm temperate (r2 = 0.74) and arid regions (r2 = 0.46). According to the results, it is believed that the analysis presented in this work is applicable for estimating the τ in different ecosystems across the globe.

Graphical Abstract

1. Introduction

Atmospheric transmissivity (τ) influences the surface energy balance by determining the fraction of incoming solar radiation reaching the surface to the one at the top of the atmosphere [1,2]. Temporal distribution of incoming solar radiation and its magnitude are significant inputs to many modeling studies due to their roles in ecological and physical processes. Therefore, complete and accurate representation of τ is crucial for modeling studies related to climate, hydrology, ecology, carbon balances, and agronomy [3,4,5,6,7]. The growing demand of τ in modeling studies creates a need to develop empirical relationships with different meteorological factors. These empirical relationships can be used in parsimonious models under different climatic conditions.
Given the importance of τ for modeling studies, the measurement of τ is relatively scarce because of the cost, maintenance, and calibration requirements of the instruments used for measuring solar radiation [8]. In the absence of measured global radiation, empirical equations were developed to estimate global solar radiation from other climate variables, which are typically measured at the meteorological stations [2,9,10,11,12]. There are several rigorous models that can be categorized into four categories: empirical, parametrization, look-up table, and machine learning models [13]. Empirical models have been utilized in previous studies that have proposed temperature-driven, sunshine driven, and cloud driven models. For instance, Quej et al. [14] utilized precipitation and relative humidity for the estimation of solar radiation in Mexico. In other efforts carried out by Zhao et al. [15], they developed a complex model using sunshine hours and air pollution index. Kirmani et al. [16] used wind speed and precipitation data for the estimation of monthly solar radiation in India. Various other models based on regression and artificial neural networks have been developed for the estimation of average global solar radiation [17,18,19]. However, these methods are mostly regionally restricted, and the global-scale comparison of factors affecting τ remains unclear in the literature.
Previous studies have shown that τ depends on atmospheric conditions such as cloud amount, cloud optical thickness, the optical path length of the atmosphere, atmospheric absorption characteristics, scattering, water vapor, aerosol, sunshine duration, mean annual precipitation (MAP), mean annual temperature (MAT), and diurnal temperature range (DTR), and a geographic feature of location (i.e., elevation) [2,10,11,20,21]. The aerosol content of the atmosphere has a direct effect on atmospheric transmissivity by modifying the solar radiation and infrared radiation in the earth–atmosphere coupled system [22,23]. Indirectly, aerosol affects the precipitation production processes by influencing the concentration of cloud condensation nuclei, radiative properties, cloud lifetimes, and by modifying cloud physical processes [24,25,26,27]. Cloud feedback occurs because clouds both reflect solar radiation, causing cooling, and trap outgoing long-wave radiation, causing warming. Depending on the height, location, and the type of clouds with their related optical properties, changes in cloud amount can cause either warming or cooling. Therefore, we selected cloud cover as an important factor to study its relationship with τ. Most of the previous studies focused their interest on a limited number of factors [2,20,21] that are generally site specific. Among all the factors affecting τ, the largest part of the uncertainty to estimate the incoming solar radiation comes from the cloud factor [28]. However, the importance of cloud cover and its possible effects on τ have not been thoroughly investigated on a global scale.
Cloud cover affects τ due to its control on the amount of incoming solar radiation and sunshine duration [29,30,31,32]. Moreover, cloud coverage also affects the thermal regime of the surface and can be linked with DTR, which can be further correlated with τ [33,34,35]. In addition to regulating the amount of global radiation and exposure time, cloudiness determines the partitioning of global radiation into the direct and diffuse components, a discrimination that is essential for ecosystem productivity in vegetation modeling [36,37]. Cloudiness affects the type and the quantity of solar radiation that falls on the surface, and its observation in the past was mostly limited by human eyesight and mainly based on its effects over land. The cloud measurements can be done by the reanalysis products such as Modern-Era Retrospective Analysis for Research and Applications (MERRA; [38]), the ECMWF’s Fifth generation Reanalysis (ERA5; [39]), Japanese 55-year Reanalysis (JRA-55; [40]), and the China Meteorological Administration Reanalysis data (CRA; [41]), which are widely used and compared in weather and climate studies. Nowadays, the cloud cover can be detected routinely on a global scale by meteorological satellites.
The use of satellite measurements for estimating solar radiation, cloud cover, and other meteorological and surface energy budget components is becoming increasingly common [13,42,43,44,45]. With the successful launch of the new generation satellite measurements and reanalysis products such as Moderate Resolution Imaging Spectro-radiometer (MODIS; [46]), Advanced Very High Resolution Radiometer (AVHRR; [47]), AVHRR Pathfinder Atmospheres-Extended (PATMOS-x) dataset [48], Visible Infrared Solar-infrared Split-window Technique (VISST; Minnis et al. [49]), Global Energy and Water Cycle Experiment (GEWEX; [50]), National Oceanic and Atmospheric Administration (NOAA) High Resolution Infrared Radiometer Sounder (HIRS; [51]), and Gridded Satellite (GridSAT; [52]), technological advancement in remote sensing offers new opportunities for modelers to relate cloudiness to τ globally with applications in the field of energy, water resources, and agriculture. In addition, three more advantages outweigh the use of remotely sensed cloud cover over other affecting factors. First, it is freely accessible. Second, its spatial coverage of data collection enables its use in many parts of the world. Third, this dataset can be updated over time based on the availability of new high resolution spatial-temporal data.
Previous studies in various ecosystems have estimated τ on a regional basis [2,11,53,54,55,56]; however, there is no consensus in the literature that shows any relationship between τ with geographic, physical, and climatic factors globally. On a global scale, the availability of solar radiation data from meteorological stations is more restricted than for temperature and precipitation, which makes it necessary to develop methods to estimate τ based on more readily available data such as cloud climatologies and AI [46,57]. It is necessary to develop a precise τ model that uses geographical location, climatic characteristics, and underlying factors that influence τ. In light of the above facts, the current alternative is to analyze and establish the relationship of τ with various climatic factors and geographic features affecting it and help to model its effects on Earth’s energy balance. These results can be utilized to optimize the location of photovoltaic or solar thermal plants as well as enhance agricultural productivity [2].
In this study, we utilized cloud cover data to establish a global-scale relationship with τ. Based on the data availability, we considered other climatic factors like MAP, MAT, and DTR, along with the geographic features such as latitude and elevation. In addition, aridity index (AI) (i.e., the ratio of mean annual precipitation to mean annual potential evapotranspiration) [57] is used as climate proxy data in this study since it has been neglected in previous studies. This index has been widely used for evaluating the trends of aridity for different ecosystems [58,59]. We show that the climate proxy and remote sensing-based derived τ relationships can improve predictions of energy fluxes in the ecosystem as well as τ distributions with reduced spatial uncertainty compared to commonly used single site-specific values. Applications of these new empirical relationships extend beyond the site-specific relationships to the validation of hydrological models and applications in solar energy. It is worth mentioning that in order to avoid the complexity in the individual factors utilized and to make it computationally efficient, the effects of aerosol and cloud properties are not considered in this study.

2. Data and Methods

We used global datasets and flux networks to quantify the roles of each factor affecting τ. These roles were also investigated in various climatic zones. We first describe the sources from where the datasets were procured, and then we explain the pre-processing of data.

2.1. Data Source

Three freely available global datasets and one global climatic classification were used to analyze the relationship of transmissivity with cloud cover, aridity index, and climate. First, the Ameriflux, Fluxnet, and Ozflux data of 313 different flux stations were used for transmissivity analysis [60] to obtain the factors of interest like geographic location, elevation, air temperature, DTR, precipitation, incoming shortwave radiation, and shortwave radiation at the top of the atmosphere. The datasets from the three networks occupied the entire world, mostly over the Northern Hemisphere (NH), but also with good coverage in the Southern Hemisphere (SH). Ameriflux comprises sites from North America, Central America, and South America; Fluxnet comprises sites from Europe, Africa, and Asia; and Ozflux comprises locations from Australia and New Zealand. As the data density (number of sites) is higher in the Northern Hemisphere, the analysis may be biased toward that part of the globe.
Second, the global cloud cover data were acquired from the Moderate Resolution Imaging Spectro-radiometer (MODIS) dataset via an archive of twice-daily observations (http://www.earthenv.org/; [46] accessed on 24 September 2019). These datasets integrate 15 years of twice-daily remote sensing-derived cloud observations at 1 km resolution. They are bias-corrected and averaged by month from 2000 to 2014 and also validated using a global observational dataset of weather reports collected at 5388 stations from 1971 to 2009 [61].
The third dataset, AI, was obtained from Zomer et al. [57] at a 1 km resolution (via http://www.cgiar-csi.org/data/global-aridity-and-pet-database accessed on 10 October 2019). Köppen climatic classification [62] was used for the grouping of stations according to different climatic zones and is available via the link http://koeppengeiger.vu-wien.ac.at/ on 14 November 2019. It is important to note that 38 stations located near to the ocean (~7 km) were excluded from this analysis because of the ocean’s moderating influence on DTR due to the development of a strong temperature inversion over the coastal waters and the coastline [63].

2.2. Method

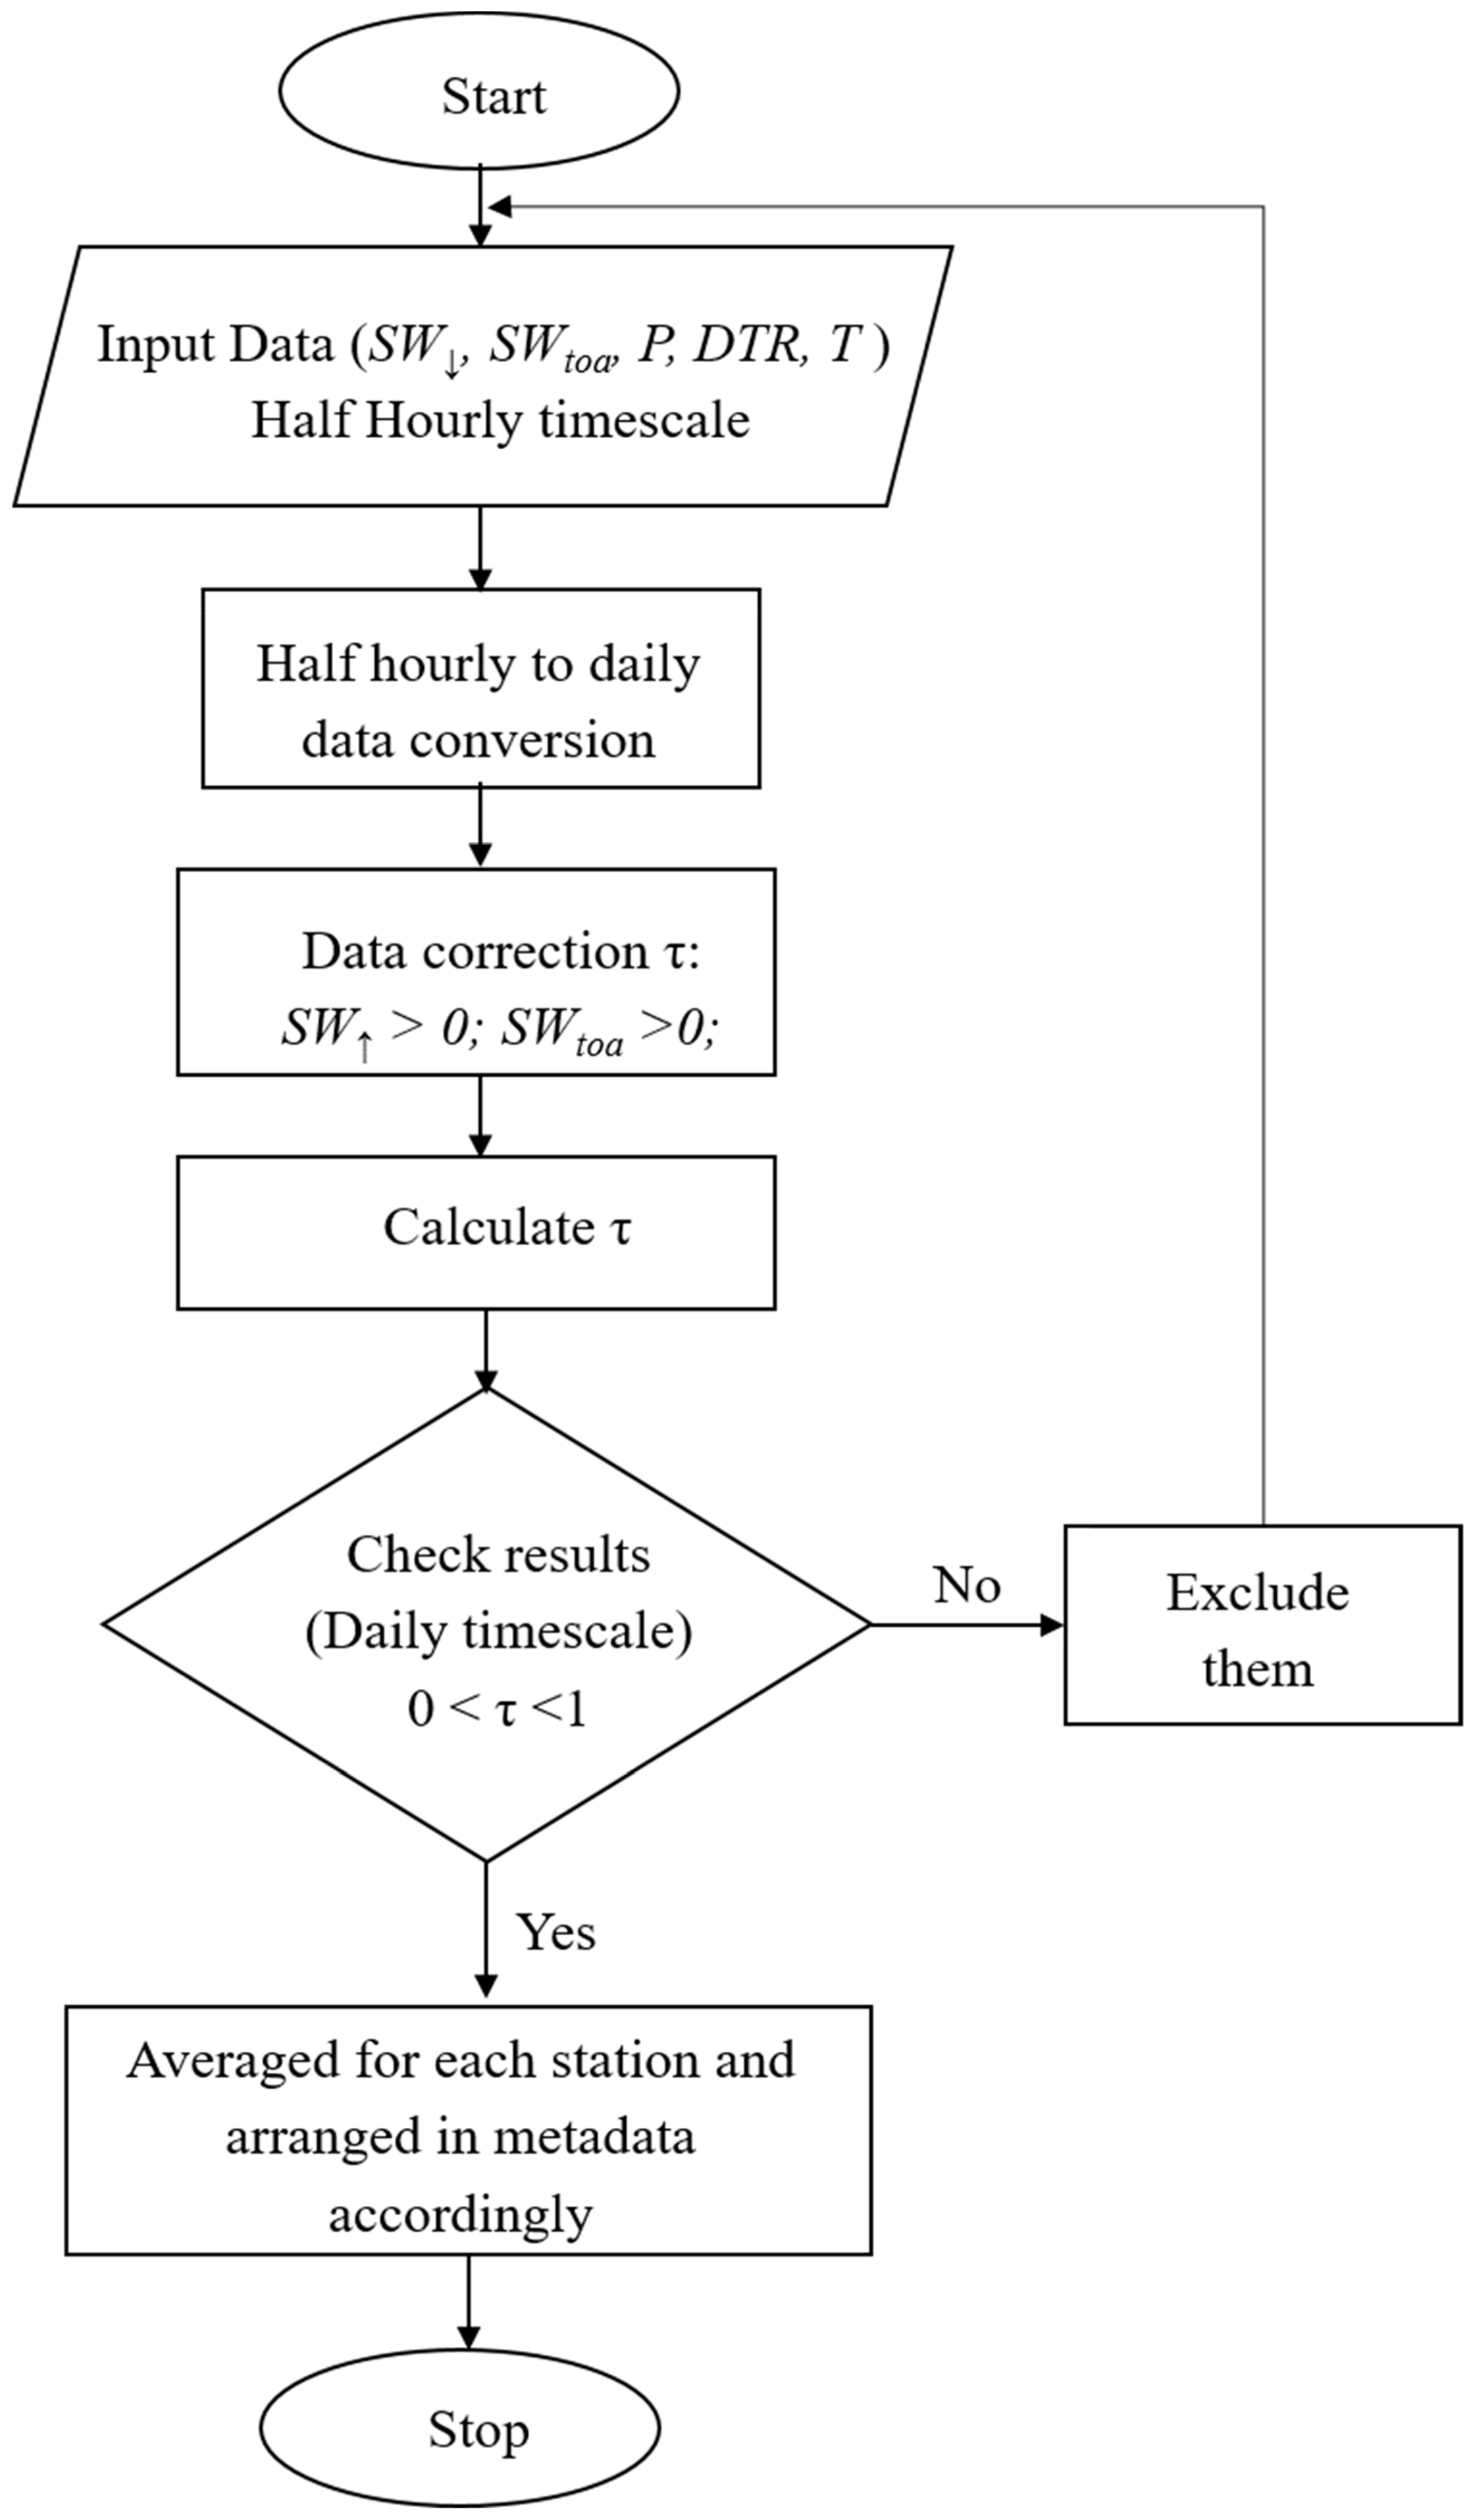
Figure 1 illustrates the 275 stations that we used in our analysis, which does not include stations close to the coastal regions (Table S1, Supplementary Materials). We pre-processed all datasets from these stations into two different zones falling under the NH and the SH to visualize the impact of τ on each factor in a clearer way. The databases give measurements in half-hourly or hourly intervals and contain raw data. The data required for the analysis of τ were extracted from the raw data using MATLAB. Figure 2 shows the detailed step-by-step procedure followed in this analysis. Initially, half-hourly data were converted into daily-basis data by taking the average for each day for all the stations considered in this study. Since Ameriflux and Ozflux stations do not provide estimated shortwave radiation at the top of the atmosphere, this value was calculated using the equations documented in Bras [64]. The latitude of the location is the only required single input for calculating the shortwave radiation at the top of the atmosphere, SWtoa:
S W t o a = 1440 π S c d E S [ ω s sin ( ϕ ) sin ( δ ) + cos ( ϕ ) cos ( δ ) sin ( ω s ) ]
where Sc is solar constant, 0.0820 MJ m−2 min−1 [65]; ϕ is the latitude in radians; and dES is the relative distance between the Earth–Sun given by Equation (2):
d E S = 1 + 0.033 cos ( 2 π 365 D O Y )
where DOY is the day of the year [66]. ω s is the sunset hour angle (Equation (3)) and δ is the declination of the Sun given by Equation (4):
ω s = arccos [ tan ( ϕ ) tan ( δ ) ]
δ = 0.409 sin ( 2 π 365 D O Y 1.39 )
Thereafter, the inconsistencies in datasets arising due to the presence of null values and negative values were removed from the daily values of shortwave radiation. The average data for each station were then generated, and the relationships of τ with the other factors were analyzed. Furthermore, after completing the data pre-processing from the three flux networks, we extracted the data of cloud cover and AI for all stations. The DTR, aridity index, temperature, cloud cover, and precipitation were then calculated for each day. The remaining data were averaged to produce daily data at each station, except in the case of precipitation, which was summed. Then, we established a correlation between τ with cloud cover and AI for the stations across the world.
We used the Köppen climate classification [62,67,68,69] to classify site locations to relate with τ. The classification criteria for the climatic types are based on annual and monthly sums of precipitation and mean annual and mean monthly temperatures (°C). The basic scheme of the climate classification consists of five major climate types, namely: A (tropical rainy climates), B (dry climates), C (warm temperate rainy climates, mild winters), D (boreal climates, severe winters), and E (polar climates). This analysis will help to establish an empirical relationship for the ecohydrological and geographical factors for different climate by using freely accessible data.

3. Results and Discussion

This section describes and discusses the results of the latitudinal patterns of τ and cloud cover; we briefly compare the role of different τ affecting factors and relationships developed with aridity and cloud cover. Furthermore, in the following subsection, τ was analyzed based on different climate classification.

3.1. Latitudinal Pattern of Transmissivity and Cloud Cover

Figure 3 shows latitudinal variations of τ and cloud cover based on the 275 locations across the world at different latitudes. We explored the variations of τ and cloud cover from the NH to the SH at different latitudes (Figure 3a,b). Analysis of all stations worldwide on a yearly basis revealed different zones of τ at various latitudes. We averaged the τ data within 5° latitude bins to more clearly show the latitudinal-variations and trends of τ with cloud cover. In the NH, τ are predominantly higher throughout the midlatitudes (20–40°N), reaching a maximum value of 0.71 at roughly 35°N latitude. These locations are of the large-scale subtropical dry zones and the major subtropical deserts, which are largely determined by the Hadley cell (HC) associated with adiabatic heating and horizontal divergence near the surface [70,71], which is one of the causes for a rise in the τ values at midlatitudes. However, there is no clear trend between latitudes 0° to 20° latitudes in both the NH and the SH. Particularly for stations that lie between the 30°N and 55°N latitudes, there is an increasing trend of τ values in the NH, which may be attributed to the increase in cloud cover over those areas, as shown in Figure 3b [46]. Similar findings at the midlatitudes were reported in the studies of Tang and Leng [72]. At these midlatitudes, higher values of transmissivity were observed due to global climatological mechanisms that correspond to arid regions (e.g., the Sahara Desert) and low cloud cover. These patterns are also consistent with the recent findings of Yao et al. [41], who showed that the reanalysis cloud cover CRA and MODIS estimates were smaller over the subtropical high-pressure zones and arid and semi-arid regions due to atmospheric circulation. Values of cloud cover in these regions are consistent with Lu et al. [70]; Siedel et al. [71]; and Trentberth [73]. Minimum values of τ were observed at the equator and the poles, which is likely to be due to the existence of significant cloud cover in these regions.
London et al. [74] documented the latitudinal distributions of the average total cloud cover, and a similar pattern was observed in this study, as shown in Figure 3b. The trend obtained in this study was also consistent with the pattern observed by Warren et al. [75]. Yao et al. [41] showed similar patterns of cloud cover by using the MODIS and CRA reanalysis products. However, a few variations were observed due to lack of observational sites at those particular latitudes, and also due to the presence of the Hadley cell. Furthermore, the impact of rain shadow on the mountain and the presence of subtropical anticyclones lead to the development of desert and wet areas at the same latitude [2,70,71,73,76]. This phenomenon occurs in both the NH and the SH, with roughly 30° latitudes (Figure 3a,b). Arid and semi-arid areas cover a big part of the Earth’s surface, which are mostly located at ~23°N and ~23°S. All these complexities indicate that the impact of cloud cover on τ is not a single factor, which controls it at similar latitudes. Hence, there exists a need to explore the role of other factors, which may induce variability in transmissivity at a similar latitude. Our understanding of links between cloud cover and transmissivity does not hold a reasonable relationship for some of the stations, which may be limited by uncertainty in the estimations (observations). This uncertainty is governed by the climatic, geographic, and physical factors that control the spatial distribution of incoming solar radiation on the Earth’s surface [2].

3.2. Transmissivity and Relationship with Other Factors

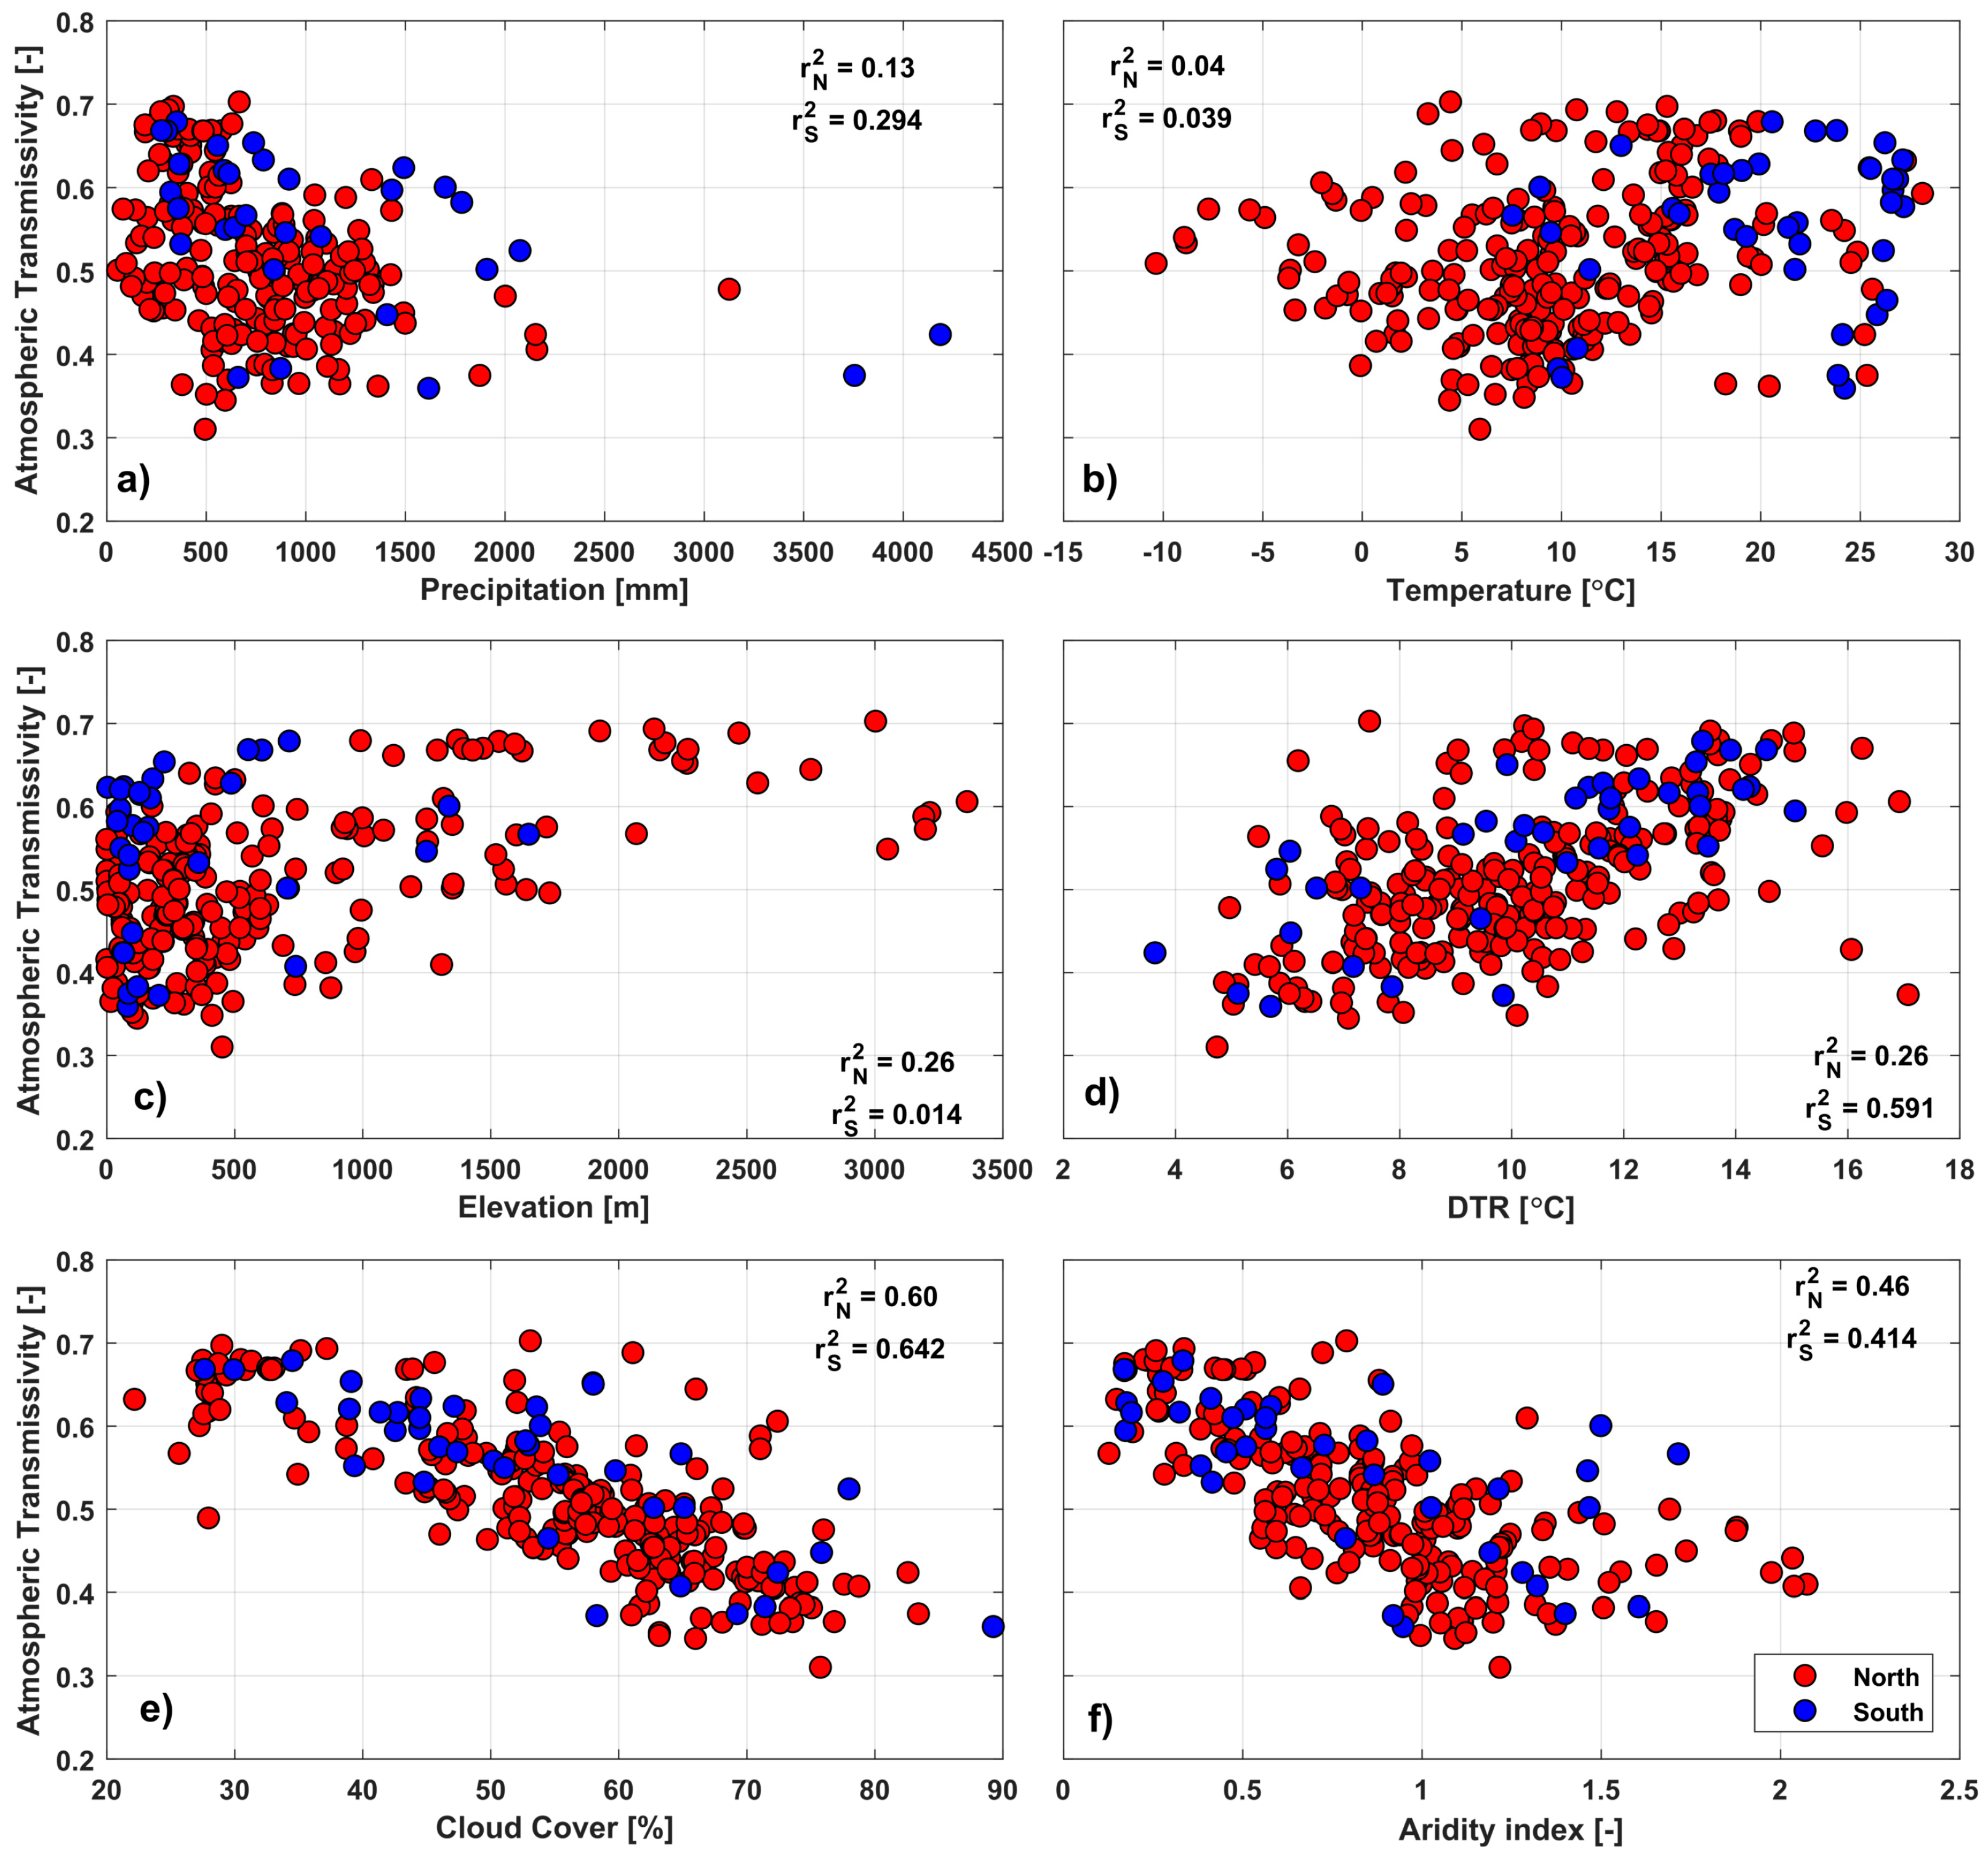
Figure 4 shows the results of different climatic, physical, and ecohydrological variables with τ. Following the latitudinal variations of cloud cover and τ, we analyzed the relationship of different factors affecting τ. Figure 4a shows the precipitation pattern (as MAP) with τ for all stations in the NH and the SH. Although precipitation generally increased with cloud cover [77], the relationship of precipitation with τ was extremely scattered in this study. This is not entirely surprising, as there are many stations where average cloudiness is high and precipitation is relatively low (e.g., Leinefelde, Germany). For instance, a similar pattern is supported with the findings of Baigorria et al. [2] for the study conducted in Peru region. Furthermore, the mean τ values are plotted as a function of temperature (Figure 4b), where τ does not exhibit any clear pattern with temperature in our findings. According to the hypothesis, higher average transmissivity leads to more incoming shortwave radiation, hence less cloud cover [33]. However, the results in this study did not replicate this hypothesis, which may be attributed to the fact that the temperature does not hold strong control over τ. Elevation determines the optical path length, so it may be one of the crucial factors that alters τ [20,21]. τ is easily expressed as a function of optical thickness, which is a measure of the extinction properties (scattering and absorption) of the light path. When the thickness of the atmospheric optical path length decreases, the path length of the incoming solar radiation decreases and thus τ increases. Figure 4c shows the relationship of τ with an elevation, which results in r2 = 0.26 for the NH. τ tends to increase with an increase in elevation, due to the difference in the optical depth [20,21,78].
Figure 4d shows the relationship of τ with DTR, which showed an increasing trend for both hemispheres and ranged between 3 °C to 17 °C. DTR was calculated as the difference between daily maximum and minimum temperatures (°C). Low DTR values corresponded to few stations with cloud cover, while high DTR values corresponded to stations with relatively clear sky conditions [79]. τ is linked with cloud cover; DTR is highest on bright days, but cloudy days will have lower temperature ranges and an increase in relative humidity. Analysis of this study is corroborated by several previous studies done at various locations using flux towers and satellite based methods [80,81,82,83]. The findings of this study are also consistent with Jin et al. [47], who showed a decreasing trend of DTR by using AVHRR measurements. Additionally, similar declining trends of DTR were observed in the Nigerian Coast region and were attributed to the decreasing cloud cover. Furthermore, Dai et al. [82] showed that 80% of the DTR variation can be explained by the cloud cover over the United States, Australia, and midlatitudes of Canada. Similar findings were observed in the Himalayan region of India [84].
Figure 4e shows the τ pattern related to cloud cover variations on a global scale for all stations in the NH and the SH. Cloud cover and τ are the two most vital environmental components that can have wide spatial variations due to difficulty in its estimation [46]. An inverse correlation was obtained between τ and cloud cover, with the highest value for transmittance of 0.71 at Valles Caldera Mixed Conifer, USA, which had a MAP of 665 mm and a cloud cover of 53%. This high value of transmission may be attributed to less pollution, high elevation (~3000 m), and less scattering (Table S1 in Supplementary Materials). On the other hand, Leinfelde, Germany showed a lesser value for τ of 0.31, corresponding to 75.75% cloud cover and MAP of 493.91 mm (Table S1). The relationship for τ and cloud cover was captured for most stations. The cloud cover was exceptionally high for the site in the Congo region (89.25%) corresponding to low τ (0.35), which is also supported with the findings of Wilson and Jetz [46]. The least cloud cover (22.17%) was observed from Demokeya, Sudan, which was obvious as it falls under a dry region with a MAP of about 280 mm that corresponded to the presence of low cloud cover [77]. The findings of this study are also supported by Stanhill et al. [85], who showed the inverse relation between τ and cloud cover using long-term observations taken at four different locations in Israel. There was a considerable difference in the extreme τ values, with a minimum of 0.25 and maximum of 0.71, as seen from the scattered plot.
Figure 4f shows the relationship of transmissivity as a function of AI for the NH and the SH separately. AI is an essential factor in determining the wetness and dryness state of an ecosystem. An inverse relation exists between τ and aridity index; τ decreases linearly with an increase in AI since regions with high AI have a higher water supply [57] and hence more cloud cover. Furthermore, cloud cover alters the radiative distribution, which reduces τ [86]. However, the τ values are higher in high aridity regions (AI is low), which relates to water stressed conditions and less cloud cover. The highest value of AI (2.08) was observed at Lackenberg (Germany), which falls in the NH with τ of 0.40 and MAP was 937 mm, whereas the lowest value of AI (0.13) was observed at Lindcove Orange Orchard (USA) with a τ of 0.56. In the SH, sites did not show a strong relationship toward high aridity regions and in order to elucidate this relationship, it would require a greater number of sites. Most of the NH sites having an AI value between zero and one have higher variability, associated with other factors. A similar trend of the aridity indices was found by the Lin et al. [87] in China in the NH and central Africa in the SH. Other studies by Feng and Fu [88] and Cook et al. [89] also showed similar patterns of aridity in western North America, Central America, the Mediterranean, and southern Africa.
After comparing all factors, two factors, cloud cover and aridity, were dominant based on the statistical indicators. These factors can be selected to establish relationships across the globe and can also be selected for different climatic zones as detailed in later sections. When selecting the best factor for global estimation, the relationship of τ with cloud cover was found to be reasonable (r2 = 0.62), [90]. Compared with cloud cover, the other factors showed a weaker correlation. The correlation for AI with r2 = 0.44 was also reasonable, followed by precipitation (r2 = 0.14) and temperature (r2 = 0.04). Precipitation can be highly variable in time and space, and some regions have abrupt changes (rain-shadows) whereas temperature generally follows relatively simple gradients of latitude and elevation, and coastal effects [63]. In general, patterns documented in this study suggest satisfactory correlation with some factors. Moreover, cloud cover and AI reflected reasonable r2 values, which suggests that these two factors can be used as a covariate in hydrological and biogeochemical models for global use. Therefore, we took the cloud cover and AI as the major factors to quantify the transmissivity relationship for all stations. Cloud cover and aridity act as a surrogate for the estimation of transmissivity as they both strongly relate to transmissivity.

3.3. Monthly Variations of Transmissivity with Cloud Cover

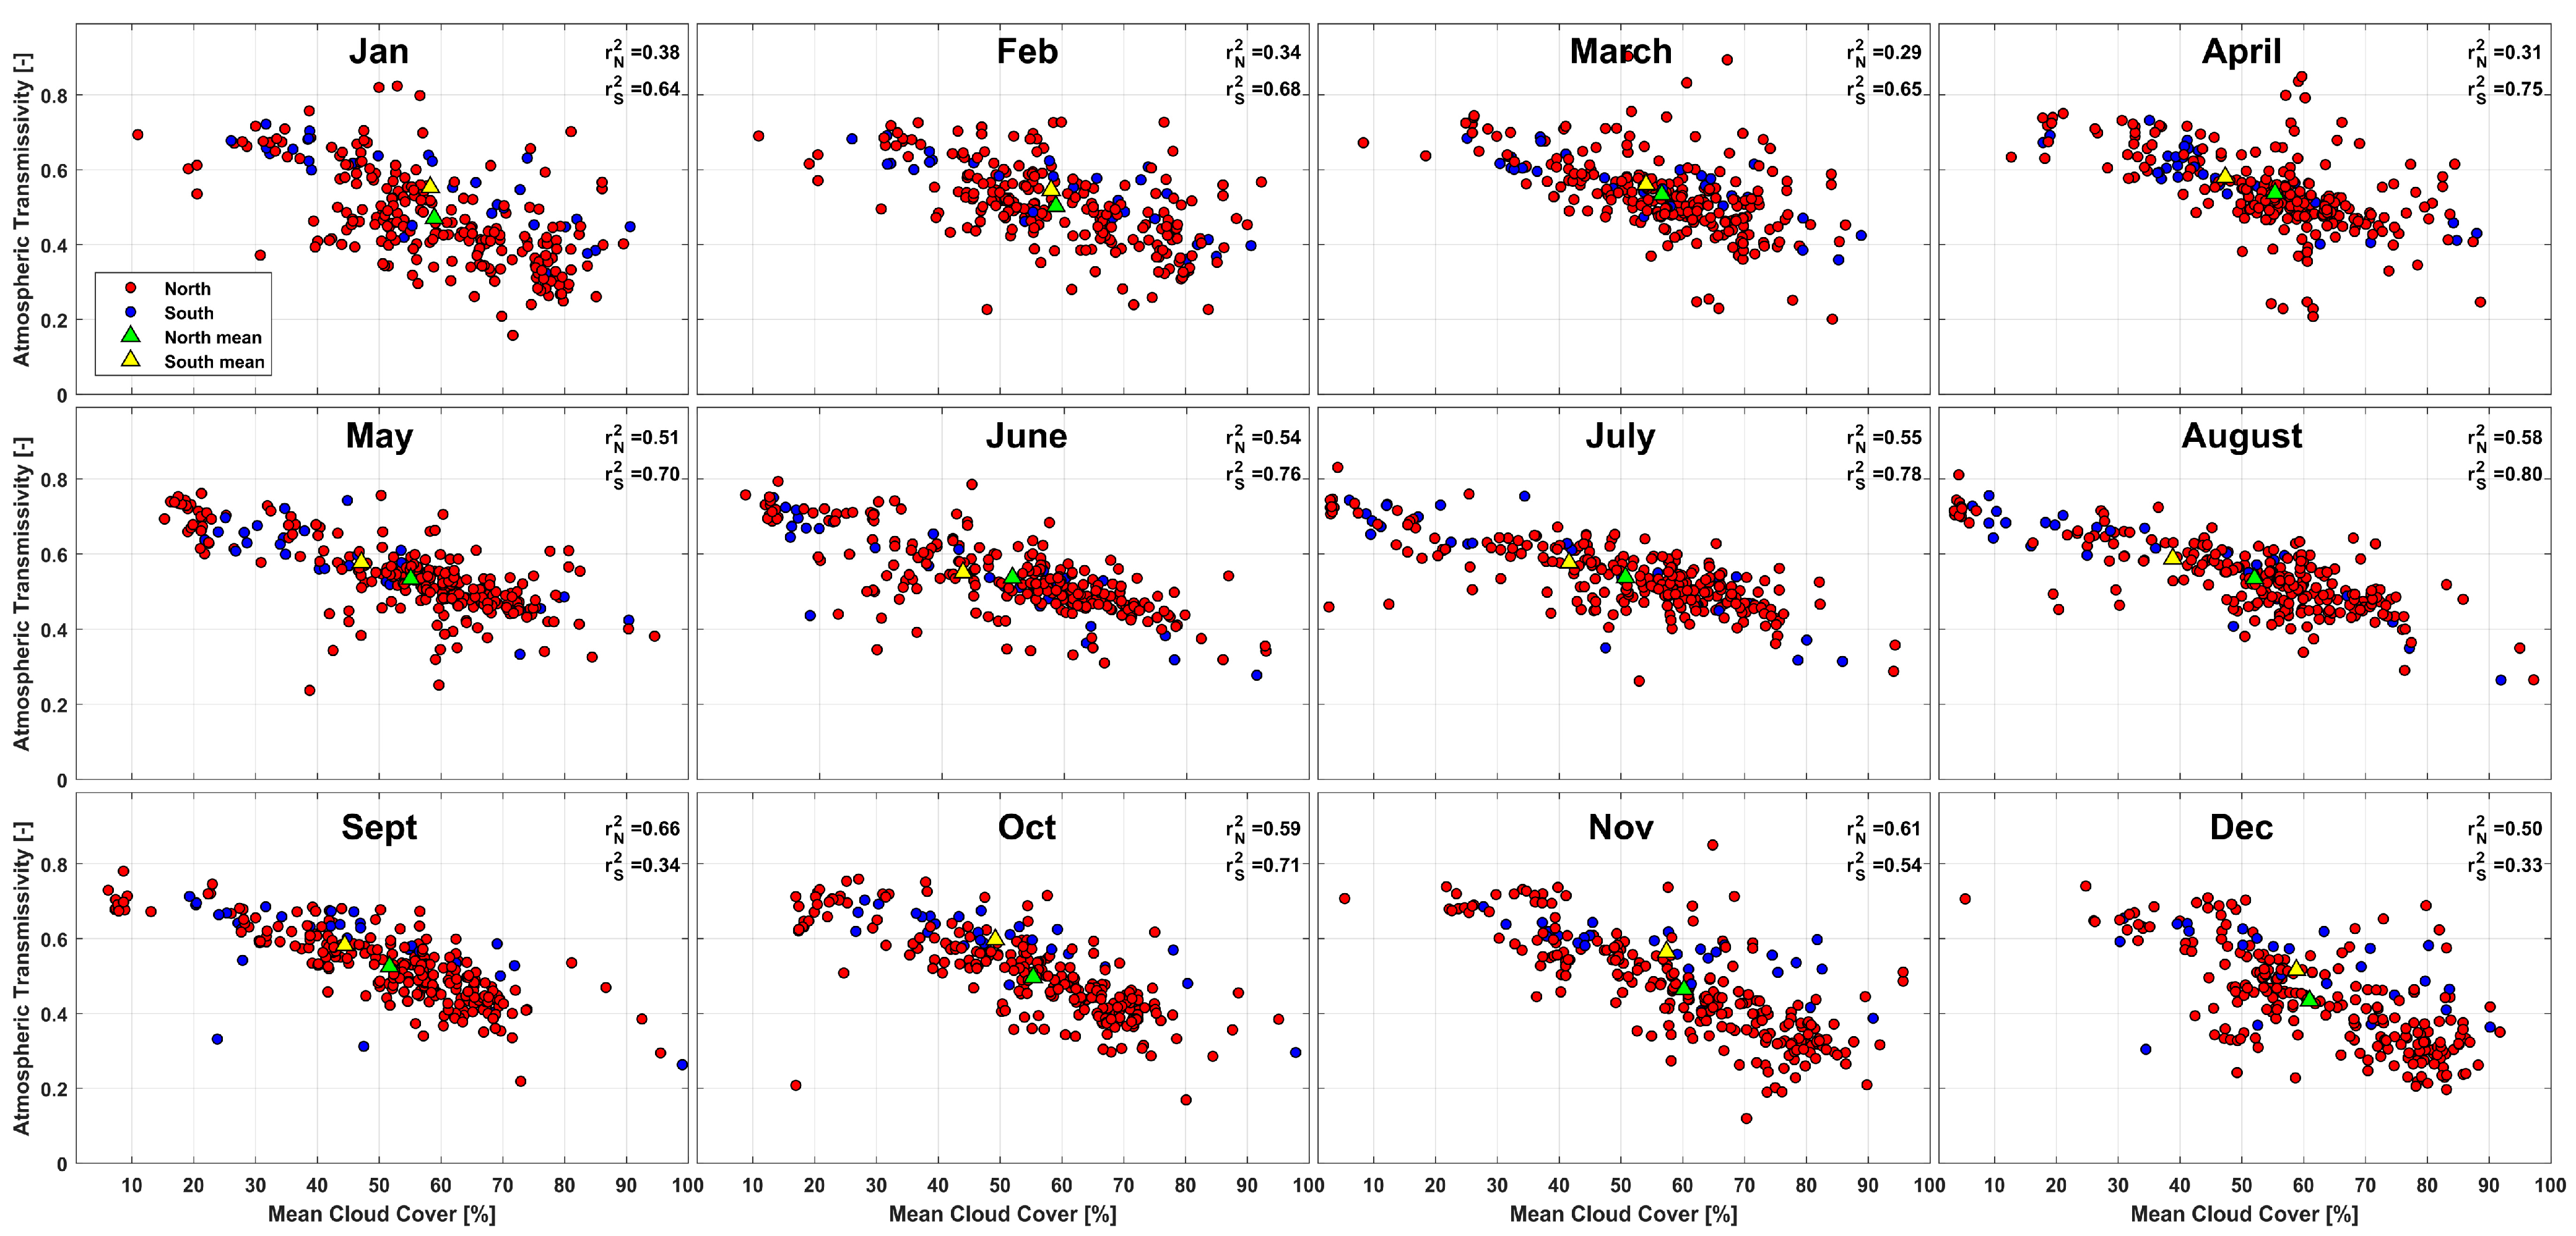
In Figure 5, we included the monthly variations of cloud cover in order to better understand the seasonal patterns of τ in the NH and the SH. We explored these patterns by averaging daily measurements of cloud cover for each month [46]. An inverse correlation between cloud cover and τ of solar radiation was found in terms of monthly values. Mean cloud cover patterns in the NH calculated for summer (April–September) and winter (October–March) seasons showed that the transmissivity was greatest for summer periods, with clear skies and less cloudy days. In winter months, low transmissivity values were observed as a result of high cloud cover in the NH. The increase in the transmissivity value in summer corresponds to the characteristics of the dry season with a decrease in cloud cover and an increase in the number of clear-sky days. Additionally, reduction in transmissivity in winter can be linked to solar zenith angle. Longman et al. [56] showed that for low zenith angle (i.e., for more vertical sun and minimum optical path length), underestimation of atmospheric transmission was greatest, while for high zenith angle (low sun, long optical path length), it overestimated transmissivity for some of the stations. Similar findings of the seasonal mean cloud cover were reported by Yao et al. [41] using ERA5, CRA, and MODIS. Additionally, the findings in this study are also in line with results obtained by Poudyal et al. [91], who reported average τ values for winter, spring, summer, and autumn of 0.75, 0.61, 0.33, and 0.55, respectively. Tang and Leng [72] and Warren et al. [75] showed that the correlation between τ and cloud cover was strong in summer due to the presence of limited snow cover at higher latitudes and large transmittance of solar radiation. At the midlatitudes, the correlation was also strong in spring and autumn as the transmittance was large. Incorporating this understanding of cloud cover, we can improve knowledge of the estimation of τ by using linear regression and interpolation. Henceforth, the cloud cover can be very well related to transmissivity on a monthly scale, and is useful for parsimonious models to see the variation in several hydrological processes embedded in it.

3.4. Embedded Relationship of Aridity and Cloud Cover with Atmospheric Transmissivity

Figure 6 simultaneously shows the relationship of τ with aridity and cloud cover, which helps understand the influence of these two important factors. The cloud cover values have an inverse relation with τ with r2 = 0.51. Higher aridity index (AI) values describe the regions that are in wet conditions. The AI values had an inverse correlation with τ in the range of 0 to 1.5 roughly (Figure 6), however, aridity trends were not globally uniform as there were few points, which created noise in the relationship. The majority of the AI values were in the zone of 0 to 2 (as shown in Figure 4f), and within those, about 20% presented a value of less than 0.5 corresponding to dry climate, and the rest corresponding to wet climate. Wetter condition implies that there is an increase in cloud cover, which leads to more precipitation [72]. Wetter climate along with atmospheric circulation associated with temperature advection may play an important role in modulating both cloudiness and aridity [72]. Cloud in the atmosphere increases the vapor pressure and dampens the temperature. Thus, the change in solar radiation can alter the energy input of land surface and further impact the temperature, causing a decrease in τ. Low AI values correspond to dry conditions, and since in dry conditions there is less precipitation and cloud cover, the scattering of solar radiation was the minimum. The effort was made to relate AI with τ because it is an ecohydrological factor [92,93], which is used in various modeling studies. This was also done because AI data access is free for users and, therefore can easily be used for modeling and estimating the value of τ. Water limitation drives the dynamics of arid regions, with precipitation being the main controlling factor, whereas energy limitation drives the dynamics of humid regions, with PET having more importance [94]. Except for a few sites over the United States, the findings of this study are consistent with results that have shown that the aridity index is negatively correlated with precipitation. Qian et al. [95] provided an analysis of the aridity and transmittance over the Mississippi River Basin and found that a decrease in τ over the region was a direct result of an increase in cloud cover, evapotranspiration, and precipitation.

3.5. Atmospheric Transmissivity Based on Köppen Classification

Analyzing different factors affecting τ, we further investigated the relationship between τ and cloud cover for various climatic regions, and its regionalization can be a useful tool for extrapolation in various hydrological studies. Figure 7 shows the distribution of the study sites based on Köppen classification with their accuracy of τ values evaluated in different climatic zones. The τ for three different ecosystems such as equatorial, arid, and warm temperate regions were analyzed. The grouping of areas follows Köppen classification [62] after removing some of the classification regions as they did not have a sufficient number of stations to represent the ecosystem. Based on these climatic zones, we divided our stations and analyzed the inverse relationship between transmissivity and cloud cover, and quantified the best fit linear trend. A good agreement was found for equatorial regions (Figure 7a) with r2 = 0.88 and for warm temperate regions (Figure 7c) with r2 = 0.74; arid regions (Figure 7b) showed a lower correlation of r2 = 0.46, which is still reasonable. The linear relationship developed for the equatorial, arid regions, and warm temperate are represented by Equations (5)–(7), respectively, given as:
y = 0.0054 x + 0.86
y = 0.004 x + 0.76
y = 0.0057 x + 0.83
It can be concluded that the relationship between cloud cover and transmissivity is stronger when the data are classified using the Köppen climate types, with r2 values of the order of 0.5 or larger.
Transmissivity values for equatorial climates ranged from 0.35 to 0.63; cloud cover showed values between 44% and 89%. These estimates from the different climatic regions are well in line with the findings from Yao et al. [41]. Given this, there was low transmissivity in this area due to the presence of more cloud cover since precipitation and cloud cover are directly inter-related. For arid regions, the range of cloud cover was found to be narrow, from 22% to 53%, implying that the regions had less humidity compared with the equatorial regions. High transmissivity values were obtained for these regions, with most of the regions experiencing a cloud cover range of 27% to 32% (τ = ~0.68) due to low cloud cover. In this study, the arid regions mainly comprised western parts of the United States of America (USA), Africa, China, and Australia. For the warm temperate region, the values of transmissivities and cloud cover were between 0.31 to 0.70 and 27% to 77.5%, respectively. The warm temperate regions were mainly in an eastern part of the USA, Europe (mostly Italy, Germany, France, Spain, and the Netherlands), and eastern parts of Australia. In warm temperate climate, we had the greatest number of points, covering most of the entire climatic region around the globe, showing a very strong correlation (r2 = 0.74).
The established relationship of the transmissivity values for all the climatic types can be used when assessing the effects of global warming on actual water loss (i.e., evapotranspiration) and understanding the hydrological impacts of climate change. For a given climate, a suitable choice of transmissivity values can be chosen based on the above relationships. Although the applicability of the different models established herein might not be suitable for some purposes or in areas not considered here, the proposed relationships can be used in many regions of the world with limited data availability.

4. Conclusions

The latitudinal distribution of the observed τ estimated both in the NH and the SH shows agreement with the pattern documented in the previous literature. A comparison of all of the τ affecting factors from different sources suggests that the aridity index and cloud cover are promising alternatives (strong proxies) when solar radiation measurements are not easily accessible to estimate τ. The results suggest that the temporal variations of τ with cloud cover were captured reasonably well for the NH and the SH separately. When analyzing different climatic regions, we found that the relationship between τ and cloud cover was stronger in warm temperate regions than in arid and equatorial regions. However, the other two regions displayed relationships with acceptable predictive capabilities. It should be noted that the established model is rather simple and, therefore, it is possible that more sophisticated models may provide better results. Furthermore, the relationship of τ with different variables is not limited to its reliance on solar radiation data for different climate regions; it also represents a new technique for simulating evapotranspiration in hydrological models and for estimating the inherent uncertainty in the radiation component of evapotranspiration estimates [7].
The strength of this study is that it can rely exclusively on remote-sensing data and climatic classification in the absence of ancillary ground observations. Therefore, it has the potential to be used in estimates of the global surface energy budget. Future work should incorporate information from more stations in South America, Asia, and Africa, areas in which data density is low. Including a wider range of latitudes and more arid regions would also strengthen the results and can help in the validation and improving the reliability of the linear equations developed in this study. Additionally, natural and anthropogenic aerosols, water vapor, cloud cover properties, and other atmospheric gases determine the atmospheric transmission spectrum for solar radiation; therefore, our future aim is to analyze these physical and chemical properties globally.

Supplementary Materials

The following are available online at https://www.mdpi.com/article/10.3390/rs13091716/s1, Table S1. List of all the global sites used for the analysis of the atmospheric transmissivity.

Author Contributions

A.S.: Conceptualization, Methodology, Investigation, Writing—original draft, Writing—review & editing; P.M.S.: Conceptualization, Methodology, Investigation, Writing—original draft, Writing—review & editing; J.F.R.: Conceptualization, Methodology, Investigation, Writing—original draft, Writing—review & editing; N.K.: Methodology, Investigation, Writing—original draft, Writing—review & editing. O.Y.: Conceptualization, Methodology, Investigation, Writing—draft, Writing—review & editing. All authors have read and agreed to the published version of the manuscript.

Funding

This research was funded by the Australian Research Council through grants FT140100610 and DP140104178 (P.M. Saco) and the Scientific and Technological Research Council of Turkey (TUBITAK) through grant 118C329 (O. Yetemen).

Data Availability Statement

All datasets used in this study are publicly available detailed in the Data and Methods sections.

Acknowledgments

Ankur Srivastava was supported by a University of Newcastle PhD scholarship. O. Yetemen acknowledges support from the 2232 International Fellowship for Outstanding Researchers Program of the Scientific and Technological Research Council of Turkey (TUBITAK) through grant 118C329. The financial support received from TUBITAK does not indicate that the content of the publication is approved in a scientific sense by TUBITAK.

Conflicts of Interest

The authors declare no conflict of interest.

References

  1. Dickinson, R.E. Land surface processes and climate—Surface albedos and energy balance. In Advances in Geophysics; Elsevier: Amsterdam, The Netherlands, 1983; Volume 25, pp. 305–353. [Google Scholar]
  2. Baigorria, G.A.; Villegas, E.B.; Trebejo, I.; Carlos, J.F.; Quiroz, R. Atmospheric transmissivity: Distribution and empirical estimation around the central Andes. Int. J. Climatol. J. R. Meteorol. Soc. 2004, 24, 1121–1136. [Google Scholar] [CrossRef]
  3. Arora, V. Modeling vegetation as a dynamic component in soil-vegetation-atmosphere transfer schemes and hydrological models. Rev. Geophys. 2002, 40, 3-1–3-26. [Google Scholar] [CrossRef] [Green Version]
  4. Bonan, G. Ecological Climatology: Concepts and Applications; Cambridge University Press: Cambridge, UK, 2015. [Google Scholar]
  5. Sellers, P.; Dickinson, R.; Randall, D.; Betts, A.; Hall, F.; Berry, J.; Collatz, G.; Denning, A.; Mooney, H.; Nobre, C. Modeling the exchanges of energy, water, and carbon between continents and the atmosphere. Science 1997, 275, 502–509. [Google Scholar] [CrossRef] [Green Version]
  6. Kumari, N.; Saco, P.M.; Rodriguez, J.F.; Johnstone, S.A.; Srivastava, A.; Chun, K.P.; Yetemen, O. The Grass Is Not Always Greener on the Other Side: Seasonal Reversal of Vegetation Greenness in Aspect-Driven Semiarid Ecosystems. Geophys. Res. Lett. 2020, 47, e2020GL088918. [Google Scholar] [CrossRef]
  7. Srivastava, A.; Saco, P.M.; Rodriguez, J.F.; Kumari, N.; Chun, K.P.; Yetemen, O. The role of landscape morphology on soil moisture variability in semi-arid ecosystems. Hydrol. Process. 2021, 35, e13990. [Google Scholar] [CrossRef]
  8. Hunt, L.; Kuchar, L.; Swanton, C. Estimation of solar radiation for use in crop modelling. Agric. For. Meteorol. 1998, 91, 293–300. [Google Scholar] [CrossRef]
  9. Mavromatis, T.; Jagtap, S. Estimating solar radiation for crop modeling using temperature data from urban and rural stations. Clim. Res. 2005, 29, 233–243. [Google Scholar] [CrossRef]
  10. Matsuda, Y.; Fujita, K.; Ageta, Y.; Sakai, A. Estimation of atmospheric transmissivity of solar radiation from precipitation in the Himalaya and the Tibetan Plateau. Ann. Glaciol. 2006, 43, 344–350. [Google Scholar] [CrossRef] [Green Version]
  11. Almorox, J.; Hontoria, C.; Benito, M. Models for obtaining daily global solar radiation with measured air temperature data in Madrid (Spain). Appl. Energy 2011, 88, 1703–1709. [Google Scholar] [CrossRef]
  12. Moradi, I.; Mueller, R.; Perez, R. Retrieving daily global solar radiation from routine climate variables. Theor. Appl. Climatol. 2014, 116, 661–669. [Google Scholar] [CrossRef]
  13. Letu, H.; Shi, J.; Li, M.; Wang, T.; Shang, H.; Lei, Y.; Ji, D.; Wen, J.; Yang, K.; Chen, L. A review of the estimation of downward surface shortwave radiation based on satellite data: Methods, progress and problems. Sci. China Earth Sci. 2020, 63, 774–789. [Google Scholar] [CrossRef]
  14. Quej, V.H.; Almorox, J.; Ibrakhimov, M.; Saito, L. Estimating daily global solar radiation by day of the year in six cities located in the Yucatán Peninsula, Mexico. J. Clean. Prod. 2017, 141, 75–82. [Google Scholar] [CrossRef] [Green Version]
  15. Zhao, N.; Zeng, X.; Han, S. Solar radiation estimation using sunshine hour and air pollution index in China. Energy Convers. Manag. 2013, 76, 846–851. [Google Scholar] [CrossRef]
  16. Kirmani, S.; Jamil, M.; Rizwan, M. Empirical correlation of estimating global solar radiation using meteorological parameters. Int. J. Sustain. Energy 2015, 34, 327–339. [Google Scholar] [CrossRef]
  17. Reddy, K.S.; Ranjan, M. Solar resource estimation using artificial neural networks and comparison with other correlation models. Energy Convers. Manag. 2003, 44, 2519–2530. [Google Scholar] [CrossRef]
  18. Yadav, A.K.; Chandel, S. Solar radiation prediction using Artificial Neural Network techniques: A review. Renew. Sustain. Energy Rev. 2014, 33, 772–781. [Google Scholar] [CrossRef]
  19. Kumar, R.; Aggarwal, R.; Sharma, J. Comparison of regression and artificial neural network models for estimation of global solar radiations. Renew. Sustain. Energy Rev. 2015, 52, 1294–1299. [Google Scholar] [CrossRef]
  20. Sjoberg, R.W.; Horn, B.K. Atmospheric effects in satellite imaging of mountainous terrain. Appl. Opt. 1983, 22, 1702–1716. [Google Scholar] [CrossRef]
  21. Tyson, P.; Gasse, F.; Bergonzini, L.; D’Abreton, P. Aerosols, atmospheric transmissivity and hydrological modelling of climatic change over Africa south of the equator. Int. J. Climatol. J. R. Meteorol. Soc. 1997, 17, 1651–1665. [Google Scholar] [CrossRef]
  22. Houghton, E. Climate Change 1995: The Science of Climate Change: Contribution of Working Group I to the Second Assessment Report of the Intergovernmental Panel on Climate Change; Cambridge University Press: Cambridge, UK, 1996; Volume 2. [Google Scholar]
  23. Haywood, J.; Ramaswamy, V. Global sensitivity studies of the direct radiative forcing due to anthropogenic sulfate and black carbon aerosols. J. Geophys. Res. Atmos. 1998, 103, 6043–6058. [Google Scholar] [CrossRef]
  24. Twomey, S. The influence of pollution on the shortwave albedo of clouds. J. Atmos. Sci. 1977, 34, 1149–1152. [Google Scholar] [CrossRef] [Green Version]
  25. Albrecht, B.A. Aerosols, cloud microphysics, and fractional cloudiness. Science 1989, 245, 1227–1230. [Google Scholar] [CrossRef]
  26. Ramaswamy, V.; Boucher, O.; Haigh, J.; Hauglustine, D.; Haywood, J.; Myhre, G.; Nakajima, T.; Shi, G.; Solomon, S. Radiative forcing of climate. Clim. Chang. 2001, 349. [Google Scholar]
  27. Solomon, S.; Manning, M.; Marquis, M.; Qin, D. Climate Change 2007-the Physical Science Basis: Working Group I Contribution to the Fourth Assessment Report of the IPCC; Cambridge University Press: Cambridge, UK, 2007; Volume 4. [Google Scholar]
  28. Greuell, W.; Genthon, C. Modelling land-ice surface mass balance. In Mass Balance of the Cryosphere: Observations and Modelling of Contemporary and Future Changes; Cambridge University Press: Cambridge, UK, 2004; Volume 117, p. 168. [Google Scholar]
  29. Angstrom, A. Solar and terrestrial radiation. Report to the international commission for solar research on actinometric investigations of solar and atmospheric radiation. Q. J. R. Meteorol. Soc. 1924, 50, 121–126. [Google Scholar] [CrossRef]
  30. Matuszko, D. Influence of the extent and genera of cloud cover on solar radiation intensity. Int. J. Climatol. 2012, 32, 2403–2414. [Google Scholar] [CrossRef]
  31. Suehrcke, H.; Bowden, R.S.; Hollands, K. Relationship between sunshine duration and solar radiation. Sol. Energy 2013, 92, 160–171. [Google Scholar] [CrossRef]
  32. Molina, A.; Falvey, M.; Rondanelli, R. A solar radiation database for Chile. Sci. Rep. 2017, 7, 1–11. [Google Scholar] [CrossRef] [PubMed]
  33. Bristow, K.L.; Campbell, G.S. On the relationship between incoming solar radiation and daily maximum and minimum temperature. Agric. For. Meteorol. 1984, 31, 159–166. [Google Scholar] [CrossRef]
  34. Goodin, D.G.; Hutchinson, J.; Vanderlip, R.L.; Knapp, M. Estimating solar irradiance for crop modeling using daily air temperature data. Agron. J. 1999, 91, 845–851. [Google Scholar] [CrossRef]
  35. Lee, K.H. Constructing a non-linear relationship between the incoming solar radiation and bright sunshine duration. Int. J. Climatol. 2010, 30, 1884–1892. [Google Scholar] [CrossRef]
  36. Sen, Z. Solar Energy Fundamentals and Modeling Techniques: Atmosphere, Environment, Climate Change and Renewable Energy; Springer Science & Business Media: New York, NY, USA, 2008. [Google Scholar]
  37. Yu, L.; Zhang, M.; Wang, L.; Qin, W.; Lu, Y.; Li, J. Clear-sky solar radiation changes over arid and semi-arid areas in China and their determining factors during 2001–2015. Atmos. Environ. 2020, 223, 117198. [Google Scholar] [CrossRef]
  38. Rienecker, M.; Suarez, M.; Gelaro, R.; Todling, R.; Bacmeister, J.; Liu, E.E.; Bosilovich, M.G.; Schubert, S.D.; Takacs, L.; Kim, G.K.; et al. MERRA: NASA’s Modern-Era Retrospective Analysis for Research and Applications. J. Clim. 2011, 24, 3624–3648. [Google Scholar] [CrossRef]
  39. Hersbach, H.; Dee, D. ERA5 reanalysis is in production. ECMWF Newsl. 2016, 147, 5–6. [Google Scholar]
  40. Kobayashi, S.; Ota, Y.; Harada, Y.; Ebita, A.; Moriya, M.; Onoda, H.; Onogi, K.; Kamahori, H.; Kobayashi, C.; Endo, H. The JRA-55 reanalysis: General specifications and basic characteristics. J. Meteorol. Soc. Jpn. Ser. II 2015, 93, 5–48. [Google Scholar] [CrossRef] [Green Version]
  41. Yao, B.; Teng, S.; Lai, R.; Xu, X.; Yin, Y.; Shi, C.; Liu, C. Can atmospheric reanalyses (CRA and ERA5) represent cloud spatiotemporal characteristics? Atmos. Res. 2020, 244, 105091. [Google Scholar] [CrossRef]
  42. Hänsch, R.; Schulz, K.; Sörgel, U. Machine learning methods for remote sensing applications: An overview. Berlin: Earth Resources and Environmental Remote Sensing/GIS Applications IX. Inter. Soc. Opt. Photo. 2018, 10790, 1079002. [Google Scholar]
  43. Ma, R.; Letu, H.; Yang, K.; Wang, T.; Shi, C.; Xu, J.; Shi, J.; Shi, C.; Chen, L. Estimation of surface shortwave radiation from Himawari-8 satellite data based on a combination of radiative transfer and deep neural network. IEEE Trans. Geosci. Remote Sens. 2020, 58, 5304–5316. [Google Scholar] [CrossRef]
  44. Dhungel, R.; Aiken, R.; Evett, S.R.; Colaizzi, P.D.; Marek, G.; Moorhead, J.E.; Baumhardt, R.L.; Brauer, D.; Kutikoff, S.; Lin, X. Energy Imbalance and Evapotranspiration Hysteresis under an Advective Environment: Evidence from Lysimeter, Eddy Covariance, and Energy Balance Modelling. Geophys. Res. Lett. 2021, e2020GL091203. [Google Scholar]
  45. Mazhar, U.; Jin, S.; Duan, W.; Bilal, M.; Ali, M.; Farooq, H. Spatio-Temporal Trends of Surface Energy Budget in Tibet from Satellite Remote Sensing Observations and Reanalysis Data. Remote Sens. 2021, 13, 256. [Google Scholar] [CrossRef]
  46. Wilson, A.M.; Silander, J.A., Jr. Estimating uncertainty in daily weather interpolations: A Bayesian framework for developing climate surfaces. Int. J. Climatol. 2014, 34, 2573–2584. [Google Scholar] [CrossRef]
  47. Jin, M. Analysis of land skin temperature using AVHRR observations. Bull. Am. Meteorol. Soc. 2004, 85, 587–600. [Google Scholar] [CrossRef]
  48. Heidinger, A.K.; Evan, A.T.; Foster, M.J.; Walther, A. A naive Bayesian cloud-detection scheme derived from CALIPSO and applied within PATMOS-x. J. Appl. Meteorol. Climatol. 2012, 51, 1129–1144. [Google Scholar] [CrossRef]
  49. Minnis, P.; Sun-Mack, S.; Young, D.F.; Heck, P.W.; Garber, D.P.; Chen, Y.; Spangenberg, D.A.; Arduini, R.F.; Trepte, Q.Z.; Smith, W.L. CERES edition-2 cloud property retrievals using TRMM VIRS and Terra and Aqua MODIS data—Part I: Algorithms. IEEE Trans. Geosci. Remote Sens. 2011, 49, 4374–4400. [Google Scholar] [CrossRef]
  50. Stubenrauch, C.J.; Rossow, W.B.; Kinne, S.; Ackerman, S.; Cesana, G.; Chepfer, H.; Di Girolamo, L.; Getzewich, B.; Guignard, A.; Heidinger, A. Assessment of global cloud datasets from satellites: Project and database initiated by the GEWEX radiation panel. Bull. Am. Meteorol. Soc. 2013, 94, 1031–1049. [Google Scholar] [CrossRef]
  51. Wylie, D.; Jackson, D.L.; Menzel, W.P.; Bates, J.J. Trends in global cloud cover in two decades of HIRS observations. J. Clim. 2005, 18, 3021–3031. [Google Scholar] [CrossRef]
  52. Knapp, K.R.; Ansari, S.; Bain, C.L.; Bourassa, M.A.; Dickinson, M.J.; Funk, C.; Helms, C.N.; Hennon, C.C.; Holmes, C.D.; Huffman, G.J. Globally gridded satellite observations for climate studies. Bull. Am. Meteorol. Soc. 2011, 92, 893–907. [Google Scholar] [CrossRef]
  53. Adaramola, M.S. Estimating global solar radiation using common meteorological data in Akure, Nigeria. Renew. Energy 2012, 47, 38–44. [Google Scholar] [CrossRef]
  54. Almorox, J.; Bocco, M.; Willington, E. Estimation of daily global solar radiation from measured temperatures at Cañada de Luque, Córdoba, Argentina. Renew. Energy 2013, 60, 382–387. [Google Scholar] [CrossRef] [Green Version]
  55. Katiyar, A.; Pandey, C.K. Simple correlation for estimating the global solar radiation on horizontal surfaces in India. Energy 2010, 35, 5043–5048. [Google Scholar] [CrossRef]
  56. Longman, R.J.; Giambelluca, T.W.; Frazier, A.G. Modeling clear-sky solar radiation across a range of elevations in Hawai’i: Comparing the use of input parameters at different temporal resolutions. J. Geophys. Res. Atmos. 2012, 117. [Google Scholar] [CrossRef] [Green Version]
  57. Zomer, R.J.; Trabucco, A.; Bossio, D.A.; Verchot, L.V. Climate change mitigation: A spatial analysis of global land suitability for clean development mechanism afforestation and reforestation. Agric. Ecosyst. Environ. 2008, 126, 67–80. [Google Scholar] [CrossRef]
  58. Huo, Z.; Dai, X.; Feng, S.; Kang, S.; Huang, G. Effect of climate change on reference evapotranspiration and aridity index in arid region of China. J. Hydrol. 2013, 492, 24–34. [Google Scholar] [CrossRef]
  59. Zhang, W.; Jin, F.-F.; Zhao, J.-X.; Qi, L.; Ren, H.-L. The possible influence of a nonconventional El Niño on the severe autumn drought of 2009 in Southwest China. J. Clim. 2013, 26, 8392–8405. [Google Scholar] [CrossRef]
  60. Baldocchi, D.; Falge, E.; Gu, L.; Olson, R.; Hollinger, D.; Running, S.; Anthoni, P.; Bernhofer, C.; Davis, K.; Evans, R. FLUXNET: A new tool to study the temporal and spatial variability of ecosystem-scale carbon dioxide, water vapor, and energy flux densities. Bull. Am. Meteorol. Soc. 2001, 82, 2415–2434. [Google Scholar] [CrossRef]
  61. Hahn, C.; Warren, S.; Eastman, R. Cloud Climatology for Land Stations Worldwide, 1971–2009 (NDP-026D); Environmental System Science Data Infrastructure for a Virtual Ecosystem, Oak Ridge National Laboratory (ORNL): Oak Ridge, TN, USA, 2012. [Google Scholar]
  62. Rubel, F.; Kottek, M. Observed and projected climate shifts 1901–2100 depicted by world maps of the Köppen-Geiger climate classification. Meteorol. Z. 2010, 19, 135. [Google Scholar] [CrossRef] [Green Version]
  63. Bohn, T.J.; Livneh, B.; Oyler, J.W.; Running, S.W.; Nijssen, B.; Lettenmaier, D.P. Global evaluation of MTCLIM and related algorithms for forcing of ecological and hydrological models. Agric. For. Meteorol. 2013, 176, 38–49. [Google Scholar] [CrossRef]
  64. Bras, R.L. Hydrology: An Introduction to Hydrologic Science; Addison Wesley Publishing Company: Boston, MA, USA, 1990. [Google Scholar]
  65. Kopp, G.; Lean, J.L. A new, lower value of total solar irradiance: Evidence and climate significance. Geophys. Res. Lett. 2011, 38, 38. [Google Scholar] [CrossRef] [Green Version]
  66. Duffie, J.A.; Beckman, W.A. Solar Engineering of Thermal Process, 2nd ed.; Wiley-Interscience: New York, NY, USA, 1991. [Google Scholar]
  67. Köppen, W.; Geiger, R. Handbuch der Klimatologie; Gebrüder Borntraeger Berlin: Berlin, Germany, 1930; Volume 1. [Google Scholar]
  68. KOPPEN, W.d. Das geographische system der klimat. Handb. Klimatol. 1936, 46. [Google Scholar]
  69. Kottek, M.; Grieser, J.; Beck, C.; Rudolf, B.; Rubel, F. World map of the Köppen-Geiger climate classification updated. Meteorol. Z. 2006, 15, 259–263. [Google Scholar] [CrossRef]
  70. Lu, J.; Vecchi, G.A.; Reichler, T. Expansion of the Hadley cell under global warming. Geophys. Res. Lett. 2007, 34. [Google Scholar]
  71. Seidel, D.J.; Fu, Q.; Randel, W.J.; Reichler, T.J. Widening of the tropical belt in a changing climate. Nat. Geosci. 2008, 1, 21–24. [Google Scholar] [CrossRef]
  72. Tang, Q.; Leng, G. Changes in cloud cover, precipitation, and summer temperature in North America from 1982 to 2009. J. Clim. 2013, 26, 1733–1744. [Google Scholar] [CrossRef]
  73. Trenberth, K.E. Atmospheric moisture residence times and cycling: Implications for rainfall rates and climate change. Clim. Chang. 1998, 39, 667–694. [Google Scholar] [CrossRef]
  74. London, J.; Hahn, C.J.; Warren, S.G. Observed variations of total cloudiness and cloud types: Implications for the atmospheric radiation budget. In Atmospheric Radiation; Springer: Berlin/Heidelberg, Germany, 1987; pp. 459–467. [Google Scholar]
  75. Warren, S.G.; Eastman, R.M.; Hahn, C.J. A survey of changes in cloud cover and cloud types over land from surface observations, 1971–1996. J. Clim. 2007, 20, 717–738. [Google Scholar] [CrossRef] [Green Version]
  76. Houston, J.; Hartley, A.J. The central Andean west-slope rainshadow and its potential contribution to the origin of hyper-aridity in the Atacama Desert. Int. J. Climatol. J. R. Meteorol. Soc. 2003, 23, 1453–1464. [Google Scholar] [CrossRef]
  77. Fick, S.E.; Hijmans, R.J. WorldClim 2: New 1-km spatial resolution climate surfaces for global land areas. Int. J. Climatol. 2017, 37, 4302–4315. [Google Scholar] [CrossRef]
  78. Wang, J. Temperature effect on the atmospheric transmission function in the 15-μm region. Opt. Lett. 1978, 2, 169–171. [Google Scholar] [CrossRef]
  79. Kaas, E.; Frich, P. Diurnal temperature range and cloud cover in the Nordic countries: Observed trends and estimates for the future. Atmos. Res. 1995, 37, 211–228. [Google Scholar] [CrossRef]
  80. Karl, T.R.; Jones, P.D.; Knight, R.W.; Kukla, G.; Plummer, N.; Razuvayev, V.; Gallo, K.P.; Lindseay, J.; Charlson, R.J.; Peterson, T.C. A new perspective on recent global warming: Asymmetric trends of daily maximum and minimum temperature. Bull. Am. Meteorol. Soc. 1993, 74, 1007–1024. [Google Scholar] [CrossRef] [Green Version]
  81. Dai, A.; Del Genio, A.D.; Fung, I.Y. Clouds, precipitation and temperature range. Nature 1997, 386, 665–666. [Google Scholar] [CrossRef]
  82. Dai, A.; Trenberth, K.E.; Karl, T.R. Effects of clouds, soil moisture, precipitation, and water vapor on diurnal temperature range. J. Clim. 1999, 12, 2451–2473. [Google Scholar] [CrossRef]
  83. Travis, D.J.; Carleton, A.M.; Lauritsen, R.G. Regional variations in US diurnal temperature range for the 11–14 September 2001 aircraft groundings: Evidence of jet contrail influence on climate. J. Clim. 2004, 17, 1123–1134. [Google Scholar] [CrossRef] [Green Version]
  84. Roy, S.S.; Balling, R.C., Jr. Analysis of trends in maximum and minimum temperature, diurnal temperature range, and cloud cover over India. Geophys. Res. Lett. 2005, 32. [Google Scholar] [CrossRef]
  85. Stanhill, G.; Ianetz, A. Long-term trends in, and the spatial variation of, global irradiance in Israel. Tellus B 1997, 49, 112–122. [Google Scholar] [CrossRef] [Green Version]
  86. Hartmann, D.L. Radiative effects of clouds on Earth’s climate. In International Geophysics; Elsevier: Amsterdam, The Netherlands, 1993; Volume 54, pp. 151–173. [Google Scholar]
  87. Lin, L.; Gettelman, A.; Feng, S.; Fu, Q. Simulated climatology and evolution of aridity in the 21st century. J. Geophys. Res. Atmos. 2015, 120, 5795–5815. [Google Scholar] [CrossRef]
  88. Feng, S.; Fu, Q. Expansion of global drylands under a warming climate. Atmos. Chem. Phys. 2013, 13, 10081–10094. [Google Scholar] [CrossRef] [Green Version]
  89. Cook, B.I.; Smerdon, J.E.; Seager, R.; Coats, S. Global warming and 21st century drying. Clim. Dyn. 2014, 43, 2607–2627. [Google Scholar] [CrossRef] [Green Version]
  90. Moriasi, D.N.; Arnold, J.G.; Van Liew, M.W.; Bingner, R.L.; Harmel, R.D.; Veith, T.L. Model evaluation guidelines for systematic quantification of accuracy in watershed simulations. Trans. ASABE 2007, 50, 885–900. [Google Scholar] [CrossRef]
  91. Poudyal, K.N.; Bhattarai, B.K.; Sapkota, B.; Kjeldstad, B. Estimation of global solar radiation using clearness index and cloud transmittance factor at trans-Himalayan region in Nepal. Energy Power Eng. 2012, 4, 415–421. [Google Scholar] [CrossRef] [Green Version]
  92. Budyko, M.I. Climate and Life; Academic: San Diego, CA, USA, 1974. [Google Scholar]
  93. Zhang, L.; Dawes, W.; Walker, G. Response of mean annual evapotranspiration to vegetation changes at catchment scale. Water Resour. Res. 2001, 37, 701–708. [Google Scholar] [CrossRef]
  94. Zhang, Y.; Chiew, F.H.; Peña-Arancibia, J.; Sun, F.; Li, H.; Leuning, R. Global variation of transpiration and soil evaporation and the role of their major climate drivers. J. Geophys. Res. Atmos. 2017, 122, 6868–6881. [Google Scholar] [CrossRef]
  95. Qian, T.; Dai, A.; Trenberth, K.E. Hydroclimatic trends in the Mississippi River basin from 1948 to 2004. J. Clim. 2007, 20, 4599–4614. [Google Scholar] [CrossRef]
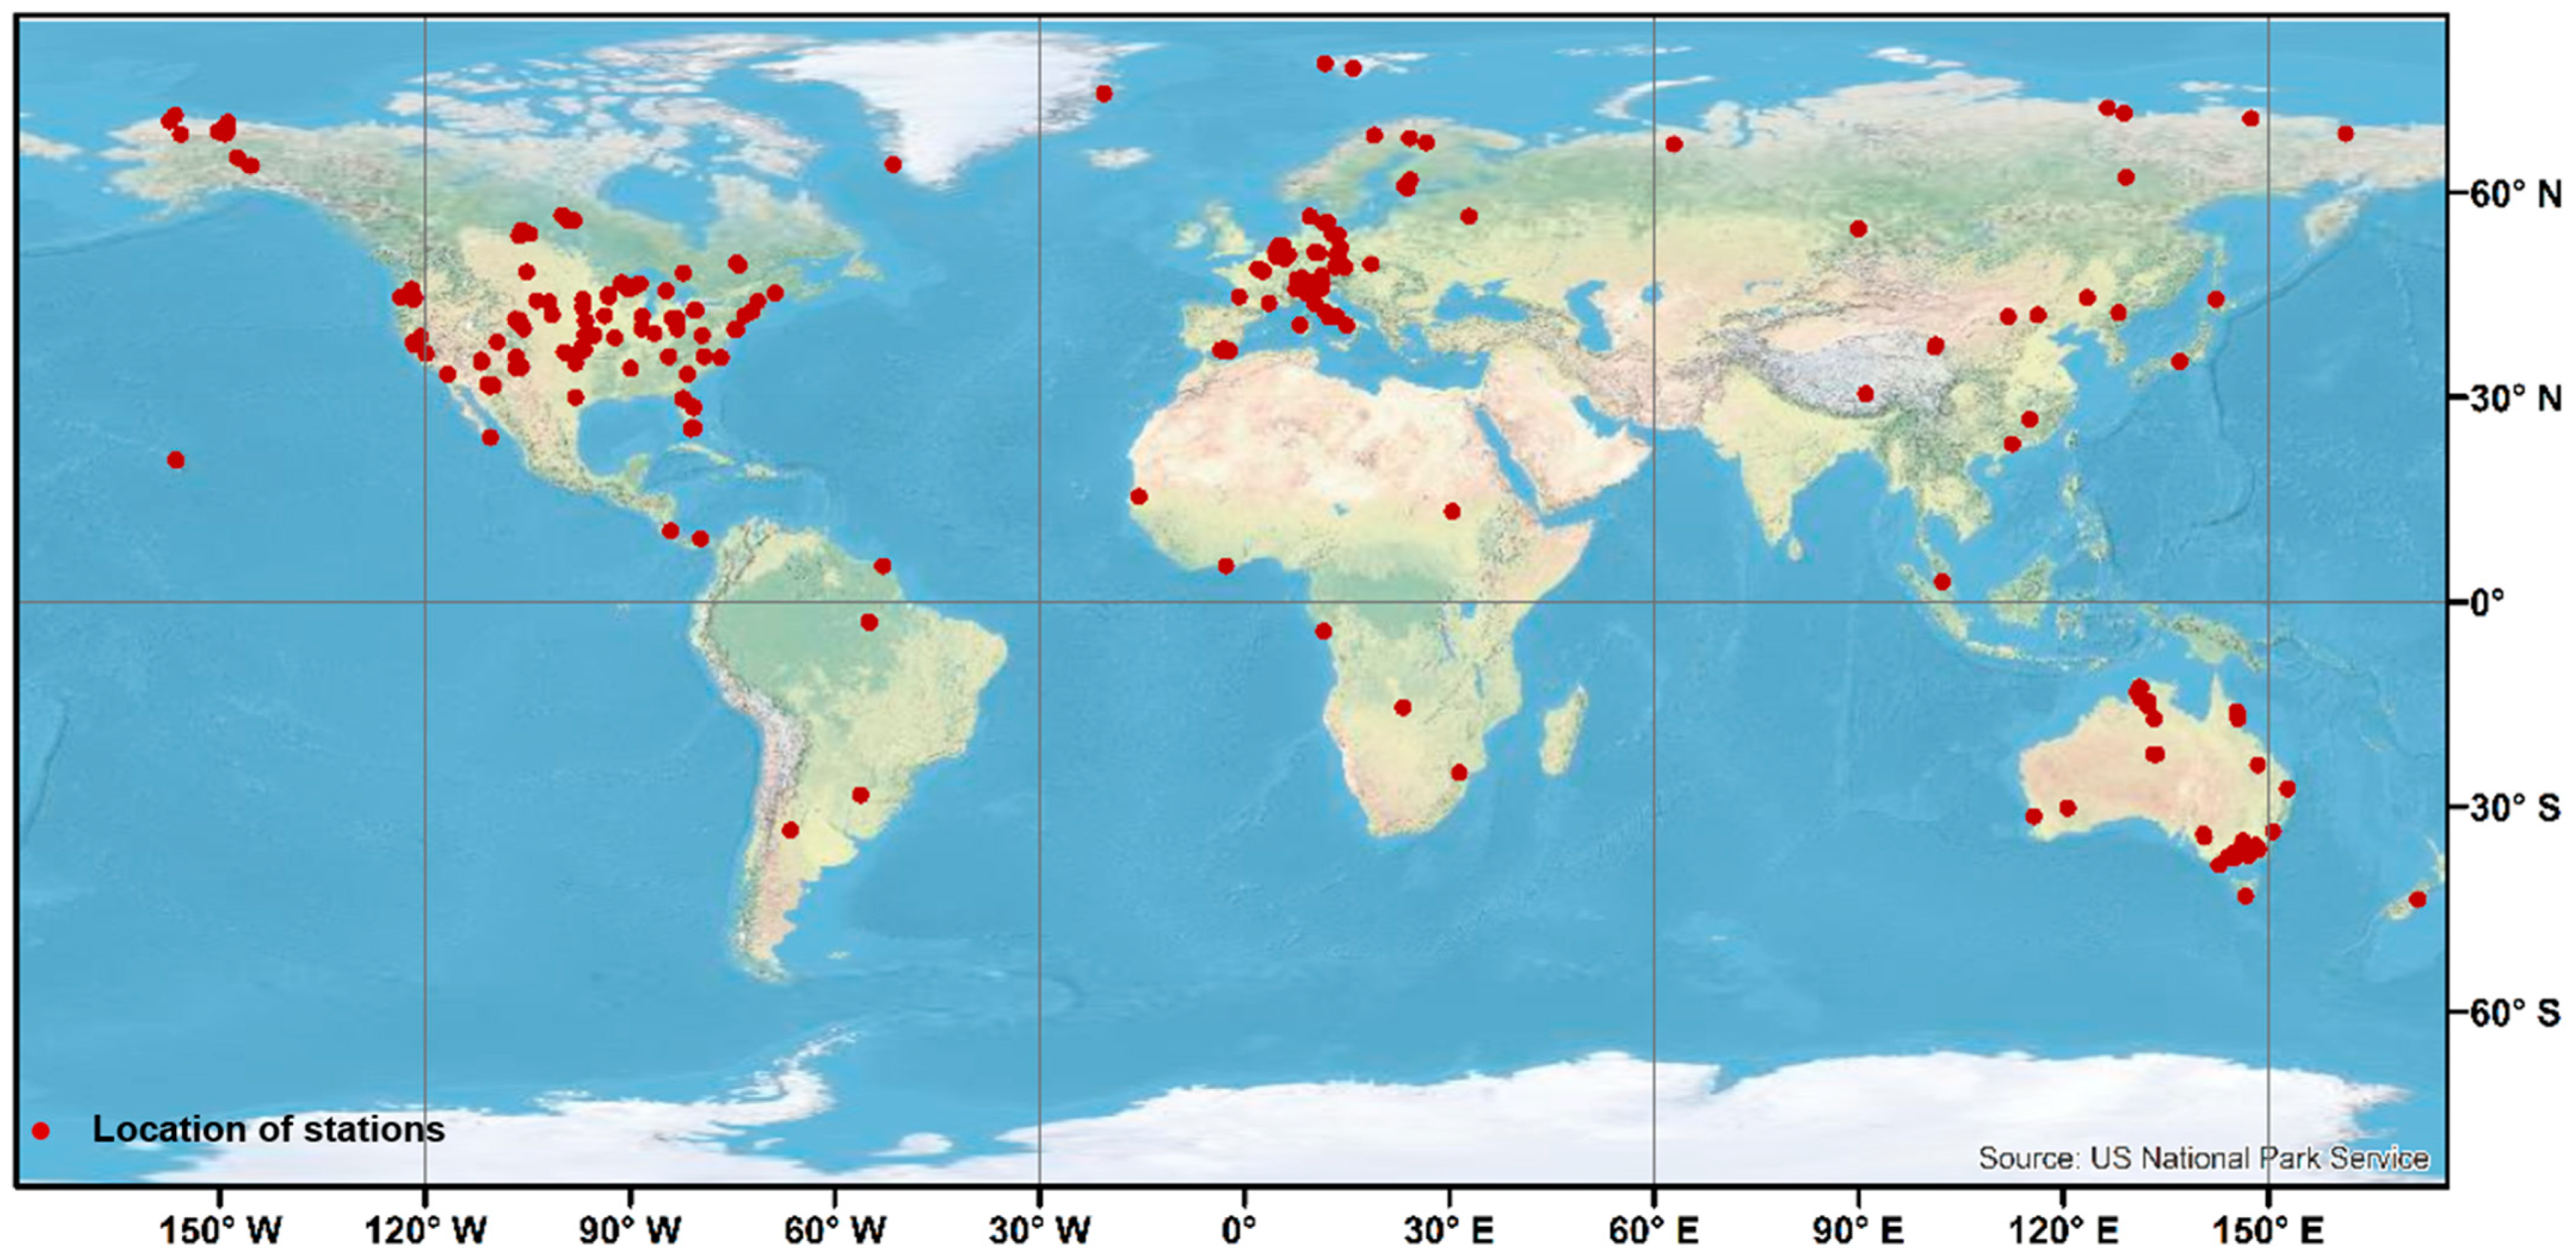
Figure 1. Geographical distribution of sites (shown in red) used in this study spanned North America, South America, Europe, Asia, and Australia by considering the three flux networks namely, Ameriflux, Fluxnet, and Ozflux after excluding the coastal sites (i.e., lying near to the ocean within ~7 km).
Remotesensing 13 01716 g001
Figure 2. Flowchart representing the step-by-step methodology followed for the calculation of atmospheric transmissivity from the Ameriflux, Fluxnet, and Ozflux networks.
Remotesensing 13 01716 g002
Figure 3. (a) Latitudinal variation of atmospheric transmissivity (τ) based on 275 locations across the world. All of the τ points are shown in red, and the τ binned averaged for every 5° latitudes is shown in blue. (b) Similarly, the latitudinal variation of cloud cover is shown in red, and the binned averages are shown in blue. The black solid line represents the latitudinal variation of cloud cover adapted from London et al. [74].
Remotesensing 13 01716 g003
Figure 4. Atmospheric transmissivity (τ) plotted as a function of six different variables for the NH and the SH. Locations lying in the NH across the globe are denoted by red, and the locations lying in the SH across the globe are denoted with blue. Six different τ affecting factors selected in this study are (a) precipitation; (b) temperature; (c) elevation; (d) diurnal temperature range (DTR); (e) cloud cover; and (f) aridity index. All these variables are separated based on their geographical information obtained from the Ameriflux, Fluxnet, and Ozflux stations.
Remotesensing 13 01716 g004
Figure 5. Monthly variations of atmospheric transmissivity (τ) as a function of cloud cover are shown from January to December for the Northern and Southern Hemispheres. Red denotes sites existing in the NH, while blue denotes sites existing in the SH. Green and yellow triangles respectively represent the mean value of cloud cover for the Northern and Southern Hemispheres. rN2 and rS2 are the r2 values for the Northern and Southern Hemispheres data, respectively.
Remotesensing 13 01716 g005
Figure 6. Atmospheric transmissivity τ plotted as a function of mean cloud cover and aridity index. The AI values are expressed from the color bars where the dark green colour shows higher AI values (>0.9) and light/pale yellow colors represent lower AI (<0.1).
Remotesensing 13 01716 g006
Figure 7. Relationship between atmospheric transmissivity [−] and cloud cover [%] is shown for three different climatic types based on Köppen climate classification: (a) equatorial, (b) arid, and (c) warm temperate regions.
Remotesensing 13 01716 g007
Publisher’s Note: MDPI stays neutral with regard to jurisdictional claims in published maps and institutional affiliations.