Article

Effective Range and Driving Factors of the Urban Ventilation Corridor Effect on Urban Thermal Comfort at Unified Scale with Multisource Data

1
State Key Laboratory of Information Engineering in Surveying, Mapping and Remote Sensing, Wuhan University, Wuhan 430079, China
2
School of Remote Sensing and Information Engineering, Wuhan University, Wuhan 430079, China
*
Author to whom correspondence should be addressed.
Remote Sens. 2021, 13(9), 1783; https://doi.org/10.3390/rs13091783
Submission received: 25 March 2021 / Revised: 22 April 2021 / Accepted: 29 April 2021 / Published: 3 May 2021

Abstract

:
Urban ventilation corridors serve as channels of fresh air flow between the city and suburbs, helping to improve the wind and thermal environments and thermal comfort. However, owing to the limited number of weather stations, it is impossible to quantitatively reveal the effective effect range of urban ventilation corridors on urban thermal comfort at the scale of 100 × 100 m, which is optimal for urban ventilation corridors. In this study, we integrated building data, the European Centre for Medium-Range weather forecast data (ECMWF), MOD13Q1, and other multisource data to analyse the effect of urban ventilation corridors on urban thermal comfort at a unified scale of 100 × 100 m. The results showed that ECMWF and Landsat8 data could be used as substitute factors to improve the universal thermal climate index (UTCI) urban spatial resolution. The effective range of urban ventilation corridor effects on the urban surface temperature and urban comfort was ≤1000 m, with building density and vegetation coverage as the main factors limiting this range. Therefore, attention should be paid to the effective range of urban ventilation corridors, the surrounding building density, vegetation coverage, and the rational use of urban ventilation corridors to reduce the energy consumption of air conditioning in summer.

1. Introduction

Cities cover approximately 1% of the surface of the Earth and accommodate 54% of the global population [1]. According to the United Nations Department of Economics and Social Affairs (UNDESA), this figure is expected to rise to two-thirds of the projected 9.8 billion total global population by 2050 [2,3]. Limited space and rapid population growth have forced most cities to adopt high-rise, compact, and high-density building layout patterns [4]. These factors increase the roughness of urban surfaces, reduce urban ventilation, and cause a series of urban problems, such as the ‘accumulation of pollutants and, particularly, the urban heat island effect (UHIE) [5,6,7,8]. These factors significantly affect the health of urban residents and the comfort of their living environments, resulting in the consumption of significant amounts of energy for air conditioning [9,10,11]. Therefore, it is important to explore ways to improve the living comfort of urban residents in relatively compact urban spaces.
Urban ventilation corridors present a means to promote urban air circulation and improvements in the urban wind and heat environment, thus, playing an essential role in the reduction of urban pollution, alleviation of the UHIE, and improvements in thermal comfort, particularly in summer [12,13,14]. The research on urban ventilation corridors has focused on their planning and construction at different scales, and the mitigation of urban smog and the UHIE. The research results suggest that urban ventilation corridors are correlated positively with urban heat islands.
The methods of determining ventilation corridors mainly include computational fluid dynamics (CFD) [15,16,17,18,19], wind tunnel simulations [20], and the least-cost path algorithm (LCP) [21]. In constructing urban ventilation corridors, the LCP algorithm has been used widely because it facilitates convenient and accurate construction of urban ventilation corridors at different scales [22]. However, setting the cost grid is an important parameter that affects the accuracy in obtaining ventilation corridors. Typically, the frontal area index (FAI) is used as the cost parameter in calculations, with the optimal grid size for such calculations being 100 × 100 m [15,23,24,25]. The most intuitive manifestation of the UHIE is the effect on the comfort of the urban living environment and the health of the residents. The universal thermal climate index (UTCI) has become the preferred model for evaluating urban thermal comfort because it can be applied to various climate and weather studies [10,22]. However, notably, the UTCI has limitations, for example, the small number of local weather stations, the inability to obtain high-resolution interpolation results at the city scale, and difficulty in meeting the FAI optimal grid size of 100 × 100 m [16,21,26,27,28,29,30]. Calculating the urban thermal comfort at a high-resolution scale and quantitatively revealing the influence range of urban ventilation corridors on urban thermal comfort have important reference significance not only for improving the comfort of residents in summer but also for the rational planning of the urban building layout.
Accordingly, our study is focused on two aspects, namely (i) obtaining the substitution factor of UTCI computation to improve the spatial resolution of UTCI by unifying the meteorological data provided by the European Centre for Medium-Range Weather Forecasts (ECMWF) and Landsat8 data provided by the United States Geological Survey (USGS) official website; and (ii) at the unified data scale, constructing urban ventilation corridors based on the FAI and calculating UTCI based on the obtained data, as well as quantitatively revealing the effective range of urban ventilation corridors on urban thermal comfort. We also focused on analysing the driving factors to provide references for the rational planning of urban building layouts and improvements in urban comfort in summer, and reducing the energy consumption of air conditioning in the summer.

2. Materials and Methods

2.1. Materials

The Pearl River Delta has become a major region of development and urbanization in China. The region is located in Guangzhou Province (21°31′–23°10′ N, 112°45′–113°50′ E). The annual average temperature is between 21 and 23 °C, and it has a subtropical monsoon climate. From 1987 to 2007, the area of construction land increased rapidly from 1526 to 5130 km2, increasing by 2.4 times [31], and the intensity of expansion in construction land is continuing to increase [32]. The local economy developed rapidly and the gross domestic product (GDP) per capita increased from 500 yuan in 1978 to 57,888 yuan in 2008 [33]. The population increased from 10.51 to 43.16 million from 1982 to 2010 [34]. The rapid expansion of construction land, rapid economic development, and the booming population underpin the UHIE. This has contributed to an increase in the average summer temperature by 2.17 °C and in the maximum temperature by 3.24 °C from 1987 to 2017. The annual number of days with temperatures exceeding 30 °C increased from 114 to 132, and high-temperature and heat wave events occur frequently. This has caused severe challenges with respect to the urban comfort levels [24,30,31].
The data collected during this study are shown in Table 1. Landsat8 data were acquired for the Pearl River Delta to obtain complete spatial coverage of the study area, following a set cloud coverage rate of below 1. To obtain sufficient data, the data were retrieved from May to October 2017.
We used building data, Landsat8 remote sensing image data, ECMWF weather forecast data, MOD13Q1, and unified the data scale according to the FAI calculation scale of 100 × 100 m. The data obtained from ECMWF included the wind speed substitution factor, relative humidity substitution factor, and relative radiant temperature substitution factor as represented by the total cloud cover [10,24]. The land surface temperature substitution factor was obtained by Landsat8 through a mono-window algorithm inversion [33,34,36,37,38]. The UTCI calculated by these four substitution factors is denoted as SUTCI (UTCI calculated from the substitution factor) in this paper. The weather station data were used to determine the summer months and prevailing wind directions, as well as to calculate the WUTCI (i.e., the UTCI calculated from factors obtained from weather station data) in the Pearl River Delta. Building data were used to calculate the FAI and to provide a data basis for the construction of LCP. The building data used are shown in Figure 2, with Dongguan as an example.
Figure 1. Location of the study area.
Remotesensing 13 01783 g001

2.2. Methods

We integrated building data, Landsat8 remote sensing image data, ECMWF weather forecast data, MOD13Q1, and other multisource data to analyse the effect of urban ventilation corridors on urban thermal comfort at a unified scale of 100 × 100 m. In Figure 3, the overall framework is summarised and the main processing methods are explained in italics.

2.2.1. Frontal Area Index

The FAI is generally used as a morphological analysis parameter in a geographic information system (GIS) that represents the resistance of wind when flowing in the urban canopy [39]. The index represents the ratio of the sum of the projected area of all the surfaces of a building in the unit under the determined wind direction θ to the unit area (Figure 4). It ranges from 0.00 to 1.00 [35,40]. The greater the value, the greater the ventilation resistance. The calculation formula is shown in Equation (1). Given that the Pearl River Delta mainly has high-rise and densely located buildings, we selected a grid of 100 × 100 m to ensure accuracy in the FAI calculations [16,21,24,25,30,39,41].
λ f ( θ ) = A f ( θ ) A T
where λf(θ) is the magnitude of the FAI, Af(θ) is the sum of the projected areas of all the surfaces of the building in the unit under the determining wind direction θ, and AT is the unit area. We used the C# programming language and the ArcEngine library of embeddable GIS components to implement the calculation process.

2.2.2. Urban Thermal Comfort

The multi-node UTCI comfort evaluation model was constructed using human body heat exchange models, including the Fiala and clothing models. This comfort model comprehensively considers factors such as the human metabolic and environmental characteristics and the thermal resistance of clothing [43,44]. The comfort calculations can be applied universally, e.g., in calculations for cities of different sizes. The equation can be written as:
U T C I = f ( T a ; T m r t ; V a , R H )
where Ta is the mean temperature, Tmrt is the mean radiation temperature, Va is the mean wind speed at 10 m, and RH denotes the relative humidity. The mean radiation temperature data could not be obtained directly from the weather station data and the ECMWF. In the calculation of the WUTCI, the difference between the percentage of sunshine verified in previous studies and 100% was used to obtain the mean radiation temperature [45]. In the calculation of the SUTCI, the total cloud coverage in the ECMWF data was used to obtain the mean radiation temperature [46]. Subsequently, these factors were obtained and input into BioKima2.6 software to calculate the SUTCI and WUTCI [47].
In the UTCI model, the comfort level (Table 2) of the temperature as perceived by the human body was divided into 10 levels, with the optimal comfort level being at 9–26 °C [47,48,49].
The World Meteorological Organization regards temperatures exceeding 32 °C as uncomfortable. In China, 35 °C is considered as the temperature to begin a high temperature warning [50]. However, different regions use different temperature thresholds [51,52,53]. Percentiles are suitable for measuring data locations and can provide information on how each datum is distributed between the maximum and minimum values [54]. Therefore, we used the 50th quantile method to determine the UTCI critical value of discomfort caused by high temperatures in various cities in the Pearl River Delta and to count the number of heat discomfort days experienced [50].
Q i ( p ) = ( 1 γ ) X j + γ X j + 1
j = int [ p n + ( 1 + p ) / 3 ]
γ = p n + ( 1 + p ) / 3 j
where Qi(p) is the ith quantile value, X is the sample sequence in ascending order, p represents the quantile, n denotes the total number of sequences, j is the jth sequence number, and γ is the weight of the j + 1th sequence number.

2.2.3. Construction of Urban Ventilation Corridor

Urban ventilation corridors represent the ‘‘local circulation’’ theory in climatology. The purpose is to introduce fresh, moist, and cool air to urban areas in the summer to improve the urban air mobility, relieve the UHIE, and enhance human comfort. As the LCP is able to quickly and accurately construct urban ventilation corridors at different scales, it is employed widely for this purpose [15].
The basic principle of the LCP algorithm is to find the path between the start point and the endpoint at the minimum cost [21,55,56]. The cost can be selected based on the time function or another function specified by the user. We defined costs as FAI values calculated from the building data as shown in Table 1. We set the start points and endpoints based on statistics related to the Pearl River Delta wind direction from 1987 to 2017. This followed a specific process [22,50]. First, we located 100 start points in the southeast of the study area. From June to September, the prevailing wind directions in the study area were from the southeast, south-southeast, south, and south-southwest. Afterward, 100 endpoints were located in the northeast, north-northeast, north, and north-northeast parts of the study area. Second, we searched for urban ventilation corridors using the LCP, and finally we counted the frequency of the LCP paths encapsulated in each grid. We used the grid unit with the highest rate of occurrence as the urban ventilation corridor path. We detected numerous overlapping LCPs when calculating the number of ventilation paths. Paths that overlapped each otzher completely were checked for topology and were removed [19,22]

3. Results

3.1. Data Processing and Verification

3.1.1. Temperature and Wind Frequency in the Pearl River Delta

We used the daily temperatures and wind directions measured by the 23 weather stations (see Figure 1) in the Pearl River Delta from 1987 to 2017 to respectively create a violin chart and radar chart using Python, as shown in Figure 5 [57]. From 1987 to 2017 in the Pearl River Delta, the average annual temperature recorded by the 23 weather stations was above 0 °C. The average temperature was the highest from June to September. This temperature distribution was the most compact, and the temperature fluctuation range was small. Therefore, we defined June to September as the summer months in the Pearl River Delta for subsequent analysis [57]. We obtained statistics on the daily wind direction from June to September from the 23 weather stations for 1987 to 2017. Subsequently, we plotted the wind direction radar chart (see Figure 5b). The wind direction radar chart shows that four wind directions (southeast, south-southeast, south, and south-southwest) were prevalent in summer, with the total distribution frequency reaching 0.4377. We used these prevailing wind directions in the Pearl River Delta during summer as a reference to calculate the FAI [57].

3.1.2. Data Accuracy Verification

The data employed in this study involved multiple scales. Therefore, we respectively analysed the correlation between the four alternative factors and the four weather factors, as well as the correlation SUTCI and WUTCI [58], verifying the reliability of the SUTCI calculated using substitution factors. At a 95% confidence level, the correlation coefficients between the four alternative factors and the four weather factors, and between SUTCI and WUTCI were 0.8966, 0.9086, 0.9234, 0.8977, and 0.8959, respectively, and the correlation coefficients were higher [59] (see Table 3). This implied that the UTCI input factor adopted in this study and the calculated results of SUTCI and WUTCI were reliable.

3.2. Construction and Spatial Distribution of Urban Ventilation Corridors

We employed the FAI as the cost path to construct urban ventilation corridors. The urban ventilation corridors of each city and the entire Pearl River Delta were obtained through the LCP algorithm (see Figure 6).
As shown in Figure 7, the FAI range of the Pearl River Delta was 0.00–1.00, with the FAI value range for Huizhou and Jiangmen being slightly smaller than those for other cities. Due to the different locations of urban development centres, the sites of the densely constructed areas of such centres are inconsistent, and the frontal area index extends from the city centre to different places. For example, buildings in Foshan are mainly distributed in the northeast, while those of Guangzhou are mainly distributed in the southwest. Dongguan, Guangzhou, Foshan, Shenzhen, and Zhongshan are densely built, with the buildings distributed widely, while most tall buildings are located in the city centre.
As a result, the FAI shows a gradually decreasing trend away from the city centre. Among the cities, the FAI of Dongguan presents a model of multiple centres radiating outward, related to the city’s adoption of a “bottom-up” urbanization development model, which scholars call the “Pearl River Delta Model” [60]. However, due to the compact distribution of buildings in Guangzhou, Foshan, and Shenzhen, the FAI shows a close and connected phenomenon related to the policies of “promoting the construction of new districts” and “large-scale infrastructure construction” implemented after 2000 [33]. The overall FAI of the Pearl River Delta presents an outward radiating state of densely built tall buildings. This phenomenon is more noticeable here than in other cities because the Pearl River Delta is a high-density building city cluster, with densely distributed facilities in the central and southern parts. The difference in the distribution of FAI in the Pearl River Delta and the FAI in various cities also reflects the influence of the building layout on the distribution of the FAI.
Similarly, most of the ventilation corridors in the Pearl River Delta and various cities are distributed along urban roads (national and provincial roads), water systems, and relatively open areas (Figure 6) [61]. Urban cold sources are distributed around urban ventilation corridors, providing cold and fresh air to the city (see Appendix A Table A1). Compared with other cities, Dongguan, Foshan, Guangzhou, Shenzhen, and Zhongshan have more ventilation corridors, which is related to the layout of relatively wide roads, rivers, and buildings in the city oriented along the direction of prevailing winds. There are many urban ventilation path in the whole Pearl River Delta, and the form is not completely consistent with that of other cities, which reflects the different degrees of obstruction of urban ventilation by the whole building form and the independent building form, as well as the influence of large-scale urban building forms on the urban ventilation corridor. In the urban planning process, the impact of a single city building on the urban ventilation and the impact of surrounding cities on the city’s ventilation must be considered, especially between cities with similar urban development centres.

3.3. Spatial Distribution Characteristics of SUTCI

We divided the Pearl River Delta and the high-temperature, uncomfortable areas and comfortable areas of each city according to the calculation results in Table 2 to determine the spatial distribution of thermal comfort in cities in the Pearl River Delta. The building heights of each city were divided according to the architectural standards.
The height of the buildings in the Pearl River Delta is between 3 and 100 m (Figure 7). The cities’ high-temperature and uncomfortable areas are mainly distributed around 21–100 m high buildings. Due to the inconsistency of the various cities’ development centres, high-temperature and uncomfortable areas do not show a regular circular radiation pattern but radiate from the inside to the outside, according to the building layout. High-temperature and uncomfortable areas in Dongguan are mainly widely distributed in the northwest and southeast. This is related to the typical “bottom-up” rural urbanization development model in Dongguan [59].
High-temperature and uncomfortable areas in Foshan are mainly distributed in the northeast, and such areas in Guangzhou are mainly distributed in the southwest and south and are dominated by buildings above 30 m. High-temperature and uncomfortable areas in Shenzhen are more abundant than in other cities. They are mainly distributed in areas with building heights between 12 and 100 m. Compared with other cities, Guangzhou, Foshan, and Shenzhen are compactly connected. The reason for this phenomenon is the policy of “promoting the construction of new districts” and “large-scale infrastructure construction” since 2000 [33]. High-temperature discomfort areas in Zhongshan City are mainly distributed in the northwest, centre, and south. Buildings in the central area are mainly super-high and high. The north western and southern areas are mainly composed of medium-high and low-rise buildings. Zhongshan’s uncomfortable areas are mainly distributed between super-high buildings, high-rise buildings, and medium-high buildings. The overall distribution of buildings is relatively concentrated, highlighting the correlation between high-temperature uncomfortable areas and the height distribution of tall buildings. The high-temperature and uncomfortable areas in Zhuhai are mainly distributed in the centre. However, there some of these areas exist in the south, which is related to Zhuhai’s unique geographical location [62]. Different from the other cities, the overall building height of Jiangmen City is relatively low, and the distribution of buildings is relatively scattered, which also results in a scattered pattern of high-temperature and uncomfortable areas. From the perspective of the entire Pearl River Delta, the high-temperature and uncomfortable areas are mainly distributed in the central and southeast regions, where their distribution is relatively concentrated. The higher the building density, the higher the floor, the larger the high-temperature uncomfortable areas, while these areas radiate from densely-built tall buildings. This factor is related to the gradual delta human population distribution building height, building layout, and “global urbanization” policy [33]. Based on our results, the high-temperature uncomfortable areas of the Pearl River Delta cities are spatially consistent with the distribution of tall buildings, and their formation is affected by policy factors.

3.4. Influence of Urban Ventilation Corridor on Urban Comfort

Urban ventilation corridors are not only an effective method to alleviate the effects of the urban thermal environment and to reduce the concentration of urban pollutants but they also substantially influence the thermal comfort of city dwellers. In quantitatively determining the effect of such ventilation corridors on the urban thermal comfort, we focused on corridors with 50, 100, 200, 300, 400, 500, 1000, and 1500 m wide buffer zones on both sides. We employed Pearson’s correlation tests on the FAI and the surface retrieval temperature as well as the FAI and SUTCI to analyse the effective range of urban ventilation corridors on urban surface temperature and urban thermal comfort [63,64]. The correlation between the FAI and surface temperature in the different buffer ranges is shown in Figure 8.
As the figure shows, in the Pearl River Delta in general, as the buffer distance increases, the correlation between the FAI and surface temperature gradually decreases. This implies that, as the distance from the ventilation corridor continues to expand after exceeding 1000 m, the urban ventilation corridor does not significantly alleviate the urban high-temperature problem [63,64].
Figure 9 shows the correlation between the FAI and SUTCI in the buffer zones of the ventilation corridors, i.e., as the buffer distance increases, the correlation between FAI and SUTCI gradually decreases. This implies that, as the distance from the urban ventilation corridor continues to expand, the effect of the urban ventilation corridor on the urban thermal comfort decreases. After exceeding 1000 m, the urban ventilation corridor is considered not to affect the urban thermal comfort [63,64]. The effective range of urban ventilation corridors on urban thermal comfort is consistent with the practical range on urban temperature. This implies that when the distance exceeds 1000 m, the effect is negligible.

4. Discussion

4.1. Factors Influencing the Effective Range of Urban Ventilation Corridors

As mentioned in Section 3.4, the effective range of a ventilation corridor was determined as ≤1000 m. To explore relevant causes, we calculated the three main factors that produce the UHIE using the 2017 land-use data and MOD13Q1 data of the Pearl River Delta: the urban building density, the vegetation coverage, and the water ratio [60,65,66,67]. Urban buildings affect the flow of fresh air between the city and the suburbs by influencing the airflow activity and energy balance of the city, and thereby affecting the thermal comfort. Urban vegetation cools down the city by blocking sunlight and humidifying the air, which plays a role in improving the thermal comfort of the city. The specific heat capacity of a water body is large, which can rapidly alleviate the UHIE [68]. Our calculation results are shown in Figure 10.
As shown in Figure 10, as the distance from the buffer zone increases, the building density and FAI value in each buffer zone also increases, leading to stronger wind obstruction. As the wind–heat environment cannot be improved, the effective range of the urban ventilation paths is limited. As the distance between the vegetation coverage and the buffer zone increases, the effect of vegetation coverage in each buffer zone gradually decreases, and the cooling effect on the city gradually decreases. This factor results in a continuous decline in the ability of vegetation to relieve urban thermal comfort, which, to a certain extent, limits the effective range of urban ventilation paths. Unlike the changing trend of building density and vegetation coverage, the proportion of water area changes less within a buffer zone of ≤1000 m; thus, there is little change regarding the mitigation effect on thermal comfort. Consequently, the water area has a smaller effect on the effective range of LCP. In general, the building density and vegetation coverage are the main factors that influence the effective range of urban ventilation paths, the spatial variability of the frontal area index, and its relationship with the urban heat island intensity.

4.2. Implication of the FAI and Urban Ventilation Corridors

In the FAI calculation process, the choice of grid size is an important factor affecting the accuracy of the index. Chen et al. used a grid of 100 × 100 m while studying the ventilation corridors in the Renhuai area of Guizhou and pointed out that this grid yielded reliable results [30]. Wong et al. indicated that a 100-m grid was the best scale for exploring urban ventilation resistance and the urban heat island effect. Indeed, the best calculation scale for the FAI lies between 75 and 125 m [21]. Hsieh et al. indicated that the grid cell size of 100 m is between the mesoscale and micro-scale, which can be analysed in detail and is suitable for urban planners [16]. We performed FAI calculations at grid scales of 50 × 50 m, 100 × 100 m, 200 × 200 m, and 300 × 300 m. The results show that the scales of 50 × 50 m and 75 × 75 m easily divided several single-family buildings into different grids, which led to incorrect FAI calculation results and did not fully reflect the distribution of the FAI.
However, according to the calculation formula of the FAI, grids of 200 × 200 m and 300 × 300 m are likely too large (see Equation (1)), making the FAI index smaller. Therefore, based on the search for the best scale effect and the evidence from the literature, we finally used a 100 × 100 m grid for calculation and conducted our follow-up research and analysis accordingly.The roughness of the underlying urban surface is an essential factor affecting the efficiency of urban ventilation. The smoother, more spacious, and more open an area is, the more conducive to the passage of urban wind it will be, thereby, alleviating the urban heat island effect and improving the city’s thermal comfort. Urban ventilation corridors can be divided into three types: roads, rivers, and green spaces. The width of roads and rivers is sufficient, the underlying surface roughness is low, and the resistance to urban ventilation is small; therefore, air readily flows through such corridors. Regarding roads, studying the FAI of Hong Kong’s Kowloon Peninsula, Wong et al. proposed that 100 m urban ventilation corridors are helpful in alleviating the urban heat island effect [21]. Chen et al. found that urban ventilation corridors were distributed along the main roads in a study on the Renhuai area of Guizhou [30].In summarizing the urban ventilation corridors in areas, such as Germany, Japan, Hong Kong, and Wuhan, Ren et al. proposed that urban arterial roads, rivers, and other areas are the main urban ventilation corridors [69].
Based on the results presented in Section 3.2, the ventilation corridors in the Pearl River Delta and its various cities are also mainly distributed along main urban roads, water systems, and relatively open areas, which is consistent with the results reported in the literature. Unlike the previous research, we focused our study on urban agglomerations. The number and shape of the overall urban ventilation corridors in the Pearl River Delta are not entirely consistent with those of urban ventilation corridors in various cities (e.g., Dongguan, Guangzhou, and Foshan). This deviation is due to the inclusion and analysis of all buildings in each city in constructing the entire urban ventilation corridor of the Pearl River Delta. This phenomenon reflects the influence of architectural forms on urban ventilation corridors and highlights that more attention should be paid to the layout of surrounding urban buildings in the construction of urban ventilation corridors. It is more reasonable to adopt a combination of “bottom-up” and “top-down” strategies particularly in the construction of ventilation corridors in urban agglomerations.

4.3. Research Limitations

We used the FAI, LCP, and other methods to study the effect range of urban ventilation corridors on urban thermal comfort based on multi-source data. In terms of methods, a large number of resamplings was used to unify the data scales. We verified the accuracy of the calculation factors, SUTCI and WUTCI, to confirm the method’s reliability. However, there is still a certain degree of accuracy loss. Chen et al. proposed an FAI calculation method that considers local topographic factors for constructing urban ventilation corridors in medium alpine and canyon-type karst landforms [30]. Since the Pearl River Delta is the largest plains area in Guangdong Province, we did not consider the influence of local topographic factors in the calculation process, which may affect the FAI accuracy at particular locations.
We focused our study on the Pearl River Delta, an area with a high density of cities, and obtained quantitative results. However, the applicability to other urban agglomerations, such as the Yangtze River Delta and the Beijing–Tianjin–Hebei Delta, remains to be verified. Therefore, in future research, we will study the adequate scope of the thermal comfort of urban agglomerations and urban ventilation corridors nationwide to obtain quantitative results for national policymaking.

5. Conclusions

We constructed urban ventilation corridors in the Pearl River Delta employing multisource data, including building data, Landsat8 remote sensing image data, ECMWF weather forecast data, and MOD13Q1 data from 2017. Under the unified 100 × 100 m scale, the FAI, LCP, and other models were used to construct urban ventilation corridors in the Pearl River Delta, quantitatively revealing the effective range of urban ventilation corridors on the urban thermal comfort used to analyse the driving factors. Our main conclusions are as follows:
(1)
The correlation analysis results of the substitution factors and weather station acquisition factors, as well as the SUTCI and WUTCI results show that the UTCI calculated by substitution factors obtained from ECMWF and Landsat8 data was reliable, which makes the UTCI no longer restricted by the number of weather stations, thus, improving its urban spatial resolution.
(2)
The choice of grid size is an essential factor affecting the accuracy of the index. Based on previous research experience and the FAI calculation results at multiple scales, we determined that a 100 × 100 m grid was the best scale to ensure FAI accuracy.
(3)
The FAI range of the Pearl River Delta was 0.00–1.00, and the overall FAI of the Pearl River Delta presented an outward radiating state of densely built tall buildings. There were many urban ventilation paths in the whole of the Pearl River Delta. This form is not entirely consistent with that of other cities, reflecting the influence of the overall building form and the independent building form on urban ventilation obstacles. In the urban planning process, this is a point worth noting.
(4)
The height of the buildings in the Pearl River Delta was between 3 and 100 m. The cities’ high-temperature and uncomfortable areas were mainly distributed around 21–100 m high buildings. The high-temperature uncomfortable areas of the Pearl River Delta cities were spatially consistent with the distribution of tall buildings, and their formation was affected by policy factors, such as Dongguan, Guangzhou, and other cities.
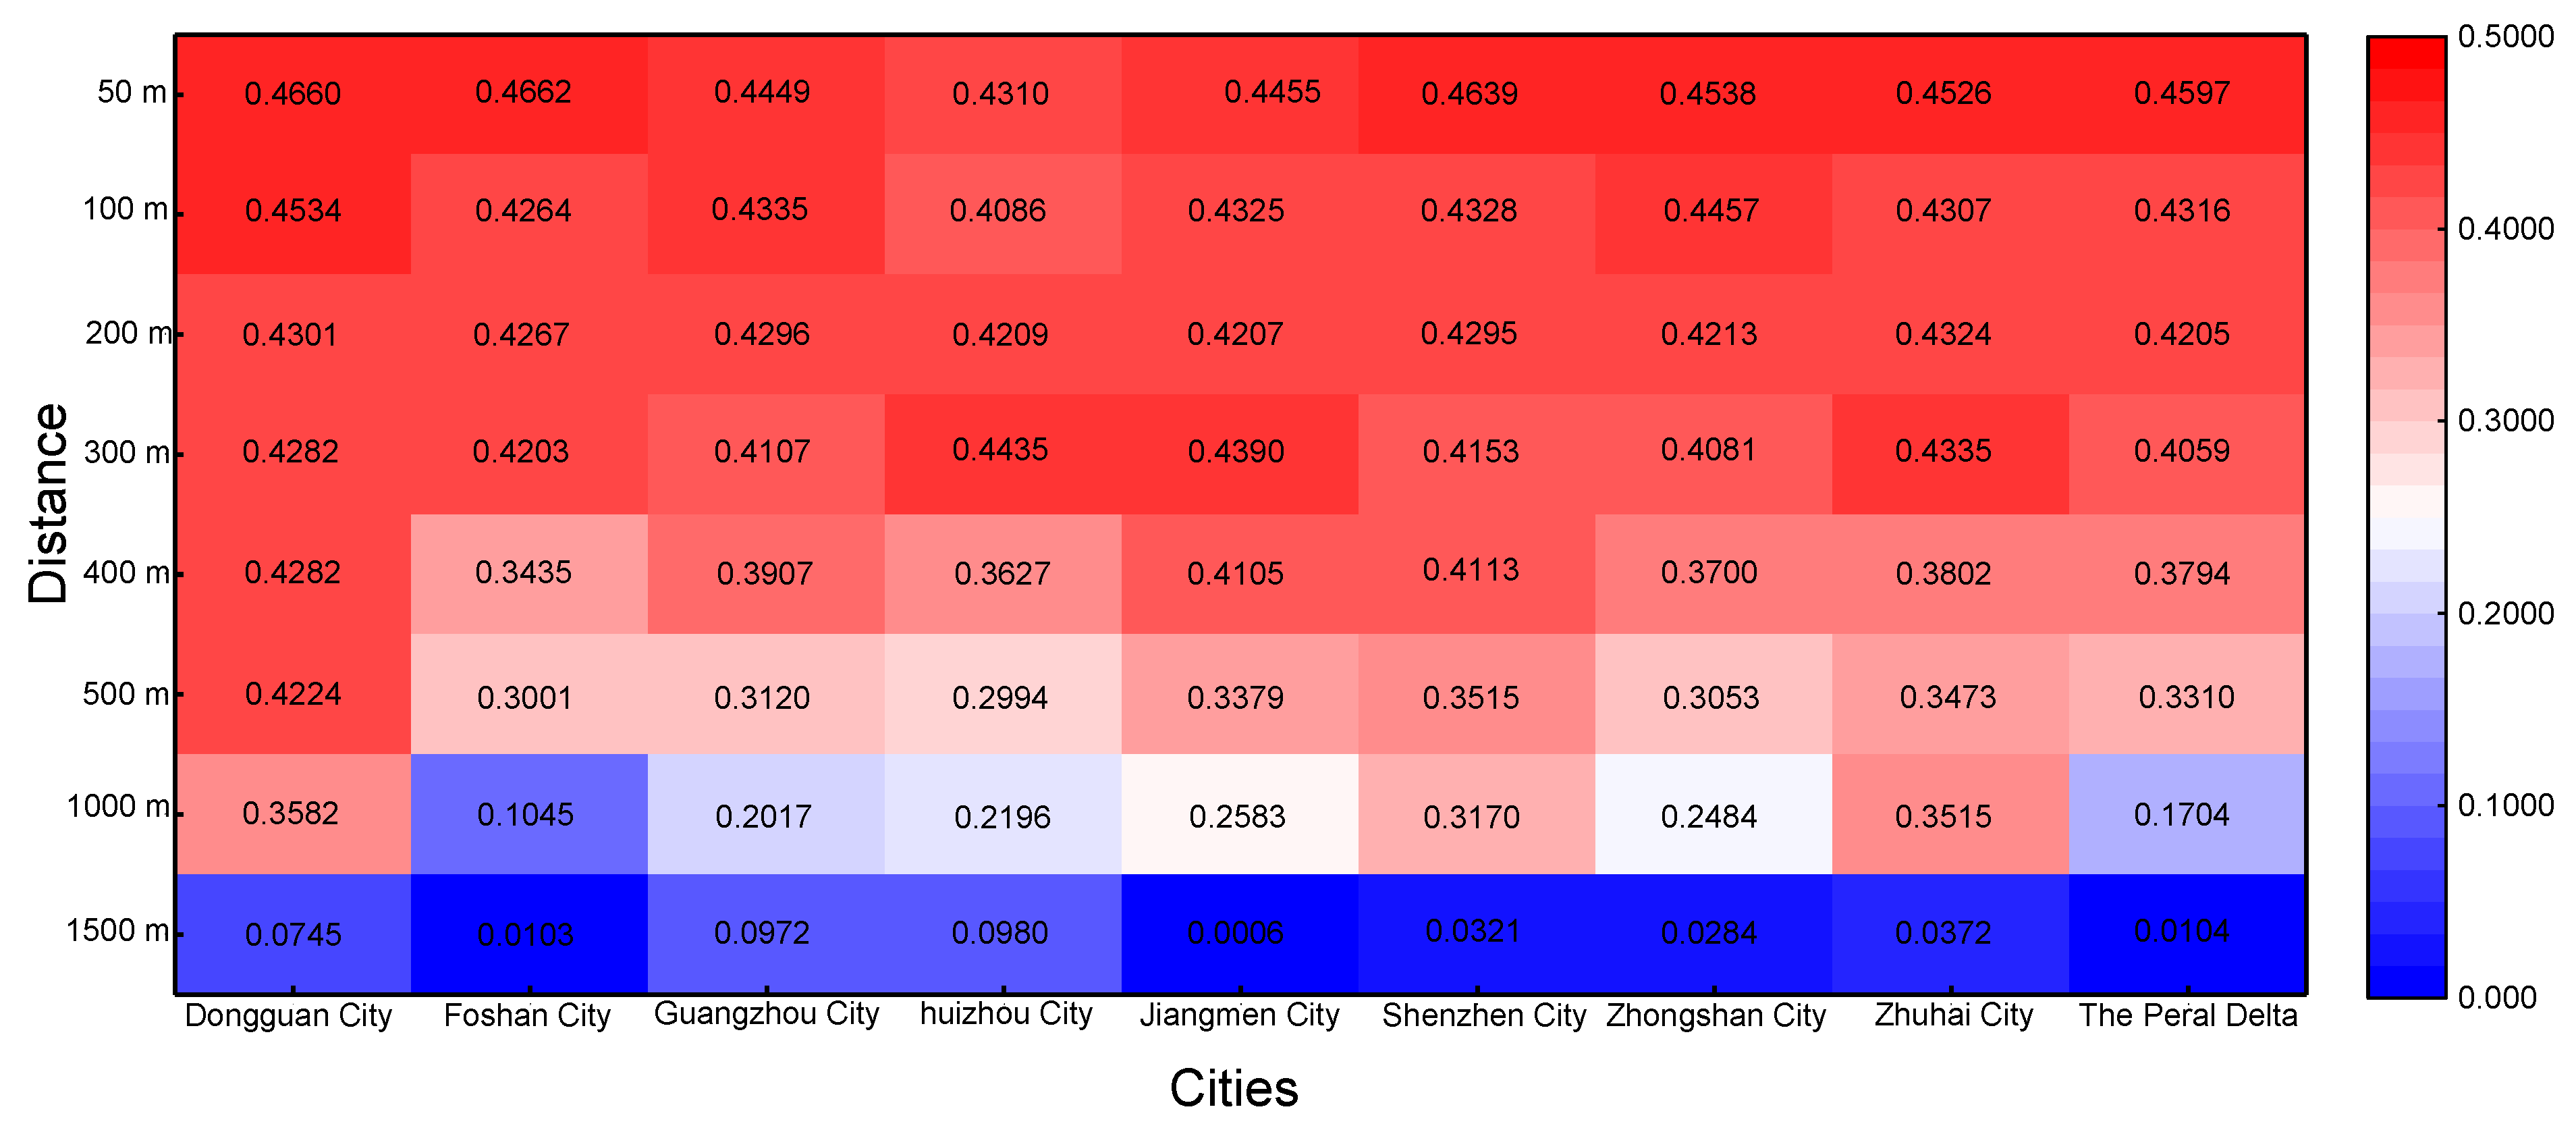
(5)
The effective range of urban ventilation corridors on the urban surface temperature and urban comfort was ≤1000 m. The greater the distance, the smaller the mitigation effect, which was also related closely to the increasing building density and decreasing vegetation coverage within the buffer zone. Therefore, for cities with large and dense building layouts, attention should be paid to the effective range of urban ventilation corridors on the urban thermal comfort and the changing trend in building density and vegetation coverage in the buffer zone. The layout of urban buildings should be planned rationally and should utilize the environmental function of urban ventilation corridors effectively to save the amount of energy consumed by air conditioning in the summer and to create a liveable urban environment.

Author Contributions

Methodology, writing—original draft preparation, W.L.; writing—review & editing, G.Z.; writing—review & editing, Y.J.; Conceptualization: J.W. All authors have read and agreed to the published version of the manuscript.

Funding

This work was supported by the Key research and development program of the Ministry of science and technology (2016YFB0500801), the National Natural Science Foundation of China (Grant No. 41971412), the Chinese Universities Scientific Fund (No. 2042019kf0209), and the National Natural Science Foundation of China (Nos. 51879196 and 51790533).

Informed Consent Statement

Informed consent was obtained from all subjects involved in the study.

Data Availability Statement

The data presented in this study are available on request from the corresponding author.

Acknowledgments

We appreciate Wanbo Liu and Lei Shi for the technical support. Informed consent was obtained from all subjects involved in the study.

Conflicts of Interest

The authors declare no conflict of interest.

Appendix A

Table A1. Locations of the urban ventilation corridors and urban cold sources in the Pearl River Delta.
Cities.Ventilation Corridor LocationThe Significance of Air Corridors
Dongguan CityG15- Shui Lianshan Road; Nanlang Road-S120-S29; S304-G9411-S20; Luming Road-S358, etc.Henggang Reservoir, Tongsha Reservoir, Saixi River, Tongsha Ecological Park, Dalingshan Forest Park, Niumianpu Reservoir, and Qingxi Forest Park provide green cooling to the urban ventilation corridors in Dongguan, alleviating the discomfort caused by high summer temperatures.
Foshan CityDong Piingshui Road–Shun Deshui RoadSanshui Forest Park, Xiqiao Mountain Forest Park, Tianhu Forest Park, and Yunyong Forest Park within the urban area, could serve as green cold air for the urban area.
S82 route
S267 route
S361 route
Dong Pingshui Road-–Pearl River route
S112 route
G105 route direction
Guangzhou CityPearl River TributaryBaiyun Mountain Scenic Area, Tianlu Lake Forest Park, Peak Scenic Area, Huluoshan Forest Park, Modaokeng Reservoir, Longrun Reservoir, and the Pearl River provide green cold air sources to the urban area to alleviate discomfort.
S41 direction
S118-G106 direction
G107 direction
Huizhou CityDongjiang directionDongjiang, Mudun Lake, Dongsha Park, Xizhijiang, Jinshan Lake Park, Jinshan Lake, Pinghu, Honghua Lake, etc. could provide cold air sources for summer monsoon in the urban area of Jiangmen.
Xinkaihe direction
To Xizhi River
S358 direction
G25 direction, etc.
Jiangmen CityG94-G26 directionZhangjiang, Xijiang, Busan Park, and Guifeng Mountain National Forest Park could provide cold air sources for the summer monsoon in the urban area of Jiangmen.
G94-G26 direction
Xijiang
Lianhe Road
Shenzhen CityG4-G33 directionForest parks, Tiegang Reservoir, Xili Reservoir, Shenzhen Wildlife Park, Shenzhen Xianhu Botanical Garden, Guangdong Wutongshan National Forest Park, etc. can all provide sources of green cold air during the introduction of urban monsoon.
010–G15 state road direction
S31-Fulong Road
G94-Meiguan Road direction
G15-S27 direction
S356-Yanba Highway direction
S356-Tongluo Path Reservoir-S359
Zhongshan CityS43-S356 directionThe Yangtze River Reservoir, Hengjing Reservoir, Jinzhong Reservoir, and Zimaling Park can provide green cold air sources for the summer monsoon.
S26–Qianshui lake direction
GAW Guangao highway direction–Jingzhu highway direction
S364-Fusha Town
Xiaolan watercourse–Qianshui lake direction
Jiya watercourse–Hengmen waterway direction path
Zhuhai CityJinfeng road–Fenghuang mountain tunnel directionQianwu Reservoir, Xijiang River, Sandiequan Scenic Area, Zhuxian Park, Shixi Scenic Area, and Jingshan Park can provide sources of green cold air for the summer monsoon in Zhuhai.
Guangao highway–S111–Zhenzhu park direction
G94–Zhuxian park direction
Huangyang sea–Ji Timen direction
S3211–Mu Touchong reservoir direction
Pearl
River Delta
Along the Pearl RiverThe Pearl River, Dalingshan Forest Park, Xijiang, etc. can provide sources of cold air for the summer monsoon.
S268-Shiqishan direction
Dongping watercourse–Shunde watercourse direction
G94-S22 direction

References

  1. Schreurs, M.A. From the Bottom Up Local and Subnational Climate Change Politics. J. Environ. Dev. 2008, 17, 343–355. [Google Scholar] [CrossRef]
  2. Estrada, F.; Botzen, W.J.W.; Tol, R.S.J. A global economic assessment of city policies to reduce climate change impacts. Nat. Clim. Chang. 2017, 7, 403–406. [Google Scholar] [CrossRef] [Green Version]
  3. UNDESA. UNDESA World Population Projected to Reach 9.8 Billion by 2050; UNDESA: New York, NY, USA, 2017. [Google Scholar]
  4. Giridharan, R.; Ganesan, S.; Lau, S.S.Y. Daytime urban heat island effect in high-rise and high-density residential developments in Hong Kong. Energy Build. 2004, 36, 525–534. [Google Scholar] [CrossRef]
  5. Sharma, K.V.; Khandelwal, S.; Sumit, N.K. Comparative Assessment of Vegetation Indices in Downscaling of MODIS Satellite Land Surface Temperature. Remote Sens. Earth Syst. Sci. 2020, 3, 156–167. [Google Scholar] [CrossRef]
  6. Qiao, Z.; Liu, L.; Qin, Y.; Xu, X.; Wang, B.; Liu, Z. The impact of urban renewal on land surface temperature changes: A case study in the main city of Guangzhou, China. Remote Sens. 2020, 12, 1–15. [Google Scholar] [CrossRef]
  7. Kuchcik, M. Mortality and thermal environment (UTCI) in Poland—long-term, multi-city study. Int. J. Biometeorol. 2020, 12, 1–13. [Google Scholar] [CrossRef] [PubMed]
  8. Peng, F.; Wong, M.S.; Nichol, J.E.; Chan, P.W. Historical GIS data and changes in urban morphological parameters for the analysis of urban heat islands in Hong Kong. Int. Arch. Photogramm. Remote Sens. Spat. Inf. Sci. ISPRS Arch. 2016, 41, 55–62. [Google Scholar] [CrossRef] [Green Version]
  9. Liu, Y.; Zhang, S.; Cheng, P.; Chen, P.; Wei, L.; Fang, X. Research and Application of Heat and Ventilation Environment Assessment for City Planning-A Case Study of Jinan Central Urban Area. Ecol. Environ. Sci. 2017, 03, 139–142. [Google Scholar] [CrossRef] [Green Version]
  10. Yao, L.; Xu, Y.; Zhang, B. Effect of urban function and landscape structure on the urban heat island phenomenon in Beijing, China. Landsc. Ecol. Eng. 2019, 15, 379–390. [Google Scholar] [CrossRef]
  11. Weng, Q. A remote sensing-GIS evaluation of urban expansion and its impact on surface temperature in the Zhujiang Delta, China. Int. J. Remote Sens. 2001, 22, 1999–2014. [Google Scholar] [CrossRef]
  12. Ge, Q.; Kong, Q.; Xi, J.; Zheng, J. Application of UTCI in China from tourism perspective. Theor. Appl. Climatol. 2015, 034, 2238–2246. [Google Scholar] [CrossRef]
  13. Ma, P.; Wang, S.-G.; Shang, K.-Z.; Li, T.-S.; Yin, L. The impact of meteorological comfort conditions on respiratory disease. China Environ. 2018, 38, 374–382. [Google Scholar] [CrossRef]
  14. Patz, J.A.; Campbell-Lendrum, D.; Holloway, T.; Foley, J.A. Impact of regional climate change on human health. Nat. Cell Biol. 2005, 438, 310–317. [Google Scholar] [CrossRef] [PubMed]
  15. Wicht, M.; Wicht, A.; Osinskaskotak, K. Detection of ventilation corridors using a spatio-temporal approach aided by remote sensing data. Eur. J. Remote Sens. 2017, 50, 254–267. [Google Scholar] [CrossRef] [Green Version]
  16. Hsieh, C.; Huang, H. Mitigating urban heat islands: A method to identify potential wind corridor for cooling and ventilation. Comput. Environ. Urban Syst. 2016, 57, 130–143. [Google Scholar] [CrossRef]
  17. Mak, C.M.; Yik, F.W.H. A Study of Natural Ventilation in a Kitchen Using Computational Fluid Dynamics (CFD). Archit. Sci. Rev. 2002, 45, 183–190. [Google Scholar] [CrossRef]
  18. Lukiantchuki, M.A.; Shimomura, A.R.P.; Da Silva, F.M.; Caram, R. Wind tunnel and CFD analysis of wind-induced natural ventilation in sheds roof building: Impact of alignment and distance between sheds. Int. J. Vent. 2020, 19, 141–162. [Google Scholar] [CrossRef]
  19. Wang, X.; Liu, F.; Xu, Z. Analysis of urban public spaces’ wind environment by applying the CFD simulation method: A case study in Nanjing. Geogr. Pannonica. 2019, 4, 308–317. [Google Scholar] [CrossRef] [Green Version]
  20. Tieleman, H.W.; Hajj, M.R.; Reinhold, T.A. Wind tunnel simulation requirements to assess wind loads on low-rise buildings. J. Wind Eng. Ind. Aerodyn. 1998, 74, 675–685. [Google Scholar] [CrossRef]
  21. Wong, M.S.; Nichol, J.E.; To, P.H.; Wang, J. A simple method for designation of urban ventilation corridors and its application to urban heat island analysis. Build. Environ. 2010, 45, 1880–1889. [Google Scholar] [CrossRef]
  22. Putri, L.K.R.; Maryono, M. Assessing Evacuation Route Against Mount Merapi Hazard By Using Least Cost Path Method in Mriyan-Boyolali, Indonesia. Iop Conf. 2018, 123, 1–7. [Google Scholar] [CrossRef] [Green Version]
  23. Buccolieri, R.; Hang, J. Recent Advances in Urban Ventilation Assessment and Flow Modelling. Atmosphere 2019, 10, 144. [Google Scholar] [CrossRef] [Green Version]
  24. Chen, L.; Ng, E. Quantitative urban climate mapping based on a geographical database: A simulation approach using Hong Kong as a case study. Int. J. Appl. Earth Obs. Geoinf. 2011, 13, 586–594. [Google Scholar] [CrossRef]
  25. Wong, M.S.; Nichol, J.E. Spatial variability of frontal area index and its relationship with urban heat island intensity. Int. J. Remote Sens. 2013, 34, 885–896. [Google Scholar] [CrossRef]
  26. Provencal, S.; Bergeron, O.; Leduc, R.; Barrette, N. Thermal comfort in Quebec City, Canada: Sensitivity analysis of the UTCI and other popular thermal comfort indices in a mid-latitude continental city. Int. J. Biometeorol. 2016, 60, 591–603. [Google Scholar] [CrossRef] [PubMed]
  27. Kong, Q.; Ge, Q.; Zheng, J. Spatio-temporal changes in extreme UTCI indices in China. Geogr. Res. 2017, 36, 1171–1182. [Google Scholar] [CrossRef]
  28. Tang, J.; Shen, S.; Hua, R.; Li, M. Assessment on summer comfort level of southern cities in China by UTCI. J. Meteorol. Sci. 2015, 35, 769–774. [Google Scholar] [CrossRef]
  29. Silva, T.J.V.; Hirashima, S.Q.S. Predicting urban thermal comfort from calibrated UTCI assessment scale - A case study in Belo Horizonte city, southeastern Brazil. Urban Clim. 2020, 36. [Google Scholar] [CrossRef]
  30. Chen, S.L.; Lu, J.; Yu, W.W. A quantitative method to detect the ventilation paths in a mountainous urban city for urban planning: A case study in Guizhou, China. Indoor Built Environ. 2017, 26, 422–437. [Google Scholar] [CrossRef]
  31. Zhang, Y. A Remote Sensing Monitoring and Analysis of Land Surface Temperature at Pearl River Delta in July 2005. Meteorological. 2006, 32, 23–27. [Google Scholar] [CrossRef]
  32. Jie, H.; Tao, L.; Guoqin, Z.; Xinhu, L. Comparative Analysis of the Urbanization Dynamic Characteristics of the Three Major Urban Agglomerations in China. J. Chem. Inf. Model. 1981, 53, 1689–1699. [Google Scholar]
  33. Du, Z.; Li, X. Growth or shrinkage: New phenomena of regional development in the rapidly-urbanising Pearl River Delta. Acta Geogr. Sin. 2017, 72, 1800–1811. [Google Scholar] [CrossRef]
  34. China Marine and Economic and Social Development Statistics Database. Beijing CSTIND Technology. Available online: https://data.cnki.net/trade/Yearbook/Single/N2018050234?z=Z007; http://www.cstind.com/index.php?m=content&c=index&a=show&catid=145&id=48 (accessed on 22 April 2021).
  35. Linfu, Z.; Shiyou, X.; Hua, Y.; Mingguo, M. The Response of Dynamic Change in Vegetation Coverage to Topography in Chongqing Based on MODIS EVI. J. Nat. Resour. 2007, 32, 342–347. [Google Scholar] [CrossRef]
  36. Wang, Q.; Zhang, M.; Wang, S.; Luo, S.; Wang, B.; Zhu, X. Extreme temperature events in Yangtze River Basin during 1962-2011. Acta Geogr. Sin. 2013, 68, 611–625. [Google Scholar] [CrossRef]
  37. Wang, Q.; Qin, Z.; Wang, F. Mono-window Algorithm for Retrieving Land Surface Temperature Based on Multi-source Remote Sensing Data. Geogr. Geo-Inf. Sci. 2012, 28, 28–30. [Google Scholar] [CrossRef]
  38. Qin, Z.; Zhang, M.; Karnieli, A.; Berliner, P. Mono-window algorithm for retrieving land surface temperature from Landsat TM6 data. Acta Geogr. Sin. 2001, 56, 81–91. [Google Scholar] [CrossRef]
  39. Zhang, W.; Mak, C.; Ai, Z.; Siu, W. A Study of the Ventilation and Thermal Comfort of the Environment Surrounding a New University Building under Construction. Indoor Built Environ. 2012, 4, 568–582. [Google Scholar] [CrossRef]
  40. Sheng, R.; Huiyuan, Z.; Taotao, J.; Haoyang, D. The spatial character of regional heat island in Pearl River Delta using MODIS remote sensing data. Geogr. Res. 2010, 29, 127–136. [Google Scholar] [CrossRef]
  41. Chappell, A.; Pelt, S.V.; Zobeck, T.; Dong, Z. Estimating aerodynamic resistance of rough surfaces using angular reflectance. Remote Sens. Environ. 2010, 114, 1462–1470. [Google Scholar] [CrossRef]
  42. Ghassoun, Y.; Lowner, M. Land use regression models for total particle number concentrations using 2D, 3D and semantic parameters. Atmos. Environ. 2017, 166, 362–373. [Google Scholar] [CrossRef]
  43. Fiala, D.; Havenith, G.; Brode, P.; Kampmann, B.; Jendritzky, G. UTCI-Fiala multi-node model of human heat transfer and temperature regulation. Int. J. Biometeorol. 2012, 56, 429–441. [Google Scholar] [CrossRef] [Green Version]
  44. Li, J.; Niu, J.; Mak, C.M.; Huang, T.; Xie, Y. Exploration of applicability of UTCI and thermally comfortable sun and wind conditions outdoors in a subtropical city of Hong Kong. Sustain. Cities Soc. 2020, 52, 101793. [Google Scholar] [CrossRef]
  45. Hoyt, D.V. Percent of Possible Sunshine and the Total Cloud Cover. Mon. Weather Rev. 1977, 105, 648–652. [Google Scholar] [CrossRef] [Green Version]
  46. Kong, Q.; Ge, Q.; Xi, J.; Zheng, J. Thermal comfort and its trend in key tourism cities of China. Geogr. Res. 2015, 34, 2238–2246. [Google Scholar] [CrossRef]
  47. Blazejczyk, K.; Broede, P.; Fiala, D.; Havenith, G.; Holmer, I.; Jendritzky, G.; Kampmann, B.; Kunert, A. Principles of the New Universal Thermal Climate Index (UTCI) and its Application to Bioclimatic Research in European Scale. Misc. Geogr. 2010, 14, 91–102. [Google Scholar] [CrossRef] [Green Version]
  48. Shartova, N.; Shaposhnikov, D.; Konstantinov, P.; Revich, B. Universal thermal climate index (UTCI) applied to determine thresholds for temperature-related mortality. Health Risk Anal. 2019, 83–93. [Google Scholar] [CrossRef]
  49. Pappenberger, F.; Jendritzky, G.; Staiger, H.; Dutra, E.; Di Giuseppe, F.; Richardson, D.S.; Cloke, H.L. Global forecasting of thermal health hazards: The skill of probabilistic predictions of the Universal Thermal Climate Index (UTCI). Int. J. Biometeorol. 2015, 59, 311–323. [Google Scholar] [CrossRef] [Green Version]
  50. Zhuo, H.; Hui, C.; Hua, T. Research on the Heat Wave Index. Meteorol. Mon. 2011, 37, 345–351. [Google Scholar] [CrossRef]
  51. Perkins, S.E.; Alexander, L.V. On the Measurement of Heat Waves. J. Clim. 2013, 26, 4500–4517. [Google Scholar] [CrossRef]
  52. Nairn, J.; Fawcett, R. The Excess Heat Factor: A Metric for Heatwave Intensity and its Use in Classifying Heatwave Severity. Int. J. Environ. Res. Public Health 2014, 12, 227–253. [Google Scholar] [CrossRef] [Green Version]
  53. Wang, B.; Yi, Y.K. Developing an adapted UTCI (Universal Thermal Climate Index) for the elderly population in China’s severe cold climate region. Sustain. Cities Soc. 2021, 69, 102813. [Google Scholar] [CrossRef]
  54. Linna, Z. The influence of gauge density on the interpolation of critical and antecedent effective precipitation that triggered the debris flow. Geogr. Res. 2011, 30, 1237–1243. [Google Scholar]
  55. Balbi, M.; Petit, E.J.; Croci, S.; Nabucet, J.; Georges, R.; Madec, L.; Ernoult, A. Ecological relevance of least cost path analysis: An easy implementation method for landscape urban planning. J. Environ. Manage. 2019, 244, 61–68. [Google Scholar] [CrossRef] [PubMed]
  56. Xu, F.; Yin, H.W.; Kong, F.H.; Xu, J.G. Developing ecological networks based on mspa and the least-cost path method: A case study in bazhong western new district. Acta Ecol. Sin. 2015, 35, 6425–6434. [Google Scholar] [CrossRef]
  57. Peng, J.; Jia, J.; Liu, Y.; Li, H.; Wu, J. Seasonal contrast of the dominant factors for spatial distribution of land surface temperature in urban areas. Remote Sens. Environ. 2018, 215, 255–267. [Google Scholar] [CrossRef]
  58. Blazejczyk, K.; Epstein, Y.; Jendritzky, G.; Staiger, H.; Tinz, B. Comparison of UTCI to selected thermal indices. Int. J. Biometeorol. 2012, 56, 515–535. [Google Scholar] [CrossRef] [PubMed] [Green Version]
  59. Zhou, Y. Investigation of the Distribution Patterns of Atmospheric Aerosol Optical via Remote Sensing over the Yangtze River Delta; Nanjing University Information Science & Technology: Nanjing, China, 2014. [Google Scholar]
  60. Mu, S.; Li, J.; Chen, Y.; Gang, C.; Zhou, W.; Ju, W. Spatial differences of variations of vegetation coverage in Inner Mongolia during 2001-2010. Acta Geogr. Sin. 2012, 67, 1255–1268. [Google Scholar] [CrossRef]
  61. Feyisa, G.L.; Dons, K.; Meilby, H. Efficiency of parks in mitigating urban heat island effect: An example from Addis Ababa. Landsc. Urban Plan. 2014, 123, 87–95. [Google Scholar] [CrossRef]
  62. Zhang, X.Y.; Jiang, C.; Sun, J.X.; Zhou, M.F. Spatio-temporal variations and influencing factors of thermal comfort at different elevations. Chin. J. Appl. Ecol. 2018, 29, 2808–2818. [Google Scholar] [CrossRef]
  63. Wang, P.; Liu, T.; Yang, G.; Du, P. Spatial and temporal variation of ozone concentration in major cities of China. Remote Sens. Inf. 2019, 34, 121–127. [Google Scholar] [CrossRef]
  64. Zhang, M. Analysis of the Temporal and Spatial Variation of Evapotranspiration and its Driving Factors in Arid and Semi-Arid Region of China from 2000 to 2015; Changan University: Xi’an, China, 2019. [Google Scholar]
  65. Miaomiao, L.; Bingfang, W.; Changzhen, Y.; Weifeng, Z. Estimation of Vegetation Fraction in the Upper Basin of Miyun Reservoir by Remote Sensing. Resour. Sci. 2004, 26, 153–159. [Google Scholar] [CrossRef]
  66. Jinye, L.; Lei, Z.; Bingfang, W.; Xinhui, M. Study on Extracting Building Density and Floor Area Ratio Based on High Resolution Image. Remote Sens. Technol. Appl. 2007, 22, 309–313. [Google Scholar] [CrossRef]
  67. Wang, Y.; Zhang, Y.; Ding, N.; Qin, K.; Yang, X. Simulating the Impact of Urban Surface Evapotranspiration on the Urban Heat Island Effect Using the Modified RS-PM Model: A Case Study of Xuzhou, China. Remote Sens. 2020, 12, 578. [Google Scholar] [CrossRef] [Green Version]
  68. Chenhui, D.; Hongying, B.; Shan, G.; Rongjuan, L.; Xinping, M.; Xiaoyue, H.; Qing, M. Spatial-temporal Variation of the Vegetation Coverage in Qinling Mountains and Its Dual Response to Climate Change and Human Activities. J. Nat. Resour. 2018, 33, 425–438. [Google Scholar] [CrossRef]
  69. Chao, R.; Chao, Y.; Kwan, H.C.; Yung, N.Y. A Study of Air Path and Its Application in Urban Planning. Urban Plan. Forum 2014, 161, 529–538. [Google Scholar]
Figure 2. Dongguan building data map.
Remotesensing 13 01783 g002
Figure 3. The overall data processing flow and research framework.
Remotesensing 13 01783 g003
Figure 4. Frontal area index calculation diagram [42].
Remotesensing 13 01783 g004
Figure 5. Violin chart of temperature data and wind direction radar chart of the Pearl River Delta from 1987 to 2017. (a) is the annual average temperature at 23 weather stations in the Pearl River Delta; (b) is wind direction radar chart from June to September at 23 weather stations in the Pearl River Delta.
Remotesensing 13 01783 g005
Figure 6. Construction of urban ventilation corridor in the Pearl River Delta.
Remotesensing 13 01783 g006
Figure 7. The spatial differentiation of thermal comfort in the Pearl River Delta.
Remotesensing 13 01783 g007
Figure 8. Correlation between the FAI and surface temperature T under buffer zones in urban ventilation corridors.
Remotesensing 13 01783 g008
Figure 9. Correlation between the FAI and SUTCI in the buffer zones of urban ventilation corridors.
Remotesensing 13 01783 g009
Figure 10. (a) Building density, (b) vegetation coverage, and (c) water body ratio variations with buffer distance.
Remotesensing 13 01783 g010
Table 1. Data sources and description.
Type of DataData FeaturesData SourcesTime
Remote sensing image dataLandsat8; raster format; 7 scenes with cloud cover less than 1.0The United States Geological Survey (USGS) official website2017.5.30–2017.10.30
Building dataVector dataShui Jing Zhu Universal Map Downloader 2017
ECMWF weather forecast data (wind speed, relative humidity, total cloud coverage)Raster formatEuropean Centre for Medium-Range Weather Forecasts 2017
Wind speed, wind direction, sunshine percentage, temperature, relative humidity (23 weather stations, as shown in Figure 1)Point DataChina Meteorological data Network1987–2017
MOD13Q1Raster formatLevel-1 and Atmosphere Archive & Distribution System Distributed Active Archive Centre (LAADS DAAC) [35]2017.6.30–2017.9.30
Table 2. Classification of the degrees of the UTCI human comfort temperatures.
UTCI Range (°C)Degree of ComfortUTCI Range (°C)Degree of Comfort
>46Extreme heat stress0 to 9Slight cold stress
38 to 46Very strong heat stress−13 to 0Moderate cold stress
32 to 38Strong heat stress−27 to −13Strong cold stress
26 to 32Moderate heat stress<−40 to −27Very strong cold stress
9 to 26No thermal stress<−40Extreme cold stress
Table 3. Correlation analysis of various factors and the UTCI.
Correlation AnalysisPearson Correlation Coefficient
Wind speed measured by the weather station and ECMWF wind speed0.8966
Temperature measured by the weather station and Landsat8 inversion temperature0.9086
Relative humidity measured by the weather station and ECMWF relative humidity0.9234
Using the difference between the percentage of sunshine and 100% to obtain the relative radiant temperature of the weather station and the relative radiant temperature of ECMWF replaced by the total cloud cover0.8977
UTCI calculated by weather station data (WUTCI) and UTCI calculated by ECMWF and Lansat8 substitution factor (SUTCI)0.8959
Publisher’s Note: MDPI stays neutral with regard to jurisdictional claims in published maps and institutional affiliations.

