Abstract
With the recent developments of unmanned aerial vehicle (UAV) remote sensing, it is possible to monitor the growth condition of trees with the high temporal and spatial resolutions of data. In this study, the daily high-throughput RGB images of pear trees were captured from a UAV platform. A new index was generated by integrating the spectral and textural information using the improved adaptive feature weighting method (IAFWM). The inter-relationships of the air climatic variables and the soil’s physical properties (temperature, humidity and conductivity) were firstly assessed using principal component analysis (PCA). The climatic variables were selected to independently build a linear regression model with the new index when the cumulative variance explained reached 99.53%. The coefficient of determination (R2) of humidity (R2 = 0.120, p = 0.205) using linear regression analysis was the dominating influencing factor for the growth of the pear trees, among the air climatic variables tested. The humidity (%) in 40 cm depth of soil (R2 = 0.642, p < 0.001) using a linear regression coefficient was the largest among climatic variables in the soil. The impact of climatic variables on the soil was commonly greater than those in the air, and the R2 grew larger with the increasing depth of soil. The effects of the fluctuation of the soil-climatic variables on the pear trees’ growth could be detected using the sliding window method (SWM), and the maximum absolute value of coefficients with the corresponding day of year (DOY) of air temperature, soil temperature, soil humidity, and soil conductivity were confirmed as 221, 227, 228, and 226 (DOY), respectively. Thus, the impact of the fluctuation of climatic variables on the growth of pear trees can last 14, 8, 7, and 9 days, respectively. Therefore, it is highly recommended that the adoption of the integrated new index to explore the long-time impact of climate on pears growth be undertaken.
1. Introduction
Climate change has induced variations in temperature, precipitation, and solar radiation and aggregated variables, such as chilling and degree-day units with high impact on the vegetation growth and phenology shifts, and changes of growing degree days [1,2,3,4]. Climate change may significantly affect the phenology of vegetation, although there remains great uncertainty in spatial patterns and different species. Vegetation is very sensitive to these climatic changes and even an increase of 1 °C may lead to the advance and the delay of several days for leaf on and leaf off, respectively [5,6,7]. Thus, investigating the impact of climatic variables on the growth of vegetation is not only to investigate to what extent has the climate affected the growth of vegetation, but also to understand how the vegetation responds to these changes and to make effective adaptive measures. China contains the most plentiful Pyrus germplasm resources in the world, being the world’s leading country in pear (Pyrus) production, accounting for 65.7% of world production and 72.3% of the world’s growing area. Pears rank third among fruit industries in China, after oranges and apples. Therefore, timely monitoring of the growth condition of pear trees is of vital importance [8]. Since good growth of the pear trees is very important to guarantee agricultural production, thus, timely monitoring of the growth condition of the pear trees is of vital importance.
Currently, the field-scale destructive sampling method (FDSM) is a very precise approach for investigating the growth condition of pear trees. However, it is also very labor-intensive and time-consuming [9]. The Earth Observation Satellite (EOS) providing multi-spectral images can be applied to monitor the growth status of vegetations. However, EOS is limited by clouds, the specific revisiting periods, and the coarse spatial and spectral resolutions. In recent years, there have been important developments in remote sensing technology and sensors in terms of mass reduction, cost and operability (e.g., preprogramed flights) with simplicity of operation, which make use of unmanned aerial vehicles (UAV) or drones viable for large-scale agricultural applications [10,11,12]. Nowadays, UAVs present an affordable means to obtain images with very high spatial (centimeter-level) resolution, as well as a high temporal resolution acquisition adequate to monitor the various phases of the crop development throughout the growing season [13,14]. This programable, high spatial and temporal data are valuable data for high throughput plant phenotyping, which is the description of the observable properties or behavior of plants [15]. Therefore, drones equipped with common RGB cameras provide a great opportunity for advanced crop characterization since these optical sensors are comparatively inexpensive [16,17]. However, it is clear that there is still a considerable gap between the data and information provided by RGB cameras and the great potential agricultural-phenotyping offered by UAVs data is still yet to be fully realized [18]. The high-throughput images from UAV contain plenty of spectral and textural information that can be applied for image classification as well as for the detection of growth change and damage, among others, which is paramount to support efficient and sustainable agronomic practices in line with precision agriculture. In remote sensing domains, PCA is commonly used to transfer the multilayers of remote sensing data into fewer layers with almost the same useful information for knowledge extraction [19,20,21]. PCA can also be applied to determine the weight of multiple factors and to rank the importance of each influencing factor [22].
The spectral information can be extracted using the spectral vegetation indices (VIs) and the textural properties (TPs) can be calculated from the gray level co-occurrence matrix (GLCM). The VIs were commonly adopted for their convenience of usage while the TPs have only raised limited interest for vegetation monitoring. Zhang et al. calculated some commonly applied VIs, based on the UAV RGB images and the vegetation information was extracted with the iterative method based on optimal threshold [23]. Li et al. assessed the crop lodging using the object-based classification, and the feature selection of spectral information was extracted using various VIs calculated from RGB images [24]. Bendig et al. integrated the selected VIs and plant height information by developing the allometric model to estimate biomass in a summer barley experiment [25]. Lu et al. combined the coverage of the canopy, the plant height, and VIs extracted from RGB images captured from the UAV platform to predict the nitrogen concentration in the leaves of summer maize [26]. The TPs are an important implementation for the VIs, and the TPs contain relevant information for the improvement of the VIs. Then TPs are the dominating indicator for image classification and object detection especially when the VIs are saturated [27,28,29]. Therefore, there is a need to generate improved indices for integrating the spectral and textural information in remote sensing domains.
In this study, the daily high-throughput RGB images from the UAV platform were captured concerning the pear trees in an orchard. The daily sequence of RGB images were processed and analyzed with the climatic variables. This work focuses on addressing the following questions: (1) how to combine spectral and textural information to monitor the growth of pear trees; (2) how to monitor the growth of pear trees using the new index; and (3) how to explore the effects of fluctuation in climatic variables on the pear trees’ growth.
2. Materials and Methods
2.1. Study Area
The study area is located in Nanpi County, Cangzhou city, Hebei province, North China Plain (NCP), China (38.00° N, 116.40° E) (Figure 1). The NCP is one of China’s major food production regions with irrigated agriculture [30,31]. Meanwhile, fruit and vegetables also accounted for a large proportion of the agricultural production in this region. This study was carried out in a pear orchard of 28.81 ha that included three pear cultivars (Xinliqi, Yuluxiang, and Huangjinyoupan) (Figure 1). The trees were planted during 2018 and were well managed by the Agricultural and Rural Bureau (ARB) of Nanpi County.
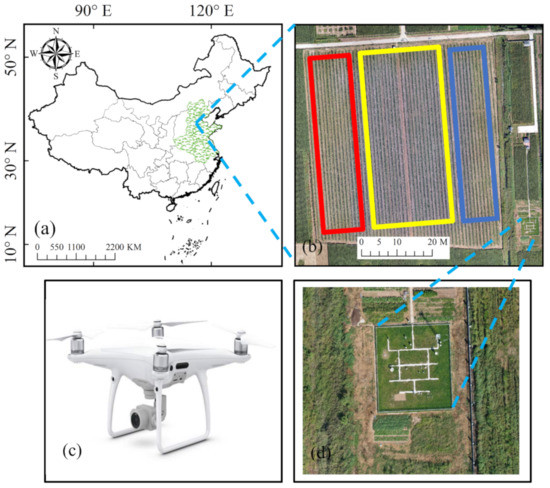
Figure 1.
The geographic location of the study area in China with a UAV-RGB image showing the studied orchard. Note: (a) the green shaded area is the North China Plain (NCP); (b) the red, yellow, and blue color boundaries represent the cultivars of Xinliqi, Yuluxiang, and Huangjinyoupan, respectively; (c) is the UAV platform for data collection; and (d) is the standard national weather station of Nanpi.
The study area is a typical orchard located on the NCP, and the mean annual temperature of this region is 12 °C with the average annual precipitation being 500 mm (http://he.cma.gov.cn/cz/, accessed on 5 March 2021). The soil of this pear orchard is representative of the NCP, containing three layers: A-AB-BK. The A, AB, and BK layers represent the depth from 0 to 20, 21 to 48, and 49 to 100 cm of the soil and these data were obtained from the National Earth System Science Data Center (NESSDC), (http://soil.geodata.cn/, accessed on 5 March 2021).
2.2. Data Collection
2.2.1. Data Collection and Preprocessing
The DJI Phantom 4 Pro V 2.0 was selected as the data collection platform for acquiring the RGB images to monitor the growth condition of pear trees in the orchard. The resolution of the image was 5472 × 3648 pixels with the focal lens being 8.8 mm. The flight altitude was set to 75 meters and the flight speed was strictly controlled as 7.5 m/s within the commercial software Altizure (V4.7.0.196, https://www.altizure.com, accessed on 5 March 2021, Shenzhen, China). Furthermore, the forward and side overlap of flights with each being 80% and 70% to ensure the high spatial resolution. The daily RGB images of UAV were captured and collected from 23rd August (235, day of year, DOY) to 6th September (249, DOY) including 15 different dates in the year 2020. The single images were processed within Pix4D Mapper (Lausanne, Switzerland) under a standard procedure, and the spatial resolution of the images was 2.1 cm. The tagged image format files (TIF) were generated and saved for each date and the image was clipped using the same regions of interest (ROI) within ENVI 5.3 (https://www.l3harrisgeospatial.com, accessed on 5 March 2021, Broomfield, CO, USA). Thus, the 15 mosaiced images of the same region were obtained and applied for further analysis.
2.2.2. Soil-Climatic Data
The daily temperature and humidity in the air and the soil were recorded and obtained from the national weather station of Nanpi (code 54719) that was managed by the China Meteorological Data Service Center (CMDSC, http://data.cma.cn/en, accessed on 5 March 2021). The hourly climatic data containing the temperature (°C) in the air (average temperature, maximum temperature, and minimum temperature), and soil data at 20, 40, 60 cm depth of temperature (°C), humidity (%), conductivity (us/cm) were obtained from this weather station. These climatic data were processed under a standard procedure and the daily climatic variables were obtained for further analysis.
2.3. Method
2.3.1. Vegetation Index and Grey Level Co-Occurrence Matrix
The spectral and textural information were extracted using the VI and the properties of GLCM through the RGB images, respectively. To make the results comparable in quantitative remote sensing, the original RGB bands were each normalized from 0 to 1 by dividing the sum of original red, green and blue bands. The images of the studied orchard represent an anisotropic cover (or discontinuous) with complex mix reflectance from both the row and inter-row of pear trees (grass and background of soil) (Figure 1). Thus, to mitigate the strong reflectance differences, the pixels in the images were classified into green pixels (rows of pear trees) and non-green pixels (inter-row grass and background of soil) using the difference of vegetation index as referred to in [32]. To be more specific, the difference of excess green (EGVI = 2G − R − B) and excess red (ERVI = 1.4 × R − B) were calculated for the image of each date [33]. The pixels of positive value were defined as green pixels (pear trees) and those of negative value were defined as nongreen pixels (soil), respectively. Thus, the binary images were made based on the normalized RGB image using this method for each date. Then, the commonly applied VIs were calculated based only on the green pixels of images for each date using the formulations presented in Table 1.

Table 1.
Spectral vegetation indices used for monitoring the growth of vegetation.
The texture is one of the most important characteristics for knowledge extraction in digital image processing domains [38,39,40]. The gray level co-occurrence matrix (GLCM) functions, which characterize the texture of an image by calculating how often pairs of pixels with specific values and in a specified spatial relationship occur in an image, was used to create a GLCM, to extract the contrast, correlation, energy, and homogeneity of images [24]. The normalized RGB image of each subsample image was converted into the grey-scale levels of the image. The GLCM of each date was calculated using these grey-scale levels of images. The textural information of an image can be derived using the properties of contrast, correlation, energy, and homogeneity extracted from GLCM, using the formulations presented in Table 2.
Table 2.
Formulations of the commonly used textural features based on the gray level co-occurrence matrix (GLCM).
To make sure the reliable results of the analysis, the VI and GLCM were extracted and shown using all three cultivars together, and independently, a single cultivar. The temporal dynamic changes of VI were assessed and compared with each other. If there was little difference in the VI, and then a further analysis of the impacts of the climatic variables on the growth of pear trees was conducted, based on VI and GLCM calculated from the whole image containing all three cultivars of pear trees. If there was much difference in VI and GLCM, further analysis was independently conducted for the three cultivars of pear trees.
2.3.2. The New Index Based on Spectral and Textural Data
The improved adaptive feature weighting method (IAFWM) automatically measures the distance and adjusts the weights of spectral and textural features [41,42,43]. The weighting factors of spectral and textural information were confirmed using the IAFWM, and thus, the new index was generated, based on the updated weighting factors. The whole process can be divided into four sections:
- (1)
- Connecting the variables of six VIs (spectral information) and four features (textural information) of GLCM in series.
- (2)
- Calculating the mean and variance values of each variable, and measuring the standardized distance of every two variables using the following equation:where, is the standardized distance, and are the mean values, and and are the standard deviation of each variable, respectively.
- (3)
- Calculating the sum of the standardized distance between every two features and the weighting factors using the total of spectral and texture features in proportion. The detailed procedure is as follows:Assuming the feature expressions of all variables are , and m and n are the numbers of spectral and textural information, respectively. If and are the weighting factors of spectral information and textural information, then the following formulations can be obtained:where, the is the standardized distance of the kth feature between i and j. The new index by integrating features in series can be expressed using updated Equation (5). The new index was generated and normalized (0 to 1), and the sequence was adopted for further analysis.
2.3.3. Impact of Climatic Variables on the Pear Trees’ Growth
Before assessing the impacts of climatic variables on the growth condition of pear trees, the PCA was applied to identify the main influencing climatic factors, both in soil and in the air. The detailed procedures included the following steps: (1) removing the average value separately for each sample; (2) calculating the covariance matrix; (3) calculating the eigenvalues and eigenvectors of the covariance matrix; (4) sorting the eigenvectors in descending order with respect to their eigenvalues to form the transformation matrix; (5) obtaining the principal components through the transformation matrix. In this study, the PCA assessed the inter-relationships of the climatic variables and the dimension whose cumulative variance was greater than 99.53% was selected as the feature after PCA dimensionality reduction.
The confirmed main influencing climatic variables using PCA were independently applied to build a linear relationship with the new index generated using IAFWM. The coefficients of linear regression analysis were separately obtained and compared with each other. The maximum value of the coefficient of determination (R2) with the corresponding soil-climatic variable was confirmed as the main (dominating) influencing factor. The dominating soil-climatic variables that influence the growth condition of pear trees can be confirmed using this method. Therefore, the R2 between the climatic variables in the air, climatic variables in the soil, and the new index could be obtained and compared with each other.
For assessing the effects of fluctuation of climatic variables on the growth condition of pear trees, the first date of soil-climatic variable observation varies from 214 to 235 DOY with the length each being 15 days (235 to 249 DOY). Thus, the data of the soil-climatic variable was a sequence that was the same length as the new index. Then, the linear regression analysis was built between the independent changing soil-climatic variables and the new index. Through this process, the sliding window (SW) was applied, and a one-day interval was set as the sliding step. The temporal changes of coefficients using linear regression analysis between the soil-climatic variables and the new index could thus be obtained. There were, in total, 22 kinds of coefficients as the first date of climatic variable varied from 214 to 235 DOY with each step being one day to confirm the most optimal DOY that was most correlated with the growth condition of pear trees (new index). The maximum absolute value of the linear regression coefficient was confirmed for each soil-climatic variable and the corresponding DOY was confirmed. Therefore, the effects of fluctuation of soil-climatic variables on the growth of pear trees can be detected using the maximum absolute value and the corresponding DOY. Since there were four types of soil-climatic data (air temperature, soil temperature, soil humidity, and soil conductivity), thus, the averages of the coefficients of the different types were calculated and compared with each other.
3. Results
3.1. Changes in Spectral and Textural Information during the Monitoring Period
Single images acquired from the UAV platform concerning the pear trees from 23rd August (235, DOY) to 6th September (249, DOY) were obtained and processed using the method introduced in Section 2.2.1. The sequence of 15 mosaic images of different dates were obtained and four mosaic images acquired on 238, 241, 245, and 248 DOY are shown in the upper part in Figure 2a. The binary images were calculated for the mosaic image of each date and the green pixels were extracted using the index introduced in Section 2.3.1. The binary images are shown in the lower part of the original image in Figure 2b.
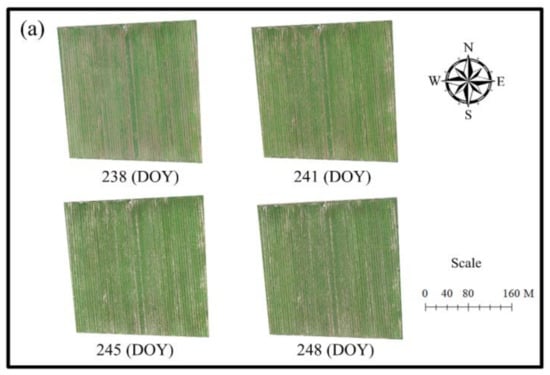
Figure 2.
The mosaic images of pear trees acquired on 238, 241, 245, and 248 DOY, respectively. Note: (a) represents the original RGB images; (b) represents the binary images corresponding to the RGB images.
The original bands were first normalized within 0 to 1 using the method introduced in Section 2.3 Method. The spectral information was extracted using the equations introduced in Table 1, based on these normalized images. The VIs calculated, based on the whole image including three cultivars of pear trees, were shown in a different color for each date during the period from 235 to 249 DOY (Figure 3). It can be observed that the trend of all VIs using the whole image including three cultivars was similar, of which the values of the red green blue vegetation index (RGBVI) and the gray were the highest and lowest, respectively. In order to eliminate the uncertaintities that arise from the different cultivars of pear trees, the VI was calculated, based on the independent three cultivars of pear trees and is shown in Appendix Figure A1. Compared with the dynamic changes of VI in Figure 2 and Figure A1, it can be noted that there was little difference in the VI calculated, based on the three cultivars of pear trees. Thus, further analysis was based on the VI calculated from the whole image with all three cultivars of pear trees included.
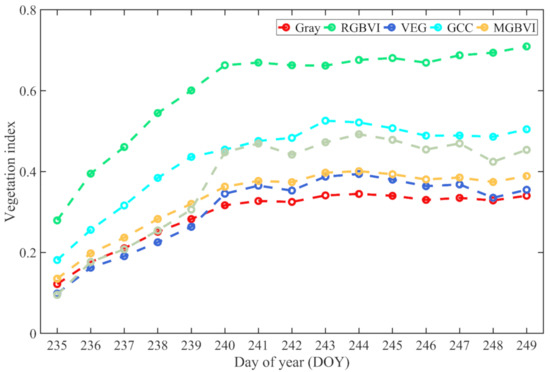
Figure 3.
The dynamic changes in vegetation index using the whole image including three cultivars of pear trees during the period from 235 to 249 DOY, respectively.
The textural information was extracted based on the GLCM calculated, based on the image of each date using the Equations presented in Table 2. The four daily properties containing contrast, correlation, energy, and homogeneity from the whole image were extracted using the GLCM for the period from 235 to 249 DOY (Figure 4). It can be seen that the correlation and the energy dramatically varied during the observation period, while the contrast and the homogeneity changed little. The four properties containing contrast, correlation, energy, and homogeneity were also independently calculated for the three cultivars of pear trees.
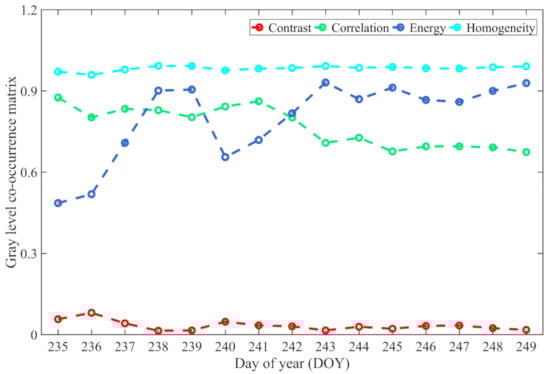
Figure 4.
Variation in four forms of textural information during the observations from 235 to 249 DOY.
3.2. The Linear Regression between Soil-Climatic Variables and the New Index
Using the improved adaptive feature weighting method (IAFWM), the weighting factors using the total of spectral and texture features in proportion were obtained. The ratio between spectral and texture features was set as 5.616. Based on the ratio, the new index was generated by multiplying all spectral information by 5.616 and adding the original textural information. Then the new index was normalized by dividing the largest value in the new index (Figure 5).
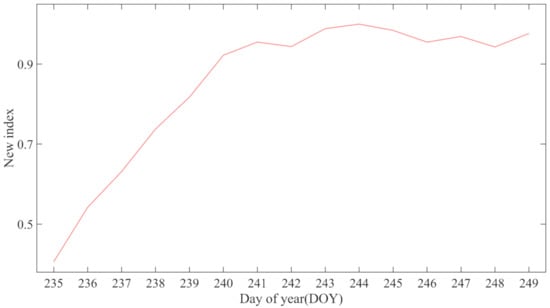
Figure 5.
Variation in the new index (normalized by dividing the largest value in the new index) during the observations from 235 to 249 DOY.
The climatic variables, including the temperature (°C) in the air and temperature (°C), humidity (%), and conductivity (us/cm) at 20, 40, 60 cm depth in the soil, were analyzed using the PCA method introduced in Section 2.3.3. The variance explained with the corresponding numbers of climatic variables using PCA are shown in Figure 6. There were 4 variables in the air and 9 variables in the soil, respectively. It can be noted that when the number of variables reached 7, the variance was explained by 99.21% of the total components. The ranking was as follows: soil humidity in 60 cm, soil conductivity in 40 cm, soil humidity in 40 cm, soil conductivity in 20 cm, soil conductivity in 60 cm, soil temperature in 60 cm, and soil temperature in 40 cm, since the climatic variables of the different depths in the soil all contained three properties: humidity, conductivity, and temperature. From the variance explained, when the number of variables reached 11 (9 variables in the soil and minimum temperature and humidity in the air), the variance explained 99.53% compared with the original dataset. Since the climatic variables in the air were meant to be investigated, thus only the two variables of minimum temperature and humidity in the air were added. Therefore, further analysis was based on the minimum temperature and humidity in the air, and all the variables in the soil.
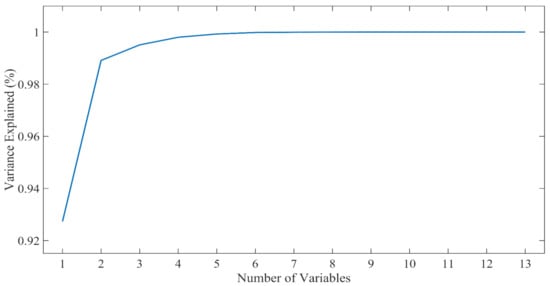
Figure 6.
The variance explained with the corresponding numbers of climatic variables.
The linear regression analysis was separately applied between the selected climatic variables in the air and the new index. The coefficients of the climatic variables of minimum temperature and humidity in the air were 0.046 and 0.120, respectively. The linear regression analysis was also separately applied between the climatic variable in the soil and the new index. The R2 between the climatic variables of temperature and soil humidity, and conductivity in the soil (20, 40, and 60 cm) and the new index were calculated and shown (Figure 7). It can be observed that the coefficients of temperature and humidity became larger with the increase in the depth of soil. However, the R2 of conductivity increased from 20 to 40 cm depth of soil, and then decreased to 60 cm depth of soil. It also can be concluded that humidity and conductivity were the dominating influencing factors for the growth of pear trees. Besides, the coefficients of climatic variables in soil were commonly larger than those of climatic variables in the air. Thus, the climatic variables in the soil may be more important than those in the air.
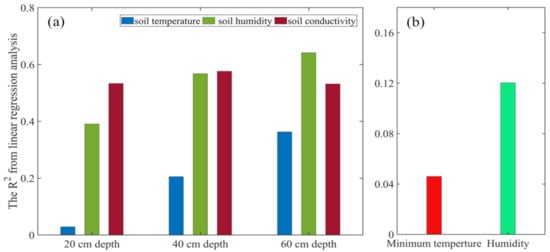
Figure 7.
The coefficients of linear regression analysis between temperature and humidity in the different depths of soil and the new index. (a) Represents the R2 of climatic variables in soil, and the variables were soil temperature, soil humidity, and soil conductivity; (b) represents the climatic variables in air, and the variables were minimum temperature, and humidity.
3.3. The Effects of Fluctuation in Climatic Variables on the Growth of Pear Trees
The fluctuation of climatic variables on the growth of pear trees was evaluated using the linear regression method and the SW method with a step of one day, as introduced in Section 2.3.2. The temporal changes of coefficients using linear regression analysis were calculated for climatic variables in the air and in the soil. To better show the different changes in impact, the climatic variables were divided into four classes containing air temperature, soil temperature, soil humidity, and soil conductivity. The average of the coefficients for the four classes were calculated and are shown in Figure 8.
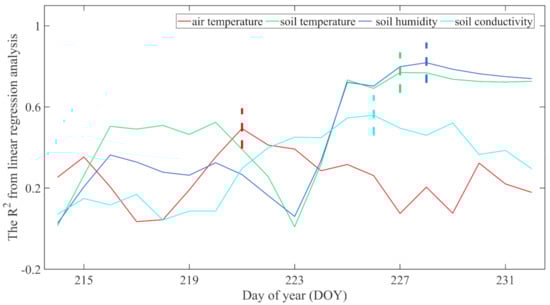
Figure 8.
The average value of R2 through the linear regression analysis was calculated based on the four classes of climatic variables. Note: the dotted line in the figure means DOY with the largest absolute value of the coefficient for each kind of climatic variable.
The maximum absolute value of coefficients for air temperature, soil temperature, soil humidity, and soil conductivity occurred on 221, 227, 228, 226 (DOY), respectively. Since the first date of the UAV collection of images happened on 235 DOY and thus, the new index was most correlated with the air temperature, soil temperature, soil humidity, and soil conductivity 14, 8, 7, and 9 days before the data collection of the UAV image. The impact of fluctuations in climatic variables on the growth of pear trees was assessed, and it can be concluded that the impacts of air temperature, soil temperature, soil humidity, and soil conductivity can last 14, 8, 7, and 9 days, respectively.
4. Discussion
A UAV platform mounted with a high spatial resolution optical cameras can be used to collect images concerning fruit trees at high frequency. The high-throughput images contain plenty of information on the spectrum and texture [11,44]. The spectral and textural information can be applied in ecological and agricultural applications such as the identification of the phenological events in agriculture and forest, monitoring the growth condition of crops and trees, and predicting agricultural production [45,46,47,48,49,50,51,52]. Commonly, the spectral information can be extracted using various VIs composed by linear and nonlinear equations, and here the texture was extracted using the GLCM. In this study, the temporal changes of spectral information using various VIs were applied to identify the dynamic changes in the growth of the pear trees. The trends of the spectral information were similar and they have shown a strong inter-correlation. It was reported that the textural information was a very important measure for the VI when the spectral information was being saturated [53,54,55]. However, textural information was commonly ignored in agricultural and ecological applications. The temporal changes of textural information including the contrast, correlation, energy, and homogeneity were investigated. Correlation and energy changed dramatically during the observations while contrast and the homogeneity changed little. This may be because the growth condition of the pear trees was closely correlated with the types and components of the pigments in the leaves [56,57]. The changes in correlation and energy of the textural information in the images were reflections of the variations of pigments in the vegetation, including the pear trees [58,59,60]. Similar results were obtained from previous studies. The vegetation indices and textures were combined for estimating the leaf area index (LAI) of rice based on a UAV RGB image leaf area index (LAI) [61]. The imagery was obtained from UAV fixed-wing concerning the whole growth stages of wheat and the texture, color, and vegetation indices were integrated to monitor the growth conditions [62]. Similar research has proven that the integrated vegetation indices and the textures can better capture the dynamic changes of vegetation such as trees and crops. Thus, textural information should be included in the monitoring of fruit trees and related agricultural and ecological applications. Besides, the new index may have a potential usage for monitoring the growth of maize, wheat, and rice et al.
The R2 between the new index and the soil temperature, soil humidity was relatively high and the R2 grew with the depth of the soil (from 20, 40, to 60 cm). The humidity in the soil was most closely correlated with the new index, which meant that more humidity promoted the growth of the pear trees and higher greenness would be achieved. Meanwhile, proper nurturing of pear trees would lead to less bare soil and the avoidance of sun exposure, and thus, the soil might contain more humidity. Transpiration far exceeds evaporation when the plant roots are extensive in the soil. Conversely, less humidity will lead to the negative growth of pear trees, and thus, less greenness on the ground will increase sun exposure (and soil evaporation), and thus, the soil would have lower humidity. The data collection in this study was based on an RGB camera mounted on the UAV platform and it is commonly believed that advanced sensors such as multispectral and hyper-spectral sensors would have greater potential in assessing the vegetation-related applications. The normalized difference vegetation index (NDVI) can be calculated from multispectral images and solar-induced chlorophyll fluorescence (SIF) can be extracted from hyperspectral images [63,64]. The NDVI and SIF have greater capabilities to detect changes in vegetation than that of the knowledge extracted from only RGB images [65,66]. Therefore, it is recommended that UAV platforms mounted with advanced multispectral and hyperspectral sensors should be applied to collect the images concerning fruit trees [67]. The NDVI calculated from the red and near-infrared bands from multispectral and hyperspectral images might be more correlated with, and more sensitive to, the response of vegetation [68,69]. Besides, the data from light detection and ranging (LiDAR) can be applied to extract more information on texture, such as the length, width, and height [70,71]. Therefore, it is suggested that more advanced sensors such as multispectral cameras, high-spectral cameras, and LiDAR be applied to explore and investigate the growth conditions of fruit trees, but the cost−benefit ratio must also be assessed [72,73,74]. Besides, the fusion method of the multisource image should be explored, and thus, the different sources of data can be integrated and hidden knowledge may be exposed when the data fusion has been conducted. More detailed information concerning the vegetation may be derived from the combined data. Moreover, more advanced approaches such as machine learning and deep learning containing multilayers for data analysis should be explored as to their excellent performance in classification and regression models [75,76,77]. Machine learning and deep learning can be used to build multilayers using the original images and more precise information such as the growth conditions and agricultural yields which can be obtained from this [78,79].
With the development of new electronics, mini-computers and light-sensors, the use of UAVs mounted with light sensors such as UAV-based multispectral cameras, hyper-spectral cameras, and (LiDAR) has emerged as a promising alternative for ecological and agricultural applications. There have been plenty of related applications, such as monitoring the growth condition of forests, estimation of forest structural parameters, measurement of within-season tree height, change detection of grass and trees, and the agricultural production predictions [80,81,82,83]. UAVs can fly at relatively low altitudes acquiring high resolution images at high frequency for the users. Commonly, the flights were conducted using commercial software such as the Dji pro software (https://www.dji.com/cn/downloads/djiapp/dji-go-3, accessed on 5 March 2021, Shen Zhen, China) and these flights were strictly controlled and seldomly encountered yawing. However, the UAV is dangerous as there may be mechanical failure, signal interruption, and even collision with flying birds. The first UAV regulation was proposed in 1944, and the United Kingdom and Australia first published their UAV regulations in 2012. These days, with the development of 5 G and the higher precision of the Global Positioning System (GPS), new regulations must be developed to keep pace with the rapid emergence of UAVs [84].
5. Conclusions
The new index was generated using the improved adaptive feature weighting method by integrating the spectral and textural information derived from a sequence of high-throughput images. The monitoring of the growth condition of pear trees using the new index indicated that it can precisely extract the dynamic temporal changes of the pear trees. The new index may also have potential abilities in monitoring crops such as maize, wheat, and rice. The results of PCA showed that climatic variables in the soil were the main components, compared with the climatic variables in the air. The further effects assessed using linear regression analysis between the selected main components and the new index also showed that the impact of temperature and humidity in the soil was greater than that in the air. The impact from humidity and conductivity in the soil were the dominating influencing factors for the growth of pear trees. The effects of fluctuation in climatic variables on the growth of pear trees were assessed and evaluated, and it can be concluded that the impact of air temperature, soil temperature, soil humidity, and soil conductivity can last 14, 8, 7, and 9 days, respectively. It is strongly recommended that the new index with more advanced approaches such as machine learning and deep learning be applied for monitoring the growth condition of pear trees.
Author Contributions
Conceptualization, Y.G., Z.W. and S.C.; methodology, Y.G., S.C., Y.H.F.; software, Y.G., S.W.; validation, Y.G., S.C. and Z.W.; formal analysis, Y.G., Z.W., S.W., C.R.B.; investigation, Y.G., C.R.B., J.S., M.C.; resources, Y.G. and Y.H.F.; data curation, Y.G., Z.W. and S.C.; writing—original draft preparation, Y.G.; writing—review and editing, Y.G., C.R.B., J.S., M.C. and Y.H.F.; visualization, Y.G., Z.W. and S.C.; supervision, Y.H.F.; project administration, Y.H.F.; funding acquisition, Y.H.F. All authors have read and agreed to the published version of the manuscript.
Funding
This study was funded by the National Funds for Distinguished Young Youths (Grant No. 42025101), the National Key Research and Development Program of China (Grant No.2017YFA06036001), the National Natural Science Foundation of China (Grant No. 31770516), the 111 Project (Grant No. B18006).
Conflicts of Interest
The authors declare no conflict of interest.
Appendix A

Figure A1.
The changes in vegetation index using three different cultivars of pear trees during the period from 235 to 249 DOY. Note: (a), (b), and (c) each represent the cultivar of Xinliqi, Yuluxiang, and Huangjinyoupan, respectively.
Figure A1.
The changes in vegetation index using three different cultivars of pear trees during the period from 235 to 249 DOY. Note: (a), (b), and (c) each represent the cultivar of Xinliqi, Yuluxiang, and Huangjinyoupan, respectively.

References
- Fu, Y.H.; Zhao, H.; Piao, S.; Peaucelle, M.; Peng, S.; Zhou, G.; Ciais, P.; Huang, M.; Menzel, A.; Peñuelas, J. Declining global warming effects on the phenology of spring leaf unfolding. Nature 2015, 526, 104–107. [Google Scholar] [CrossRef] [PubMed]
- Crookston, N.L.; Rehfeldt, G.E.; Dixon, G.E.; Weiskittel, A.R. Addressing climate change in the forest vegetation simulator to assess impacts on landscape forest dynamics. For. Ecol. Manag. 2010, 260, 1198–1211. [Google Scholar] [CrossRef]
- Keane, R.E.; Mahalovich, M.F.; Bollenbacher, B.L.; Manning, M.E.; Loehman, R.A.; Jain, T.B.; Holsinger, L.M.; Larson, A.J. Effects of climate change on forest vegetation in the Northern Rockies. In Climate Change and Rocky Mountain Ecosystems; Springer: Berlin/Heidelberg, Germany, 2018; pp. 59–95. [Google Scholar]
- Zhao, H.; Fu, Y.H.; Wang, X.; Zhao, C.; Zeng, Z.; Piao, S. Timing of rice maturity in China is affected more by transplanting date than by climate change. Agric. For. Meteorol. 2016, 216, 215–220. [Google Scholar] [CrossRef]
- Polgar, C.A.; Primack, R.B. Leaf-out phenology of temperate woody plants: From trees to ecosystems. New Phytol. 2011, 191, 926–941. [Google Scholar] [CrossRef]
- Cleland, E.E.; Chuine, I.; Menzel, A.; Mooney, H.A.; Schwartz, M.D. Shifting plant phenology in response to global change. Trends Ecol. Evol. 2007, 22, 357–365. [Google Scholar] [CrossRef]
- Piao, S.; Liu, Q.; Chen, A.; Janssens, I.A.; Fu, Y.; Dai, J.; Liu, L.; Lian, X.; Shen, M.; Zhu, X. Plant phenology and global climate change: Current progresses and challenges. Glob. Chang. Biol. 2019, 25, 1922–1940. [Google Scholar] [CrossRef]
- Zhang, J.; Cheng, X.; Jin, Q.; Su, X.; Li, M.; Yan, C.; Jiao, X.; Li, D.; Lin, Y.; Cai, Y. Comparison of the transcriptomic analysis between two Chinese white pear (Pyrus bretschneideri Rehd.) genotypes of different stone cells contents. PLoS ONE 2017, 12, e0187114. [Google Scholar] [CrossRef]
- Zhu, W.; Sun, Z.; Peng, J.; Huang, Y.; Li, J.; Zhang, J.; Yang, B.; Liao, X. Estimating maize above-ground biomass using 3D point clouds of multi-source unmanned aerial vehicle data at multi-spatial scales. Remote Sens. 2019, 11, 2678. [Google Scholar] [CrossRef]
- Guo, Y.; Senthilnath, J.; Wu, W.; Zhang, X.; Zeng, Z.; Huang, H. Radiometric calibration for multispectral camera of different imaging conditions mounted on a UAV platform. Sustainability 2019, 11, 978. [Google Scholar] [CrossRef]
- Senthilnath, J.; Kandukuri, M.; Dokania, A.; Ramesh, K. Application of UAV imaging platform for vegetation analysis based on spectral-spatial methods. Comput. Electron. Agric. 2017, 140, 8–24. [Google Scholar] [CrossRef]
- Fu, Y.; Yang, G.; Song, X.; Li, Z.; Xu, X.; Feng, H.; Zhao, C. Improved Estimation of Winter Wheat Aboveground Biomass Using Multiscale Textures Extracted from UAV-Based Digital Images and Hyperspectral Feature Analysis. Remote Sens. 2021, 13, 581. [Google Scholar] [CrossRef]
- Aasen, H.; Honkavaara, E.; Lucieer, A.; Zarco-Tejada, P.J. Quantitative remote sensing at ultra-high resolution with UAV spectroscopy: A review of sensor technology, measurement procedures, and data correction workflows. Remote Sens. 2018, 10, 1091. [Google Scholar] [CrossRef]
- Mancini, F.; Dubbini, M.; Gattelli, M.; Stecchi, F.; Fabbri, S.; Gabbianelli, G. Using unmanned aerial vehicles (UAV) for high-resolution reconstruction of topography: The structure from motion approach on coastal environments. Remote Sens. 2013, 5, 6880–6898. [Google Scholar] [CrossRef]
- Jin, X.; Zarco-Tejada, P.; Schmidhalter, U.; Reynolds, M.P.; Hawkesford, M.J.; Varshney, R.K.; Yang, T.; Nie, C.; Li, Z.; Ming, B. High-throughput estimation of crop traits: A review of ground and aerial phenotyping platforms. IEEE Geosci. Remote Sens. Lett. 2020, 1–33. [Google Scholar] [CrossRef]
- Guo, Y.; Wang, H.; Wu, Z.; Wang, S.; Sun, H.; Senthilnath, J.; Wang, J.; Robin Bryant, C.; Fu, Y. Modified Red Blue Vegetation Index for Chlorophyll Estimation and Yield Prediction of Maize from Visible Images Captured by UAV. Sensors 2020, 20, 5055. [Google Scholar] [CrossRef]
- Nex, F.; Remondino, F. UAV for 3D mapping applications: A review. Appl. Geomat. 2014, 6, 1–15. [Google Scholar] [CrossRef]
- Xie, C.; Yang, C. A review on plant high-throughput phenotyping traits using UAV-based sensors. Comput. Electron. Agric. 2020, 178, 105731. [Google Scholar] [CrossRef]
- Rodarmel, C.; Shan, J. Principal component analysis for hyperspectral image classification. Surv. Land Inf. Sci. 2002, 62, 115–122. [Google Scholar]
- Du, Q.; Fowler, J.E. Hyperspectral image compression using JPEG2000 and principal component analysis. IEEE Geosci. Remote Sens. Lett. 2007, 4, 201–205. [Google Scholar] [CrossRef]
- Zhao, C.; Luo, G.; Wang, Y.; Chen, C.; Wu, Z. UAV Recognition Based on Micro-Doppler Dynamic Attribute-Guided Augmentation Algorithm. Remote Sens. 2021, 13, 1205. [Google Scholar] [CrossRef]
- Ramos, L.P.; Campos, A.B.; Schwartz, C.; Duarte, L.T.; Alves, D.I.; Pettersson, M.I.; Vu, V.T.; Machado, R. A Wavelength-Resolution SAR Change Detection Method Based on Image Stack through Robust Principal Component Analysis. Remote Sens. 2021, 13, 833. [Google Scholar] [CrossRef]
- Zhang, X.; Zhang, F.; Qi, Y.; Deng, L.; Wang, X.; Yang, S. New research methods for vegetation information extraction based on visible light remote sensing images from an unmanned aerial vehicle (UAV). Int. J. Appl. Earth Obs. Geoinf. 2019, 78, 215–226. [Google Scholar] [CrossRef]
- Li, X.; Li, X.; Liu, W.; Wei, B.; Xu, X. A UAV-based framework for crop lodging assessment. Eur. J. Agron. 2021, 123, 126201. [Google Scholar] [CrossRef]
- Bendig, J.; Yu, K.; Aasen, H.; Bolten, A.; Bennertz, S.; Broscheit, J.; Gnyp, M.L.; Bareth, G. Combining UAV-based plant height from crop surface models, visible, and near infrared vegetation indices for biomass monitoring in barley. Int. J. Appl. Earth Obs. Geoinf. 2015, 39, 79–87. [Google Scholar] [CrossRef]
- Lu, J.; Cheng, D.; Geng, C.; Zhang, Z.; Xiang, Y.; Hu, T. Combining plant height, canopy coverage and vegetation index from UAV-based RGB images to estimate leaf nitrogen concentration of summer maize. Biosyst. Eng. 2021, 202, 42–54. [Google Scholar] [CrossRef]
- Fu, Y.; Yang, G.; Wang, J.; Song, X.; Feng, H. Winter wheat biomass estimation based on spectral indices, band depth analysis and partial least squares regression using hyperspectral measurements. Comput. Electron. Agric. 2014, 100, 51–59. [Google Scholar] [CrossRef]
- Thenkabail, P.S.; Smith, R.B.; De Pauw, E. Hyperspectral vegetation indices and their relationships with agricultural crop characteristics. Remote Sens. Environ. 2000, 71, 158–182. [Google Scholar] [CrossRef]
- Wan, L.; Li, Y.; Cen, H.; Zhu, J.; Yin, W.; Wu, W.; Zhu, H.; Sun, D.; Zhou, W.; He, Y. Combining UAV-Based Vegetation Indices and Image Classification to Estimate Flower Number in Oilseed Rape. Remote Sens. 2018, 10, 1484. [Google Scholar] [CrossRef]
- Xu, Z.; Chen, X.; Liu, J.; Zhang, Y.; Chau, S.; Bhattarai, N.; Wang, Y.; Li, Y.; Connor, T.; Li, Y. Impacts of irrigated agriculture on food–energy–water–CO 2 nexus across metacoupled systems. Nat. Commun. 2020, 11, 1–12. [Google Scholar] [CrossRef]
- Ju, X.T.; Kou, C.L.; Zhang, F.S.; Christie, P. Nitrogen balance and groundwater nitrate contamination: Comparison among three intensive cropping systems on the North China Plain. Environ. Pollut. 2006, 143, 117–125. [Google Scholar] [CrossRef]
- Meyer, G.E.; Neto, J.C. Verification of color vegetation indices for automated crop imaging applications. Comput. Electron. Agric. 2008, 63, 282–293. [Google Scholar] [CrossRef]
- Jin, X.; Liu, S.; Baret, F.; Hemerlé, M.; Comar, A. Estimates of plant density of wheat crops at emergence from very low altitude UAV imagery. Remote Sens. Environ. 2017, 198, 105–114. [Google Scholar] [CrossRef]
- Kazmi, W.; Garcia-Ruiz, F.J.; Nielsen, J.; Rasmussen, J.; Andersen, H.J. Detecting creeping thistle in sugar beet fields using vegetation indices. Comput. Electron. Agric. 2015, 112, 10–19. [Google Scholar] [CrossRef]
- Saberioon, M.; Amin, M.; Anuar, A.; Gholizadeh, A.; Wayayok, A.; Khairunniza-Bejo, S. Assessment of rice leaf chlorophyll content using visible bands at different growth stages at both the leaf and canopy scale. Int. J. Appl. Earth Obs. Geoinf. 2014, 32, 35–45. [Google Scholar] [CrossRef]
- Hague, T.; Tillett, N.; Wheeler, H. Automated crop and weed monitoring in widely spaced cereals. Precis. Agric. 2006, 7, 21–32. [Google Scholar] [CrossRef]
- Reid, A.M.; Chapman, W.K.; Prescott, C.E.; Nijland, W. Using excess greenness and green chromatic coordinate colour indices from aerial images to assess lodgepole pine vigour, mortality and disease occurrence. For. Ecol. Manag. 2016, 374, 146–153. [Google Scholar] [CrossRef]
- Pradhan, B.; Hagemann, U.; Tehrany, M.S.; Prechtel, N. An easy to use ArcMap based texture analysis program for extraction of flooded areas from TerraSAR-X satellite image. Comput. Geosci. 2014, 63, 34–43. [Google Scholar] [CrossRef]
- Chen, J.; Pappas, T.N.; Mojsilovic, A.; Rogowitz, B.E. Adaptive perceptual color-texture image segmentation. IEEE Trans. Image Process. 2005, 14, 1524–1536. [Google Scholar] [CrossRef]
- Zhou, S.; Shi, J.; Zhu, J.; Cai, Y.; Wang, R. Shearlet-based texture feature extraction for classification of breast tumor in ultrasound image. Biomed. Signal Process. Control 2013, 8, 688–696. [Google Scholar] [CrossRef]
- Chen, Y.; Feng, L.; Zhang, X.; Shen, Z.; Zhou, X. Supervised and adaptive feature weighting for object-based classification on satellite images. IEEE J. Sel. Top. Appl. Earth Obs. Remote Sens. 2018, 11, 3224–3234. [Google Scholar]
- Zhu, Q.; Xu, N.; Huang, S.-J.; Qian, J.; Zhang, D. Adaptive feature weighting for robust Lp-norm sparse representation with application to biometric image classification. Int. J. Mach. Learn. Cyber. 2020, 11, 463–474. [Google Scholar] [CrossRef]
- Harakawa, R.; Ogawa, T.; Haseyama, M.; Akamatsu, T. Automatic detection of fish sounds based on multi-stage classification including logistic regression via adaptive feature weighting. J. Acoust. Soc. Am. 2018, 144, 2709–2718. [Google Scholar] [CrossRef] [PubMed]
- Zhao, H.; Xu, L.; Shi, S.; Jiang, H.; Chen, D. A High Throughput Integrated Hyperspectral Imaging and 3D Measurement System. Sensors 2018, 18, 1068. [Google Scholar] [CrossRef] [PubMed]
- Klosterman, S.; Melaas, E.; Wang, J.A.; Martinez, A.; Frederick, S.; O’Keefe, J.; Orwig, D.A.; Wang, Z.; Sun, Q.; Schaaf, C. Fine-scale perspectives on landscape phenology from unmanned aerial vehicle (UAV) photography. Agric. For. Meteo. 2018, 248, 397–407. [Google Scholar] [CrossRef]
- Burkart, A.; Hecht, V.; Kraska, T.; Rascher, U. Phenological analysis of unmanned aerial vehicle based time series of barley imagery with high temporal resolution. Precis. Agric. 2018, 19, 134–146. [Google Scholar] [CrossRef]
- Lisein, J.; Michez, A.; Claessens, H.; Lejeune, P. Discrimination of deciduous tree species from time series of unmanned aerial system imagery. PLoS ONE 2015, 10, e0141006. [Google Scholar] [CrossRef]
- Sepulcre-Cantó, G.; Zarco-Tejada, P.J.; Jiménez-Muñoz, J.; Sobrino, J.; Soriano, M.; Fereres, E.; Vega, V.; Pastor, M. Monitoring yield and fruit quality parameters in open-canopy tree crops under water stress. Implications for ASTER. Remote Sens. Environ. 2007, 107, 455–470. [Google Scholar] [CrossRef]
- Johansen, K.; Raharjo, T.; McCabe, M.F. Using multi-spectral UAV imagery to extract tree crop structural properties and assess pruning effects. Remote Sens. 2018, 10, 854. [Google Scholar] [CrossRef]
- Ramos, A.P.M.; Osco, L.P.; Furuya, D.E.G.; Gonçalves, W.N.; Santana, D.C.; Teodoro, L.P.R.; da Silva Junior, C.A.; Capristo-Silva, G.F.; Li, J.; Baio, F.H.R. A random forest ranking approach to predict yield in maize with uav-based vegetation spectral indices. Comput. Electron. Agric. 2020, 178, 105791. [Google Scholar]
- Maimaitijiang, M.; Sagan, V.; Sidike, P.; Hartling, S.; Esposito, F.; Fritschi, F.B. Soybean yield prediction from UAV using multimodal data fusion and deep learning. Remote Sens. Environ. 2020, 237, 111599. [Google Scholar] [CrossRef]
- Zhou, X.; Zheng, H.; Xu, X.; He, J.; Ge, X.; Yao, X.; Cheng, T.; Zhu, Y.; Cao, W.; Tian, Y. Predicting grain yield in rice using multi-temporal vegetation indices from UAV-based multispectral and digital imagery. ISPRS J. Photogramm. Remote Sens. 2017, 130, 246–255. [Google Scholar] [CrossRef]
- Duan, B.; Liu, Y.; Gong, Y.; Peng, Y.; Wu, X.; Zhu, R.; Fang, S. Remote estimation of rice LAI based on Fourier spectrum texture from UAV image. Plant Methods 2019, 15, 1–12. [Google Scholar] [CrossRef] [PubMed]
- Maimaitijiang, M.; Sagan, V.; Sidike, P.; Daloye, A.M.; Erkbol, H.; Fritschi, F.B. Crop Monitoring Using Satellite/UAV Data Fusion and Machine Learning. Remote Sens. 2020, 12, 1357. [Google Scholar] [CrossRef]
- Baret, F.; Guyot, G. Potentials and limits of vegetation indices for LAI and APAR assessment. Remote Sens. Environ. 1991, 35, 161–173. [Google Scholar] [CrossRef]
- Razmi, N.; Ebadi, A.; Daneshian, J.; Jahanbakhsh, S. Salicylic acid induced changes on antioxidant capacity, pigments and grain yield of soybean genotypes in water deficit condition. J. Plant Interact. 2017, 12, 457–464. [Google Scholar] [CrossRef]
- Falcioni, R.; Moriwaki, T.; Bonato, C.M.; de Souza, L.A.; Nanni, M.R.; Antunes, W.C. Distinct growth light and gibberellin regimes alter leaf anatomy and reveal their influence on leaf optical properties. Environ. Exp. Bot. 2017, 140, 86–95. [Google Scholar] [CrossRef]
- Grüner, E.; Wachendorf, M.; Astor, T. The potential of UAV-borne spectral and textural information for predicting aboveground biomass and N fixation in legume-grass mixtures. PLoS ONE 2020, 15, e0234703. [Google Scholar]
- Guo, A.; Huang, W.; Ye, H.; Dong, Y.; Ma, H.; Ren, Y.; Ruan, C. Identification of wheat yellow rust using spectral and texture features of hyperspectral images. Remote Sens. 2020, 12, 1419. [Google Scholar] [CrossRef]
- Liu, M.; Yu, T.; Gu, X.; Sun, Z.; Yang, J.; Zhang, Z.; Mi, X.; Cao, W.; Li, J. The Impact of Spatial Resolution on the Classification of Vegetation Types in Highly Fragmented Planting Areas Based on Unmanned Aerial Vehicle Hyperspectral Images. Remote Sens. 2020, 12, 146. [Google Scholar] [CrossRef]
- Li, S.; Yuan, F.; Ata-UI-Karim, S.T.; Zheng, H.; Cheng, T.; Liu, X.; Tian, Y.; Zhu, Y.; Cao, W.; Cao, Q. Combining color indices and textures of UAV-based digital imagery for rice LAI estimation. Remote Sens. 2019, 11, 1763. [Google Scholar] [CrossRef]
- Zhang, J.; Qiu, X.; Wu, Y.; Zhu, Y.; Cao, Q.; Liu, X.; Cao, W. Combining texture, color, and vegetation indices from fixed-wing UAS imagery to estimate wheat growth parameters using multivariate regression methods. Comput. Electron. Agric. 2021, 185, 106138. [Google Scholar] [CrossRef]
- Chi, Y.; Sun, J.; Sun, Y.; Liu, S.; Fu, Z. Multi-temporal characterization of land surface temperature and its relationships with normalized difference vegetation index and soil moisture content in the Yellow River Delta, China. Glob. Ecol. Conserv. 2020, 23, e01092. [Google Scholar] [CrossRef]
- Bendig, J.; Malenovský, Z.; Gautam, D.; Lucieer, A. Solar-induced chlorophyll fluorescence measured from an Unmanned Aircraft System: Sensor etaloning and platform motion correction. IEEE Trans. Geosci. Remote Sens. 2019, 58, 3437–3444. [Google Scholar] [CrossRef]
- MEHTA, D.; SHUKLA, S.H.; Kalubarme, M.H. Winter Crop Growth Monitoring using Multi-Temporal NDVI Profiles in Kapadvanj Taluka, Gujarat State. Int. J. Environ. Geoinf. 2021, 8, 33–38. [Google Scholar]
- Vargas, J.Q.; Bendig, J.; Mac Arthur, A.; Burkart, A.; Julitta, T.; Maseyk, K.; Thomas, R.; Siegmann, B.; Rossini, M.; Celesti, M. Unmanned aerial systems (UAS)-based methods for solar induced chlorophyll fluorescence (SIF) retrieval with non-imaging spectrometers: State of the art. Remote Sens. 2020, 12, 1624. [Google Scholar] [CrossRef]
- Chang, C.Y.; Zhou, R.; Kira, O.; Marri, S.; Skovira, J.; Gu, L.; Sun, Y. An Unmanned Aerial System (UAS) for concurrent measurements of solar-induced chlorophyll fluorescence and hyperspectral reflectance toward improving crop monitoring. Agric. For. Meteor. 2020, 294, 108145. [Google Scholar] [CrossRef]
- Xu, Y.; Yang, J.; Chen, Y. NDVI-based vegetation responses to climate change in an arid area of China. Theor. Appl. Clim. 2016, 126, 213–222. [Google Scholar] [CrossRef]
- Pettorelli, N.; Vik, J.O.; Mysterud, A.; Gaillard, J.-M.; Tucker, C.J.; Stenseth, N.C. Using the satellite-derived NDVI to assess ecological responses to environmental change. Trends Ecol. Evol. 2005, 20, 503–510. [Google Scholar] [CrossRef]
- Malambo, L.; Popescu, S.; Horne, D.; Pugh, N.; Rooney, W. Automated detection and measurement of individual sorghum panicles using density-based clustering of terrestrial lidar data. ISPRS J. Photogram. Remote Sens. 2019, 149, 1–13. [Google Scholar] [CrossRef]
- Tian, X.; Li, Z.; Van der Tol, C.; Su, Z.; Li, X.; He, Q.; Bao, Y.; Chen, E.; Li, L. Estimating zero-plane displacement height and aerodynamic roughness length using synthesis of LiDAR and SPOT-5 data. Remote Sens. Environ. 2011, 115, 2330–2341. [Google Scholar] [CrossRef]
- Lin, Y.-C.; Cheng, Y.-T.; Zhou, T.; Ravi, R.; Hasheminasab, S.M.; Flatt, J.E.; Troy, C.; Habib, A. Evaluation of UAV LiDAR for Mapping Coastal Environments. Remote Sens. 2019, 11, 2893. [Google Scholar] [CrossRef]
- Yan, W.Y.; Shaker, A.; El-Ashmawy, N. Urban land cover classification using airborne LiDAR data: A review. Remote Sens. Environ. 2015, 158, 295–310. [Google Scholar] [CrossRef]
- Misra, G.; Buras, A.; Heurich, M.; Asam, S.; Menzel, A. LiDAR derived topography and forest stand characteristics largely explain the spatial variability observed in MODIS land surface phenology. Remote Sens. Environ. 2018, 218, 231–244. [Google Scholar] [CrossRef]
- Guo, Y.; Fu, Y.; Hao, F.; Zhang, X.; Wu, W.; Jin, X.; Robin Bryant, C.; Senthilnath, J. Integrated phenology and climate in rice yields prediction using machine learning methods. Ecol. Indic. 2021, 120, 106935. [Google Scholar] [CrossRef]
- Guo, Y.; Yin, G.; Sun, H.; Wang, H.; Chen, S.; Senthilnath, J.; Wang, J.; Fu, Y. Scaling Effects on Chlorophyll Content Estimations with RGB Camera Mounted on a UAV Platform Using Machine-Learning Methods. Sensors 2020, 20, 5130. [Google Scholar] [CrossRef]
- Han, L.; Yang, G.; Dai, H.; Xu, B.; Yang, H.; Feng, H.; Li, Z.; Yang, X. Modeling maize above-ground biomass based on machine learning approaches using UAV remote-sensing data. Plant Methods 2019, 15, 10. [Google Scholar] [CrossRef]
- Cao, J.; Zhang, Z.; Tao, F.; Zhang, L.; Luo, Y.; Zhang, J.; Han, J.; Xie, J. Integrating Multi-Source Data for Rice Yield Prediction across China using Machine Learning and Deep Learning Approaches. Agric. For. Meteor. 2021, 297, 108275. [Google Scholar] [CrossRef]
- Mekki-Berrada, F.; Ren, Z.; Huang, T.; Wong, W.K.; Zheng, F.; Xie, J.; Tian, I.P.S.; Jayavelu, S.; Mahfoud, Z.; Bash, D. Two-step machine learning enables optimized nanoparticle synthesis. NPJ Comput. Mater. 2021, 7, 1–10. [Google Scholar] [CrossRef]
- Dempewolf, J.; Nagol, J.; Hein, S.; Thiel, C.; Zimmermann, R. Measurement of within-season tree height growth in a mixed forest stand using UAV imagery. Forests 2017, 8, 231. [Google Scholar] [CrossRef]
- Cao, L.; Liu, K.; Shen, X.; Wu, X.; Liu, H. Estimation of forest structural parameters using UAV-LiDAR data and a process-based model in ginkgo planted forests. IEEE J. Sel. Top. Appl. Earth Obs. Remote Sens. 2019, 12, 4175–4190. [Google Scholar] [CrossRef]
- Solvin, T.M.; Puliti, S.; Steffenrem, A. Use of UAV photogrammetric data in forest genetic trials: Measuring tree height, growth, and phenology in Norway spruce (Picea abies L. Karst.). Scand. J. For. Res. 2020, 35, 322–333. [Google Scholar] [CrossRef]
- Jakubowski, M.K.; Guo, Q.; Kelly, M. Tradeoffs between lidar pulse density and forest measurement accuracy. Remote Sens. Environ. 2013, 130, 245–253. [Google Scholar] [CrossRef]
- Fotouhi, A.; Qiang, H.; Ding, M.; Hassan, M.; Giordano, L.G.; Garcia-Rodriguez, A.; Yuan, J. Survey on UAV cellular communications: Practical aspects, standardization advancements, regulation, and security challenges. IEEE Commun. Surv. Tutorials 2019, 21, 3417–3442. [Google Scholar] [CrossRef]


Publisher’s Note: MDPI stays neutral with regard to jurisdictional claims in published maps and institutional affiliations. |
© 2021 by the authors. Licensee MDPI, Basel, Switzerland. This article is an open access article distributed under the terms and conditions of the Creative Commons Attribution (CC BY) license (https://creativecommons.org/licenses/by/4.0/).