Article

Ultra-Violet Mie Lidar Observations of Particulates Vertical Profiles in Macao during a Record High Pollution Episode

1
School of Mathematics and Physics, Qingdao University of Science & Technology, Qingdao 266061, China
2
College of Physics, Sichuan University, Chengdu 610064, China
3
Meteorological and Geophysical Bureau, Rampa do Observatorio, Taipa Grande, Macao 999078, China
*
Author to whom correspondence should be addressed.
Remote Sens. 2022, 14(1), 118; https://doi.org/10.3390/rs14010118
Submission received: 10 December 2021 / Revised: 21 December 2021 / Accepted: 23 December 2021 / Published: 28 December 2021

Abstract

:
Vertical profiles of particulates were measured in Macao by using a 355 nm Mie scattering lidar during a dust event. A high energy pulse laser was employed as the light source to detect the extinction coefficient in the atmosphere. The extinction profiles showed layers of high aerosol concentrations in good agreement with both back trajectory analysis and ground-based pollution measurements in Macao, which indicate that this lidar is very useful for monitoring extinction profiles during extreme high aerosol loading and low visibility atmospheric conditions when most low energy lidar system is inefficient. The results evidenced that correlations between PM2.5 and TSP varied with the intensity of dust storm and the PM2.5/PM10 ratio was small during dust episode, which indicated that aerosols were dominated by large particles. Furthermore, results of the dust event showed high aerosol concentrations at altitudes where the wind carried the dusty aerosols from northern China, covering Shanghai and the Taiwan Channel, to the Pearl River Delta Region. This research improved the understanding of the dust properties in Macao.

1. Introduction

Macao is a special administrative region (SAR) of China located in the Pearl River Delta. The Pearl River Delta is located in the coastal region of south China, which is one of the most urbanized areas in China. Urbanization has a great impact on local meteorological conditions. Air quality is always of great concern in Macao and the Pearl River Delta region [1,2,3,4,5,6,7]. The particulate concentration has been increasing over the past 20 years with the rapid economic development of neighboring regions in China. Numerous ground stations make continuous round-the-clock point measurements of a range of pollutants, but they seldom provide the pollutants vertical profile, which is important for modelling the transport of pollution. With good spatial and temporal resolution, real-time measurements can now be obtained from remote sensing technique such as lidar [8].
Lidar has been widely employed to study aerosol properties and spatial distribution [9,10,11,12,13], to observe the urban mixed layer characteristics [14,15,16,17,18], to explore the transport of aerosols over larger areas [19,20,21,22,23], or as regular observations [24,25,26,27]. In some episodes of dust events, lidar also plays important roles [28,29,30,31].
As a strong weather system process, the dust storm has a high intensity and wide range. The dust aerosols, as a highly important atmospheric constituent, have a profound effect on global climate change and human life [32,33,34,35,36,37,38,39]. In the past few years, several studies focusing on the dust aerosol optical properties and evolution by use of lidar have been performed [40,41,42]. The properties of dust particles, such as extinction-to-backscatter ratio, backscattering, and depolarization can be measured [43,44,45,46]; furthermore, the temporal and spatial distributions and transport characteristics of dust, elevated dust, biomass-burning smoke, and anthropogenic aerosol have also been studied [47].
Based on range-resolved aerosol optical properties observed from a multi-wavelength Raman lidar system, Soupiona et al. [48] presented a statistical analysis of the seasonal variability of the Saharan dust aerosols vertical profiles over the city of Athens, Greece. The analysis showed that most dust events occurred in spring, summer, and early autumn periods, and the dust layers moved to higher altitudes in spring more than in other seasons.
By using integration of measurements, a comprehensive understanding of the aerosols can be given [49,50,51,52,53,54]. Ma et al. [55] used two micro-pulse lidars for atmospheric vertical and horizontal scanning detection to obtain the complete aerosol distribution. The result indicated that the boundary layer height was consistent with the height of particulate matter accumulation. Satellite remote sensing data and meteorological data were combined with lidar data to study the regional distribution characteristics and transport of pollutants. Fernández et al. [56] used lidar and sun-photometer measurements to analyze aerosol optical properties and their evolution in an extreme Saharan dust event. The combined use of active and passive remote sensing instruments along with dust models had provided useful information for a better understanding of the complexity of dust transport over long distances. Wang et al. [57] used ground-based lidar-photometer method to derive the real-time dust mass extinction efficiency and dust mass concentration profiles. They found that the dust mass extinction efficiency was not a fixed value, and the size of dust particles changed in different dust weather processes. This research improved the understanding of the dust properties in Northwest China. With combined multiple data over East China, Tao et al. [58] concluded that the dust could mix with fire emissions and urban/industrial pollution to form yellow haze clouds. Dust transport and high humidity were the main reason that the haze pollution was much heavier in research period. Furthermore, a comprehensive study was conducted by Liu et al. [59] to examine the continuous air pollution in winter over Wuhan. The meteorological conditions, pollutants source, and aerosols optical properties were analyzed. The research revealed the formation process of haze pollution and provided guidance for government for the prevention work of haze pollution.
All previous studies have given us some knowledge of aerosols. However, a dust event is a special weather phenomenon, and the characteristics of dust aerosols are always different in each dust storm. The optical properties and the spatial and temporal distribution of dust aerosols are poorly understood over many regions of the world. There is an internal relation between aerosol extinction and mass concentration. Without information on the particle size distribution and complex refractive index, the aerosol mass concentration can be retrieved from Mie lidar data using statistically correlations [60]. However, the correlation is not suitable for dust events, fog, pollution, precipitation, and other special weather. It is possible to extract aerosol mass concentrations within a reasonable accuracy of 20–30% without supplementary information on the aerosols [61,62]. With a varying refractive index, Guasta [63] obtained aerosol mass concentrations 40 m above the ground from lidar measurements.
In this paper, rough proportionality between accumulation-mode aerosol mass concentration and lidar extinction is reported. The current work aims to infer vertical profiles of PM10 (particulate matter with aerodynamic diameter smaller than 10 μm) using a single channel lidar. Mass concentrations are inferred by establishing empirical correlations between PM10, visibility, and extinction coefficient.
This paper is organized as follows: Section 2 introduces the measurement area, describes lidar instrumentation and data analysis method, and illustrates the measurement and source of PM concentration and meteorological data. Section 3 presents some results and discussions from dust case measurements. Section 4 gives the conclusion of this study.

2. Materials and Methods

2.1. The Measurement Area

Macao is located on the western side of Pearl River Delta of China, a region with frequent weather changes. Macao area is about 18 square kilometers, including the Macao Peninsula, Taipa Island, and Coloane.
The Macao Meteorological and Geophysical Bureau (SMG) is situated on the Grand Taipa Hill of Taipa Island. SMG has been equipped with the air quality monitoring network and atmospheric radiation monitoring network. However, these monitoring networks cannot give the detection results of the vertical characteristics of dust particles, which may lead to greater uncertainties in the research of dust events. Therefore, it is very important to obtain the aerosol vertical profiles with a good spatial-temporal resolution by using lidar.
Our lidar system is located in the Macao Meteorological and Geophysical Bureau (SMG) at 112 m above sea level (22.2° N, 113.53° E). The position of our lidar is shown in Figure 1. All data from lidar and SMG near-surface instruments are used to provide a promising approach for the aerosol optical properties and track their evolution in space and time.

2.2. Lidar System and Data Processing

Our lidar system, which is a single wavelength lidar based on the Mie scattering principle, is located on top of the Grand Taipa Hill in Macao at 112 m above sea level. The instrument was constructed as an initial phase of a future water vapor Raman lidar. The third harmonics of Nd:YAG laser is chosen as the emitter laser source with a pulse width of 5.7 ns at 50 Hz. The maximum pulse energy of the laser is 160 mJ, which is set to at most 50% of the maximum capacity in routine aerosol monitoring. The detection system operates in both of analogue and photon-counting modes to improve the dynamic range of the instrument. The system is off-axis with the center of the emitter being 226 mm away from the center of the receiver.
The system design parameters are summarized in Table 1 with the system layout depicted in Figure 2 below. In the daytime, the sky background radiation in ultraviolet wavelength range is much weaker than that in the visible wavelength range. Under extremely high-atmospheric extinction conditions this lidar can still obtain aerosol profiles with high signal-to-noise ratio.
The Fernald’s method was used to retrieve the extinction coefficient. In the atmosphere, the lidar signal intensity is affected by both air molecules and aerosol particles. Considered the contribution of molecules and aerosols separately, the detected lidar signal can be written as [64]
P ( r ) = E C r 2 [ β m o l ( r ) + β a e r ( r ) ] exp { 2 0 r [ σ m o l ( r ) + σ a e r ( r ) ] d r }
where P(r) is the signal received from a distance r, E is the transmitted laser pulse energy, C contains lidar parameters describing the efficiencies of the optical and detection units, βmol(r) and βaer(r) are the backscattering cross sections at height r caused by molecules (index mol) and aerosols (index aer), σmol(r) and σaer(r) are the extinction coefficients at height r caused by molecules (index mol) and aerosols (index aer).
The particle extinction-to-backscatter ratio is expressed as S1 = σaer(r)/βaer(r), the molecular lidar ratio is a constant 8π/3, so the aerosol extinction coefficient can be written as
σ a e r ( r ) = P ( r ) r 2 exp [ 8 π 3 0 r β m o l ( r ) d r ] ( 3 S 1 4 π ) 2 S 1 C E 1 2 S 1 C E 0 r P ( r ) r 2 exp [ 8 π 3 0 r β m o l ( r ) d r ] ( 3 S 1 4 π ) 2 d r S 1 β m o l ( r )
In this paper, the molecular Rayleigh scattering values referred were taken from the US Standard Atmosphere (1976) [65], the particle extinction-to-backscatter ratio was assumed to be 50 sr for all data presented here, based on data from a Raman lidar operated in the Pearl River Delta region near Hong Kong [66]. The boundary condition was the assumption that the lidar can transmit far enough and the far range aerosol extinction is zero. In general, aerosol concentrations are higher and vary sharply near the surface, therefore capturing values of the near range is important for air quality studies. Near-range correction of the lidar signal followed the methods proposed by A.Y.S Cheng et al. [67] and Liu et al. [68].
For particulates and air quality studies in Macao, deeper understanding between aerosol extinction and particulate concentrations (commonly PM10 data) is indispensable. Cheng et al. [69] gave a single power law fit by the regression of large amounts of routine measurements, but the correlation is susceptible to fog, pollution, precipitation, and other special weather. Naturally, it is not suitable for a dust event. According to Inaba, the relation among the visibility, extinction coefficients, and wavelength can be expressed as [70]
σ 1 σ 2 = ( λ 2 λ 1 ) 0.585 V 1 3
where V represents the local visibility (km) and can be gotten from local meteorological department, σ is extinction coefficient, and λ is wavelength. This relation, which critically depends on temporal visibility, will be used in establishing the correlation between extinction and PM10 data. This approximate had a good agreement with experimental results [71,72,73].

2.3. PM Concentration and Meteorological Data

PM concentration and meteorological data were obtained from the Macao Meteorological and Geophysical Bureau (SMG), which is equipped with an air quality monitoring network and atmospheric radiation monitoring network for routine measurements.
The Met One Instruments BAM 1020 beta attenuation mass monitor was used to monitor the surface PM2.5, PM10, and total suspended particulates concentrations. The monitor automatically measured and recorded ambient particulate mass concentration levels using the principle of beta ray attenuation with a measuring accuracy of 0.1 μg/m3. More detail data information can be found in the Macao Meteorological and Geophysical Bureau (SMG) (https://www.smg.gov.mo/en, accessed on 21 December 2021).

3. Results and Discussion

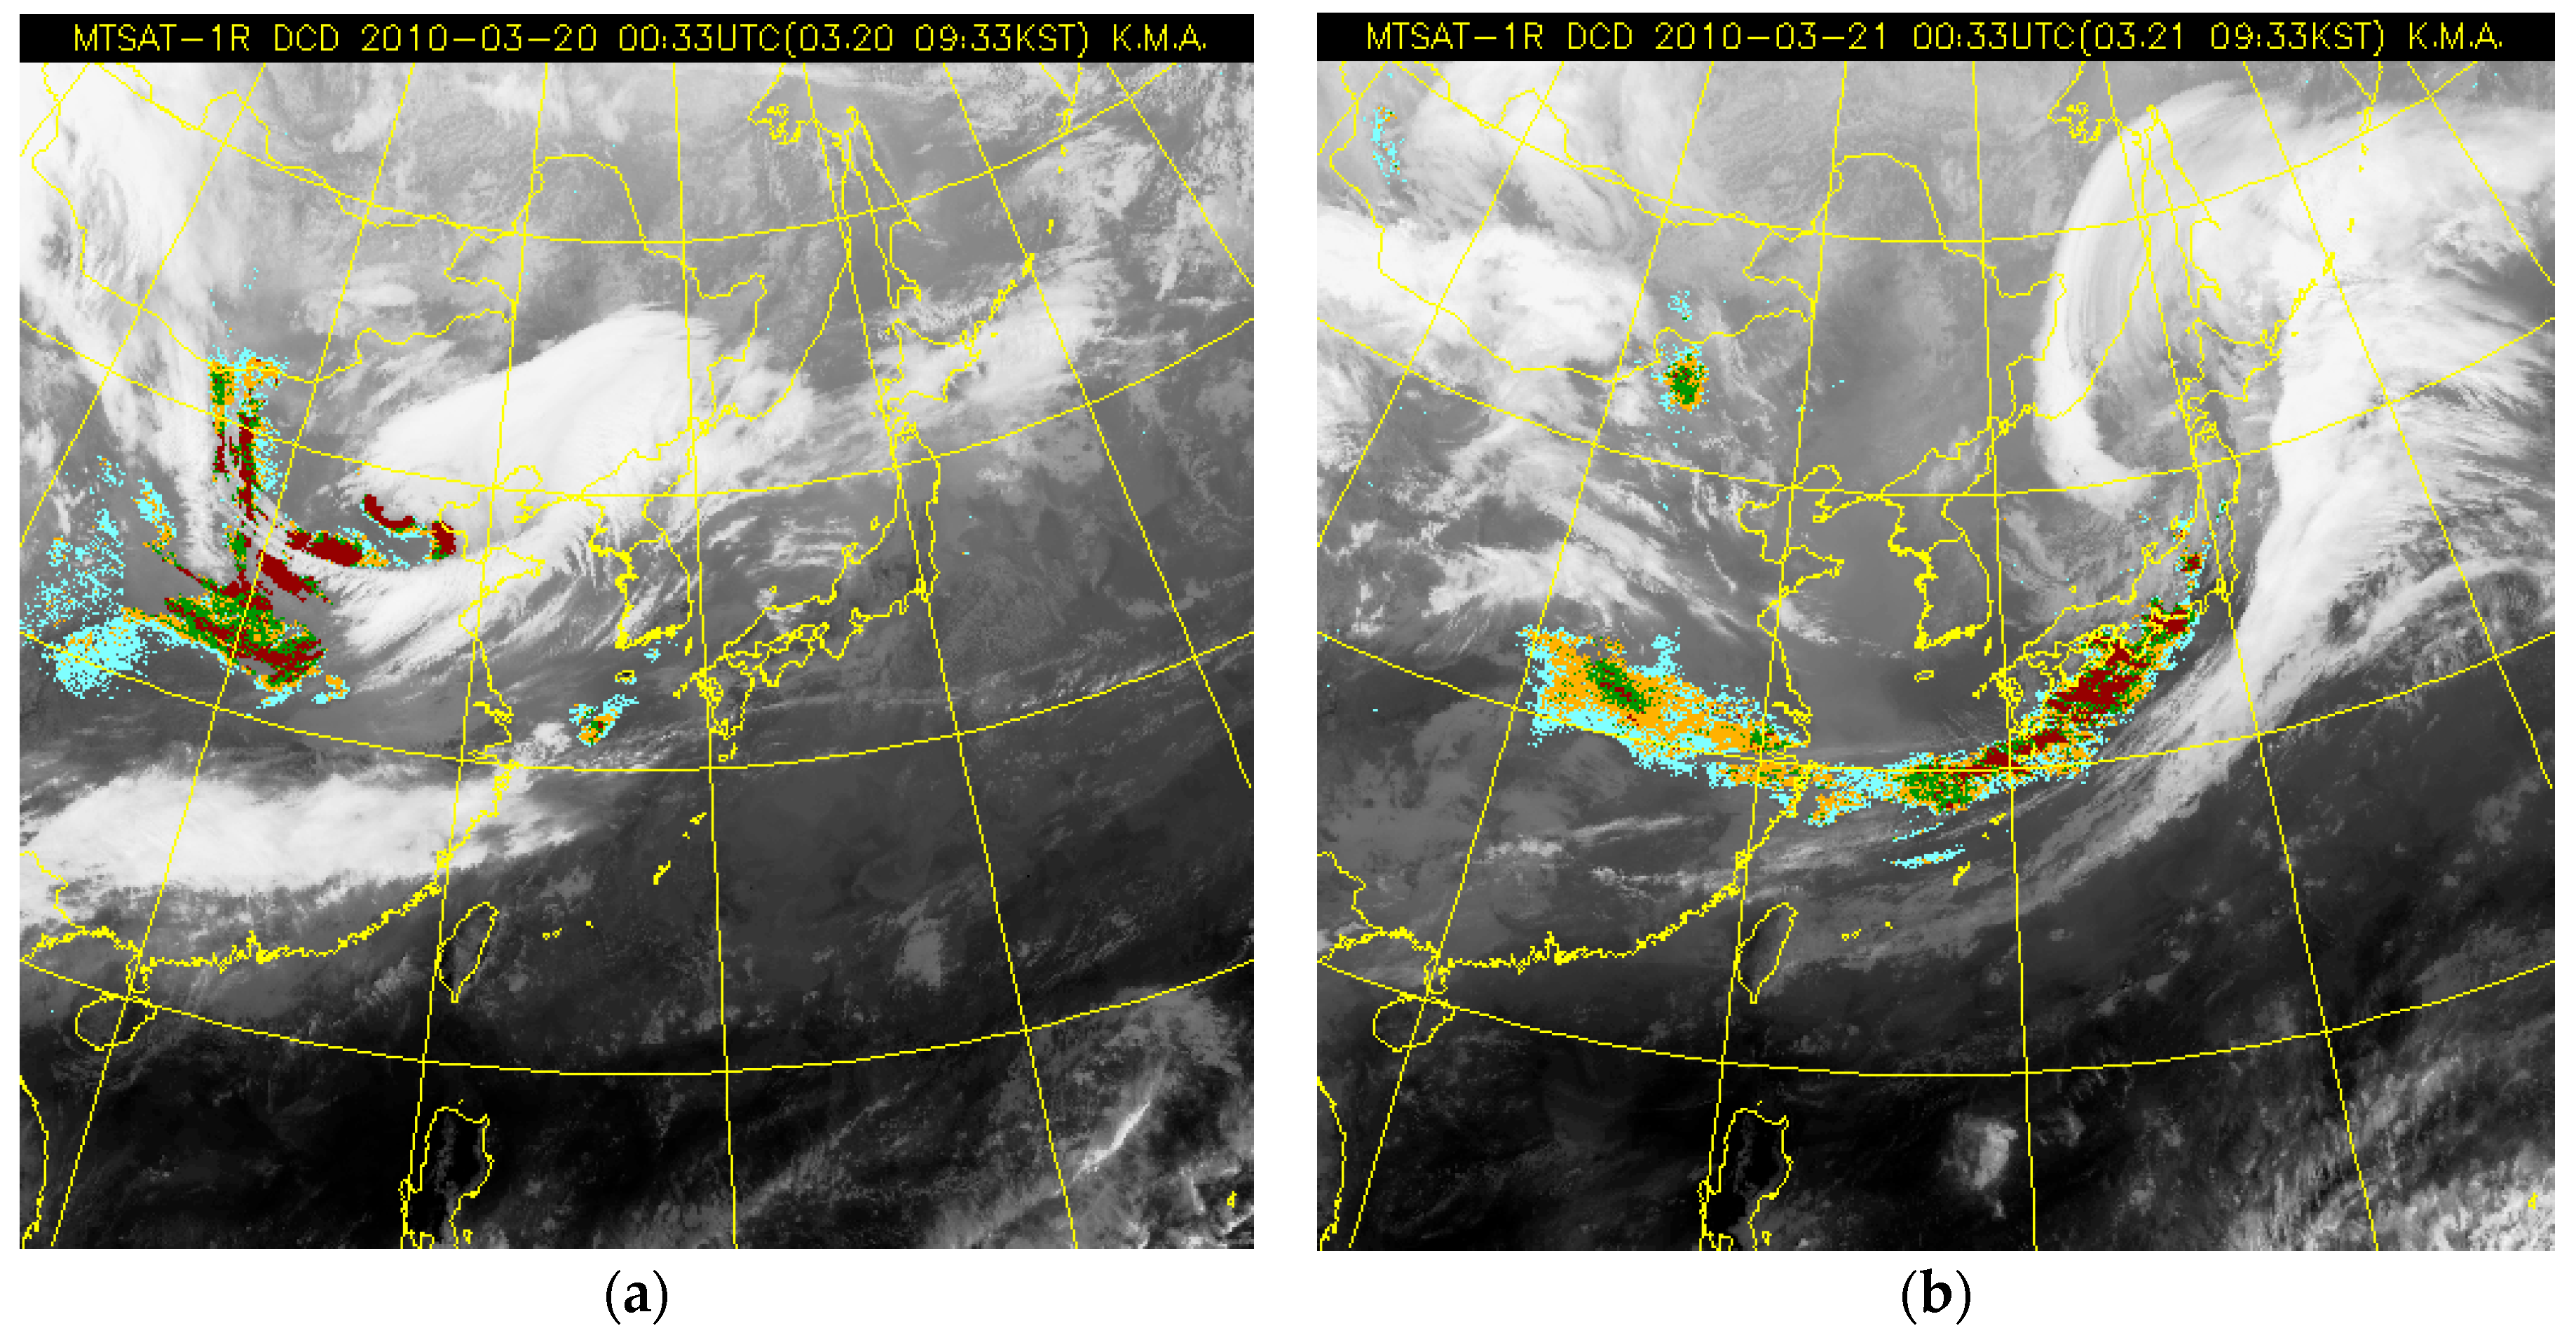
3.1. The Period of Dust Event

A dust storm occurred in China on 19 March 2010. Many cities in north and east China were affected by floating dust or blowing sand in different degrees. The PM10 concentration in Beijing exceeded 1500 µg∙m−3, which was considered to be heavily polluted. With the southward movement of the dust storm, the air quality in Macao deteriorated sharply, and all the automatic air measurement stations recorded the worst air quality index ever recorded. Some results even exceeded the instrument threshold.
The variation of total suspended particulates (TSP) concentration and meteorological conditions, including temperature, humidity, wind direction, and wind speed measured in Macao, are shown in Figure 3. All the data were measured from 00:00 on 20 March to 00:00 on 27 March, with a 15 min temporal resolution.
Figure 3a shows that the total suspended particulates concentration was very low before 21 March, and it had weak growth on that day before 18:00. After 18:00, the concentration increased sharply, and the TSP concentration was up to 799.06 µg·m−3 at 09:00 on 22 March. Then it gradually decreased and returned to the range of values before the dust storm. Figure 3b shows the variation of temperature. Obviously, the daily maximum temperature was 26.7 °C on the 21st, on which day the particulates concentration began to increase. Figure 3c shows the humidity was more than 59% in the dust episode. There was a shape drop in temperature on the 25th, and the minimum temperature was only 13.1 °C, while the humidity gradually decreased. The minimum humidity value was 40% and appeared on the 26th. The variations of wind direction and wind speed are shown in Figure 3d,e. The surface wind could influence the diffusion of pollution particles. Under the influence of a surface north wind on the 21st, dust particles from the north accelerated the southward movement. After the dust episode, the wind speed became stronger on the 25th and 26th, and the dust particulates concentration kept at a low level.

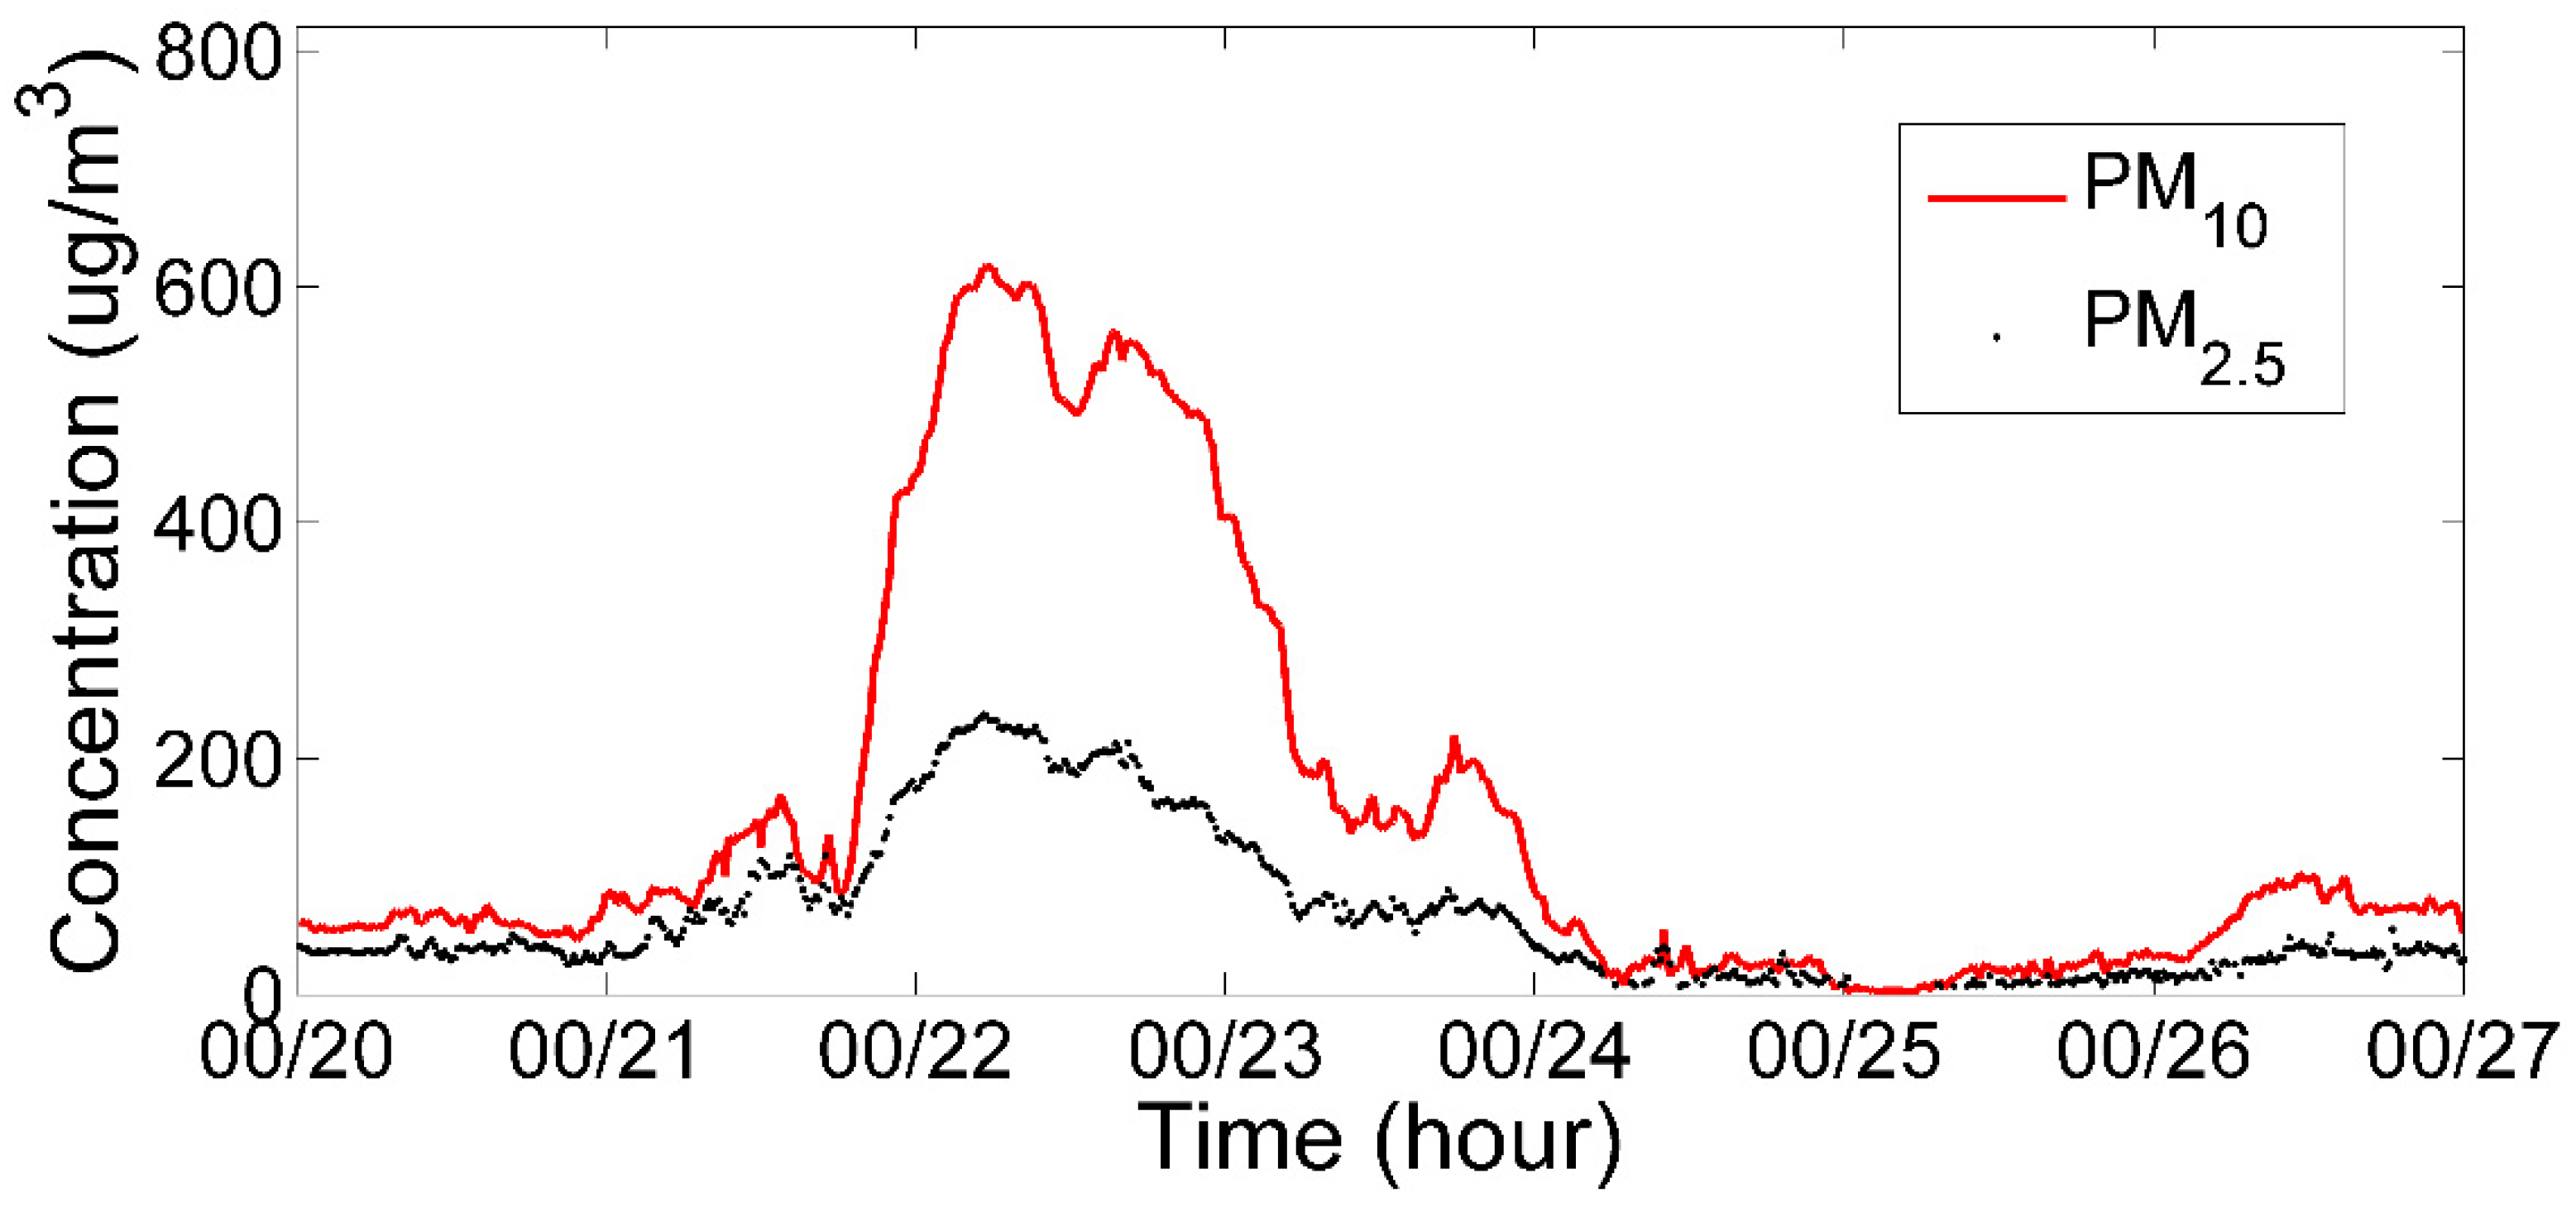
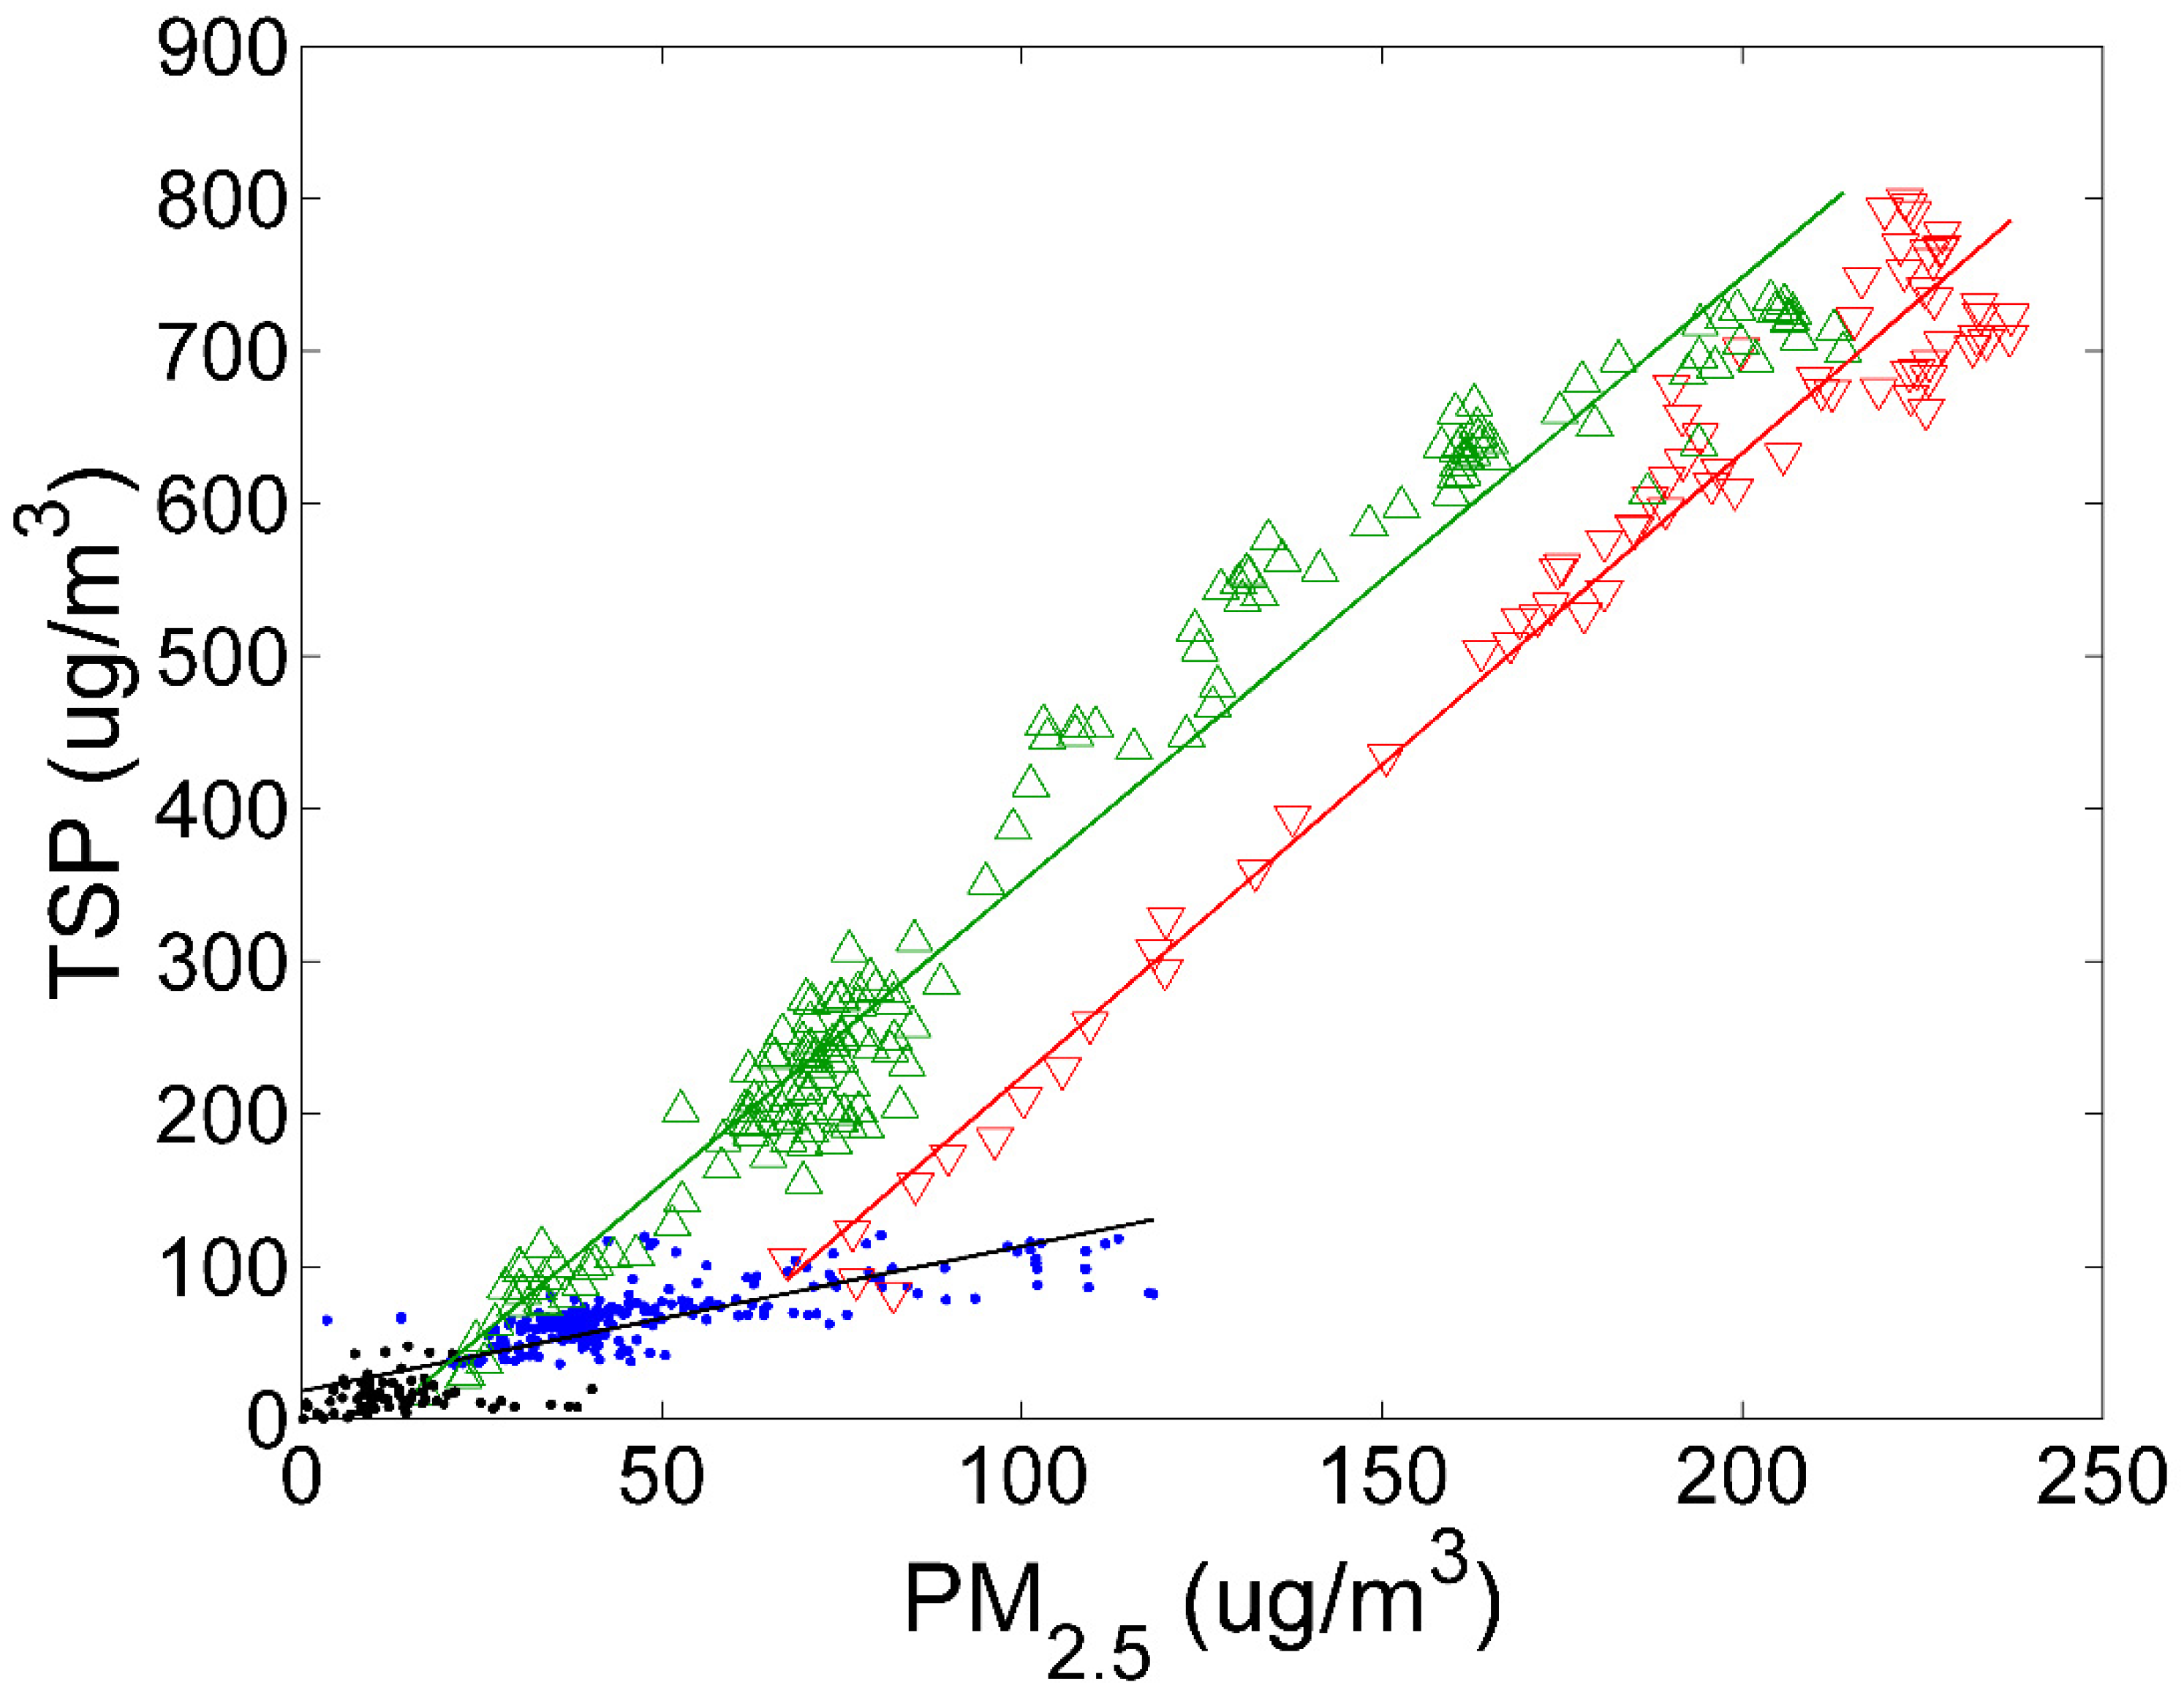
3.2. PM Concentration

Figure 4 presents the PM10 and PM2.5 concentrations in the dust episode. The red line and black dots represent the PM10 and PM2.5, respectively. A significant increase in PM10 and PM2.5 concentrations was found after 18:00 on 21 March. Before 21 March, the PM10 concentration was much lower, and the average value was only 60.16 µg·m−3. PM10 concentration had weak growth on 21st; however, it increased rapidly after 18:00. At 5:30 on 22nd the PM10 concentration was up to its maximum value 616.83 µg·m−3, which was ten times more than the average value before. Then, the high concentration maintained for a period of time and slowly decreased subsequently. Data show that the average value dropped to 31.27 µg·m−3 on 24th. By comparing the two curves in Figure 4, it is obvious that during the dust period, particles of large size (2.5~10 μm) are of domination in the suspended particles, which is different from that in non-dust periods when the domination is small particles (2.5 μm or less).
The variation of PM2.5 concentration in Figure 4 showed a similar trend with PM10. Both of them were consistent with that of the TSP concentration measured in the dust event. We correlated the concentrations of PM2.5 and TSP during the study period, and found that the correlation trends varied with time. The variation is shown in Figure 5. The black dots represent the PM2.5 concentration and TSP concentration results, measured simultaneously between 00:00 on the 19th and 18:00 on the 20th, before the dust event. The green triangles represent the PM2.5 and TSP concentrations measured simultaneously between 18:00 on the 21st and 08:00 on the 23rd, the period when the dust storm was strongest. The red triangles represent the PM2.5 and TSP concentrations between 08:00 on the 23rd and 05:00 on the 24th, when the dust storm had weakened. Further, the blue dots represent the PM2.5 and TSP concentrations between 05:00 and 24:00 on the 24th after the dust episode. It is seen in Figure 5 that the trends before (black dots), and after (blue dots), the dust episode are similar. The correlation during the dust episode (green and red triangles) is different from that in normal time (black and blue dots), and the correlations are different under the distinct intensities of the dust storm (green and red triangles). The correlation between PM2.5 and TSP concentrations is closely related to the aerosol composition. Aerosol composition is different in sandstorm and non-sandstorm situations, and even at different moments in the same dust event. Thus, results in Figure 5 reveal differences in aerosol composition under different weather conditions.
For further research, Figure 6 reports the PM2.5/PM10 ratio during the measurement. Before the sharp rise in particulate matter concentration, the PM2.5/PM10 ratio was about 0.6, which indicates a larger contribution of small particles before the dust event. When the dust particles were transported to Macao, the PM2.5/PM10 ratio quickly decreased. During the dust episode, the average value of PM2.5/PM10 ratio was only 0.36. The peak concentration of PM2.5 was 237.26 µg·m−3, and the peak concentration of PM10 was 616.83 µg·m−3 at the same time, when the value of PM2.5/PM10 was 0.38. It highlighted a greater contribution of large particles (2.5~10 μm) in the dust event, indicating that the proportion of fine particles (2.5 μm or less) was small. Table 2 summarizes the daily mean values of PM concentrations as well as the PM2.5/PM10 ratio for the period 19–26 March.

3.3. The Lidar Measurement

Lidar measurements in Macao enable us to study and characterize the vertical profiles of aerosol optical properties in the dust episode and follow its spatial and temporal evolution. The extinction coefficients inverted from Mie lidar in suit measurement are presented in Figure 7 and Figure 8. We report the results on the day of the dust event (22 March) and afterwards (26 March). Each of these profiles is an average of the results over 15 min with a spatial resolution of 3.75 m. The starting time is marked above.
It can be seen in Figure 7 that on 22 March, when the pollution was heavy, the particles congregation in the low altitude was evident. The extinction coefficient near the ground exceeded 0.7 km−1, which was a very high value since the availability of lidar detection in Macao. It is thought to be caused by dust particles at low altitude. The maximum value of extinction coefficients was 0.9 km−1 and it decreased rapidly to below 0.3 km−1 at about 0.9 km with increasing altitude. Detections between 15:25 and 15:57 showed a significant aerosol accumulation at about 4 km altitude. With the decreases in solar radiation, air temperature and atmospheric turbulence, it dropped to about 3 km after 19:13. The profiles between 19:13 and 19:28 showed multiple peaks in the aerosol accumulation layer at about 3 km, indicating its stratified structure. The source analysis of aerosol particles is given in the next subsection.
Figure 8 shows the detection results of the moderate pollution day on 26 March. The variation of extinction coefficients with height was very small below 2 km. There existed multiple layers of aerosol aggregation between 2.5 km and 5 km, and the near-surface extinction coefficients on 26th were smaller than that on 22nd.
The PM10 concentration from SMG and the near-surface extinction coefficients obtained from lidar on 26 March are shown in Figure 9. The blue line represents PM10 concentration and green dots represent extinction coefficients at 116 m. As shown in the figure, the extinction coefficients and PM10 concentration values were both higher around 11:00, and decreased after 15:00. They had similar trends and a good consistency in time. It also shows the reliability of the lidar system.
Comparing the extinction coefficients with PM10 concentrations in a heavy polluted episode and a moderate polluted episode, we find an interesting phenomenon. The average values of PM10 concentration were 537.26 µg·m−3 on 22nd and 70.53 µg·m−3 on 26th, respectively. The difference in PM10 concentration between the two days was more than seven times. This means the PM10 concentration fell from high pollution episode value to normal level. However, the near-surface extinction coefficients measured by lidar did not show such a difference. Lidar measurements showed that the impact by dust particles was not yet been over by 26th.
There are two main reasons for explaining the disagreement between PM10 concentrations and extinction coefficients. On one hand, as is known, the variation of return signals caused by different particle size distribution will impact the extinction coefficient retrieval from lidar measurement. In the heavy polluted episode, the larger particles are the major component of aerosols. However, they have a weaker influence on extinction in our back-scattering Mie lidar system because their scattering energy is mainly concentrated in the forward direction. On the other hand, the smaller particles can stay in the atmosphere for a longer period, about a week, compared to the rapidly dropping larger particles. The proportion of fine particles was large, so extinction coefficients on 26th were still at a high level.
Based on these two reasons, extinction coefficients at 355 nm are not sufficient to show the impact of dust particles on the atmosphere. Taking visibility as the contact among extinction coefficients at different wavelengths will diminish the influence caused by particle size. Figure 10 shows the near-surface extinction coefficients (116 m) at 1064 nm converted by Equation (3) and PM10 concentration values at the same time. The relationship between them can be fitted linearly. The correlation is helpful for inferring the vertical profiles of PM10 concentration in the dust episode and tracing the possible aerosol sources.
It should be noted that the above extinction coefficients were derived from Mie lidar measurements. The main disadvantage of Mie lidar is that one equation contains two quantities, the backscattering coefficient and the extinction coefficient. It suffers from the fact that these two quantities must be determined from only one elastic lidar return signal [74]. An inversion of Mie lidar data, a relationship between the two quantities, named the lidar ratio, must be assumed. It is one of the key error sources in Mie lidar data inversion. This problem can be solved by adding a Raman channel. The Raman channel receives the inelastic Raman signals of atmospheric nitrogen or oxygen molecules. Since the Raman backscatter coefficient of the reference gas is known, the particle extinction coefficient can be obtained independently. Combined with the elastic signals from Mie channel, the particle backscatter coefficient can be obtained, so that the real lidar ratio can be derived [75,76], which is of great significance for the study of aerosols. The lidar ratio, as an important optical parameter related to the type of aerosols, depends on the size distribution, shape, and chemical properties of the particles. In our future water vapor Raman lidar system, we have designed the nitrogen Raman channel at 387 nm to obtain an independent extinction coefficient and lidar ratio profiles.

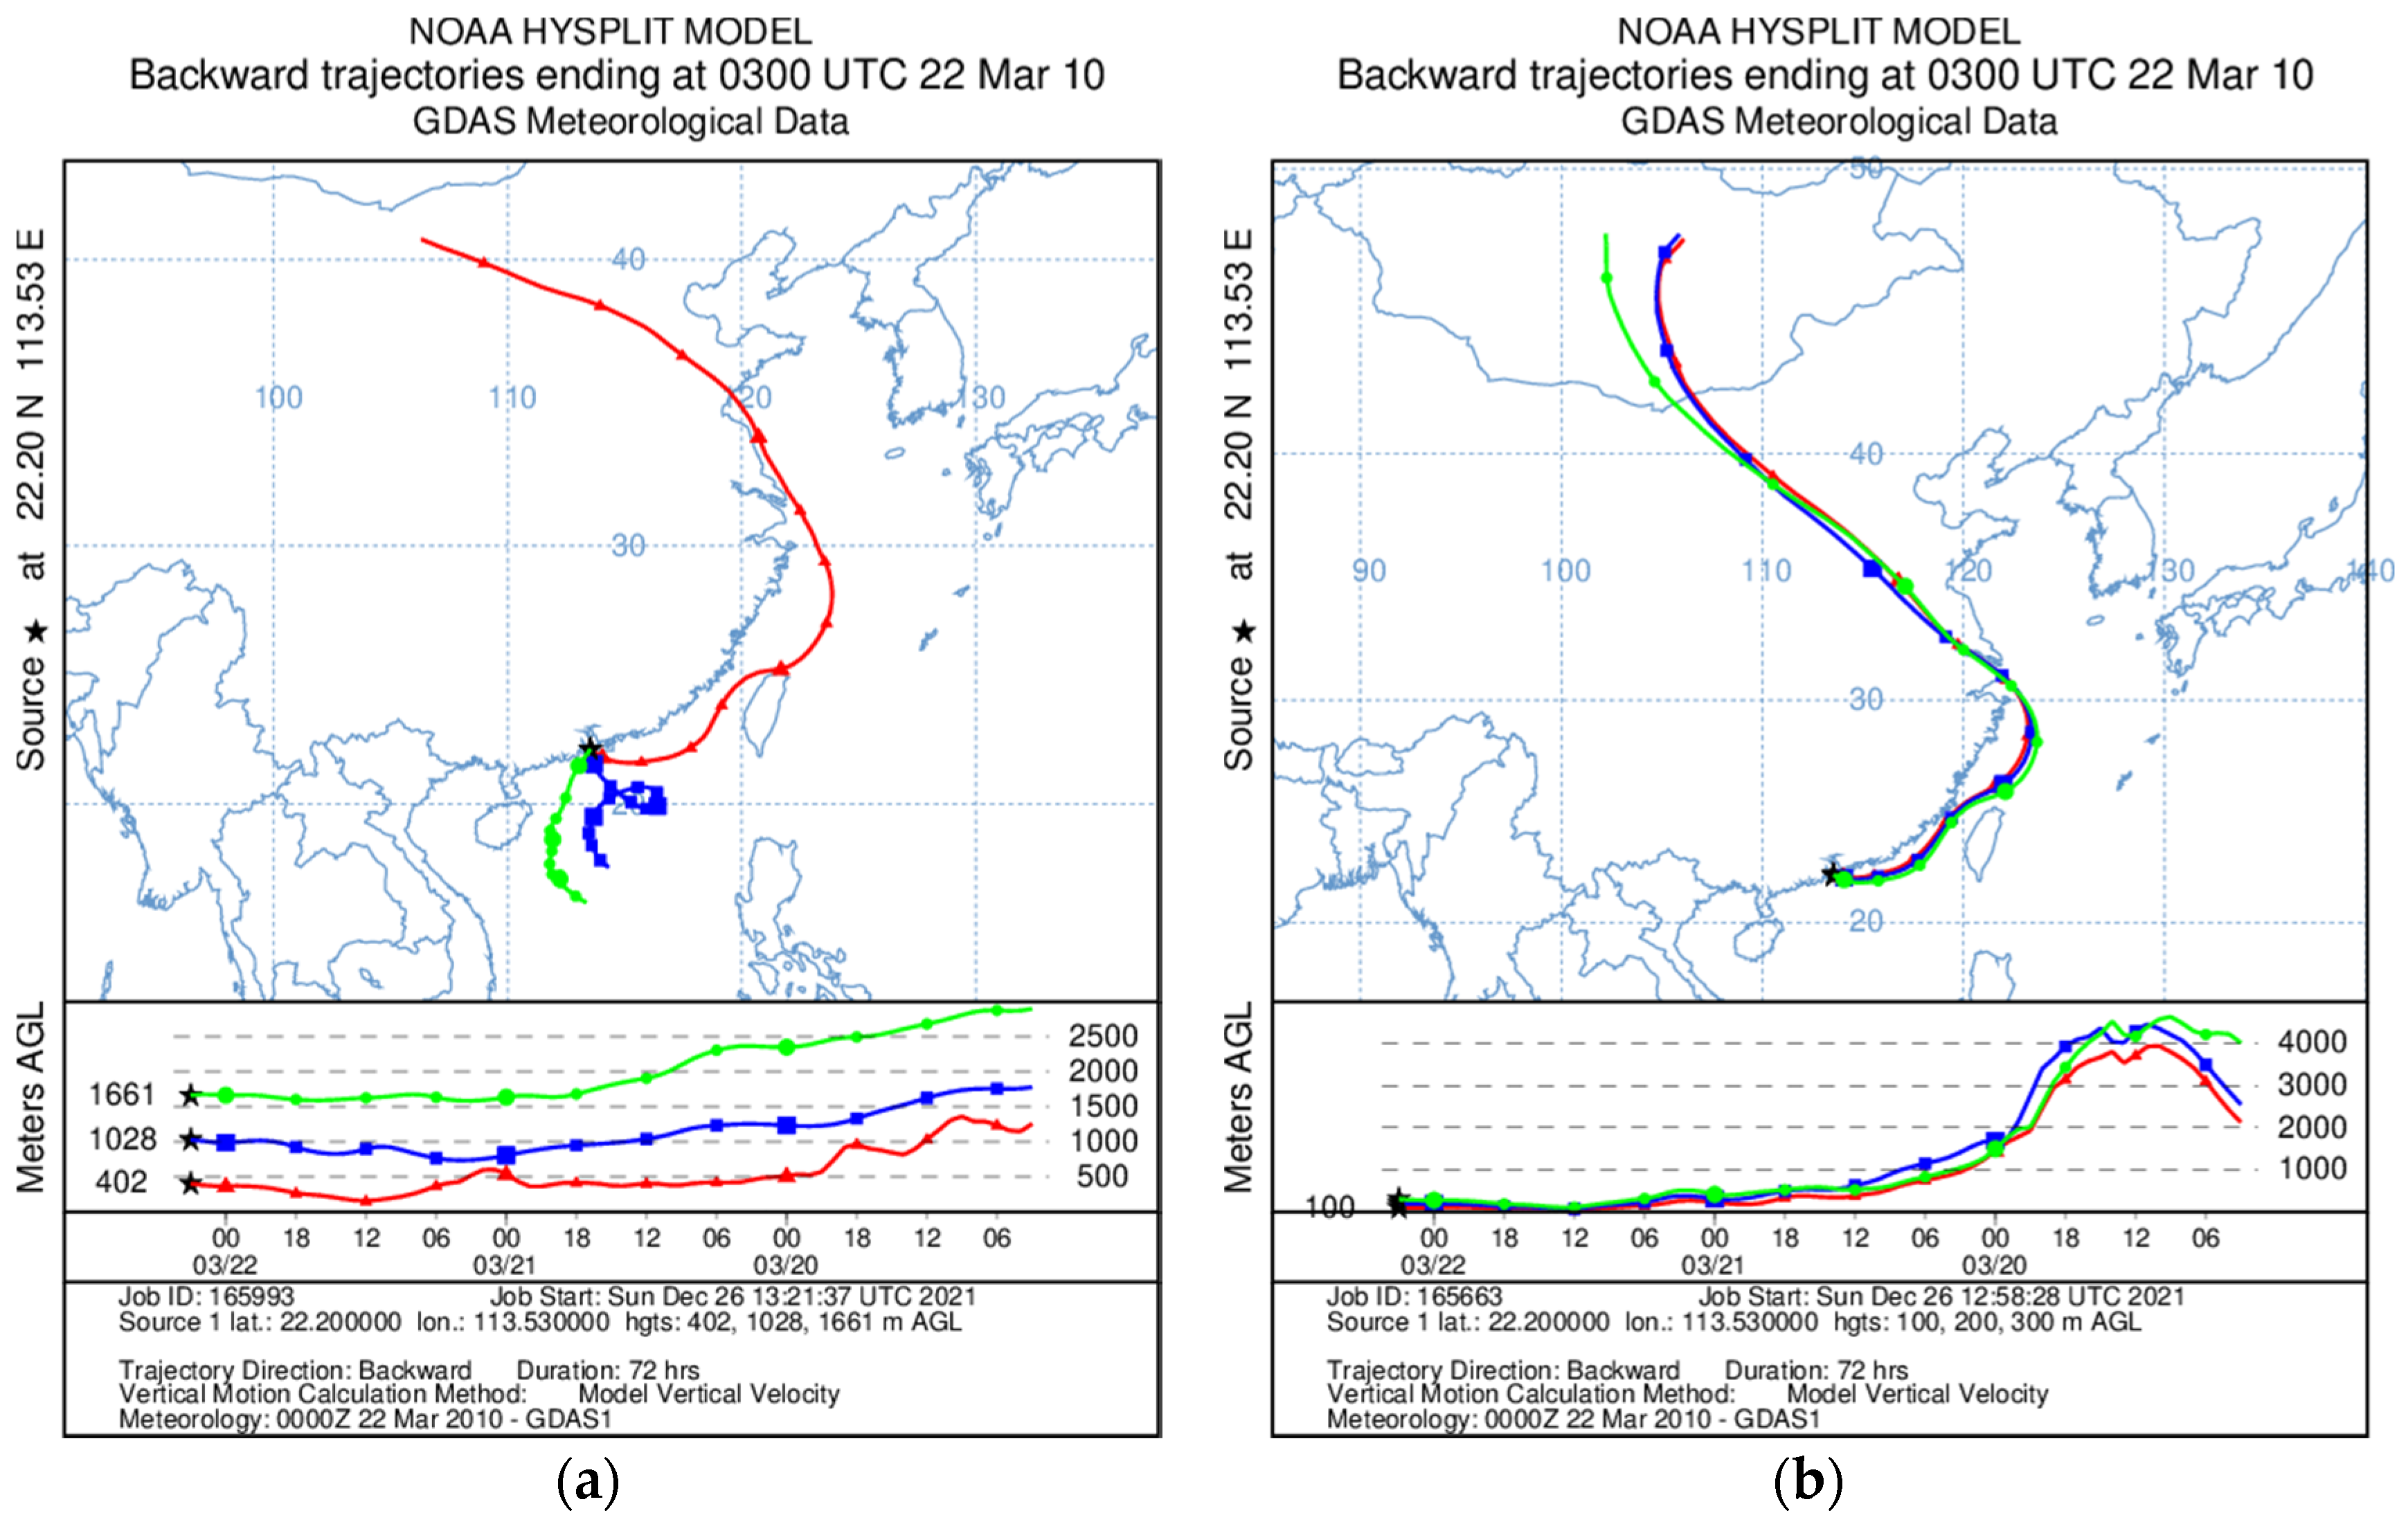
3.4. The Pollution Transport

The back-trajectory analysis of dense aerosol layers was simulated by using NOAA’s HYSPLIT model. Details in Figure 11a show that aerosol source materials at height of 1028 m and 1661 m above ground were mainly from the South China Sea. While aerosols at the height of 402 m came from north China, the source materials moved towards the southeast, went through the Yangtze River estuary, turned south along Taiwan Channel, and entered the south China seacoast. Figure 11b shows the aerosol back-trajectory at height of 300 m, 200 m, and 100 m, respectively. They all have similar tracks. Early in March 19th UTC, with the height about 4000 m, aerosols materials were in Mongolia and they dropped to 1000~2000 m when they arrived at Henan area on 20 March UTC. These materials went via Yangtze River estuary, moved along the southeast coast of China, and then reached Macao.
In addition to the back-trajectory results, satellite cloud images from Korea Meteorological Administration are presented in Figure 12. These showed that dust particulates were mainly distributed in North China on 20 March 2010. On 21 March, dust particulates were distributed in southern Japan and the Yangtze River Basin. The trajectories in Figure 11 all passed through the most dust-concentrated regions in Figure 12. The aerosol source analysis is confirmed.

4. Conclusions

A dust storm is a special phenomenon and dust particles characters are always different in each dust storm. In this paper, data from lidar and SMG near-surface instruments were used to provide a promising approach for the dust aerosol optical properties and the spatial and temporal distribution, in a high pollution episode in 2010. Aerosol extinction coefficients were measured by using the single channel Mie lidar, an initial phase of a future water vapor Raman lidar. It is the first time lidar has been used to detect aerosol extinction vertical profiles in a dust event in Macao.
The present work reports that correlations between PM2.5 and TSP varied with the intensity of dust storm, and the properties of the particles were also different. The PM2.5/PM10 ratio was smaller than usual during the dust storm, which shows that the aerosols were dominated by large particles. The properties such as particle size distribution shape and sedimentation rate will affect the extinction results retrieved by lidar. For particle characters that cannot be obtained by a single wavelength Mie lidar, the correlations between extinction coefficients and PM10 concentration in different episodes will provide some primary knowledge on atmospheric aerosol particles. In this case, a fitting result was established between extinction coefficients at 1064 nm and PM10 concentrations. This result will help researchers infer vertical profiles of PM10 in this period and obtain a better understanding about air quality over Macao. Back trajectory analysis and satellite cloud images were represented to estimate the possible sources of aerosol.
This research improves the understanding of the dust properties in Macao, and provides guidance for government on the prevention and pollution control. The UV lidar can perform atmospheric observation with high quality even in a heavily polluted episode. This will ensure continuous and effective observation and research of the spatial and temporal distribution of aerosol extinction coefficients. This work contributes to enrich the aerosol optical properties database, which is very useful for dust forecasting, early warning, global climate change models, and so on. Due to the short duration of this dust storm, the data we obtained was limited. The continuous operation of lidar will gather data for pollution episode studies. More data will be accumulated in extreme weather. Then, we will classify and fit them to optimize our results in future studies.

Author Contributions

Conceptualization, Q.L. and A.Y.C.; data curation, Q.L., S.C. and K.T.; funding acquisition, Q.L.; methodology, A.Y.C. and J.Z.; resources, A.Y.C.; software, Q.L.; writing—original draft, Q.L. and A.Y.C.; writing—review and editing, A.Y.C., J.Z., S.C. and K.T. All authors have read and agreed to the published version of the manuscript.

Funding

This research was funded by The National Natural Science Foundation of China, grant number 11904191; Shandong Provincial Natural Science Foundation, China, grant number ZR2018QD004 and BS2014HZ009.

Data Availability Statement

Not applicable.

Acknowledgments

The authors gratefully acknowledge Korea Meteorological Administration for providing satellite cloud images and the NOAA Air Resources Laboratory (ARL) for the provision of the HYSPLIT transport and dispersion model website (http://www.arl.noaa.gov/ready.html, accessed on 21 December 2010) used in this publication.

Conflicts of Interest

The authors declare no conflict of interest.

References

  1. Wang, X.M.; Lin, W.S.; Yang, L.M.; Deng, R.R.; Lin, H. A numerical study of influences of urban land-use change on ozone distribution over the Pearl River Delta region, China. Tellus B Chem. Phys. Meteorol. 2007, 59, 633–641. [Google Scholar] [CrossRef]
  2. Tong, C.H.M.; Yim, S.H.L.; Rothenberg, D.; Wang, C.; Lin, C.; Chen, Y.D.; Lau, N.C. Assessing the impacts of seasonal and vertical atmospheric conditions on air quality over the Pearl River Delta region. Atmos. Environ. 2018, 180, 69–78. [Google Scholar] [CrossRef]
  3. Zhang, N.; Wang, X.; Chen, Y.; Dai, W.; Wang, X. Numerical simulations on influence of urban land cover expansion and anthropogenic heat release on urban meteorological environment in Pearl River Delta. Theor. Appl. Climatol. 2015, 126, 469–479. [Google Scholar] [CrossRef]
  4. Wu, D.; Tie, X.; Li, C.; Ying, Z.; Lau, A.K.H.; Huang, J.; Deng, X.; Bi, X. An extremely low visibility event over the Guangzhou region: A case study. Atmos. Environ. 2005, 39, 6568–6577. [Google Scholar] [CrossRef]
  5. Zhang, H.; Wang, Y.; Hu, J.; Ying, Q.; Hu, X.M. Relationships between meteorological parameters and criteria air pollutants in three megacities in China. Environ. Res. 2015, 140, 242–254. [Google Scholar] [CrossRef]
  6. Li, J.; Lu, K.; Lv, W.; Li, J.; Zhong, L.; Ou, Y.; Chen, D.; Huang, X.; Zhang, Y. Fast increasing of surface ozone concentrations in Pearl River Delta characterized by a regional air quality monitoring network during 2006–2011. J. Environ. Sci. 2014, 26, 23–36. [Google Scholar] [CrossRef]
  7. Wang, T.; Poon, C.N.; Kwok, Y.H.; Li, Y.S. Characterizing the temporal variability and emission patterns of pollution plumes in the Pearl River Delta of China. Atmos. Environ. 2003, 37, 3539–3550. [Google Scholar] [CrossRef]
  8. Measures, R.M. Laser Remote Sensing: Fundamentals and Applications; Wiley: New York, NY, USA, 1984; pp. 259–269. [Google Scholar]
  9. Pelon, J.; Flamant, C.; Chazette, P.; Leon, J.F.; Tanre, D.; Sicard, M.; Satheesh, S.K. Characterization of aerosol spatial distribution and optical properties over the Indian Ocean from airborne LIDAR and radiometry during INDOEX’99. J. Geophys. Res. Atmos. 2002, 107, 8029. [Google Scholar] [CrossRef] [Green Version]
  10. Rader, F.; Traversi, R.; Severi, M.; Becagli, S.; Müller, K.J.; Nakoudi, K.; Ritter, C. Overview of Aerosol Properties in the European Arctic in Spring 2019 Based on In Situ Measurements and Lidar Data. Atmosphere 2021, 12, 271. [Google Scholar] [CrossRef]
  11. Esselborn, M.; Wirth, M.; Fix, A.; Tesche, M.; Ehret, G. Airborne high spectral resolution lidar for measuring aerosol extinction and backscatter coefficients. Appl. Opt. 2008, 47, 346–358. [Google Scholar] [CrossRef]
  12. Floutsi, A.A.; Baars, H.; Radenz, M.; Haarig, M.; Yin, Z.; Seifert, P.; Jimenez, C.; Ansmann, A.; Engelmann, R.; Barja, B.; et al. Advection of biomass burning aerosols towards the southern hemispheric mid-latitude station of Punta Arenas as observed with multiwavelength polarization Raman lidar. Remote Sens. 2021, 13, 138. [Google Scholar] [CrossRef]
  13. Eck, T.F.; Holben, B.N.; Dubovik, O.; Smirnov, A.; Goloub, P.; Chen, H.B.; Chatenet, B.; Gomes, L.; Zhang, X.Y.; Tsay, S.C.; et al. Columnar aerosol optical properties at AERONET sites in central eastern Asia and aerosol transport to the tropical mid-Pacific. J. Geophys. Res. Atmos. 2005, 110, D06202. [Google Scholar] [CrossRef]
  14. Chen, W.B.; Kuze, H.; Uchiyama, A.; Suzuki, Y.; Takeuchi, N. One-year observation of urban mixed layer characteristics at Tsukuba, Japan using a micro pulse lidar. Atmos. Environ. 2001, 35, 4273–4280. [Google Scholar] [CrossRef]
  15. Hicks, M.; Sakai, R.; Joseph, E. The evaluation of a new method to detect mixing layer heights using lidar observations. J. Atmos. Ocean. Technol. 2015, 32, 2041–2051. [Google Scholar] [CrossRef]
  16. Flamant, C.; Pelon, J.; Flamant, P.; Durand, P. Lidar determination of the entrainment zone thickness at the top of the unstable marine atmospheric boundary layer. Bound. Layer Meteorol. 1997, 83, 247–284. [Google Scholar] [CrossRef]
  17. Ji, X.; Liu, C.; Xie, Z.; Hu, Q.; Dong, Y.; Fan, G.; Zhang, T.; Xing, C.; Wang, Z.; Javed, Z.; et al. Comparison of mixing layer height inversion algorithms using lidar and a pollution case study in Baoding, China. J. Environ. Sci. 2019, 79, 81–90. [Google Scholar] [CrossRef] [PubMed]
  18. Zhang, N.; Chen, Y.; Zhao, W. Lidar and microwave radiometer observations of planetary boundary layer structure under light wind weather. J. Appl. Remote Sens. 2012, 6, 063513. [Google Scholar] [CrossRef]
  19. Strawbridge, K.B.; Snyder, B.J. Daytime and nighttime aircraft lidar measurements showing evidence of particulate matter transport into the northeastern valleys of the Lower Fraser Valley BC. Atmos. Environ. 2004, 38, 5873–5886. [Google Scholar] [CrossRef]
  20. Groß, S.; Freudenthaler, V.; Schepanski, K.; Toledano, C.; Schäfler, A.; Ansmann, A.; Weinzierl, B. Optical properties of long-range transported Saharan dust over Barbados as measured by dual-wavelength depolarization Raman lidar measurements. Atmos. Chem. Phys. 2015, 15, 11067–11080. [Google Scholar] [CrossRef] [Green Version]
  21. De Foy, B.; Burton, S.P.; Ferrare, R.A.; Hostetler, C.A.; Hair, J.W.; Wiedinmyer, C.; Molina, L.T. Aerosol plume transport and transformation in high spectral resolution lidar measurements and WRF-flexpart simulations during the MILAGRO field campaign. Atmos. Chem. Phys. 2011, 11, 3543–3563. [Google Scholar] [CrossRef] [Green Version]
  22. Prospero, J.M.; Barkley, A.E.; Gaston, C.J.; Gatineau, A.; Sansano, A.C.Y.; Panechou, K. Characterizing and quantifying African dust transport and deposition to South America: Implications for the phosphorus budget in the Amazon basin. Glob. Biogeochem. Cycles 2020, 34, e2020GB006536. [Google Scholar] [CrossRef]
  23. Prospero, J.M.; Collard, F.X.; Molinie, J.; Jeannot, A. Characterizing the annual cycle of African dust transport to the Caribbean Basin and South America and its impact on the environment and air quality. Glob. Biogeochem. Cycles 2014, 28, 757–773. [Google Scholar] [CrossRef]
  24. Lagrosas, N.; Yoshii, Y.; Kuze, H.; Takeuchi, N.; Naito, S.; Sone, A.; Kan, H. Observation of boundary layer aerosols using a continuously operated, portable lidar system. Atmos. Environ. 2004, 38, 3885–3892. [Google Scholar] [CrossRef]
  25. Haarig, M.; Ansmann, A.; Gasteiger, J.; Kandler, K.; Althausen, D.; Baars, H.; Radenz, M.; Farrell, D.A. Dry versus wet marine particle optical properties: RH dependence of depolarization ratio, backscatter, and extinction from multiwavelength lidar measurements during SALTRACE. Atmos. Chem. Phys. 2017, 17, 14199–14217. [Google Scholar] [CrossRef] [Green Version]
  26. Engelmann, R.; Kanitz, T.; Baars, H.; Heese, B.; Althausen, D.; Skupin, A.; Wandinger, U.; Komppula, M.; Stachlewska, I.S.; Amiridis, V.; et al. The automated multiwavelength Raman polarization and water-vapor lidar PollyXT: The neXT generation. Atmos. Meas. Tech. 2016, 9, 1767–1784. [Google Scholar] [CrossRef] [Green Version]
  27. Muñoz, R.; Undurraga, A. Daytime mixed layer over the santiago basin: Description of two years of observations with a lidar ceilometer. J. Appl. Meteorol. Climatol. 2010, 49, 1728–1741. [Google Scholar] [CrossRef]
  28. Gobbi, G.P.; Barnaba, F.; Giorgi, R.; Santacasa, A. Altitude-resolved properties of a Saharan dust event over the Mediterranean. Atmos. Environ. 2000, 34, 5119–5127. [Google Scholar] [CrossRef]
  29. Xie, C.; Tomoki, N.; Nobuo, S.; Ichiro, M.; Zifa, W. Characteristics of aerosol optical properties in pollution and Asian dust episodes over Beijing, China. Appl. Opt. 2008, 47, 4945–4951. [Google Scholar] [CrossRef]
  30. Kim, S.; Yoon, S.; Kim, J.; Kang, J.; Sugimoto, N. Asian dust event observed in Seoul, Korea, during 29–31 May 2008: Analysis of transport and vertical distribution of dust particles from lidar and surface measurements. Sci. Total Environ. 2010, 408, 1707–1718. [Google Scholar] [CrossRef]
  31. Chazette, P.; Pelon, J.; Moulin, C.; Trouillet, V.; Carrasco, I.; Dulac, F.; Guelle, W.; Bousquet, P.; Flamant, P.H. Synergy between lidar and Meteosat measurements for a Saharan dust event during SOFIA/ASTEX. J. Aerosol Sci. 1997, 28, S659–S660. [Google Scholar] [CrossRef]
  32. Kok, J.F.; Ward, D.S.; Mahowald, N.M.; Evan, A.T. Global and regional importance of the direct dust-climate feedback. Nat. Commun. 2018, 9, 241. [Google Scholar] [CrossRef]
  33. Li, Z.; Lau, W.K.M.; Ramanathan, V.; Wu, G.; Ding, Y.; Manoj, M.G.; Liu, J.; Qian, Y.; Li, J.; Zhou, T.; et al. Aerosol and monsoon climate interactions over Asia. Rev. Geophys. 2016, 54, 866–929. [Google Scholar] [CrossRef]
  34. Liu, Y.; Zhu, Q.; Huang, J.; Hua, S.; Jia, R. Impact of dust-polluted convective clouds over the Tibetan Plateau on downstream precipitation. Atmos. Environ. 2019, 209, 67–77. [Google Scholar] [CrossRef]
  35. Aragnou, E.; Watt, S.; Nguyen Duc, H.; Cheeseman, C.; Riley, M.; Leys, J.; White, S.; Salter, D.; Azzi, M.; Tzu-Chi Chang, L.; et al. Dust transport from inland Australia and its impact on air quality and health on the eastern coast of Australia during the February 2019 dust storm. Atmosphere 2021, 12, 141. [Google Scholar] [CrossRef]
  36. Huang, J.; Lin, B.; Minnis, P.; Wang, T.; Wang, X.; Hu, Y.; Yi, Y.; Ayers, J.K. Satellite-based assessment of possible dust aerosols semi-direct effect on cloud water path over East Asia. Geophys. Res. Lett. 2006, 33, L19802. [Google Scholar] [CrossRef] [Green Version]
  37. Huang, J.P.; Wang, T.H.; Wang, W.C.; Li, Z.Q.; Yan, H.R. Climate effects of dust aerosols over East Asian arid and semiarid regions. J. Geophys. Res. Atmos. 2014, 119, 11398–11416. [Google Scholar] [CrossRef]
  38. Griffin, D.W. Atmospheric movement of microorganisms in clouds of desert dust and implications for human health. Clin. Microbiol. Rev. 2007, 20, 459–477. [Google Scholar] [CrossRef] [Green Version]
  39. Ardon-Dryer, K.; Mock, C.; Reyes, J.; Lahav, G. The effect of dust storm particles on single human lung cancer cells. Environ. Res. 2019, 181, 108891–108898. [Google Scholar] [CrossRef]
  40. Weinzierl, B.; Sauer, D.; Esselborn, M.; Petzold, A.; Veira, A.; Rose, M.; Mund, S.; Wirth, M.; Ansmann, A.; Tesche, M.; et al. Microphysical and optical properties of dust and tropical biomass burning aerosol layers in the Cape Verde region-an overview of the airborne in situ and lidar measurements during SAMUM-2. Tellus B Chem. Phys. Meteorol. 2011, 63, 589–618. [Google Scholar] [CrossRef] [Green Version]
  41. Weinzierl, B.; Petzold, A.; Esselborn, M.; Wirth, M.; Rasp, K.; Kandler, K.; Schuetz, L.; Koepke, P.; Fiebig, M. Airborne measurements of dust layer properties, particle size distribution and mixing state of Saharan dust during SAMUM 2006. Tellus B Chem. Phys. Meteorol. 2009, 61, 96–117. [Google Scholar] [CrossRef] [Green Version]
  42. Peshev, Z.Y.; Dreischuh, T.N.; Evgenieva, T.T.; Deleva, A.D.; Tonev, D.; Stoyanov, D.V. Lidar observations of long-range transported Saharan dust over Sofia, Bulgaria: A case study of dust mixed with local aerosols. J. Appl. Remote Sens. 2016, 10, 036009. [Google Scholar] [CrossRef]
  43. Chen, W.N.; Tsai, F.J.; Chou, C.C.K.; Chang, S.Y.; Chen, Y.W.; Chen, J.P. Optical properties of Asian dusts in the free atmosphere measured by Raman lidar at Taipei, Taiwan. Atmos. Environ. 2007, 41, 7698–7714. [Google Scholar] [CrossRef]
  44. Sakai, T.; Nagai, T.; Nakazato, M.; Mano, Y.; Matsumura, T. Ice clouds and Asian dust studied with lidar measurements of particle extinction-to-backscatter ratio, particle depolarization, and water-vapor mixing ratio over Tsukuba. Appl. Opt. 2003, 42, 7103–7116. [Google Scholar] [CrossRef] [PubMed]
  45. Yin, Z.; Yi, F.; He, Y.; Liu, F.; Yu, C.; Zhang, Y.; Wang, W. Asian dust impacts on heterogeneous ice formation at Wuhan based on polarization lidar measurements. Atmos. Environ. 2021, 246, 118166. [Google Scholar] [CrossRef]
  46. Mehri, T.; Kemppinen, O.; David, G.; Lindqvist, H.; Tyynelä, J.; Nousiainen, T.; Rairoux, P.; Miffre, A. Investigating the size, shape and surface roughness dependence of polarization lidars with light-scattering computations on real mineral dust particles: Application to dust particles’ external mixtures and dust mass concentration retrievals. Atmos. Res. 2018, 203, 44–61. [Google Scholar] [CrossRef]
  47. Jugder, D.; Sugimoto, N.; Shinoda, M.; Kimura, R.; Matsui, I.; Nishikawa, M. Dust, biomass burning smoke, and anthropogenic aerosol detected by polarization-sensitive Mie lidar measurements in Mongolia. Atmos. Environ. 2012, 54, 231–241. [Google Scholar] [CrossRef]
  48. Soupiona, O.; Papayannis, A.; Kokkalis, P.; Mylonaki, M.; Tsaknakis, G.; Argyrouli, A.; Vratolis, S. Long-term systematic profiling of dust aerosol optical properties using the EOLE NTUA lidar system over Athens, Greece (2000–2016). Atmos. Environ. 2018, 183, 165–174. [Google Scholar] [CrossRef]
  49. Yang, L.; Hu, Z.; Huang, Z.; Wang, L.; Han, W.; Yang, Y.; Tao, H.; Wang, J. Detection of a dust storm in 2020 by a multi-observation platform over the Northwest China. Remote Sens. 2021, 13, 1056. [Google Scholar] [CrossRef]
  50. Yu, H.; Chin, M.; Yuan, T.; Bian, H.; Remer, L.A.; Prospero, J.M.; Omar, A.; Winker, D.; Yang, Y.; Zhang, Y.; et al. The fertilizing role of African dust in the Amazon rainforest: A first multiyear assessment based on data from cloud-aerosol lidar and infrared pathfinder satellite observations. Geophys. Res. Lett. 2015, 42, 1984–1991. [Google Scholar] [CrossRef]
  51. Gao, X.; Cao, X.; Tian, P.; Zhang, L.; Huang, Z.; Zhou, T. Combined observation of a dust storm over the Loess Plateau using a dual-wavelength lidar and an aethalometer. Atmo. Pollut. Res. 2017, 8, 1103–1112. [Google Scholar] [CrossRef]
  52. Sugimoto, N.; Nishizawa, T.; Shimizu, A.; Matsui, I.; Kobayashi, H. Detection of internally mixed Asian dust with air pollution aerosols using a polarization optical particle counter and a polarization-sensitive two-wavelength lidar. J. Quant. Spectrosc. Ra. 2015, 150, 107–113. [Google Scholar] [CrossRef]
  53. Müller, D.; Veselovskii, I.; Kolgotin, A.; Tesche, M.; Ansmann, A.; Dubovik, O. Vertical profiles of pure dust and mixed smoke-dust plumes inferred from inversion of multiwavelength Raman/polarization lidar data and comparison to AERONET retrievals and in situ observations. Appl. Opt. 2013, 52, 3178–3202. [Google Scholar] [CrossRef] [PubMed] [Green Version]
  54. Sakai, T.; Orikasa, N.; Nagai, T.; Murakami, M.; Tajiri, T.; Saito, A.; Yamashita, K.; Hashimoto, A. Balloon-borne and Raman lidar observations of Asian dust and cirrus cloud properties over Tsukuba, Japan. J. Geophys. Res. Atmos. 2014, 119, 3295–3308. [Google Scholar] [CrossRef]
  55. Ma, X.; Wang, C.; Han, G.; Ma, Y.; Li, S.; Gong, W.; Chen, J. Regional atmospheric aerosol pollution detection based on LiDAR remote sensing. Remote Sens. 2019, 11, 2339. [Google Scholar] [CrossRef] [Green Version]
  56. Fernández, A.J.; Sicard, M.; Costa, M.J.; Guerrero-Rascado, J.L.; Gómez-Amo, J.L.; Molero, F.; Barragán, R.; Basart, S.; Bortoli, D.; Bedoya-Velásquez, A.E.; et al. Extreme, wintertime Saharan dust intrusion in the Iberian peninsula: Lidar monitoring and evaluation of dust forecast models during the February 2017 event. Atmos. Res. 2019, 228, 223–241. [Google Scholar] [CrossRef]
  57. Wang, T.; Han, Y.; Hua, W.; Tang, J.; Huang, J.; Zhou, T.; Huang, Z.; Bi, J.; Xie, H. Profiling dust mass concentration in Northwest China using a joint lidar and sun-photometer setting. Remote Sens. 2021, 13, 1099. [Google Scholar] [CrossRef]
  58. Tao, M.; Chen, L.; Wang, Z.; Tao, J.; Su, L. Satellite observation of abnormal yellow haze clouds over East China during summer agricultural burning season. Atmos. Environ. 2013, 79, 632–640. [Google Scholar] [CrossRef]
  59. Liu, B.; Ma, Y.; Gong, W.; Zhang, M.; Yang, J. Study of continuous air pollution in winter over Wuhan based on ground-based and satellite observations. Atmos. Pollut. Res. 2018, 9, 156–165. [Google Scholar] [CrossRef]
  60. Tam, K.; Lam, K.L.; Chan, C.H.; Viseu, A.; Cheng, A.Y.S. Studies of urban aerosols in Macao using a horizontal Mie lidar. J. Light Scatt. 2008, 20, 375–378. [Google Scholar] [CrossRef]
  61. Kent, G.S. Deduction of aerosol concentrations from 1.06 μm lidar measurements. Appl. Opt. 1978, 17, 3763–3773. [Google Scholar] [CrossRef]
  62. Guasta, M.D.; Marini, S. On the retrieval of urban aerosol mass concentration by a 532 and 1064 nm lidar. J. Aerosol Sci. 2000, 31, 1469–1488. [Google Scholar] [CrossRef]
  63. Guasta, M.D. Daily cycles in urban aerosol observed in Florence (Italy) by means of an automatic 532–1064 nm lidar. Atmos. Environ. 2002, 36, 2853–2865. [Google Scholar] [CrossRef]
  64. Fernald, F.G.; Herman, B.M.; Reagan, J.A. Determination of aerosol height distribution by lidar. J. Appl. Meteor. 1972, 11, 482–489. [Google Scholar] [CrossRef] [Green Version]
  65. US Standard Atmosphere; US Government Printing Office: Washington, DC, USA, 1976.
  66. Ansmann, A.; Engelmann, R.; Althausen, D.; Wandinger, U.; Hu, M.; Zhang, Y.; He, Q. High aerosol load over the Pearl River Delta, South China, observed with Raman lidar and Sun photometer. Geophys. Res. Lett. 2005, 32, L13815. [Google Scholar] [CrossRef]
  67. Cheng, A.Y.S.; Walton, A.; Chen, J.C.L. Urban aerosols spatial variations using a slant angle scanning Mie Lidar system. In Proceedings of the SPIE’s 3rd International Asia-Pacific Symposium on Remote Sensing of the Atmosphere, Environment and Space, Hangzhou, China, 23–27 October 2002; Volume 4893, pp. 17–24. [Google Scholar] [CrossRef]
  68. Liu, Q.J.; Yang, L.; Wang, J.Y.; Zuo, H.Y.; Luo, S.R.; Cheng, A.Y.S. Calculation of the overlap factor and correction of near-field signal of the off-axis lidar based on the Gaussian mode of laser beam. Acta Phys. Sin. 2009, 58, 7376–7381. [Google Scholar] [CrossRef]
  69. Cheng, A.Y.S.; Viseu, A.; Leong, F.K.C.; Chan, C.S.; Tam, K.S.; Chan, R.L.M. Horizontal eye-safe Mie lidar for monitoring of urban aerosols in Macao. In Proceedings of the the SPIE’s 12th international Symposium on Remote Sensing—Lidar Technologies, Techniques, and Measurements for Atmospheric Remote Sensing, Bruges, Belgium, 19–22 September 2005; Volume 5984. [Google Scholar] [CrossRef]
  70. Inaba, H. Detection of atoms and molecules by Raman scattering and resonance fluorescence. In Laser Monitoring of the Atmosphere; Hinkley, E.D., Ed.; Springer: Berlin/Heidelberg, Germany, 1976; Chapter 5. [Google Scholar]
  71. Twomey, S.; Howell, H.B. The relative merit of white and monochromatic light for the determination of visibility by backscattering measurements. Appl. Opt. 1965, 4, 501–506. [Google Scholar] [CrossRef]
  72. Robert, W.F. Correlation between atmospheric backscattering and meteorological visual range. Appl. Opt. 1966, 5, 293–295. [Google Scholar]
  73. Bertolotti, M.; Muzii, L.; Sette, D. On the possibility of measuring optical visibility by using a ruby laser. Appl. Opt. 1969, 8, 117–120. [Google Scholar] [CrossRef]
  74. Ansmann, A.; Riebesell, M.; Weitkamp, C. Measurements of atmospheric aerosol extinction profiles with a Raman lidar. Opt. Lett. 1990, 15, 746–748. [Google Scholar] [CrossRef]
  75. Richard, A.F.; David, D.T.; Lorraine, H.B.; Wayne, F.F.; Oleg, D.; Tim, P.T. Raman lidar measurements of the aerosol extinction-to-backscatter ratio over the Southern Great Plains. J. Geophys. Res. Atmos. 2001, 106, 20333–20347. [Google Scholar] [CrossRef] [Green Version]
  76. Noh, Y.M.; Kim, Y.J.; Müller, D. Seasonal characteristics of lidar ratios measured with a Raman lidar at Gwangju, Korea in spring and autumn. Atmos. Environ. 2008, 42, 2208–2224. [Google Scholar] [CrossRef]
Figure 1. Map of the city of Macao with the location of our lidar system in the Macao Meteorological and Geophysical Bureau.
Remotesensing 14 00118 g001
Figure 2. Schematic diagram of the lidar system. The instrument is a future water vapor Raman lidar. In the dust episode, we only used its Mie channel and used it as a 355 nm Mie lidar, since the system is under construction.
Remotesensing 14 00118 g002
Figure 3. The total suspended particulates concentration and meteorological data between 20 March and 27 March: (a) total suspended particulates concentration; (b) temperature; (c) humidity; (d) wind direction; (e) wind speed.
Remotesensing 14 00118 g003aRemotesensing 14 00118 g003b
Figure 4. Concentrations of PM10 and PM2.5 between 20 March and 27 March. There was a significant increase in PM10 and PM2.5 concentrations in the dust episode.
Remotesensing 14 00118 g004
Figure 5. The correlation between PM2.5 and TSP concentrations. Black dots represent results measured between 00:00 on 19 March and 18:00 on 21 March; green triangles represent results measured between 18:00 on 21 March and 08:00 on 23 March; red triangles represent results measured between 08:00 on 23 March and 05:00 on 24 March; blue dots represent results measured between 05:00 and 24:00 on 24 March.
Remotesensing 14 00118 g005
Figure 6. PM2.5/PM10 ratio between 20 March and 27 March. The ratio was small in the dust episode, which showed that the aerosols were dominated by large particles.
Remotesensing 14 00118 g006
Figure 7. Extinction coefficients at 355 nm inverted from lidar on 22 March.
Remotesensing 14 00118 g007
Figure 8. Extinction coefficients at 355 nm inverted from lidar on 26 March.
Remotesensing 14 00118 g008
Figure 9. The PM10 concentration and lidar extinction on 26 March. The blue line represents PM10 concentration obtained from SMG; green dots represent results at 355 nm measured by lidar.
Remotesensing 14 00118 g009
Figure 10. The agreement between extinction coefficients inverted from lidar and PM10 concentration values.
Remotesensing 14 00118 g010
Figure 11. Back-trajectory at different heights by HYSPLIT model: (a) height at 402 m (red triangle), 1028 m (blue square) and 1661 m (green spot); (b) height at 100 m (red triangle), 200 m (blue square), and 300 m (green spot).
Remotesensing 14 00118 g011
Figure 12. Satellite cloud images from Korea Meteorological Administration, the color regions represent the dust particulates concentration in atmosphere: (a) Dust particulates (color region) were mainly distributed in North China on 20 March 2010; (b) Dust particulates (color region) were distributed in southern Japan and the Yangtze River Basin on 21 March 2010.
Remotesensing 14 00118 g012
Table 1. Main parameters of lidar.
Emission
Laser
Wavelength
Nd:YAG
355 nm\532 nm
Pulse width (FWHM)5.7 ns
Repetition rate50 Hz
Maximum Pulse energy~160 mJ
Beam diameter~8 mm expanded to ~70 mm
Laser Beam divergence
(Full angle measured at FWHM)
0.5 mrad
Receiver
TelescopeNewtonian
Telescope diameter254 mm
Field-of-View0.1–11.25 mrad adjustable
Band-pass filter1 nm FWHM
Acquisition
Detector
Data acquisition
Sampling rate
Sampling mode
Hamamatsu PMT
Transient recorder
40 MHz
Analogue and photon-counting
Range resolution3.75 m
Max range bins61.44 km
Table 2. Daily mean values of PM2.5, PM10, and PM2.5/PM10 ratio.
MarchPM10PM2.5PM2.5/PM10
1962.1438.270.613
2060.1637.680.63
21147.784.500.63
22537.26196.380.36
23203.5479.660.41
2431.2717.200.56
2517.127.840.55
2670.5330.420.44
Publisher’s Note: MDPI stays neutral with regard to jurisdictional claims in published maps and institutional affiliations.

