Article

Multiple Effects of Topographic Factors on Spatio-Temporal Variations of Vegetation Patterns in the Three Parallel Rivers Region, Southeast Qinghai-Tibet Plateau

1
Chengdu Institute of Biology, Chinese Academy of Sciences, Chengdu 610041, China
2
Mangkang Ecological Monitoring Station, Tibet Ecological Security Barrier Ecological Monitoring Network, Qamdo 854000, China
3
Earth Sciences College, Chengdu University of Technology, Chengdu 610059, China
4
School of Resources and Environmental Sciences, Lanzhou University, Lanzhou 730000, China
5
Northwest Institute of Eco-Environment and Resources, Chinese Academy Sciences, Lanzhou 730000, China
*
Author to whom correspondence should be addressed.
Remote Sens. 2022, 14(1), 151; https://doi.org/10.3390/rs14010151
Submission received: 7 December 2021 / Revised: 25 December 2021 / Accepted: 26 December 2021 / Published: 30 December 2021
(This article belongs to the Special Issue Remote Sensing of Watershed)

Abstract

:
Topographic factors are critical for influencing vegetation distribution patterns, and studying the interactions between them can enhance our understanding of future vegetation dynamics. We used the Moderate-resolution Imaging Spectroradiometer Normalized Differential Vegetation Index (MODIS NDVI) image dataset (2000–2019), combined with the Digital Elevation Model (DEM), and vegetation type data for trend analysis, and explored NDVI variation and its relationship with topographic factors through an integrated geographically-weighted model in the Three Parallel Rivers Region (TPRR) of southeastern Qinghai-Tibet Plateau (QTP) in the past 20 years. Our results indicated that there was no significant increase of NDVI in the entire basin between 2000–2019, except for the Lancang River basin. In the year 2004, abrupt changes in NDVI were observed across the entire basin and each sub-basin. During 2000–2019, the mean NDVI value of the whole basin increased initially and then decreased with the increasing elevation. However, it changed marginally with variations in slope and aspect. We observed a distinct spatial heterogeneity in vegetation patterns with elevation, with higher NDVI in the southern regions NDVI than those in the north as a whole. Most of the vegetation cover was concentrated in the slope range of 8~35°, with no significant difference in distribution except flat land. Furthermore, from 2000 to 2019, the vegetation cover in the TPRR showed an improving trend with the changes of various topographic factors, with the largest improvement area (36.10%) in the slightly improved category. The improved region was mainly distributed in the source area of the Jinsha River basin and the southern part of the whole basin. Geographically weighted regression (GWR) analysis showed that elevation was negatively correlated with NDVI trends in most areas, especially in the middle reaches of Nujiang River basin and Jinsha River basin, where the influence of slope and aspect on NDVI change was considerably much smaller than elevation. Our results confirmed the importance of topographic factors on vegetation growth processes and have implications for understanding the sustainable development of mountain ecosystems.

1. Introduction

Being an important component of terrestrial ecosystems, vegetation plays a crucial role in maintaining ecosystem stability, functioning, and services [1,2]. The dynamics of vegetation patterns is a complex and prolonged process, driven by multiple biotic, abiotic, and anthropogenic factors such as climate change, land use change, and ecological engineering measures amongst others [3]. Being one of the most fragile terrestrial ecosystems, mountainous ecosystems are rather sensitive to global climatic change and human activities. A large vertical gradient and unique topographical conditions make mountainous regions the most abundant land unit on the earth and a key area for global biodiversity conservation [4,5]. Vegetation cover change of mountainous ecosystems have a much more significant and sensitive feedback on climate and other factors than plain areas. Therefore, the analysis of the process and driving factors of mountain vegetation dynamics has always been a key concern amongst global climatic change and mountain research community [6,7].
The topographic variability in a mountain ecosystem forms a micro-habitat with diverse microclimates influencing the variations in local and regional vegetation patterns thereby supporting high levels of biodiversity [5]. In recent years, international research on mountain vegetation has broadened from earlier studies that focused mostly on temperate zones of Europe (e.g., the Alps and the Scandes) [8] to other mountainous regions in the world including Alaska and the State of California, and the Rocky Mountains in North America [9,10], tropical mountainous regions of Africa (Kenya, Mount Kilimanjaro, Mount Wilhelm in New Guinea, etc.) [11,12], the subtropical Andean regions [13,14], and the southern and eastern Himalayas [15]. Meanwhile, the research field has also expanded from the physiological ecology of alpine plants to issues of elevational zonality and the impact of global climate change on alpine vegetation patterns [16,17]. In particular, studies of alpine vegetation in the eastern Himalayas and across the QTP have made great progress in recent years through the efforts of scholars in China, which not only studied the vegetation pattern in the Three River Headwater Region, Hengduan Mountains, but also included high latitudes, such as the Tianshan Mountains, Changbai Mountains, and Qinling Mountains, and mainly deliberated the response mechanisms for conservation of mountain vegetation in the face of global climate change and human activities, in particular those major ecological projects [18,19,20,21].
Several environmental factors have been widely identified as drivers for vegetation cover changes. Natural (e.g., climatic factors, topography and etc.) and social factors (e.g., socioeconomics, ecological engineering policies and settlements) can have a strong influence on vegetation growth processes, the extent of which varies from one place to another [5,22]. Most studies believe that precipitation and temperature are the main climatic factors affecting regional vegetation change [23], in addition to topography [24]. In mountainous areas with complex topography, topographic features (elevation, slope, aspect, etc.) have noticeable effects on vegetation patterns by themselves but also by controlling other environmental factors, such as solar radiation, wind, precipitation, snow cover, and edaphology distribution, a combination of these environmental factors jointly determines the spatial heterogeneity of vegetation pattern [17,19]. Besides, human activities (such as roads construction, settlements, and hydraulic engineering) also have an impact on mountain vegetation cover [22], which may have a negative impact on vegetation in low elevation regions, while less interference on the vegetation in the middle elevation [7,24]. At present, the analysis of drivers affecting vegetation patterns in the Tibetan Plateau region is mostly concentrated in the analysis of climatic factors, and relatively little research has been conducted on topographic control mechanisms [25,26,27]. In the context of global climate change, topography is the only relatively constant environmental factor, and deeper insights on how it controls the vegetation change pattern is particularly necessary to understand the vegetation dynamics and strengthen the response analysis of vegetation growth and distribution to topographic factors.
Given their inaccessibility in most mountainous regions, both remote sensing (RS) and geographic information system (GIS) technology stand out jointly as powerful tools for monitoring vegetation cover changes in mountainous areas by providing continuous, spatially detailed satellite data on mountainous vegetation cover [28]. With the development of RS technology, the types of remote sensing sensors have become more and more diversified, and the large-scale long time series vegetation dynamics has gradually developed into a hot spot for global change research, among which MODIS vegetation cover product data is regarded as one of the most effective data products for vegetation productivity analysis [29]. NDVI has been proved to be a comprehensive index to describe the ecological functional characteristics of vegetation growth, net primary productivity and phenology at regional, continental, and global scales [22,30]. Thus far, it has been widely used to detect the response of vegetation dynamics to climate change, human activities and other driving factors at multiple spatio-temporal scales [31,32]. However, many drivers are known to exhibit spatial non-stationarity with distinct spatio-temporal characteristics [33], while geographical weighted regression (GWR) model has improved the traditional model by combining spatial correlation with linear regression to better reflect the spatial non-stationarity of the relationship between NDVI and drivers by calculating the local parameters of the regression model [34].
The TPRR, located in the heart of the Hengduan Mountains in the southeastern Tibetan Plateau, has been paid widespread attention for being a world-renowned scenic spot and World Natural Heritage Site. The region is characterized by paralleling alternately high mountains and canyons, and the influence of topographic elevation differences has resulted in significant vertical temperature variation and contributed to the rich biodiversity of the region. Mountain ecosystems are signal “amplifiers” of biological responses to global change [4,35], and exploring the unique geographical environment and vertical zone spectrum of mountain bioclimates favors our understanding of regional biodiversity, ecosystem functions and services, vegetation restoration and reconstruction, as well as other issues. Existing studies from the TPRR mainly focus on geology, dynamic changes of alpine vegetation, land use/cover changes, and biodiversity conservation [36,37,38,39], and tourism resources [40,41,42]. Although a few scholars have studied vegetation changes and its driving factors analysis in the whole basin of the TPRR and various sub-basins (e.g., Lancang river and Jinsha river basins and etc.) [43], both of the vegetation dynamics in the Jinsha River Basin and the Lancang River Basin are jointly affected by temperature and precipitation, and the influence of precipitation is more significant in the Jinsha River Basin, while in the Lancang River Basin is more sensitive to temperature [44,45,46]. Furthermore, anthropological factors such as the establishment of large dams and reservoirs, hydropower stations, and the implementation of ecological projects have great and obvious specific effects on the vegetation pattern of the basin [2]. Only a few previous studies highlight the relationship between vegetation change and meteorological factors in the source areas of the Three Parallel Rivers which confirmed a significant correlation of vegetation cover with air temperature in this area [43,44,45,46]. The TPRR is one of the important ecological barriers and water resources conservation areas in China with unique arid valleys and distinct topography differences. Therefore, it is of vital importance to understand the influence of topographic factors on vegetation cover in this typical geographical unit.
Based on the MODIS NDVI image data from 2000 to 2019, combined with DEM and vegetation type data for trend method and geographically weighted model, our study discusses the spatio-temporal dynamic changes of vegetation and its response to topographic factors (i.e., elevation, slope, aspect, and other factors) in the TPRR. In terms of the spatial heterogeneity, the difference of vegetation restoration effect and its causes, and multiple drivers were analyzed by using the geographically weighted model. The specific research questions addressed in this study include: (1) What are the dynamic characteristics of NDVI at spatial and temporal scale? (2) How do different topographic factors effect on vegetation pattern? (3) What is the overall performance of all topographic factors by generalized analysis in terms of Geographically Weighted Regression modelling?

2. Materials and Methods

2.1. Study Area

The TPRR (24°00’~36°00’ N, 90°20’~102°20’ E) is located in the Hengduan Mountains in southwest China, spanning four provinces/Autonomous Region, Qinghai, Sichuan, Yunnan, and Tibet, bordering Qinghai-Tibet provincial boundary in the north, Sichuan-Yunnan provincial boundary in the east, and China-Myanmar national boundary in the west, with a total watershed area of about 50.07 million km2 (Figure 1). In this paper, the division of the study area was obtained based on the DEM data and watershed data provided by the Resource and Environment Science and Data Center of the Chinese Academy of Sciences (available at https://www.resdc.cn accessed on 12 August 2020). Coupled with the existing reference, a series of spatial data analyses were conducted using DEM data, including fill, flow direction, and flow accumulation, which ultimately determined the watershed extent of the TPRR [47,48,49]. Three major Asian rivers, the Yangtze (Jinsha River), the Mekong River (Lancang River) and the Salween River (Nujiang River), run parallel through the longitudinal valleys from north to south, with a vertical elevation difference of nearly 6000 m [47]. The unique environmental gradients make the region rich in biodiversity and one of the most unique areas of species diversity in China [50]. The climate type in the basin is diverse, including cold, temperate, subtropical, and tropical zones from north to south, with temperature and precipitation decreasing from south to north with increasing elevation. The variable climate types and geographical environment make the vegetation distribution in the basin have obvious latitudinal and vertical zonality characteristics (Figure 1).

2.2. Data Sources and Preprocessing

2.2.1. Remote Sensing Data

NDVI data were provided by the National Aeronautics and Space Administration (NASA) MODIS Terra (MOD13Q1) 16-day vegetation index product (2000–2019) at a spatial resolution of 250 m (available at https://ladsweb.Modaps.eosdis.nasa.gov/search/order/, accessed on 12 August 2020). MODIS Reprojection Tool (MRT) was used to pre-process the original data (e.g., format and projection conversion, clipping, etc.). Besides, the maximum NDVI value was calculated using the maximum value composition method (MVC), and we obtained the optimal vegetation cover for the study area and further reduced the influence of cloud cover and atmospheric scattering. Finally, regions with NDVI value greater than 0.05 were identified as vegetated areas to avoid the interference of underlying surface information on NDVI in areas with low vegetation cover.

2.2.2. DEM Data

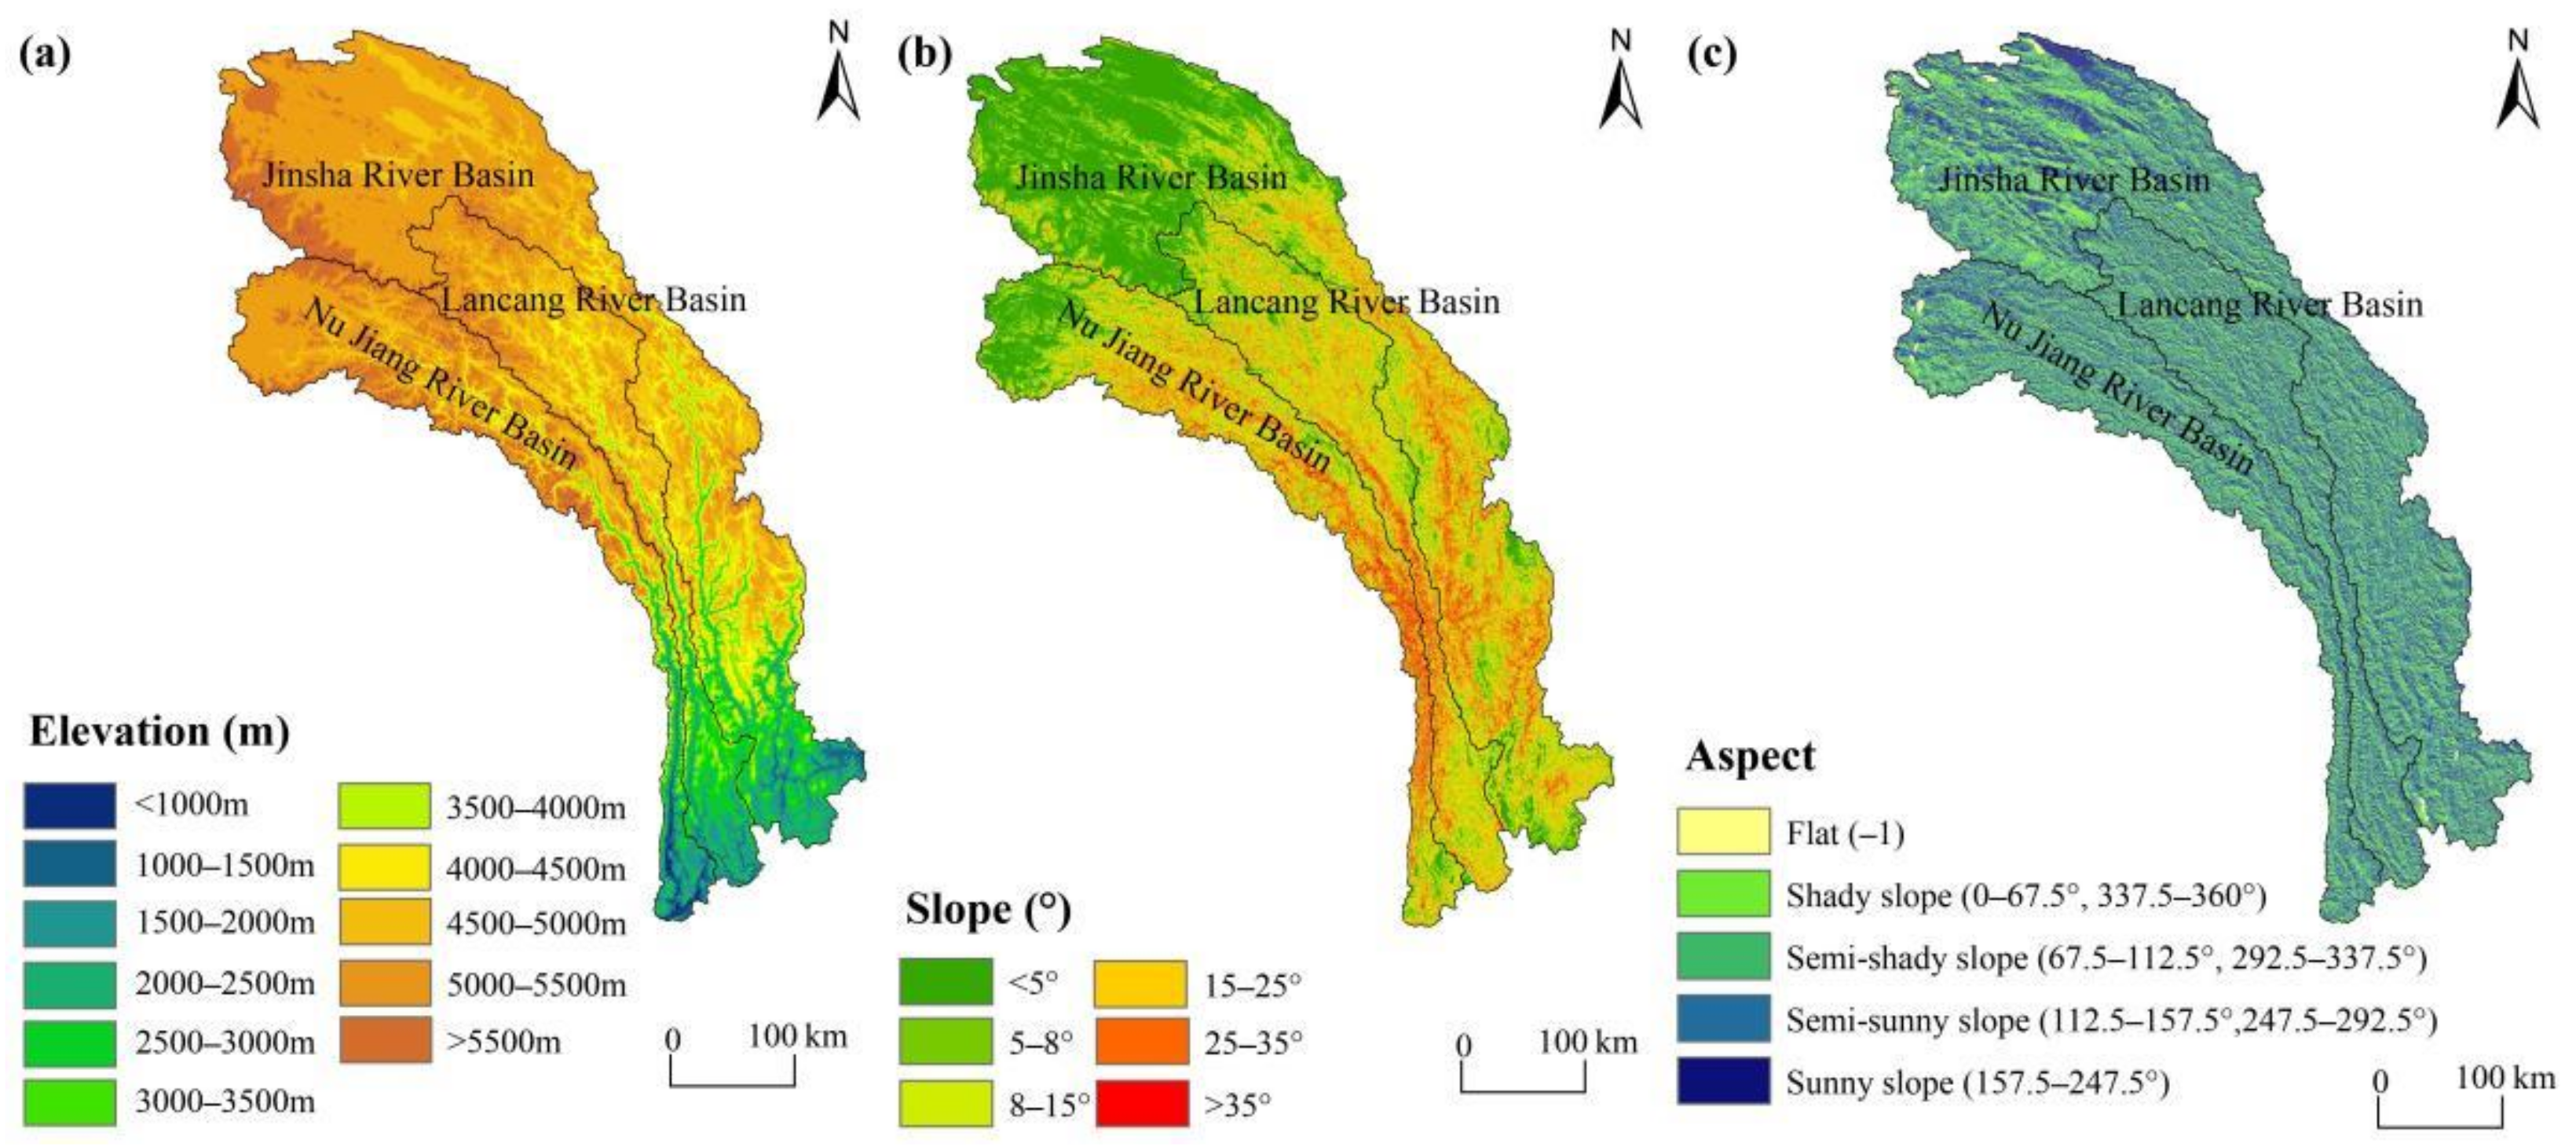
DEM data at a spatial resolution of 90 m × 90 m in the TPRR were collected from the SRTM dataset (https://srtm.csi.cgiar.org/srtmdata/, accessed on 12 August 2020). The primary topographic features based on DEM data, such as elevation, slope, and aspect layers were computed using the “Slope/Aspect Tool” in the ArcGIS 10.8 Spatial Analyst module. According to the Chinese classification standards for potential hazard of soil erosion and some other relevant references [51,52,53], they were further divided into several categories (Table S1), and three maps of elevation, slope and aspect were generated (Figure 2). In addition, spatial analysis tools were also used to overlay both the topographic factors layers and NDVI data, to obtain the spatio-temporal distribution of NDVI for each topographic factor over the past 20 years.

2.2.3. Vegetation Type Data

ESA CCI-LC land cover types were provided by the European space agency (http://maps.elie.ucl.ac.be/CCI/viewer/, accessed on 12 August 2020) with a 300 m spatial resolution. With more than 70% overall accuracy, the global ESA CCI-LC data has been widely used in land use/land cover dynamic studies, around the world monitoring [54,55,56]. The vegetation types of the region comprise of cropland, grassland, shrub grass, evergreen broad-leaved forest, deciduous broad-leaved forest, evergreen coniferous forest, and others (mainly water, bare land, snow, and ice, etc.), a total of seven categories [57,58]. Referring to relevant literature [59], the areas with unchanged vegetation types from 2000 to 2015 were extracted here to represent the vegetation cover status of the study area in recent years, so to minimize the influence of land use change on vegetation type distribution.
In this paper, we resampled all the remote sensing data with 300 m resolution to facilitate correlation analysis based on pixel scale.

2.3. Methods

2.3.1. Trend Analysis and Significance Test

Firstly, we obtained the spatial distribution of the regional annual mean NDVI using MVC method for trend analysis and significance test. Then, we classified NDVI into six classes according to previous literature and actual vegetation conditions in the region [51], i.e., non-vegetation cover (NDVI < 0.05), low vegetation cover (0.05–0.30), medium and low vegetation cover (0.30–0.45), medium and high vegetation cover (0.45–0.60), medium and high vegetation cover (0.60–0.75), and high vegetation cover (NDVI > 0.75).
Theil-Sen + Mann-Kendall method has been widely used in meteorology and hydrology to get the variation characteristics of NDVI analysis [30,60], which has advantages to avoid outlier data disturbance or measurement error. The formula is:
S N D V I = m e d i a n x j x i j i                 ( j > i > 1 )
where, xi and xj denote the i-th and j-th year time series data. SNDVI >0 indicates that the vegetation shows an upward trend and vice versa indicates a downward trend. Meanwhile, Mann-Kendall method can test whether the trend is significant and find the abrupt point of NDVI changes, which formula is as follows:
Z = S 1 V a r S             ( S > 0 ) 0                                 S = 0 S + 1 V a r S           ( S < 0 )  
Among them,
S = i = 1 n = 1 j = i + 1 n s i g n x j x i ,       s i g n = 1                         ( θ > 0 ) 0                         θ = 0 1               ( θ < 0 )
where, Z is a standard normal distribution, and S is the test statistic. xi and xj are time series data; n is the sample number; When n ≥ 8, S is approximately normal distribution, and the variance calculation formula is:
V a r S   = n n 1 2 n + 5 18
Z is a standard normal distribution, when |Z| > Z1-α/2, it showed significant change trend. Where, Z1-α/2 is the corresponding value of the distribution table of the standard normal distribution function at the confidence level α. The trends could be estimated by combining Sen’s slope and the Mann–Kendall test in light of the NDVI series. Given confidence level α = 0.01 and α = 0.05, whether the trend changed significantly depended on |Z|, which can be divided into six classes: at 0.01 confidence level, (1) very significant degradation (SNDVI < 0, |Z| > 2.58); (2) very significant improvement (SNDVI ≥ 0, |Z| > 2.58); at 0.05 confidence level, (3) significant degradation (SNDVI < 0, 1.96 < |Z| < 2.58); (4) significant improvement (SNDVI ≥ 0, 1.96 < |Z| < 2.58); (5) non-significant degradation (SNDVI < 0, |Z| ≤ 1.96); (6) non-significant improvement (SNDVI ≥ 0, |Z| ≤ 1.96).

2.3.2. Geographically Weighted Regression Model

GWR model can analyze the spatial nonstationary characteristics of the data and explore the spatial heterogeneity between vegetation changes and its driving factors [6,61,62]. The kernel and bandwidth of the GWR model, which are key parameters affecting the accuracy of the model, are now generally determined by Gaussian kernel function, and the optimal bandwidth is generally determined based on the estimated distance of the spatial autocorrelation of the dependent variable [63]. In addition, variance Inflation Factor (VIF) was generally used to eliminate highly correlated variables from the model.
Ordinary Least Squares regression (OLS) model is used to check for the presence of multicollinearity between variables to improve the accuracy of GWR model [34,64]. Compared with OLS model, GWR model is an extension of the traditional global logistic regression model, which includes spatial factors and geographic location information. The weighted least square method is used to estimate the parameters of each sample point, so that each of them has a corresponding estimation coefficient. In GWR4.0 software, the GWR model was constructed with the same variables as the OLS model [65,66], and the optimal bandwidth of 102 was determined according to the minimum AIC value. Besides, we divided the region into a 10 km × 10 km grid and extracted NDVI trend slope (SNDVI), elevation, slope, and aspect values for each grid-cell [66,67]. Assuming that the dependent variable (Slope of NDVI variation trend from 2000 to 2019 is represented by SNDVI) is y, and the elevation, slope and aspect value are x1, x2, and x3 respectively, the GWR model can be expressed as:
y = b 0 u i , v i   + i = 1 k b i u i , v i x i j + ε i
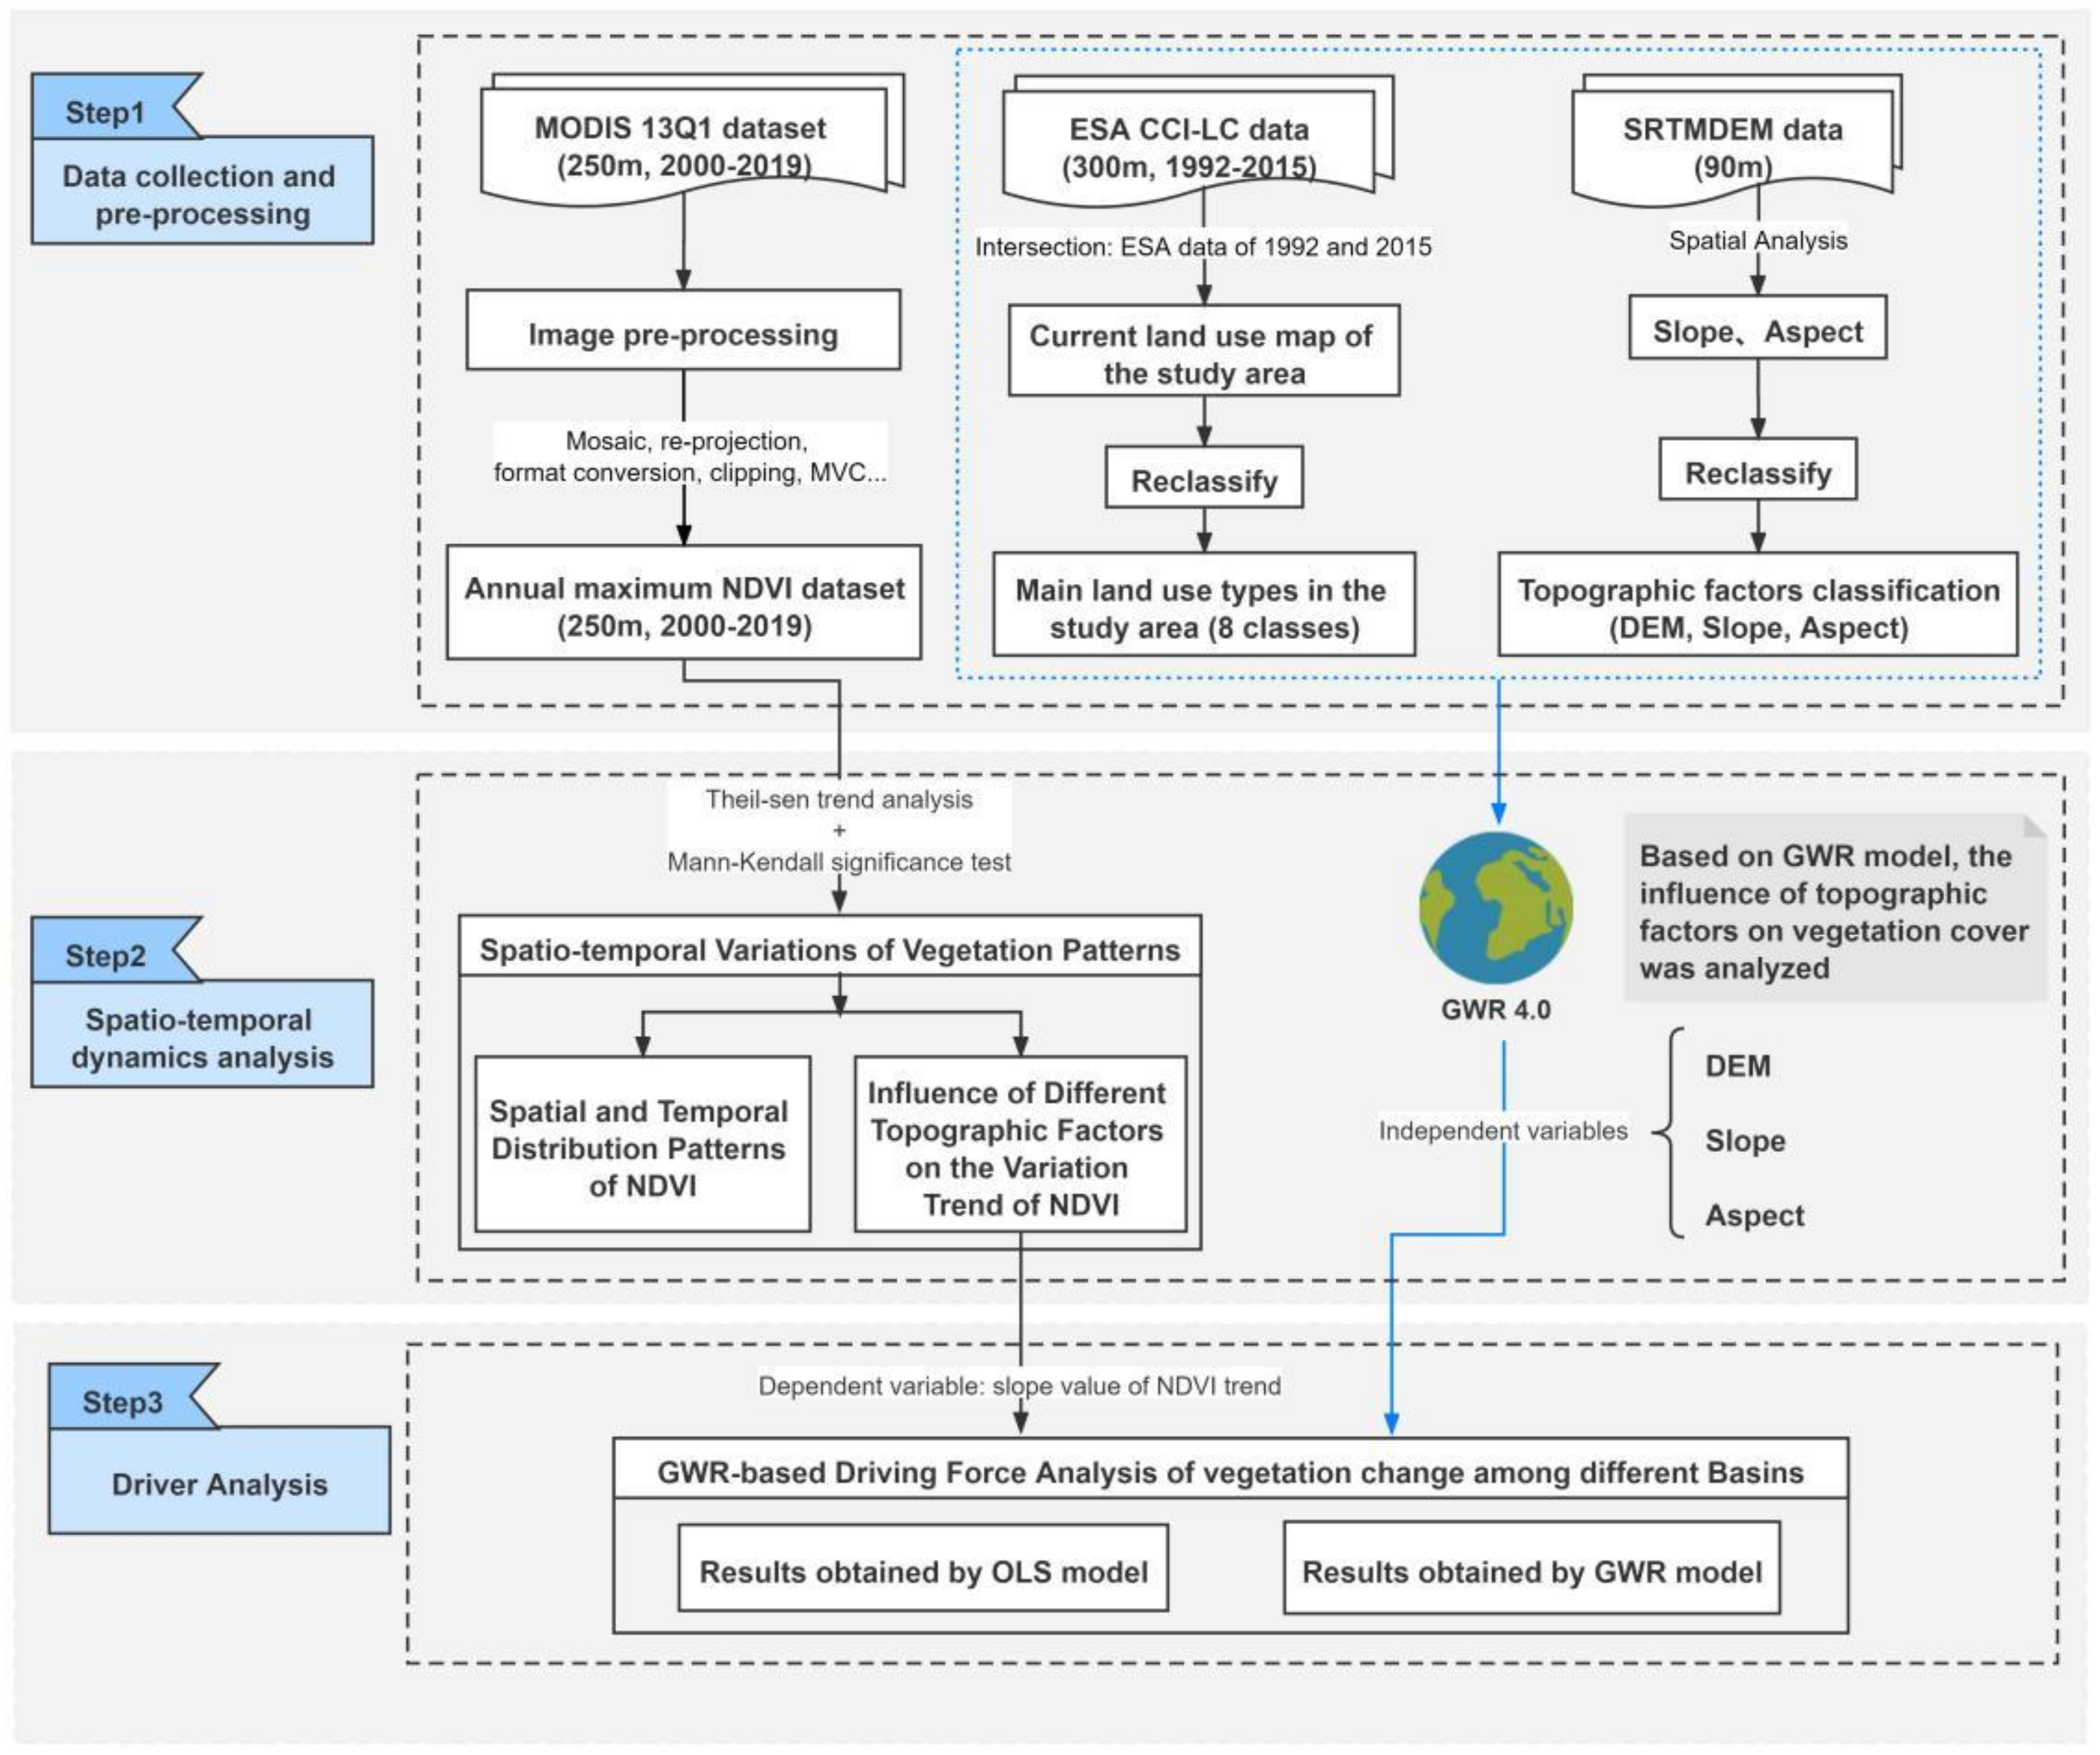
where (ui, vi) is the geographic coordinate center of a certain region, b0 is a constant, b1 is the regression coefficient of independent variable, and xij is the independent variable. Figure 3 summarizes the analysis procedures.

3. Results

3.1. Spatial and Temporal Distribution Patterns of NDVI

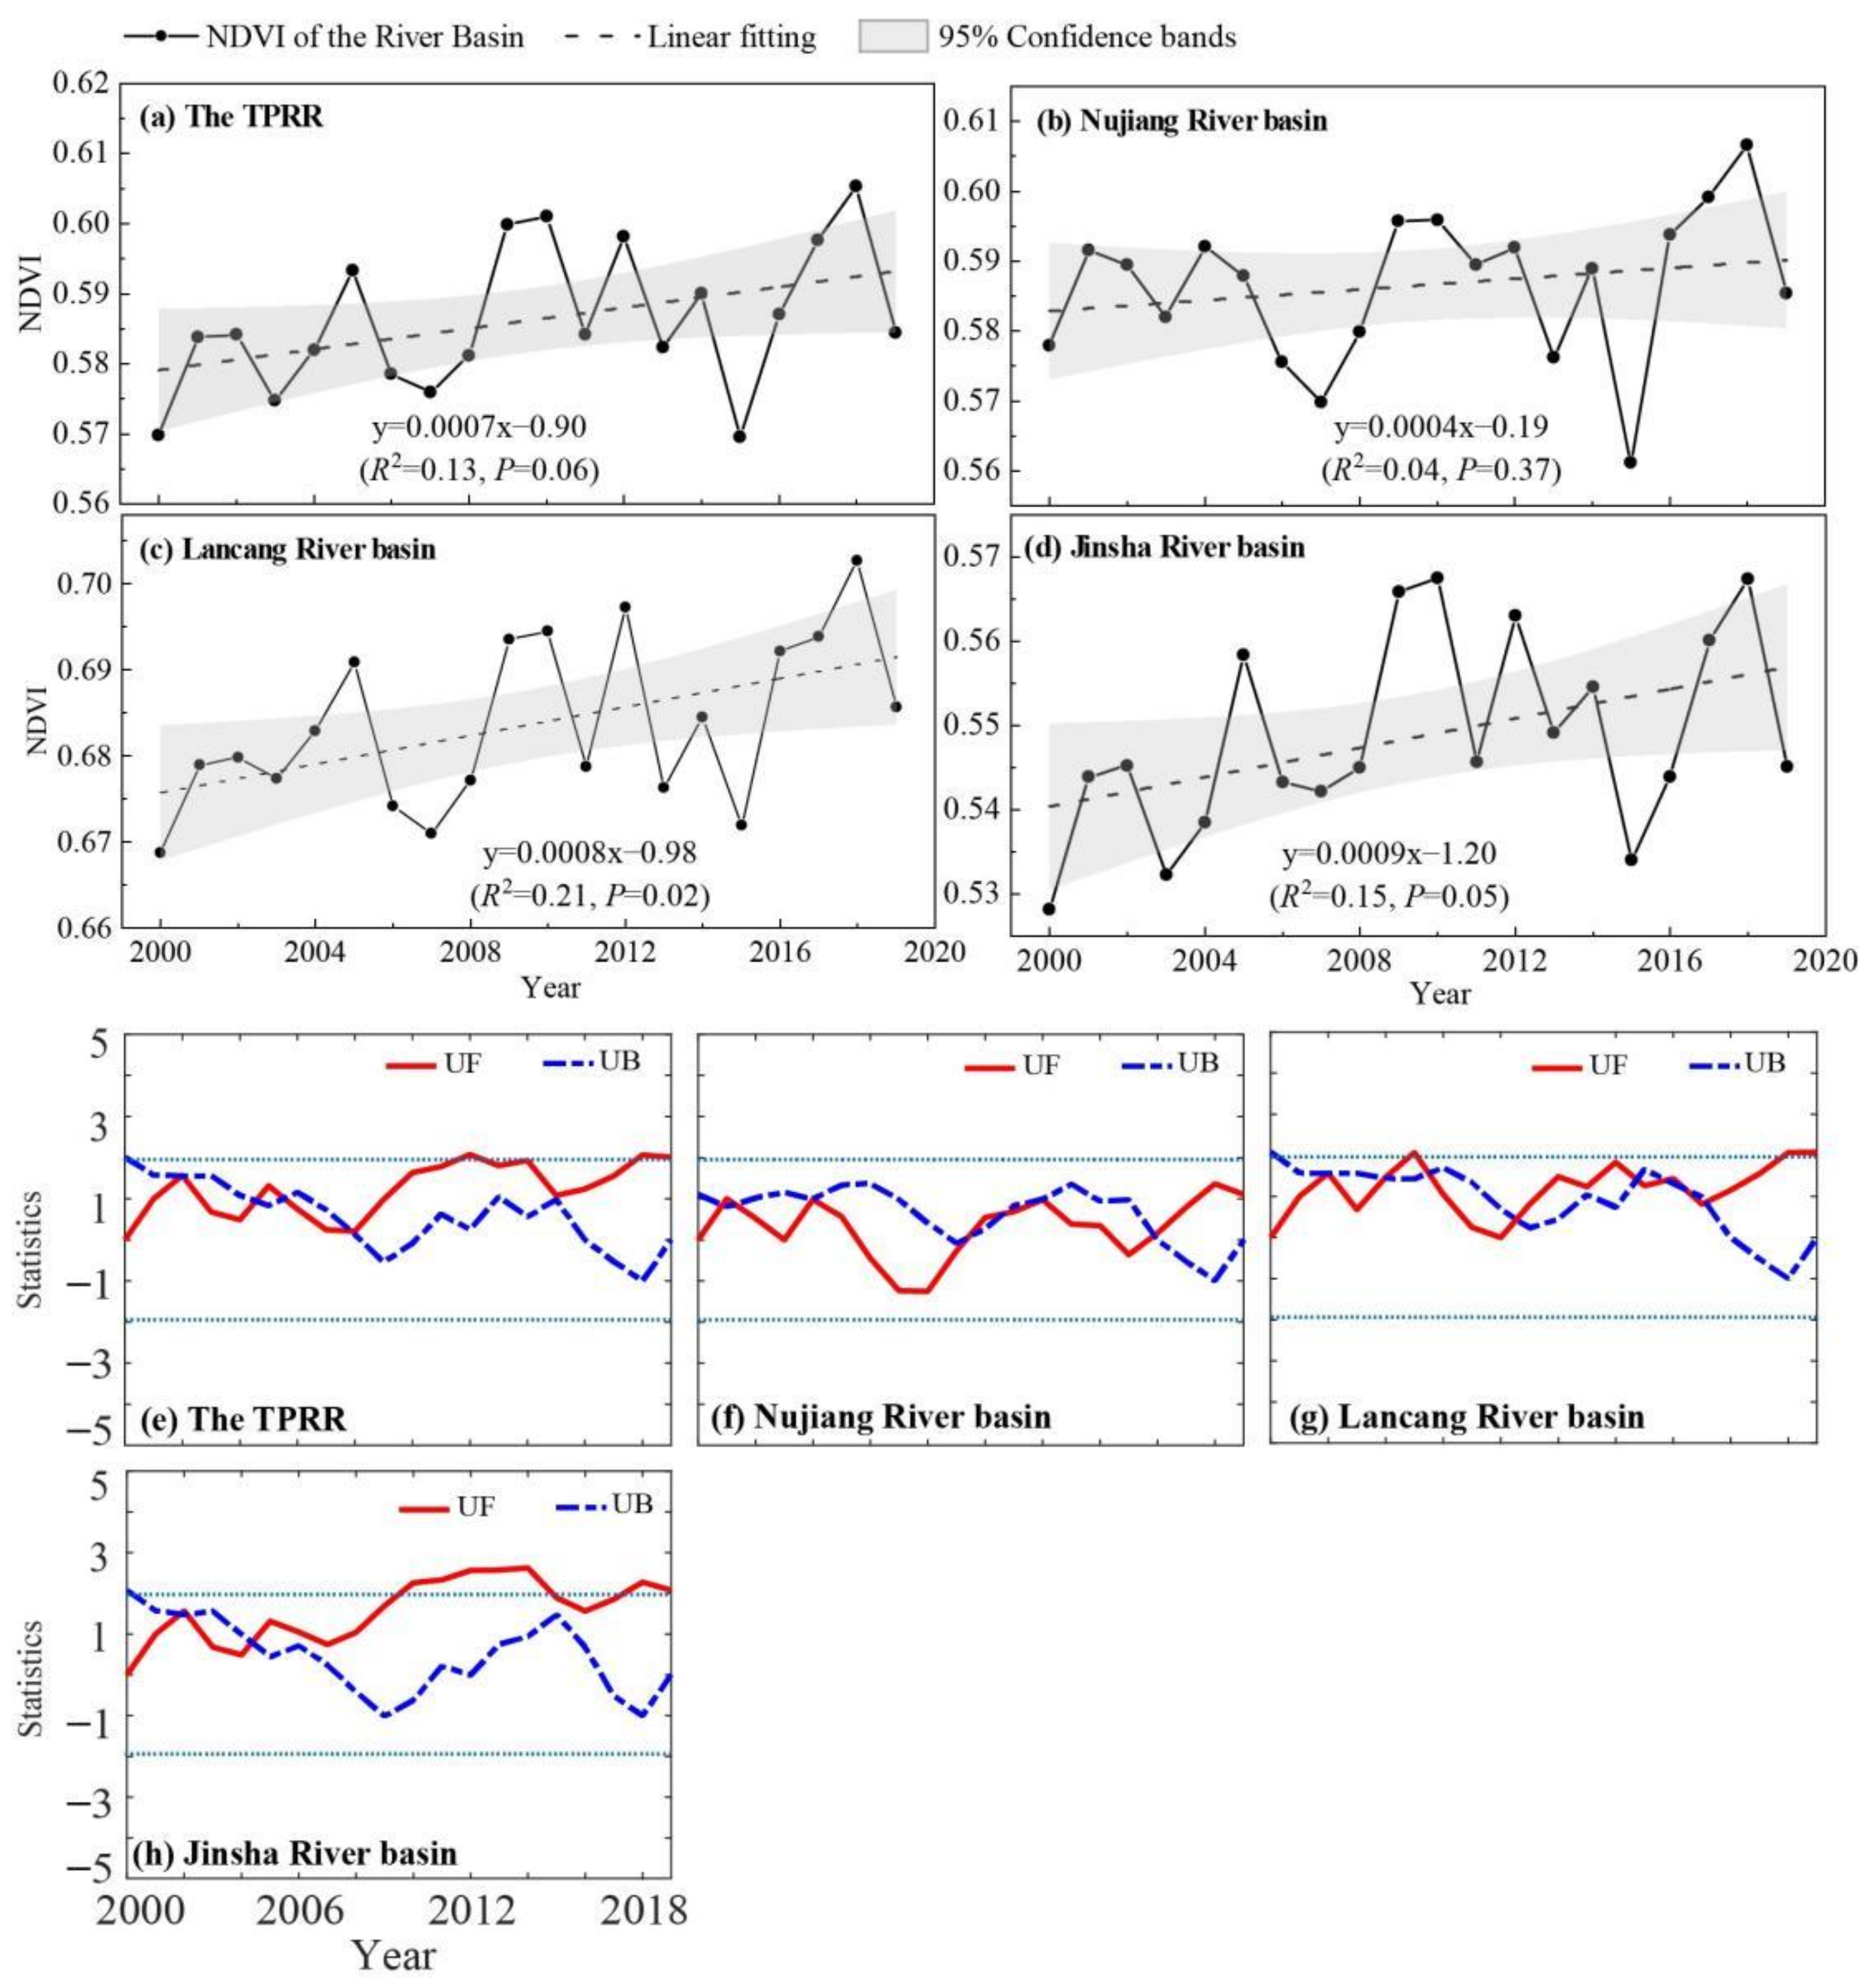
Inter-annual variation analysis results revealed that regional NDVI value fluctuated between 0.56 and 0.61 in the past 20 years, with an overall growth rate of 0.007/10a (p > 0.05), and only the Lancang River basin showed a significant upward trend (p < 0.05) (Figure 4). Additionally, the results of Mann-Kendall test showed an abrupt change of NDVI in the whole basin occurred around the year 2002, 2004, and 2008, respectively. Combined with the abrupt changes of NDVI in each sub-basin, these changes occurred almost simultaneously around 2004.
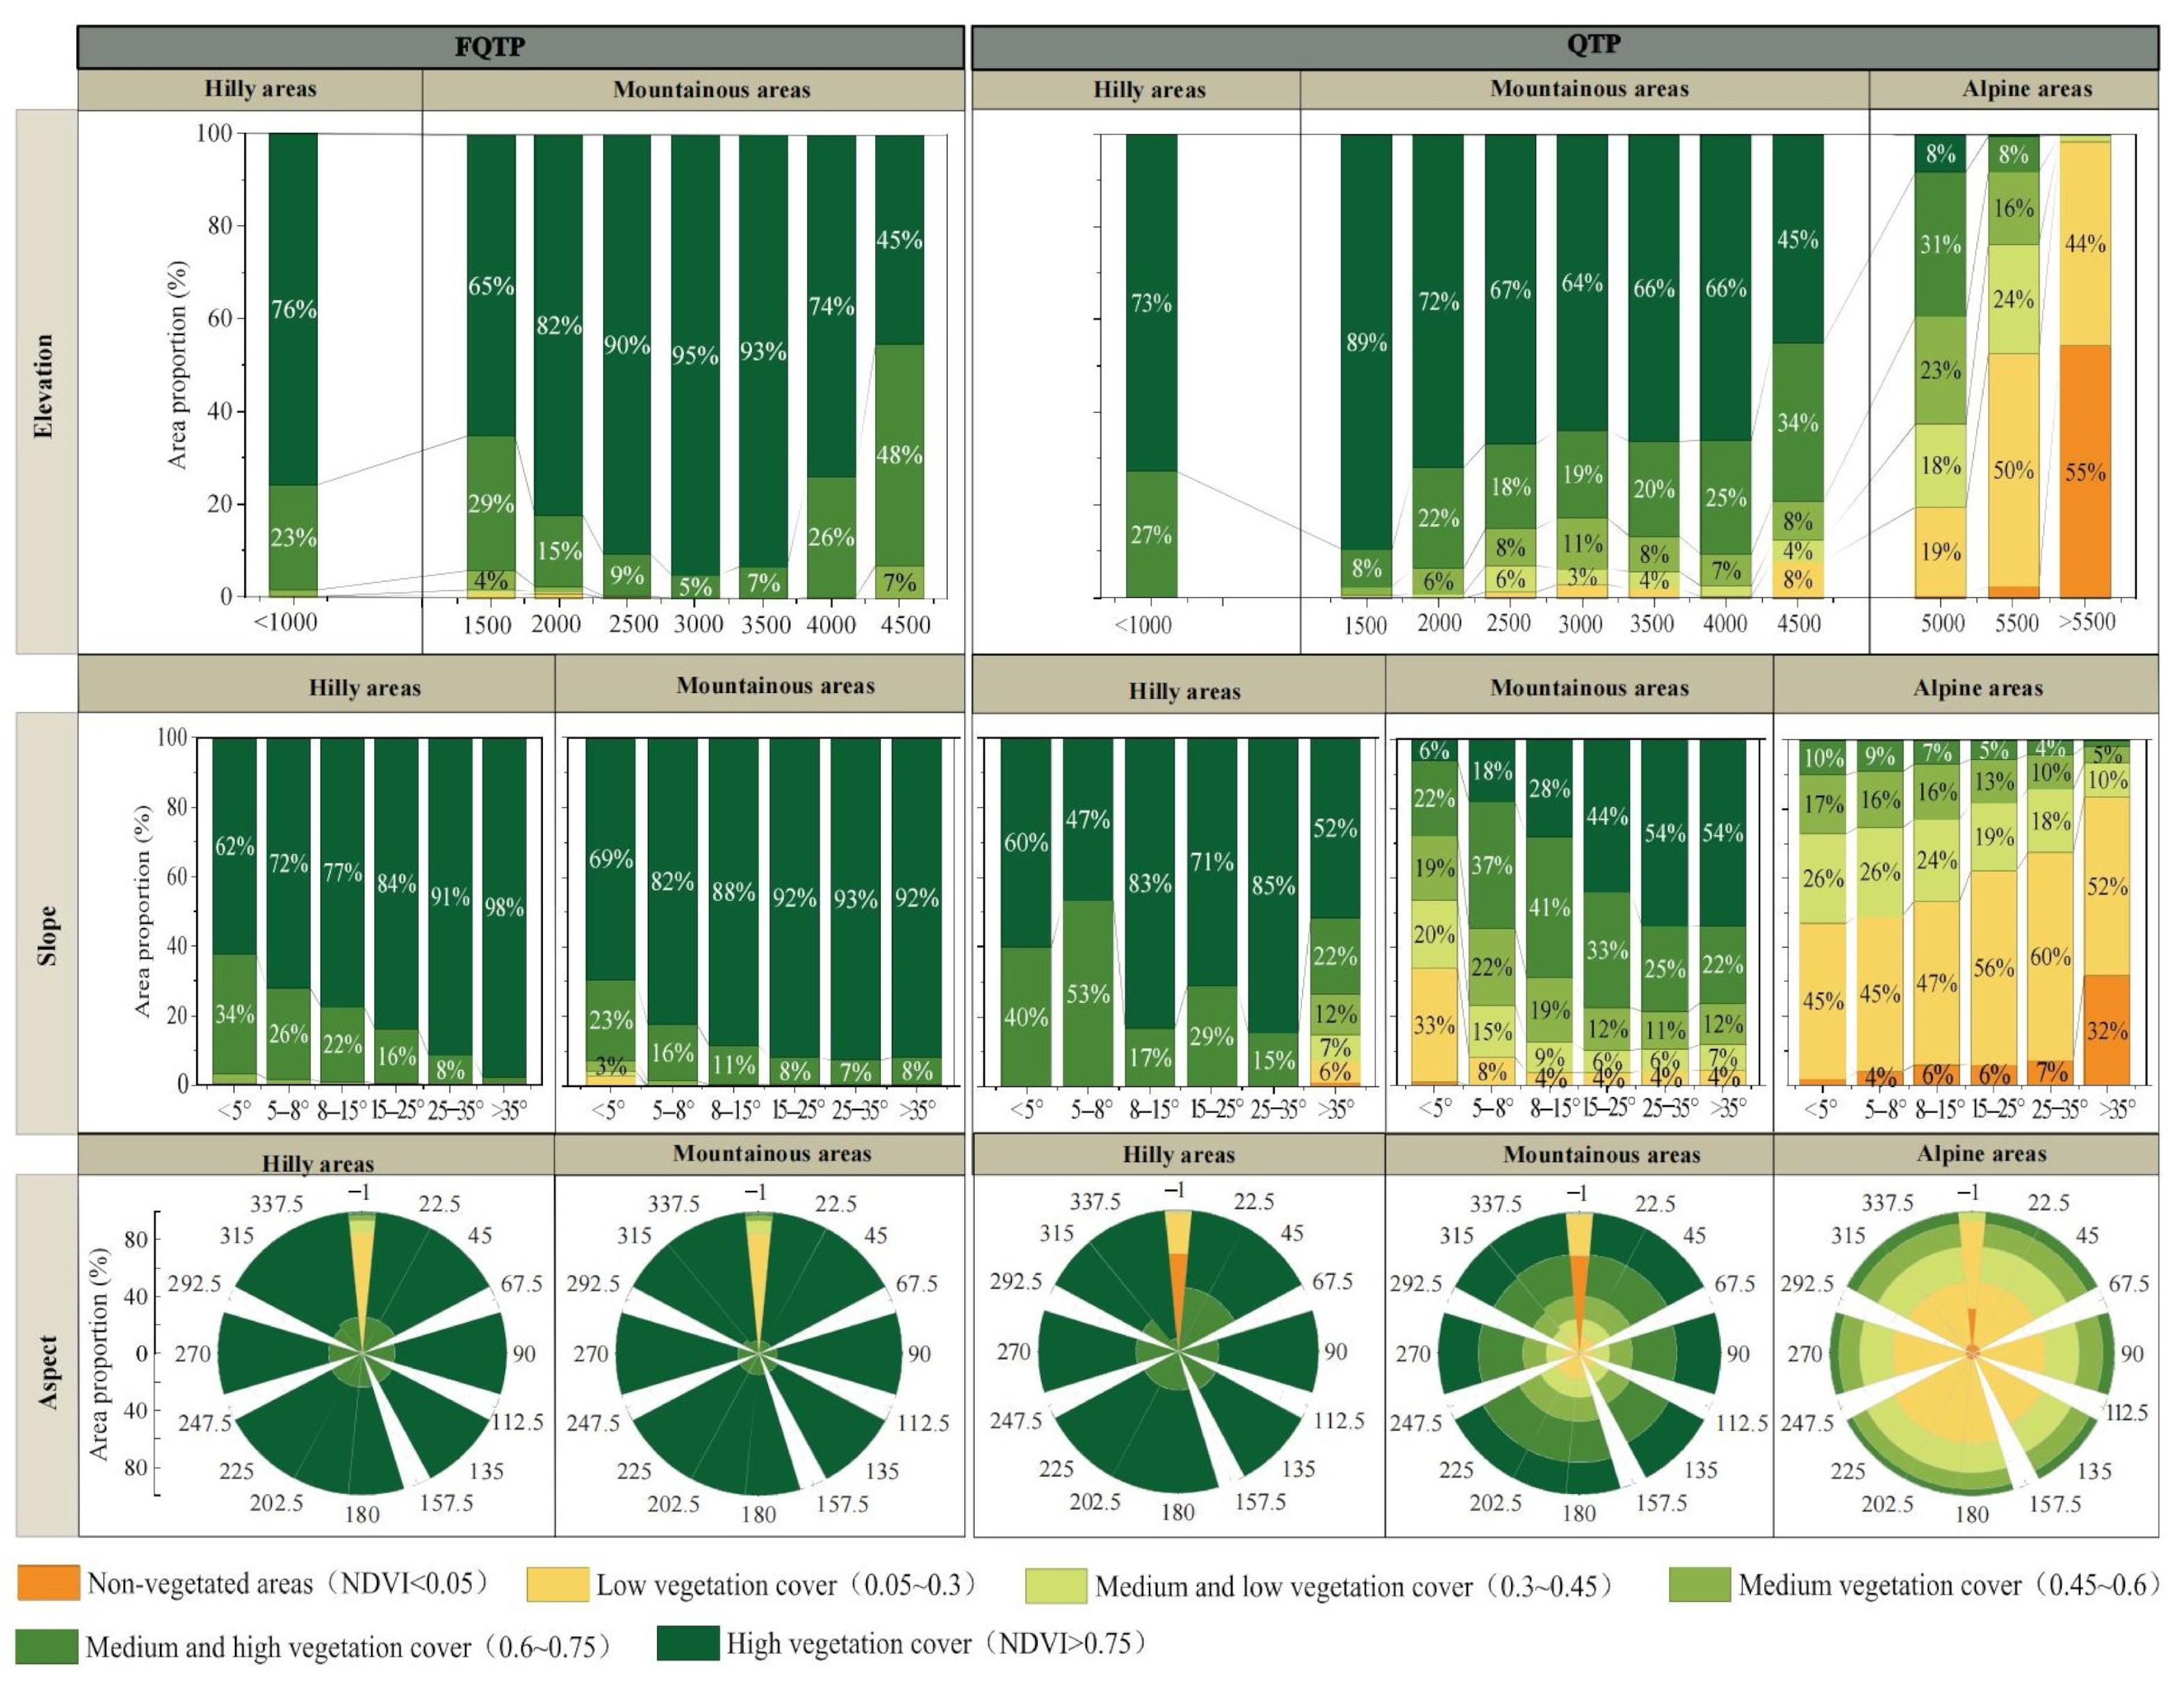
The mean NDVI in the basin tended to increase and then decrease with increasing elevation, and its value reached the maximum at 3000 m (about 0.80) and the minimum at 5500 m (about 0.05) (Figure S1a). Vegetation in the area below 2500 m was dominated by high vegetation cover, mainly in the southern part of the region, and the vegetation types were mainly cropland and evergreen coniferous forest (Table S2). Besides, the spatial distribution of mean NDVI in different elevation zones showed that regional vegetation was affected by elevation showing significant north-south differences (Figure S2a). The proportion of area occupied by each class indicated that the vegetation cover of all elevation zones is dominated by high vegetation cover, especially in the southern regions of the TPRR and in its core area (Figure 5). However, as the elevation continued to rise, NDVI started to decline from 4500 m, and the vegetation cover gradually transitions from low vegetation cover to unvegetated snow-capped mountain tops.
With the increase of slope, NDVI showed an increasing trend with gradually slower growth rate (Figure S1b). The mean NDVI with slope <5° was the lowest (0.40) and the value was between 0.05 and 0.3, which was mainly low vegetation cover type dominated by grassland and distributed in the river source area of the basin (Figure 5, Figure S2b, Table S2). The NDVI for regions within the slope range of 5–8° ranges from 0.6–0.75, which was mainly middle and high vegetation types. NDVI increased with the increasing of slope grades and each slope is gradually dominated by high vegetation cover types, whose distribution gradually shifted to the dry-hot valley and eventually reached its maximum value (about 0.80) at slope >35°.
Furthermore, Figure S1c showed the NDVI changes with aspect from shady slope to sunny slope that the mean NDVI values were uniformly distributed in all aspects (approximately 0.60), and the smallest (about 0.01) existed on flat land. The proportion of high vegetation cover in each aspect was the largest (Figure 5), which distribution pattern was relatively consistent (Figure S2c). The brief descriptions were the proportion of high vegetation cover in semi-shady slope was the largest (35.25%), followed by semi-sunny slope, while the proportion of sunny slope was the smallest (27.83%) (Table S2).

3.2. Influence of Different Topographic Factors on the Variation Trend of NDVI

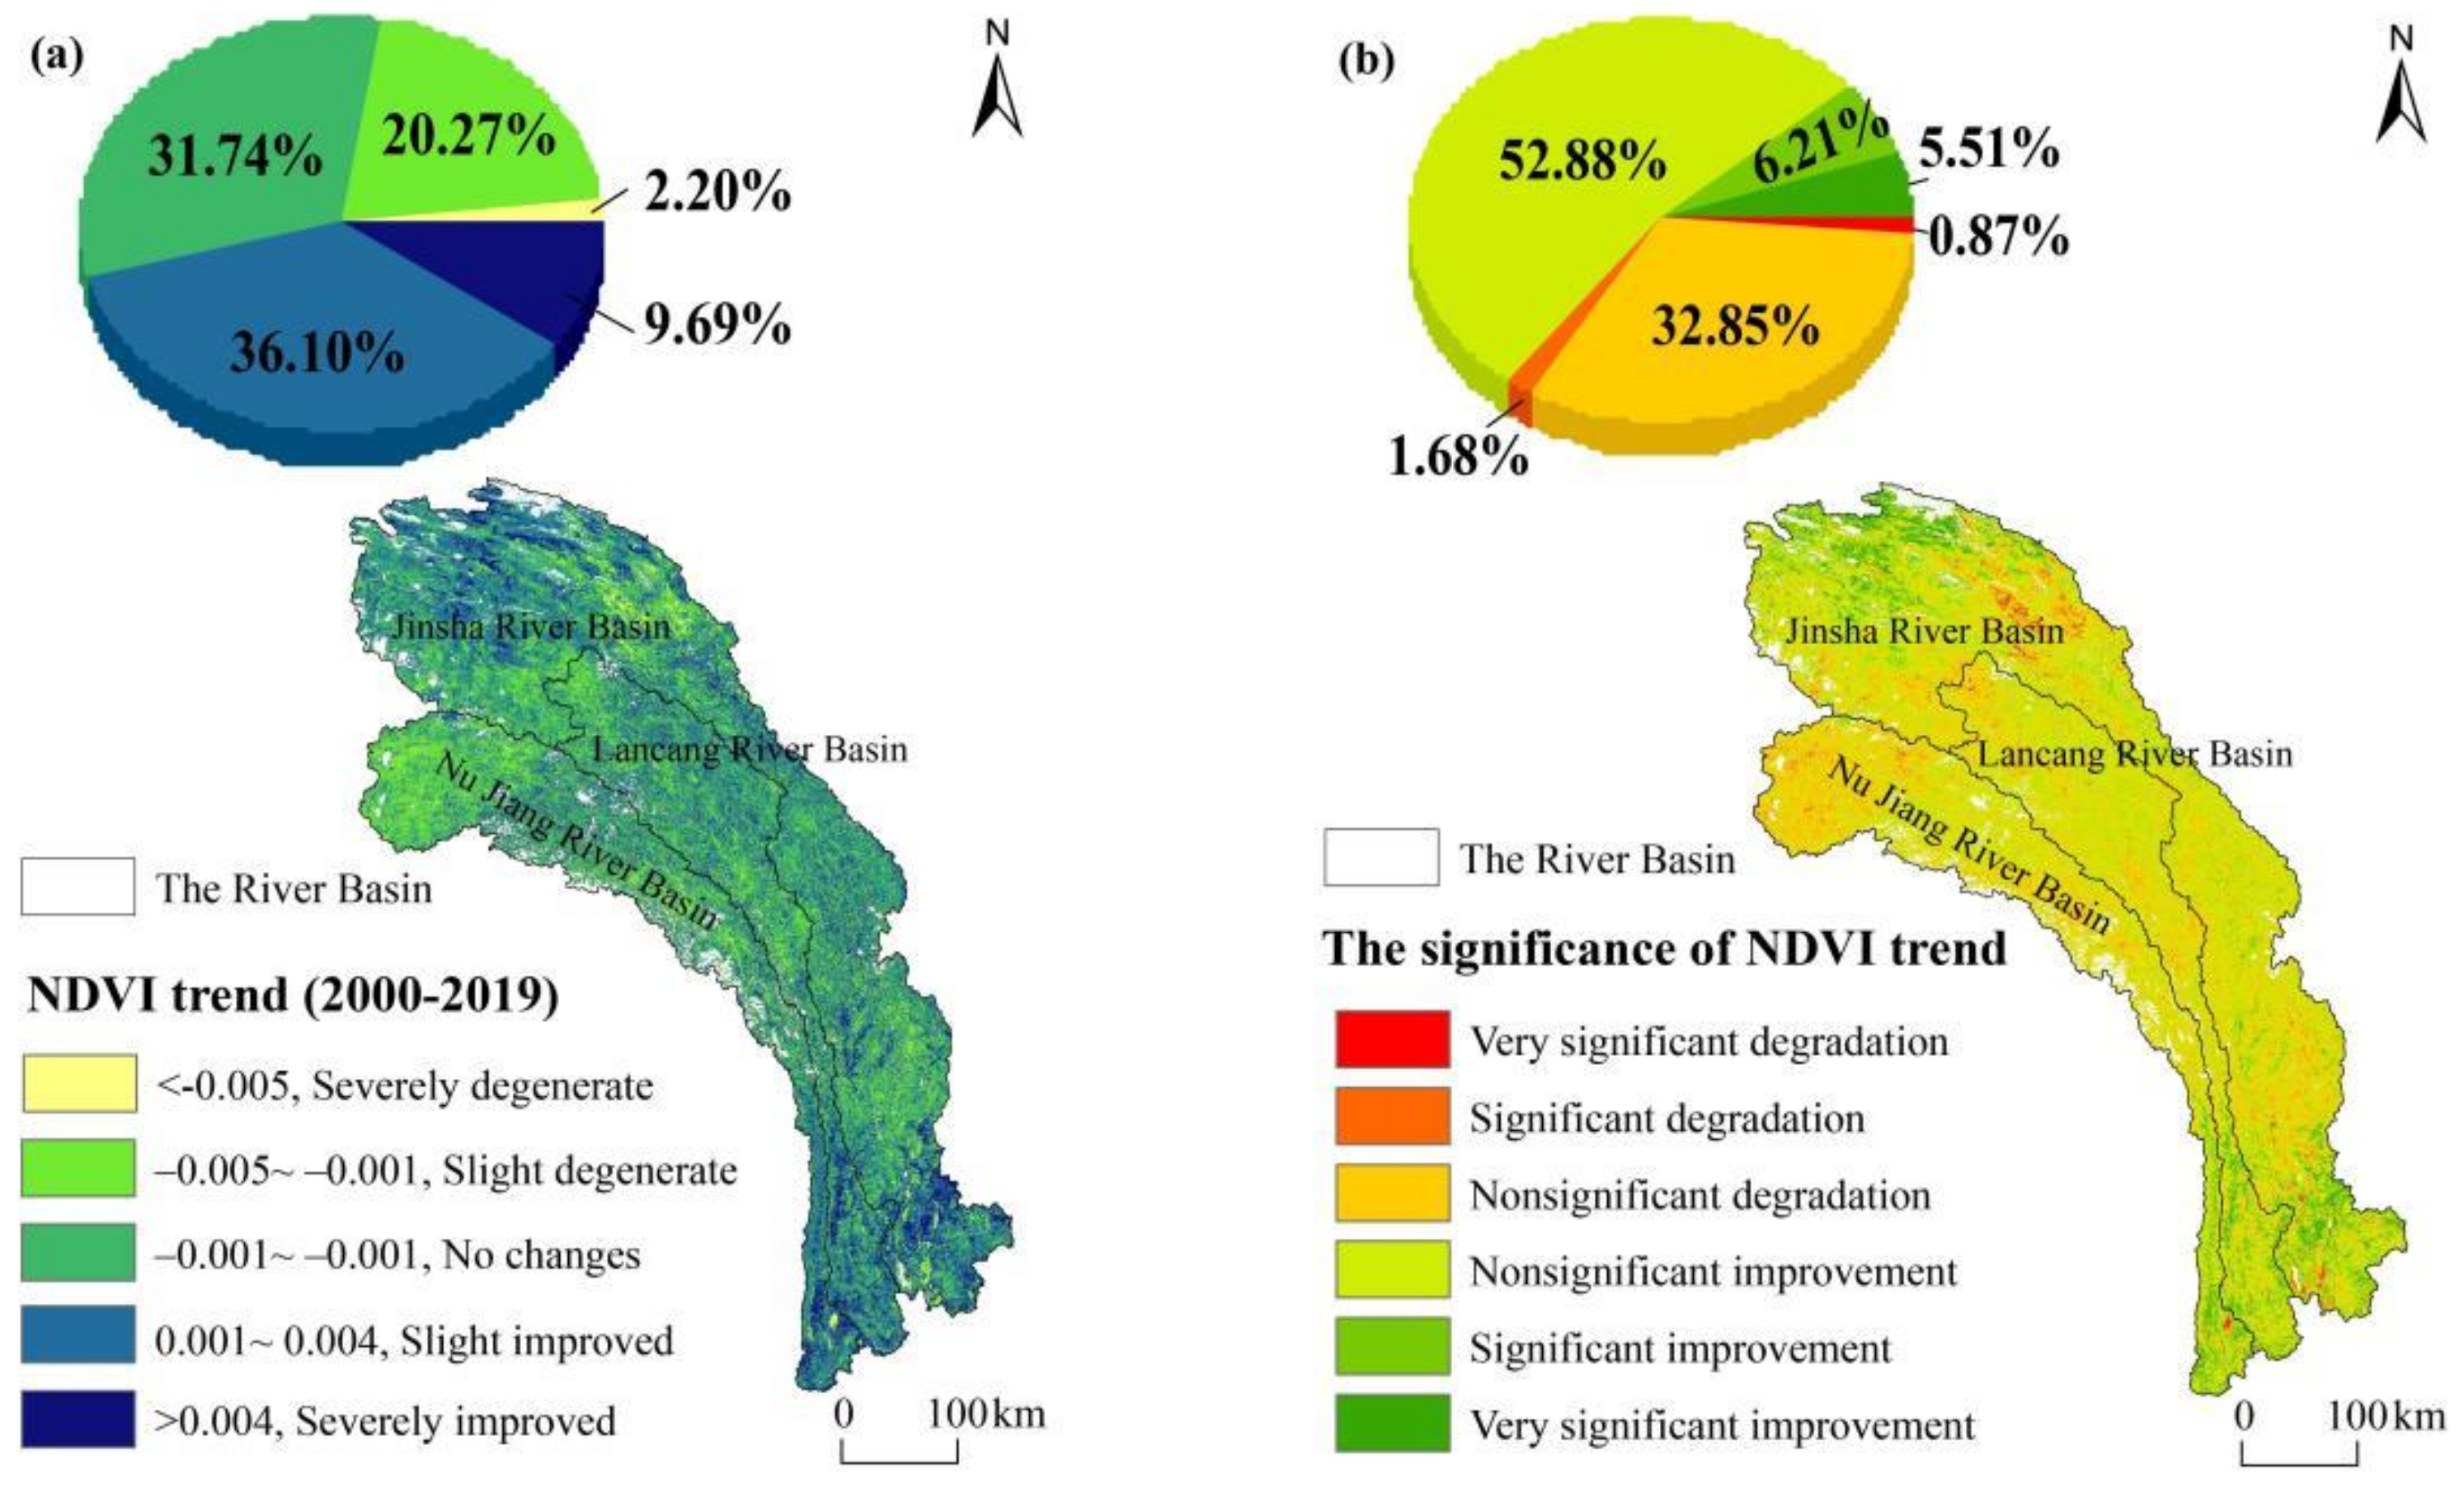
There was a significant spatial variation in NDVI of the TPRR from 2000 to 2019, showing that the vegetation cover in the basin had slightly improved (Figure 6). However, 31.74% of the region showed no changes and 20.28% areas indicated slight degradation. Overall, the areas with improvement were mainly concentrated in the source area of Jinsha river basin in the north and the southern part of the TPRR. Meanwhile, degradation trends were primarily observed in north of the Jinsha river basin and the valley of the TPRR as well as other areas with significant response to vegetation growth changes.
Most of NDVI in the TPRR showed increasing trends under different topographic factors (Figure S3). Among them, NDVI value at all elevation zones showed increasing trends except for regions above 5500 m (Figure S3a), and we also observed that both slope and aspect did not play any significant role in determining NDVI trend distributional patterns (Figure S3b,c).
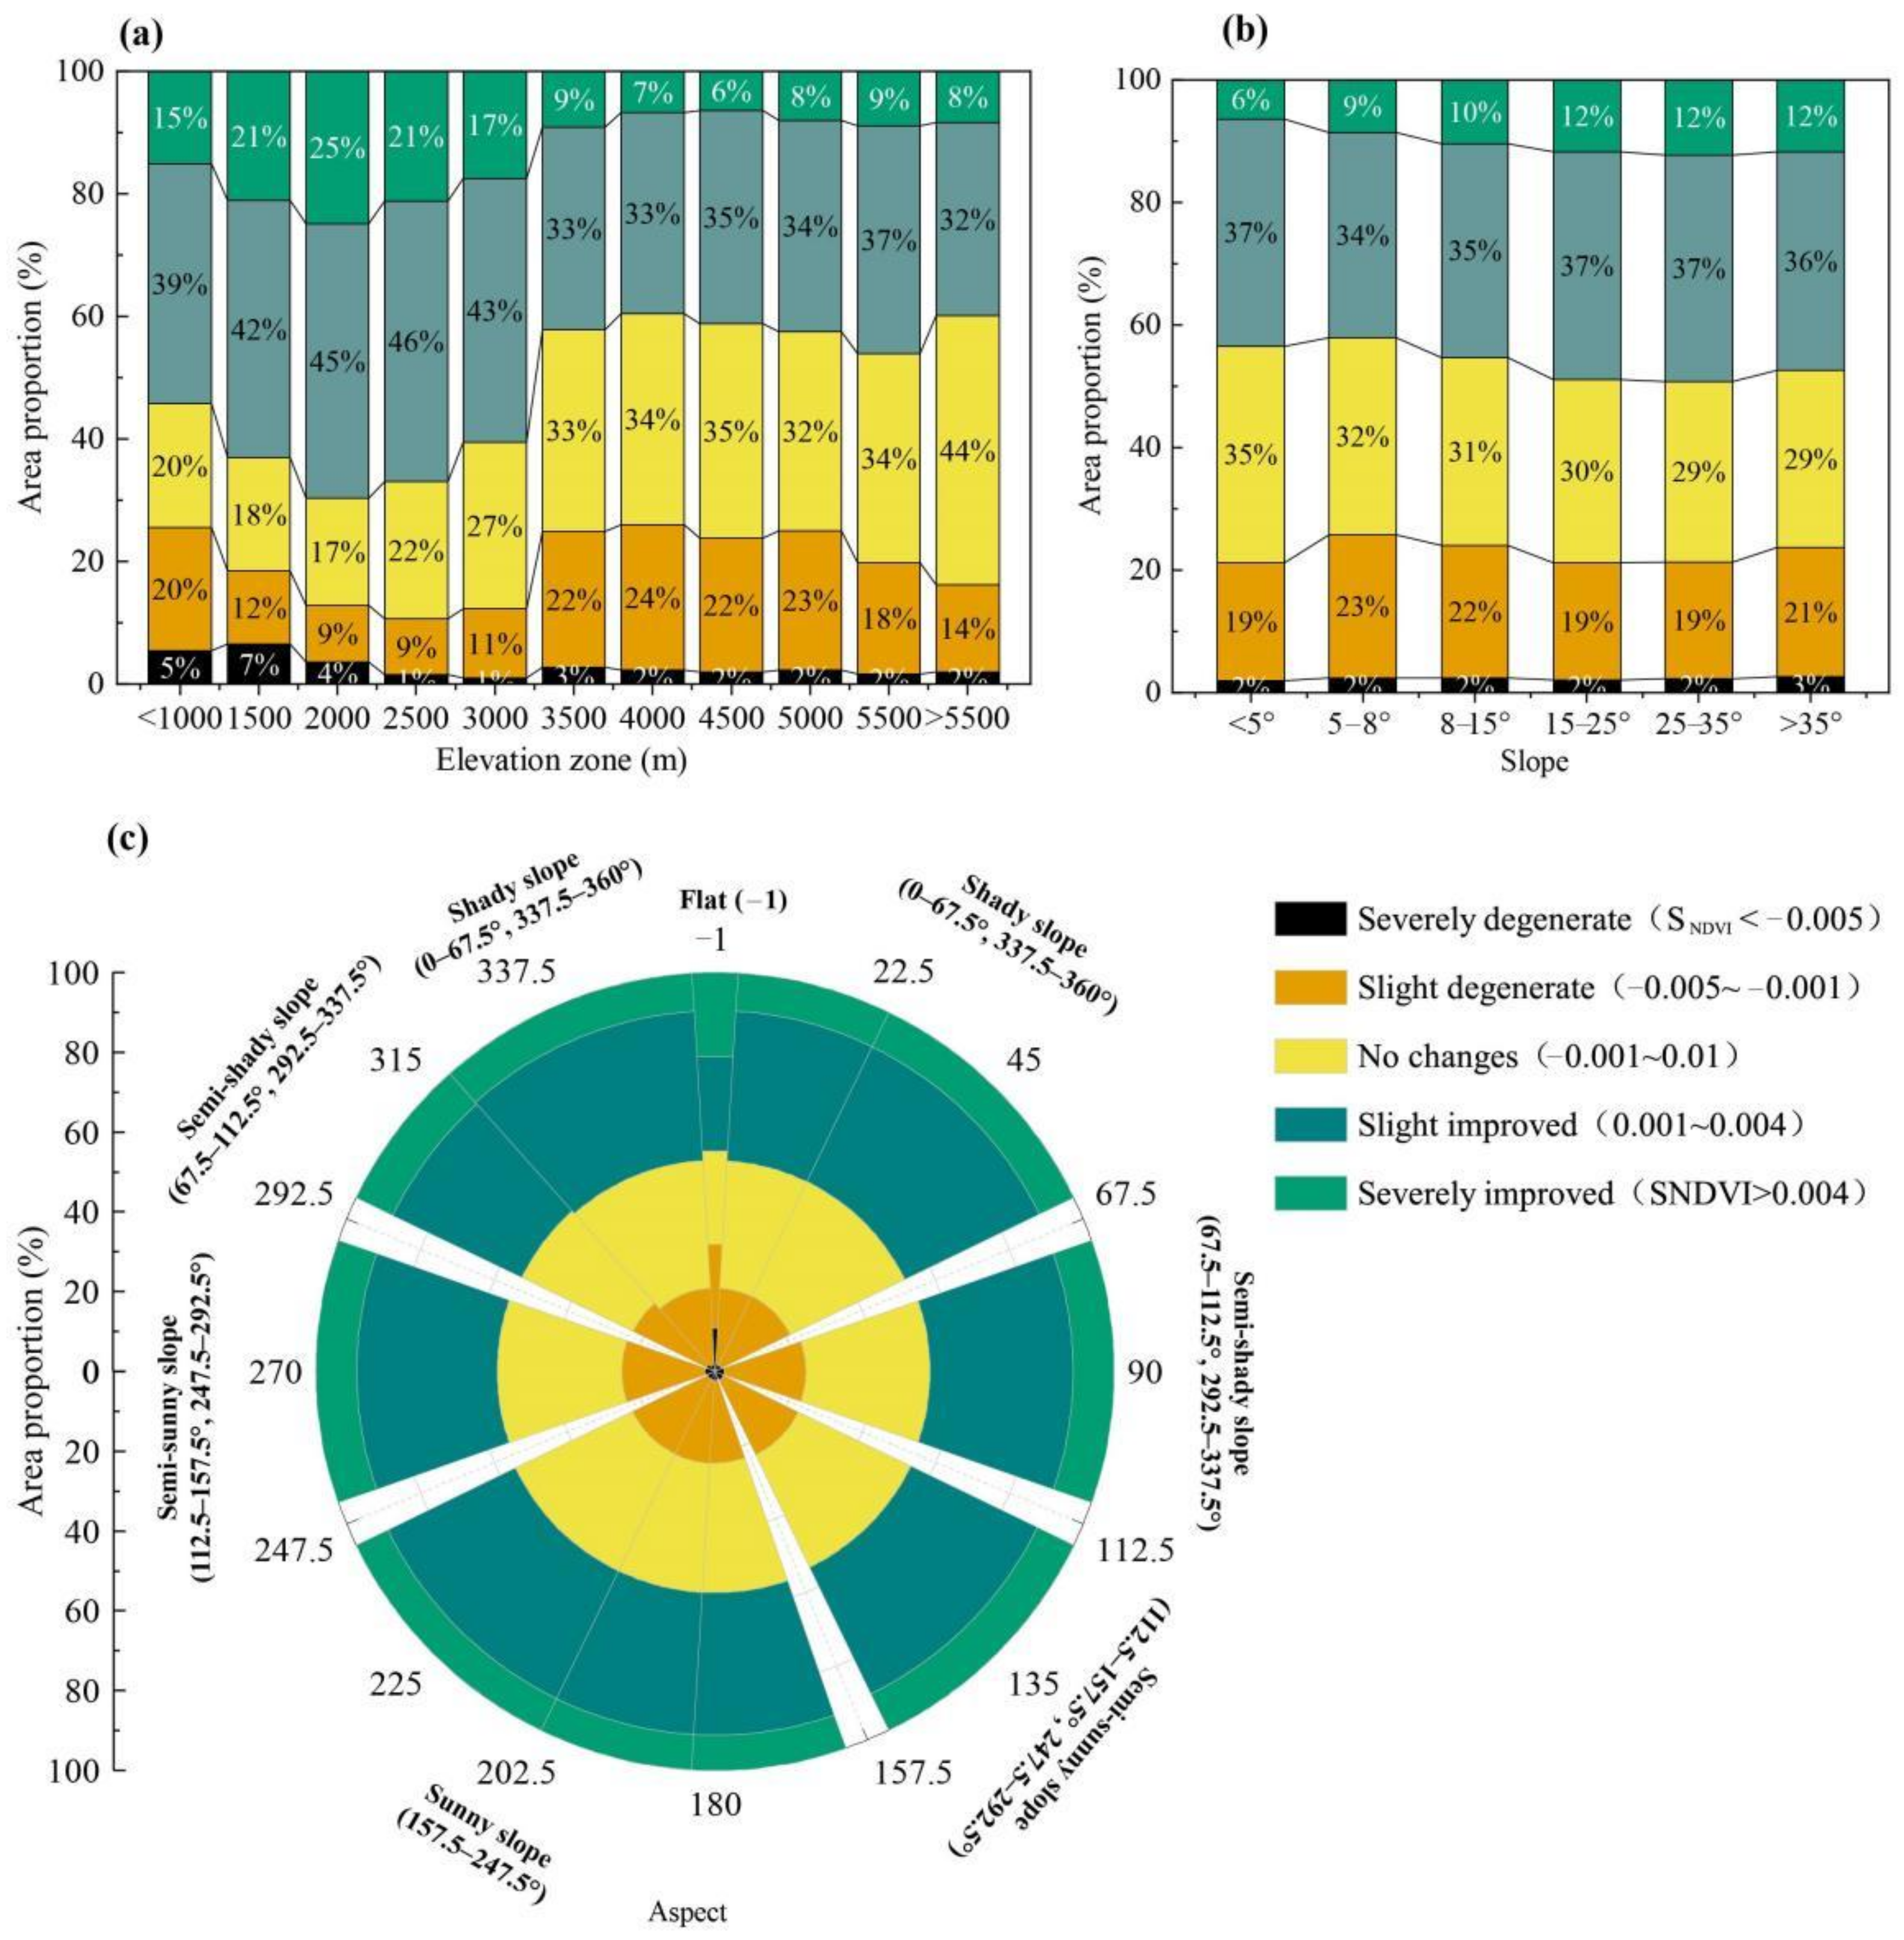
More specifically, except for the three elevation zones, 3500–4000 m, 4000–4500 m, and above 5500 m, with the largest proportion of no changes at 34.36%, 35.04%, and 43.81%, respectively, and the majority of elevation zones (mainly 1000–3500 m) showed a slight improvement trend (Figure 7a, Table S3).
For different slopes, approximately 35% of the area under all slope grades showed a slight improvement (Figure 7b, Table S3). The proportion of vegetation improvement area increased initially and eventually decreased with the steeper slope. Among them, the slope in the northern part of the basin and the source area of TPRR was relatively small (<5°), while the vegetation improvement trend was obvious, with grassland as mainly vegetation type (Figure S4a). The slope in the valley was mainly between 8–35°, which dominated by grassland and evergreen coniferous forest. The slope more than 35° in a few river valleys, especially in the Yunnan section of the TPRR, was mainly evergreen coniferous forest. Besides, the proportion of improved areas (37.12%) was the largest in regions with 15–25° slope. However, we observed that the proportion of area with no changes decreased gradually with the increasing slope (Figure S4b).
According to different aspects, although there was little difference in the proportion of areas between vegetation improvement, stability, and degradation, on an average we could witness slight improvement (Figure 7c, Table S3). Given that aspect had little influence on the vegetation variation trend in the basin, particularly in flat land, the area proportion of vegetation improvement had an inconspicuous increasing trend from shady slope to sunny slope (Figure S4c).

3.3. GWR-Based Driving Force Analysis of Vegetation Change among Different Basins

Taking SNDVI as the dependent variable, and topographic factors (elevation, slope, and aspect) as independent variables, the traditional multiple linear regression model based on OLS could not well explain the spatial heterogeneity of vegetation changes and topographic factors (Table S4; Figure S5; OLS model, R2 = 0.03, F = 60.76), given variance inflation factors (VIF) of each variable were all less than 10.
However, GWR model provided a better overall fitting than OLS (Table 1, R2 = 0.33), which is more proper than OLS in explaining vegetation changes. Moreover, the AICc difference between GWR and OLS was much larger than 3 (ΔAICC = 1458.77), indicating that the fit degree of GWR model is significantly higher than that of OLS, but the Residuals SS of the GWR model also decreases, which indicates that the fitting effect of the GWR model is greatly improved compared with the OLS model (Residuals F = 4. 31) (Table S5).
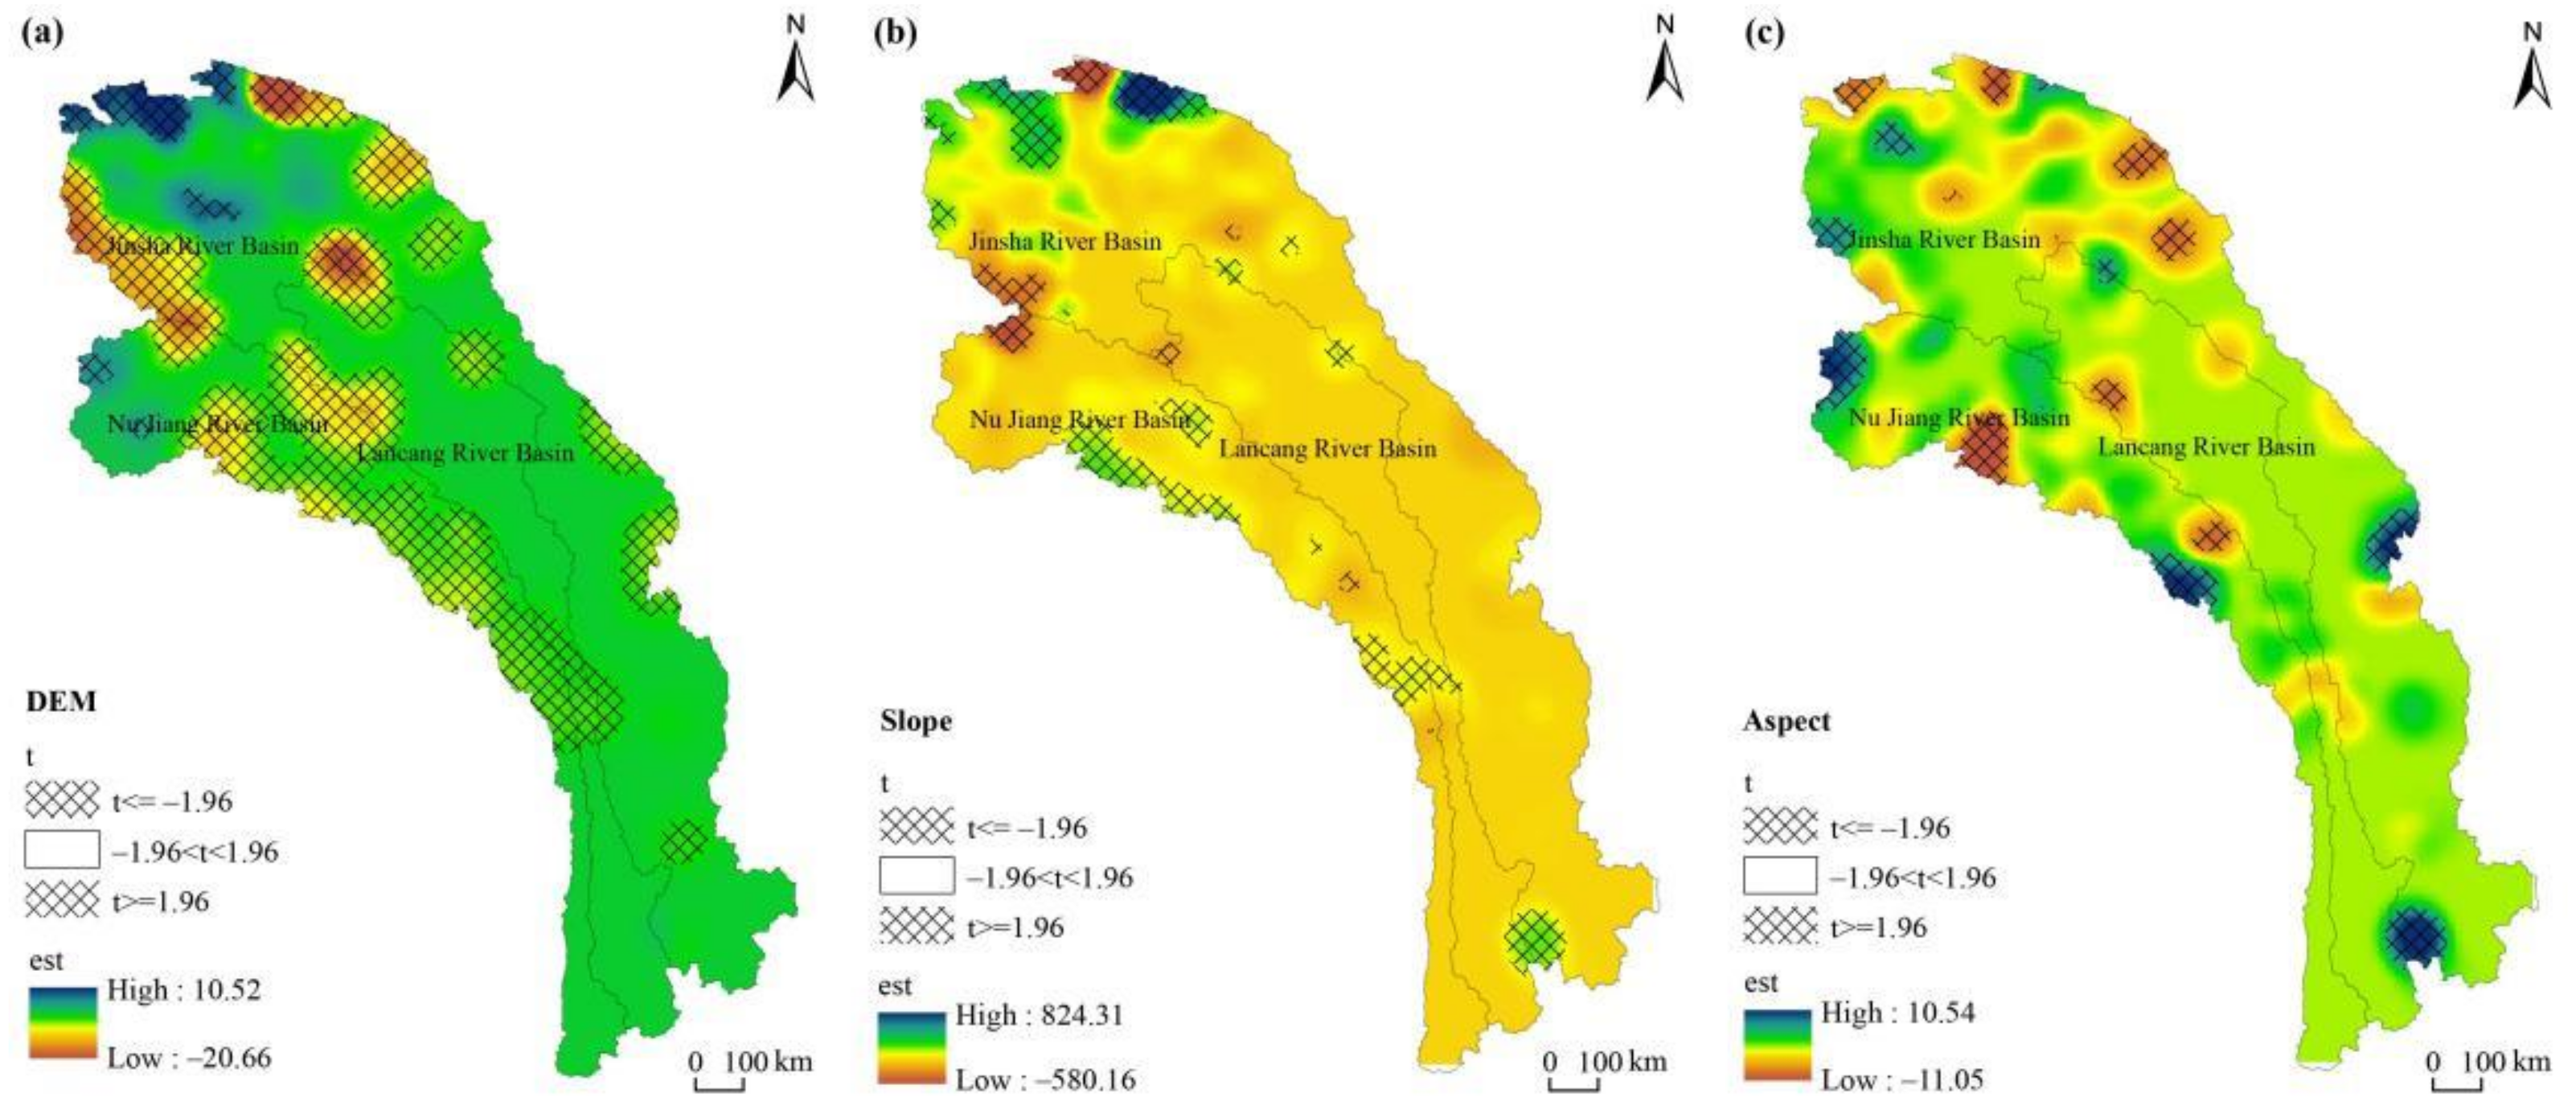
The elevation in the headwaters of the TPRR (in particular, Nujiang river and Jinsha river basins), the middle reaches of the Lancang river, and a few areas in the south of the TPRR (mainly in the south of the Jinsha river) has a significant positive correlation with SNDVI, while the remaining vast majority of areas showed a negative correlation, e.g., the middle reaches of Nujiang river and Jinsha river basin (Figure 8a).
Slope also has a certain regularity on vegetation change since the slope steepness affects the soil and water conservation so that will directly affect the plant growth and development on the earth surface. Slope has location-specific effects positively or negatively on vegetation change in the study area, given whose influence intensity is much smaller than that of elevation. Among them, positive correlation trend mainly existed in the headwaters of the Jinsha river basin and a few areas in the middle reaches, and the lower reaches of the Jinsha river and Nujiang river basins. However, there is a significant negative correlation trend between slope and vegetation variation trend in the junction of the Jinsha river and Nujiang river basins and a small part of the northwest of the source area in Jinsha river basin (Figure 8b).
In terms of aspect, some significant positive correlations exist in a few source areas of the Nujiang river basin, a small part of the TPRR, as well as the junction of the south lower reaches between Jinsha river basin and Nujiang river basin given a significant negative correlation presented in some part of the Nujiang river basin and the source areas of the Jinsha river basin (Figure 8c).

4. Discussion

4.1. Temporal and Spatial Distribution of Vegetation Patterns

Our results show that from 2000 to 2019, the vegetation in the TPRR shows an improving trend in a majority of the areas, while a few areas remain degraded, especially in the source areas of the entire Three Parallel Rivers basin where degradation is more obvious. Compared with the degraded areas, the proportion of areas with improved vegetation is much larger (45.79%). Our findings are consistent with those of other scholars in the QTP or TPRR, who also emphasized that vegetation dynamics in most areas of the QTP have an upward trend, while some areas such as the Nagqu, a few areas in Qinghai Province and several areas on the southeastern edge of the QTP including the Hengduan Mountains are at degradation trends. Natural environmental changes and anthropogenic disturbances jointly increased vegetation degradation [18,24]. Previous studies of vegetation pattern changes in the TPRR and showed that the significant reduction of vegetation cover was mainly in the source area of the Nujiang river and Lancang river as well as some areas in the central part of the study area, which corroborates with our study’s results [20,43]. Different vegetation types of mountainous vegetation are also significantly influenced by spatial scales [47,68,69]. With higher elevations in its northern region and relatively lower elevation in the southern regions the geographical structure in TPRR supports better vegetative growth in the southern region, with cropland and evergreen coniferous forest being main vegetation types. Most of the vegetation is distributed within the elevation range of 1500 to 5500 m, with a myriad of landscape and vegetation types overlaid and intertwined with one another [23]. Along an increasing elevational gradient, the vegetation types transition from subalpine forests, low scrub, alpine grassland to unvegetated areas. This variation in vegetation types is driven by topographic factors that alter regional hydrothermal conditions which in turn indirectly affect vegetation distribution [20,46]. Peng et al. [24] showed the zonal characteristics of vegetation dynamics of different vegetation types, specifically the severe degradation of forests in the southeastern Tibetan Plateau, the increase of alpine grassland vegetation cover in some humid areas of southern Tibet, and the rising trend of cropland under the influence of agricultural activities in the Ali region and the plateau hinterland, all of which undoubtedly confirmed the complex vegetation changes in TPRR.

4.2. Spatial Heterogeneity of Topographic Factors on Vegetation

The results of GWR model strengthen the intuitive perception of the spatial heterogeneity of different topographic factors on NDVI variation in the TPRR, with results indicating that elevation itself has the greatest influence on local vegetation patterns, followed by slope and aspect, which is consistent with previous studies [24,26]. Altitude mostly influences vegetation patterns by affecting mountain climate conditions [70,71]. Our study area is in the QTP region with large elevation differences, and the distribution of heat conditions is successively controlled by the law of decreasing elevation and solar radiation differences, while precipitation distribution mainly affected by the trend of water vapor channel orientation, which is mainly related to the distribution of mountains. Therefore, analyzing the influence of topographic factors on vegetation change can better understanding mechanism of the climate-vegetation interaction, which is often ignored in current research [72]. Notably, the relative importance of elevation is generally reflected in its effect on the gradient of species’ ecological niches, which determines the distributed of vegetation types in the region and the vegetation growth by representing laterally such environmental factors as slope or the amount of soil moisture [73,74]. Besides, slope can be one predictor variable to investigate plant diversity or capture potential changes in elevation in a region [73,74,75,76]. Slope can affect species richness by influencing soil moisture, soil erosion rates, and litter accumulation. However, related studies have shown that alpine treeline elevation changes in the Three Parallel Rivers region of southwest China are less affected by slope, further confirming the validity of our findings that slope has little effect on NDVI trends [39]. Moreover, Yirdaw et al. (2015) suggested that aspect affected woody plant species diversity, especially for woody plants at higher elevations, and that sunny slopes tended to receive higher amounts of solar radiation, which could accelerate greater air and soil temperatures [27]. Nevertheless, our results indicated the effect of aspect on NDVI trend was not significant, and the highest vegetation cover (35.25%) was found on the semi-shady slopes. Few scholars have explored the effect of aspect on vegetation changes and even the distribution of some major species in our study area, which may require further research.

4.3. Analysis of the Other Drivers Influencing Changes in Vegetation Dynamics

Beyond the influence of topographic factors on the vegetation pattern mentioned in this study, climatic conditions are the most well discussed factors for vegetation change in the region. Studies have shown that temperature and precipitation indirectly affect the productivity of terrestrial ecosystems by altering nutrient availability [17,77], and several scholars have reported the influence of temperature and precipitation these two climatic factors on the photosynthesis and respiration of vegetation changes by influencing soil moisture and microbial activities in the QTP. Obviously, their short-term effect on vegetation degradation is not significant [26,78,79]. However, the direct influence of topography on climatic conditions in mountainous areas was mentioned in the previous subsection, and our study confirms the strong influence of elevation on vegetation distribution, but the relationship between topographic and climatic factors and the joint influence of both on vegetation distribution is lacking in this study area and needs further analysis.
In addition, the impact of human activities on the vegetation pattern should not be underestimated. Hengduan Mountain area in the southeast QTP acts as a critical ecological barrier due to its unique ecological location and unique characteristics. In this region, several key national ecological projects have been implemented in the past to protect its natural forests, returning cropland to forest, biodiversity conservation, and ecological restoration, which have shown positive outcomes, and can also be the main reason for the improvement in NDVI observed in this study. Lu et al.compared the effects of three large-scale ecological programs (National Nature Reserves, Three North Shelter Forest Program, and the Natural Forest Protection Program) on Chinese vegetation change and revealed that the effectiveness of ecological restoration projects can vary geographically even under the same incentive policy context [80]. Moreover, several national and provincial protected areas, including the Three Parallel Rivers National Park, have been established in the TPRR. These protected areas can play a positive role in maintaining biodiversity, enhancing the regulation function of ecosystem, and building a scientific and reasonable ecological space. Grazing intensity is also one of the main driving factors affecting vegetation cover in grasslands in the QTP. Grasslands in QTP region have been considered as natural pastures for grazing by herders for many years [81,82]. Studies have shown that long-term grazing directly affects the vegetation cover and productivity of grasslands, but with the implementation of a series of ecological measures related to grassland restoration, e.g., grazing prohibition, and pastureland rehabilitation, the degradation of grasslands has been mitigated, which may also be one of the main reasons why the vegetation trends in our study area tends to improve [83,84].

5. Conclusions

In this paper, we explored the influence of topographic factors on the vegetation change patterns in the TPRR of southeastern QTP over the past 20 years. We analyzed the spatial and temporal distribution of vegetation patterns and the magnitude of the driving forces of each topographic factor with the GWR model, and the main conclusions are as follows:
During 2000–2019, the NDVI in the basin showed an overall increasing trend, with the most significant upward trend in the Lancang River basin, and the year of sudden change in NDVI in each basin was around 2004. Besides, the spato-temporal distribution of regional multi-year NDVI was influenced by elevation with significant north-south differences, while slope and aspect had little influence. Moreover, NDVI trends in the basin showed an overall improvement trend, mainly with slight improvement. The improvement areas are generally distributed in the southern section and the source area of the Jinsha River basin, and there is a degradation trend in the river source area of the TPRR. Specifically, the vegetation in all elevation zones was slightly improved, and the area of vegetation improvement increased and then decreased with increasing slope, while aspect has the least effect. The GWR model showed that elevation and NDVI were negatively correlated in most areas, and the effect of slope and aspect on vegetation changes was smaller, which were significantly correlated in the middle reaches of the Nujiang River basin and some parts of the Jinsha River basin. The interactions between topographic and climatic factors and their joint effects on vegetation distribution is lacking and needs further study in TPRR. Furthermore, the impact of human activities on the vegetation pattern should also be highlighted and integrated with climate change and other drivers for comprehensive analysis.

Supplementary Materials

The following are available online at https://www.mdpi.com/article/10.3390/rs14010151/s1, Table S1: Classification of topographic factors in the study area, Figure S1: Variation characteristics of mean NDVI with different topographic factors, Figure S2: Spatial distribution of mean NDVI with different topographic factors during 2000–2019, Table S2: Annual mean NDVI area statistics for different topographic factors during 2000–2019, Figure S3: NDVI trends during 2000–2019 with different topographic factors in the basin (a, b, c show elevation, slope and aspect respectively), Figure S4: Spatial distribution of NDVI trends for different topographic factors from 2000 to 2019, Table S3: Area statistics of NDVI trends for different topographic factors from 2000 to 2019, Table S4: Parameter estimation and test results of the OLS model, Figure S5: Estimation result of regression coefficients obtained through OLS modeling. (Notes: for the entire regression equation, the adjustment R2 is 0.03, F value is 60.76, and P < 0.01; the two dashed lines denote that the t-value is equal to −1.96 and 1. 96 respectively; at 0.05 significance level, t < −1.96 means a significantly negative correlation, while t > 1.96 represents a positive correlation.), Table S5: Comparison of model performance between the GWR and OLS models.

Author Contributions

Conceptualization, J.W., N.W. and C.W.; methodology, C.W., X.C. and Y.W.; software, C.W.; validation, J.W. and C.W.; formal analysis, C.W.; investigation, C.W.; resources, C.W.; data curation, C.W.; writing—original draft preparation, C.W.; writing—review and editing, C.W., J.W., N.N., N.W., X.C., Y.W. and Q.C.; visualization, C.W.; supervision, J.W.; project administration, J.W.; funding acquisition, J.W. All authors have read and agreed to the published version of the manuscript.

Funding

This research was funded by the National Science Foundation of China (No. 31971436 and 41661144045); State Key Laboratory of Cryospheric Science, Northwest Institute of Eco-Environment and Resources, Chinese Academy Sciences (SKLCSOP-2018-07) and China Biodiversity Observation Networks (Sino BON)”.

Data Availability Statement

The data presented in this study are available on request from the corresponding author.

Acknowledgments

The authors would like to thank the researchers who have provided the open-source algorithms, which have been extremely helpful to the research in this paper.

Conflicts of Interest

The authors declare no conflict of interest.

References

  1. Wen, Z.F.; Wu, S.J.; Chen, J.L.; Lu, M.Q. NDVI indicated long-term interannual changes in vegetation activities and their responses to climatic and anthropogenic factors in the Three Gorges Reservoir Region, China. Sci. Total Environ. 2017, 574, 947–959. [Google Scholar] [CrossRef]
  2. Zhang, P.P.; Cai, Y.P.; Yang, W.; Yi, Y.J.; Yang, Z.F.; Fu, Q. Contributions of climatic and anthropogenic drivers to vegetation dynamics indicated by NDVI in a large dam-reservoir-river system. J. Clean Prod. 2020, 256, 120477. [Google Scholar] [CrossRef]
  3. Qu, S.; Wang, L.C.; Lin, A.W.; Zhu, H.J.; Yuan, M.X. What drives the vegetation restoration in Yangtze River basin, China: Climate change or anthropogenic factors? Ecol. Indic. 2018, 90, 438–450. [Google Scholar] [CrossRef]
  4. Julio Camarero, J.; Manzanedo, R.D.; Sanchez-Salguero, R.; Navarro-Cerrillo, R.M. Growth response to climate and drought change along an aridity gradient in the southernmost Pinus nigra relict forests. Ann. For. Sci. 2013, 70, 769–780. [Google Scholar] [CrossRef]
  5. Palombo, C.; Marchetti, M.; Tognetti, R. Mountain vegetation at risk: Current perspectives and research reeds. Plant Biosyst. 2014, 148, 35–41. [Google Scholar] [CrossRef]
  6. Lu, L.; Xu, Y.; Huang, A.; Liu, C.; Marcos-Martinez, R.; Huang, L. Influences of Topographic Factors on Outcomes of Forest Programs and Policies in a Mountain Region of China: A Case Study. Mt. Res. Dev. 2020, 40, R48–R60. [Google Scholar] [CrossRef]
  7. Xu, M.; Ma, L.; Jia, Y.; Liu, M. Integrating the effects of latitude and altitude on the spatial differentiation of plant community diversity in a mountainous ecosystem in China. PLoS ONE 2017, 12, e0176866. [Google Scholar] [CrossRef]
  8. Grytnes, J.-A.; Kapfer, J.; Jurasinski, G.; Birks, H.H.; Henriksen, H.; Klanderud, K.; Odland, A.; Ohlson, M.; Wipf, S.; Birks, H.J.B. Identifying the driving factors behind observed elevational range shifts on European mountains. Glob. Ecol. Biogeogr. 2014, 23, 876–884. [Google Scholar] [CrossRef] [Green Version]
  9. Elliott, G.P. Extrinsic regime shifts drive abrupt changes in regeneration dynamics at upper treeline in the Rocky Mountains, USA. Ecology 2012, 93, 1614–1625. [Google Scholar] [CrossRef]
  10. Moyes, A.B.; Germino, M.J.; Kueppers, L.M. Moisture rivals temperature in limiting photosynthesis by trees establishing beyond their cold-edge range limit under ambient and warmed conditions. New Phytol. 2015, 207, 1005–1014. [Google Scholar] [CrossRef]
  11. Carbutt, C.; Edwards, T.J. Reconciling ecological and phytogeographical spatial boundaries to clarify the limits of the montane and alpine regions of sub-Sahelian Africa. S. Afr. J. Bot. 2015, 98, 64–75. [Google Scholar] [CrossRef]
  12. Hemp, A. Climate change-driven forest fires marginalize the impact of ice cap wasting on Kilimanjaro. Glob. Change Biol. 2005, 11, 1013–1023. [Google Scholar] [CrossRef]
  13. Hertel, D.; Wesche, K. Tropical moist Polylepis stands at the treeline in East Bolivia: The effect of elevation on stand microclimate, above- and below-ground structure, and regeneration. Trees Struct. Funct. 2008, 22, 303–315. [Google Scholar] [CrossRef] [Green Version]
  14. Monteiro, J.A.F.; Hiltbrunner, E.; Koerner, C. Functional morphology and microclimate of Festuca orthophylla, the dominant tall tussock grass in the Andean Altiplano. Flora 2011, 206, 387–396. [Google Scholar] [CrossRef]
  15. Klimes, L.; Dolezal, J. An experimental assessment of the upper elevational limit of flowering plants in the western Himalayas. Ecography 2010, 33, 590–596. [Google Scholar] [CrossRef]
  16. Koerner, C. Global Statistics of “Mountain” and “Alpine” Research. Mt. Res. Dev. 2009, 29, 97–102. [Google Scholar] [CrossRef]
  17. Körner, C. Alpine Plant Life: Functional Plant Ecology of High Mountain Ecosystems, 3rd ed.; Springer Nature Switzerland AG: Cham, Switzerland, 2021; pp. 53–85. [Google Scholar] [CrossRef]
  18. Yu, B.H.; Lv, C.H.; Lv, T.T.; Yang, A.Q.; Liu, C. Regional differentiation of vegetation change in the Qinghai-Tibet Plateau. Prog. Geog. 2009, 28, 391–397. [Google Scholar]
  19. Guo, D.; Zhang, H.Y.; Hou, G.L.; Zhao, J.J.; Liu, D.Y.; Guo, X.Y. Topographic controls on alpine treeline patterns on Changbai Mountain, China. J. Mt. Sci. Engl. 2014, 11, 429–441. [Google Scholar] [CrossRef]
  20. Liu, X.F.; Zhang, J.S.; Zhu, X.F.; Pan, Y.Z.; Liu, Y.X.; Zhang, D.H.; Lin, Z.H. Spatiotemporal changes in vegetation coverage and its driving factors in the Three-River Headwaters Region during 2000–2011. J. Geogr. Sci. 2014, 24, 288–302. [Google Scholar] [CrossRef]
  21. Wang, B.; Xu, G.; Li, P.; Li, Z.; Zhang, Y.; Cheng, Y.; Jia, L.; Zhang, J. Vegetation dynamics and their relationships with climatic factors in the Qinling Mountains of China. Ecol. Indic. 2020, 108, 105719. [Google Scholar] [CrossRef]
  22. Zoungrana, B.J.B.; Conrad, C.; Thiel, M.; Amekudzi, L.K.; Da, E.D. MODIS NDVI trends and fractional land cover change for improved assessments of vegetation degradation in Burkina Faso, West Africa. J. Arid. Environ. 2018, 153, 66–75. [Google Scholar] [CrossRef]
  23. Peng, J.; Li, Y.; Tian, L.; Liu, Y.X.; Wang, Y.L. Vegetation Dynamics and Associated Driving Forces in Eastern China during 1999–2008. Remote Sens. 2015, 7, 13641–13663. [Google Scholar] [CrossRef] [Green Version]
  24. Xu, M.; Li, X.; Liu, M.; Shi, Y.; Zhou, H.; Zhang, B.; Yan, J. Spatial variation patterns of plant herbaceous community response to warming along latitudinal and altitudinal gradients in mountainous forests of the Loess Plateau, China. Environ. Exp. Bot. 2020, 172, 103983. [Google Scholar] [CrossRef]
  25. Peng, J.; Liu, Z.; Liu, Y.; Wu, J.; Han, Y. Trend analysis of vegetation dynamics in Qinghai–Tibet Plateau using Hurst Exponent. Ecol. Indic. 2012, 14, 28–39. [Google Scholar] [CrossRef]
  26. Wang, H.; Qi, Y.; Huang, C.; Li, X.; Deng, X.; Zhang, J. Analysis of vegetation changes and dominant factors on the Qinghai-Tibet Plateau, China. Sci. Cold Arid. Reg. 2019, 11, 150–158. [Google Scholar] [CrossRef]
  27. Yirdaw, E.; Starr, M.; Negash, M.; Yimer, F. Influence of topographic aspect on floristic diversity, structure and treeline of afromontane cloud forests in the Bale Mountains, Ethiopia. J. For. Res. 2015, 26, 919–931. [Google Scholar] [CrossRef]
  28. Mohapatra, J.; Singh, C.P.; Tripathi, O.P.; Pandya, H.A. Remote sensing of alpine treeline ecotone dynamics and phenology in Arunachal Pradesh Himalaya. Int. J. Remote Sens. 2019, 40, 7986–8009. [Google Scholar] [CrossRef]
  29. Jacquin, A.; Sheeren, D.; Lacombe, J.-P. Vegetation cover degradation assessment in Madagascar savanna based on trend analysis of MODIS NDVI time series. Int. J. Appl. Earth Obs. Geoinf. 2010, 12, S3–S10. [Google Scholar] [CrossRef] [Green Version]
  30. Gao, Q.Z.; Li, Y.; Wan, Y.F.; Zhang, W.N.; Borjigdai, A. Challenges in disentangling the influence of climatic and socio-economic factors on alpine grassland ecosystems in the source area of Asian major rivers. Quatern. Int. 2013, 304, 126–132. [Google Scholar] [CrossRef]
  31. Sun, Y.L.; Yang, Y.L.; Zhang, Y.; Wang, Z.L. Assessing vegetation dynamics and their relationships with climatic variability in northern China. Phys. Chem. Earth 2015, 87–88, 79–86. [Google Scholar] [CrossRef]
  32. Zewdie, W.; Csaplovics, E.; Inostroza, L. Monitoring ecosystem dynamics in northwestern Ethiopia using NDVI and climate variables to assess long term trends in dryland vegetation variability. Appl. Geogr 2017, 79, 167–178. [Google Scholar] [CrossRef]
  33. Ren, Y.; Lu, Y.; Fu, B.; Comber, A.; Li, T.; Hu, J. Driving Factors of Land Change in China’s Loess Plateau: Quantification Using Geographically Weighted Regression and Management Implications. Remote Sens. 2020, 12, 453. [Google Scholar] [CrossRef] [Green Version]
  34. Brunsdon, C.; Fotheringham, A.S.; Charlton, M.E. Geographically Weighted Regression: A Method for Exploring Spatial Nonstationarity. Geogr. Anal. 1996, 28, 281–298. [Google Scholar] [CrossRef]
  35. Dullinger, S.; Dirnbock, T.; Grabherr, G. Modelling climate change-driven treeline shifts: Relative effects of temperature increase, dispersal and invasibility. J. Ecol. 2004, 92, 241–252. [Google Scholar] [CrossRef]
  36. Diao, Y.X.; Wang, J.J.; Yang, F.L.; Wu, W.; Zhou, J.; Wu, R.D. Identifying optimized on-the-ground priority areas for species conservation in a global biodiversity hotspot. J. Environ. Manag. 2021, 290, 112630. [Google Scholar] [CrossRef] [PubMed]
  37. Liang, J.; Liu, Y.; Ying, L.; Li, P.; Xu, Y.; Shen, Z. Road impacts on spatial patterns of land use and landscape fragmentation in three parallel rivers region, Yunnan Province, China. Chin. Geogr. Sci. 2014, 24, 15–27. [Google Scholar] [CrossRef] [Green Version]
  38. Ou, X.; Replumaz, A.; van der Beek, P. Contrasting exhumation histories and relief development within the Three Rivers Region (south-east Tibet). Solid Earth 2021, 12, 563–580. [Google Scholar] [CrossRef]
  39. Wang, W.; Körner, C.; Zhang, Z.; Wu, R.; Geng, Y.; Shi, W.; Ou, X. No slope exposure effect on alpine treeline position in the Three Parallel Rivers Region, SW China. Alp. Bot. 2013, 123, 87–95. [Google Scholar] [CrossRef]
  40. Li, H.; Zhao, K.; Zhu, X.; Yang, S. Protecting and using of ecotourism resource of moon mountain scenic spot in Three Parallel River Area. Ecol. Econ. 2008, 5, 75–80. [Google Scholar]
  41. Guo, Y.; Yang, F.; Wang, J.; Wu, R. Assessment of the tourism and recreation cultural ecosystem services in Three Parallel Rivers Region. Acta Ecol. 2020, 40, 4351–4361. [Google Scholar]
  42. Guo, Y.; Wu, R.; Yang, F.; Wang, J. The spatial patterns of scenic spots in Three Parallel Rivers Region. J. Yunnan Univ. 2020, 42, 992–1003. [Google Scholar]
  43. Pan, X.; Wu, X.; Shen, Y.; Liu, F.; Zhang, C. Responses of Vegetation Coverage Changes to Climate Factors in the Source Regions of Three Parallel Rivers. Mt. Res. 2015, 33, 218–226. [Google Scholar] [CrossRef]
  44. Deng, C.; Zhang, W. Spatiotemporal distribution and the characteristics of the air temperature of a river source region of the Qinghai-Tibet Plateau. Environ. Monit. Assess 2018, 190, 368. [Google Scholar] [CrossRef] [PubMed]
  45. Huang, C.; Li, Y.F.; Liu, G.H.; Zhang, H.L.; Liu, Q.S. Recent climate variability and its impact on precipitation, temperature, and vegetation dynamics in the Lancang River headwater area of China. Int. J. Remote Sens. 2014, 35, 2822–2834. [Google Scholar] [CrossRef]
  46. Li, J.P.; Dong, S.K.; Peng, M.C.; Li, X.Y.; Liu, S.L. Vegetation distribution pattern in the dam areas along middle-low reach of Lancang-Mekong River in Yunnan Province, China. Front. Earth Sci. 2012, 6, 283–290. [Google Scholar] [CrossRef]
  47. Cheng, Z.J.; Weng, C.Y.; Guo, J.Q.; Dai, L.; Zhou, Z.Z. Vegetation responses to late Quaternary climate change in a biodiversity hotspot, the Three Parallel Rivers region in southwestern China. Palaeogeogr. Palaeocl. 2018, 491, 10–20. [Google Scholar] [CrossRef]
  48. Yao, X.; Deng, J.; Liu, X.; Zhou, Z.; Yao, J.; Dai, F.; Ren, K.; Li, L. Primary Recognition of Active Landslides and Development Rule Analysis for Pan Three-river-parallel Territory of Tibet Plateau. Adv. Eng. Sci. 2020, 52, 16–37. [Google Scholar] [CrossRef]
  49. Gao, Y.; Zhao, S.; Deng, J. Developing Law of Damming Landslide and Challenges for Disaster Prevention and Mitigation in the Three-river-parallel Territory in the Tibetan Plateau. Adv. Eng. Sci. 2020, 52, 50–61. [Google Scholar] [CrossRef]
  50. Myers, N.; Mittermeier, R.A.; Mittermeier, C.G.; da Fonseca, G.A.B.; Kent, J. Biodiversity hotspots for conservation priorities. Nature 2000, 403, 853–858. [Google Scholar] [CrossRef]
  51. Guo, T.; Duan, Q.; Hua, S.; Shi, D.; Xu, C.; Tong, W.; Ning, D.; Lu, S.; Qin, B.; Yu, J.; et al. Ministry of Water Resources the People’s Republic of China. Standards for Classification and Gradation of Soil Erosion; China Water & Power Press: Beijing, China, 2008; pp. 8–9. (In Chinese)
  52. He, W.; Ye, C.; Sun, J.; Xiong, J.; Wang, J.; Zhou, T. Dynamics and Drivers of the Alpine Timberline on Gongga Mountain of Tibetan Plateau-Adopted from the Otsu Method on Google Earth Engine. Remote Sens. 2020, 12, 2651. [Google Scholar] [CrossRef]
  53. Jiang, L.G.; Liu, X.N.; Feng, Z.M. Remote sensing identification and spatial pattern analysis of the alpine timberline in the three parallel rivers region. Resour. Sci. 2014, 36, 259–266. [Google Scholar]
  54. Yang, Y.K.; Xiao, P.F.; Feng, X.Z.; Li, H.X. Accuracy assessment of seven global land cover datasets over China. ISPRS J. Photogramm. 2017, 125, 156–173. [Google Scholar] [CrossRef]
  55. Kuppel, S.; Fan, Y.; Jobbagy, E.G. Seasonal hydrologic buffer on continents: Patterns, drivers and ecological benefits. Adv. Water Resour. 2017, 102, 178–187. [Google Scholar] [CrossRef] [Green Version]
  56. Gang, C.C.; Zhao, W.; Zhao, T.; Zhang, Y.; Gao, X.R.; Wen, Z.M. The impacts of land conversion and management measures on the grassland net primary productivity over the Loess Plateau, Northern China. Sci. Total Environ. 2018, 645, 827–836. [Google Scholar] [CrossRef]
  57. Bontemps, S.; Boettcher, M.; Brockmann, C.; Kirches, G.; Lamarche, C.; Radoux, J.; Santoro, M.; Vanbogaert, E.; Wegmüller, U.; Herold, M.; et al. Multi-year global land cover mapping at 300 m and characterization for climate modelling: Achievements of the Land Cover component of the ESA Climate Change Initiative. ISPRS Int. Arch. Photogramm. Remote Sens. Spat. Inf. Sci. 2015, XL-7/W3, 323–328. [Google Scholar] [CrossRef] [Green Version]
  58. Gregory, D.; Josh, H.; Alessandro, C. A dataset mapping the potential biophysical effects of vegetation cover change. Sci. Data 2018, 5, 180014. [Google Scholar] [CrossRef] [Green Version]
  59. Liu, J.; Wen, Z.; Gang, C. Normalized difference vegetation index of different vegetation cover types and its responses to climate change in the Loess Plateau. Acta Ecol. Sin. 2020, 40, 678–691. [Google Scholar] [CrossRef]
  60. Li, H.; Xie, M.; Wang, H.; Li, S.; Xu, M. Spatial Heterogeneity of Vegetation Response to Mining Activities in Resource Regions of Northwestern China. Remote Sens. 2020, 12, 3247. [Google Scholar] [CrossRef]
  61. Zhi, Y.; Shan, L.; Ke, L.; Yang, R. Analysis of Land Surface Temperature Driving Factors and Spatial Heterogeneity Research Based on Geographically Weighted Regression Model. Complexity 2020, 2020, 2862917. [Google Scholar] [CrossRef]
  62. Comber, A.J.; Brunsdon, C.; Radburn, R. A spatial analysis of variations in health access: Linking geography, socio-economic status and access perceptions. Int. J. Health Geogr. 2011, 10, 44. [Google Scholar] [CrossRef] [PubMed] [Green Version]
  63. Yang, C.; Li, R.; Sha, Z. Exploring the Dynamics of Urban Greenness Space and Their Driving Factors Using Geographically Weighted Regression: A Case Study in Wuhan Metropolis, China. Land 2020, 9, 500. [Google Scholar] [CrossRef]
  64. Zhao, R.; Yao, M.; Yang, L.; Qi, H.; Meng, X.; Zhou, F. Using geographically weighted regression to predict the spatial distribution of frozen ground temperature: A case in the Qinghai-Tibet Plateau. Environ. Res. Lett. 2021, 16, 024003. [Google Scholar] [CrossRef]
  65. Nakaya, T. GWR4.09 User Manual. WWW Document. Available online: https://raw.githubusercontent.com/gwrtools/gwr4/master/GWR4manual_409.pdf (accessed on 16 May 2021).
  66. Zhang, D.; Jia, Q.; Wang, P.; Zhang, J.; Hou, X.; Li, X.; Li, W. Analysis of spatial variability in factors contributing to vegetation restoration in Yan’an, China. Ecol. Indic. 2020, 113, 106278. [Google Scholar] [CrossRef]
  67. Xue, R.; Yu, X.; Li, D.; Ye, X. Using geographically weighted regression to explore the effects of environmental heterogeneity on the space use by giant pandas in Qinling Mountains. Acta Ecol. Sin. 2020, 40, 2647–2654. [Google Scholar] [CrossRef]
  68. Levin, S.A. The Problem of Pattern and Scale in Ecology: The Robert H. MacArthur Award Lecture. Ecology 1992, 73, 1943–1967. [Google Scholar] [CrossRef]
  69. Zhang, W.J.; Liu, L.; Song, K.C.; Li, X.D.; Wang, Y.D.; Tang, Y.; Jiang, H.R. Remote sensing the orographic effects of dry-hot valley on vegetation distribution in the southeast Tibetan Plateau. Int. J. Remote Sens. 2019, 40, 8589–8607. [Google Scholar] [CrossRef]
  70. Grytnes, J.A. Species-richness patterns of vascular plants along seven altitudinal transects in Norway. Ecography 2003, 26, 291–300. [Google Scholar] [CrossRef]
  71. Lenoir, J.; Graae, B.J.; Aarrestad, P.A.; Alsos, I.G.; Armbruster, W.S.; Austrheim, G.; Bergendorff, C.; Birks, H.J.B.; Brathen, K.A.; Brunet, J.; et al. Local temperatures inferred from plant communities suggest strong spatial buffering of climate warming across Northern Europe. Glob. Chang. Biol. 2013, 19, 1470–1481. [Google Scholar] [CrossRef]
  72. White, A.B.; Kumar, P.; Tcheng, D. A data mining approach for understanding topographic control on climate-induced inter-annual vegetation variability over the United States. Remote Sens. Environ. 2005, 98, 1–20. [Google Scholar] [CrossRef]
  73. Jia, L.; Li, Z.; Xu, G.; Ren, Z.; Li, P.; Cheng, Y.; Zhang, Y.; Wang, B.; Zhang, J.; Yu, S. Dynamic change of vegetation and its response to climate and topographic factors in the Xijiang River basin, China. Environ. Sci. Pollut. Res. 2020, 27, 11637–11648. [Google Scholar] [CrossRef]
  74. Moeslund, J.E.; Arge, L.; Bocher, P.K.; Dalgaard, T.; Odgaard, M.V.; Nygaard, B.; Svenning, J.C. Topographically controlled soil moisture is the primary driver of local vegetation patterns across a lowland region. Ecosphere 2013, 4, 91. [Google Scholar] [CrossRef]
  75. Jones, M.M.; Szyska, B.; Kessler, M. Microhabitat partitioning promotes plant diversity in a tropical montane forest. Glob. Ecol. Biogeogr. 2011, 20, 558–569. [Google Scholar] [CrossRef]
  76. Zhang, C.S.; Li, X.Y.; Chen, L.; Xie, G.D.; Liu, C.L.; Pei, S. Effects of Topographical and Edaphic Factors on Tree Community Structure and Diversity of Subtropical Mountain Forests in the Lower Lancang River Basin. Forests 2016, 7, 222. [Google Scholar] [CrossRef]
  77. Jobbágy, E.G.; Sala, O.E.; Paruelo, J.M. Patterns and Controls of Primary Production in the Patagonian Steppe: A Remote Sensing Approach. Ecology 2002, 83, 307–319. [Google Scholar] [CrossRef] [Green Version]
  78. Mou, X.; Yu, Y.; Li, X.; Degen, A. Presence frequency of plant species can predict spatial patterns of the species in small patches on the Qinghai-Tibetan Plateau. Glob. Ecol. Conserv. 2020, 21, e00888. [Google Scholar] [CrossRef]
  79. Sun, J.; Cheng, G.W.; Li, W.P. Meta-analysis of relationships between environmental factors and aboveground biomass in the alpine grassland on the Tibetan Plateau. Biogeosciences 2013, 10, 1707–1715. [Google Scholar] [CrossRef] [Green Version]
  80. Lu, Y.; Zhang, L.; Feng, X.; Zeng, Y.; Fu, B.; Yao, X.; Li, J.; Wu, B. Recent ecological transitions in China: Greening, browning, and influential factors. Sci. Rep. 2015, 5, 8732. [Google Scholar] [CrossRef] [PubMed]
  81. Cao, J.; Adamowski, J.F.; Deo, R.C.; Xu, X.; Gong, Y.; Feng, Q. Grassland Degradation on the Qinghai-Tibetan Plateau: Reevaluation of Causative Factors. Rangel. Ecol. Manag. 2019, 72, 988–995. [Google Scholar] [CrossRef]
  82. Liu, Y.; Liu, S.; Sun, Y.; Li, M.; An, Y.; Shi, F. Spatial differentiation of the NPP and NDVI and its influencing factors vary with grassland type on the Qinghai-Tibet Plateau. Environ. Monit. Assess. 2021, 193, 48. [Google Scholar] [CrossRef]
  83. Zhang, W.; Ganjurjav, H.; Liang, Y.; Gao, Q.; Wan, Y.; Li, Y.; Baima, Y.; Xirao, Z. Effect of a grazing ban on restoring the degraded alpine meadows of Northern Tibet, China. Rangel. J. 2015, 37, 89–95. [Google Scholar] [CrossRef]
  84. Fayiah, M.; Dong, S.; Li, Y.; Xu, Y.; Gao, X.; Li, S.; Shen, H.; Xiao, J.; Yang, Y.; Wessell, K. The relationships between plant diversity, plant cover, plant biomass and soil fertility vary with grassland type on Qinghai-Tibetan Plateau. Agric. Ecosyst. Environ. 2019, 286, 106659. [Google Scholar] [CrossRef]
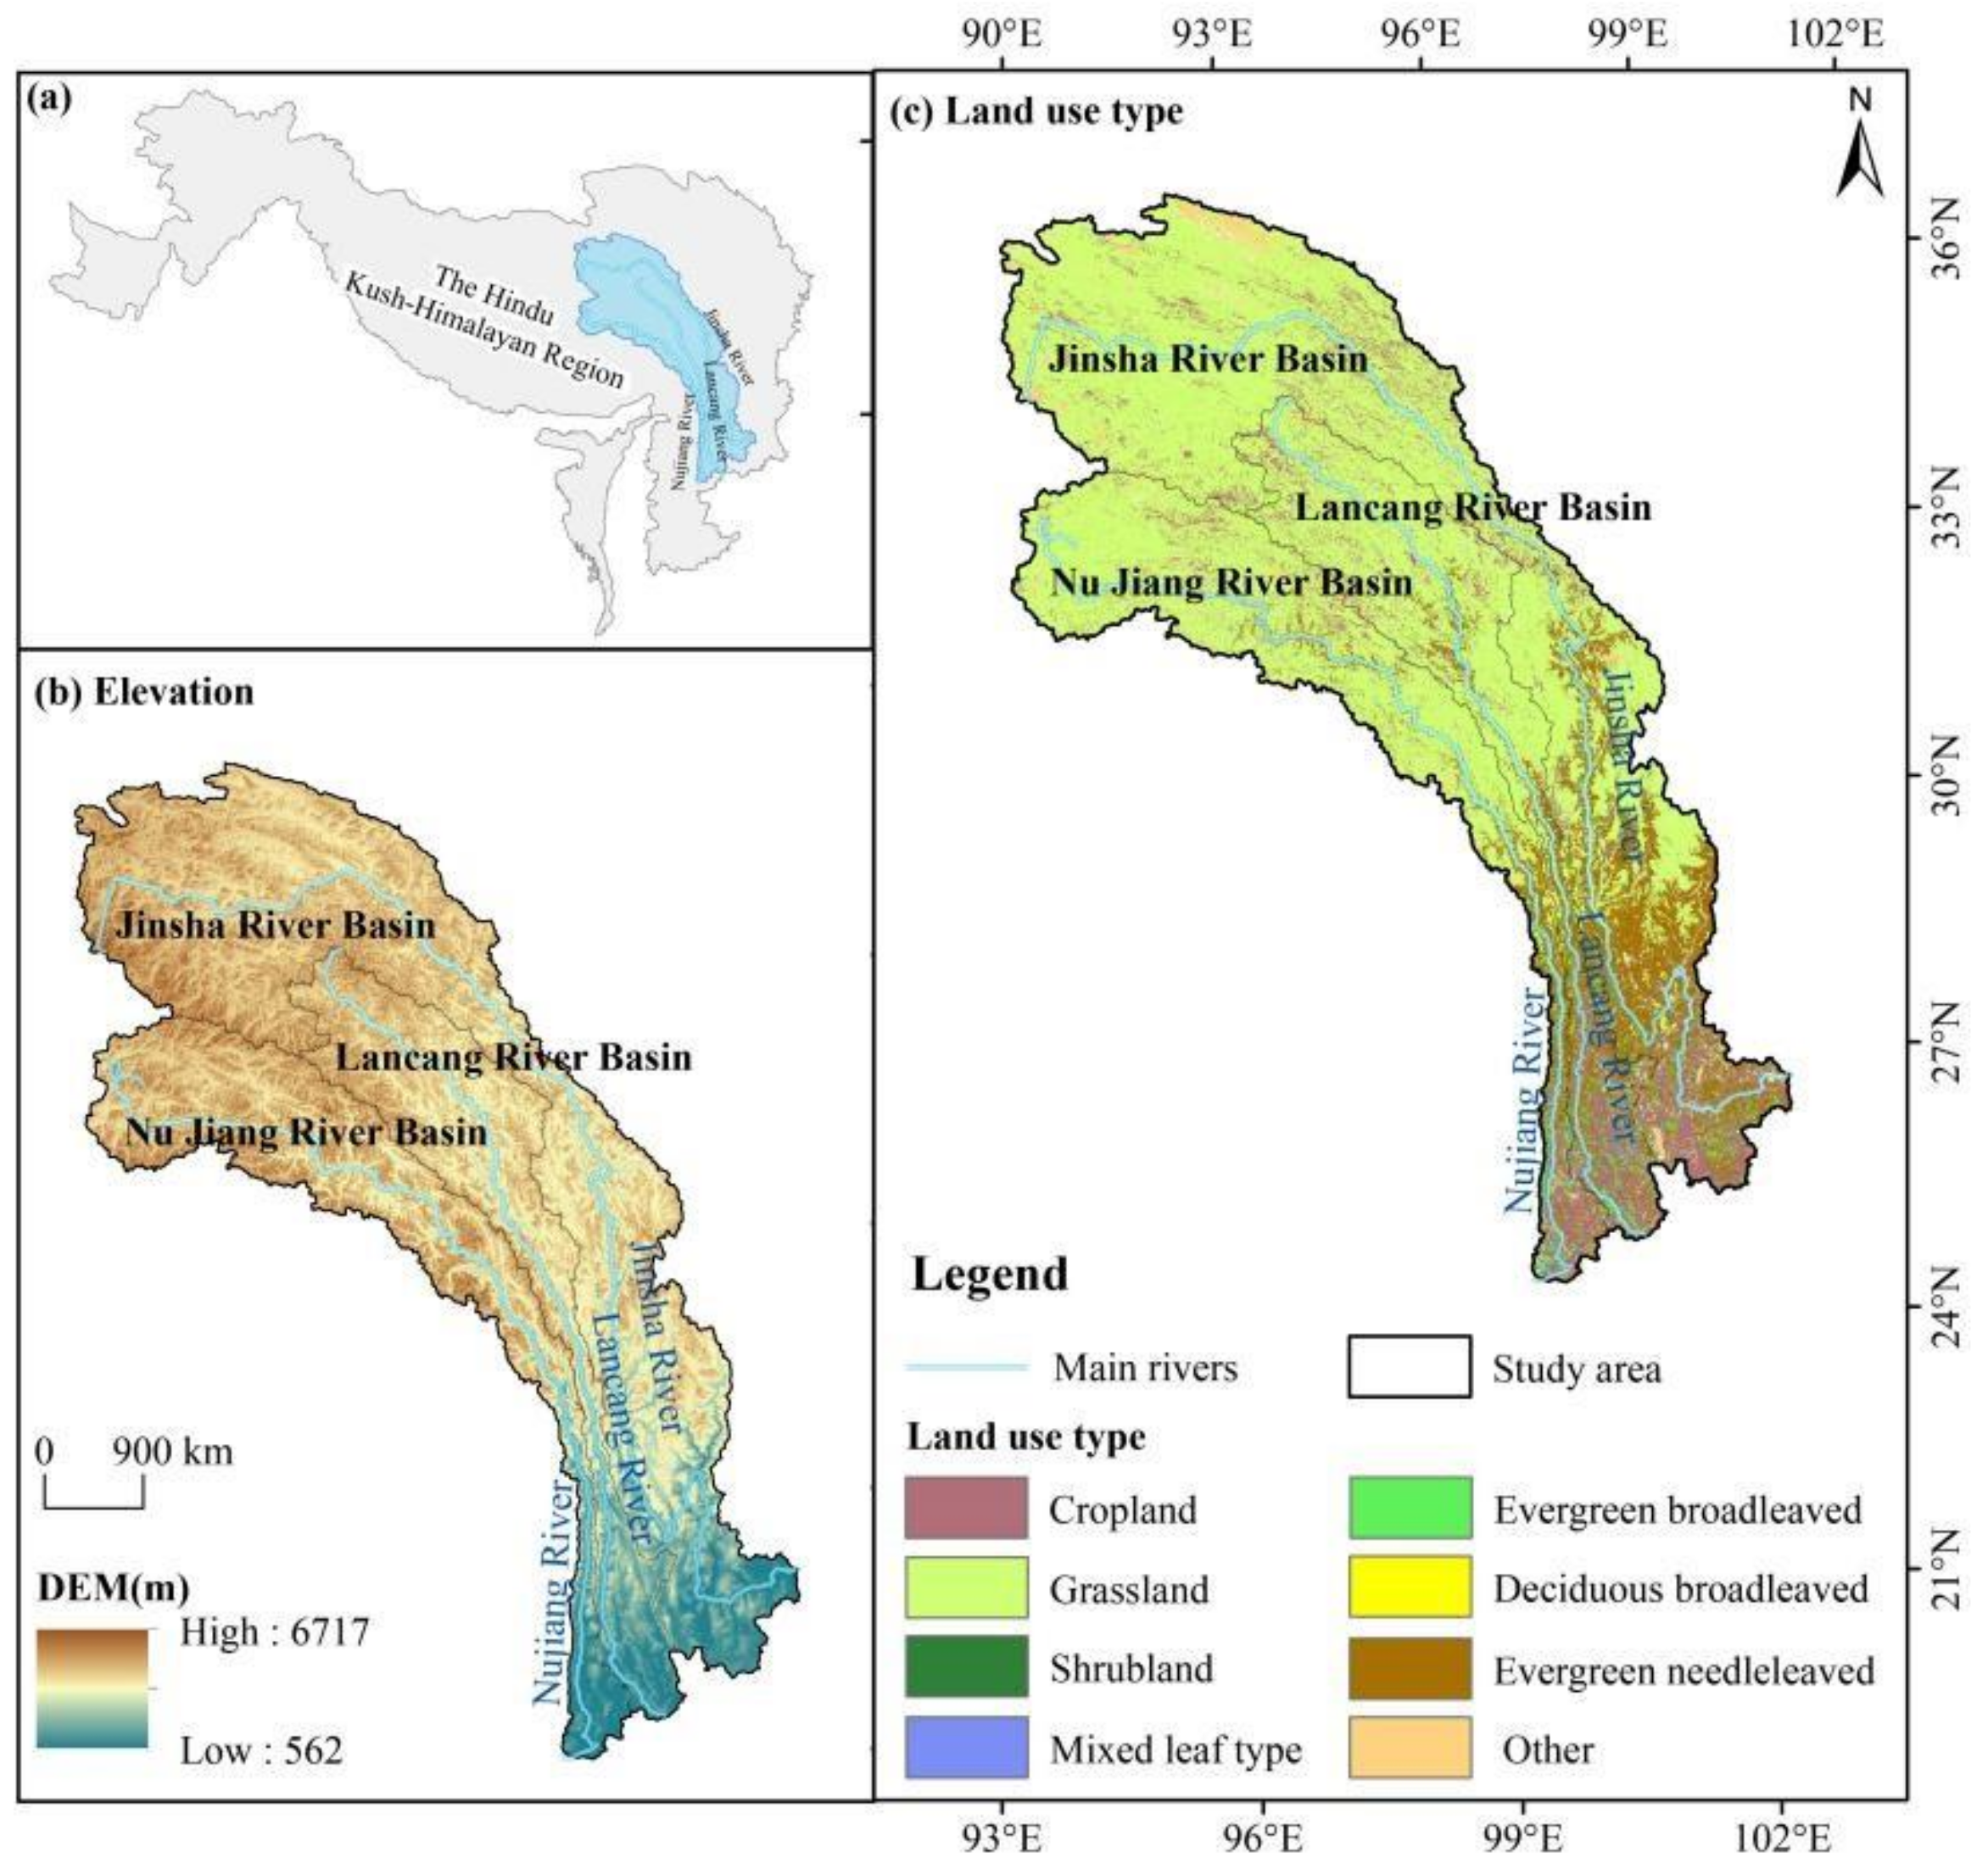
Figure 1. The location elevation and vegetation type maps of the study area. (a) the location of TPRR at the eastern part of Hindu-Kush-Himalayan Region; (b) Elevation gradients across the TPRR; (c) the vegetation types of TPRR.
Remotesensing 14 00151 g001
Figure 2. The hierarchical spatial distribution of topographic factors in the study area. (a) elevation gradients, (b) slope distribution, and (c) aspect classification across the TPRR.
Remotesensing 14 00151 g002
Figure 3. Conceptual framework of study design.
Remotesensing 14 00151 g003
Figure 4. Inter-annual variation and Mann-Kendall test of NDVI in the basin from 2000 to 2019. (ad) represent inter-annual NDVI variations in the TPRR and its sub-basins (Nujiang, Lancang and Jinsha river basins, respectively), while (eh) represent the M-K results of them.
Remotesensing 14 00151 g004
Figure 5. Area statistics of multi-year mean NDVI for topography factors during 2000–2019.
Remotesensing 14 00151 g005
Figure 6. Spatial distribution of (a) NDVI trends and (b) significance during 2000–2019.
Remotesensing 14 00151 g006
Figure 7. NDVI trends area statistics for different topography factors from 2000 to 2019. (ac) represent elevation, slope and aspect, respectively.
Remotesensing 14 00151 g007
Figure 8. Spatial distribution maps of regression coefficients and significances for all independent variables. (ac) are the spatial distribution maps of the local regression coefficients and the significances for all independent variables, e.g., (a) elevation, (b) slope and (c) aspect respectively.
Remotesensing 14 00151 g008
Table 1. Parameter estimation and test results of the GWR model.
VariableMeanMinMaxLwr QuartileMedianUpr QuartileSD
DEM−1.13−20.6610. 52−1.97−0.160.002.98
Slope21.67−580.16824. 38−0.001.1530.0881.37
Aspect0.04−11.0510. 54−0.550.000.532.35
Publisher’s Note: MDPI stays neutral with regard to jurisdictional claims in published maps and institutional affiliations.