
Developing Multi-Source Indices to Discriminate between Native Tropical Forests, Oil Palm and Rubber Plantations in Indonesia


Abstract
:1. Introduction
2. Materials and Methods
2.1. Study Area
2.2. Satellite Data and Pre-Processing
- Landsat-8
- Sentinel-1
2.3. Field Data and Training Sample Collection
2.4. Methodological Framework
2.5. Forest/Non-Forest Map from Landsat
2.6. Discrimination of Oil Palm Plantation from Native Forest
2.7. Discrimination of Rubber Plantation from Native Forest
2.8. Accuracy Assessment
3. Results
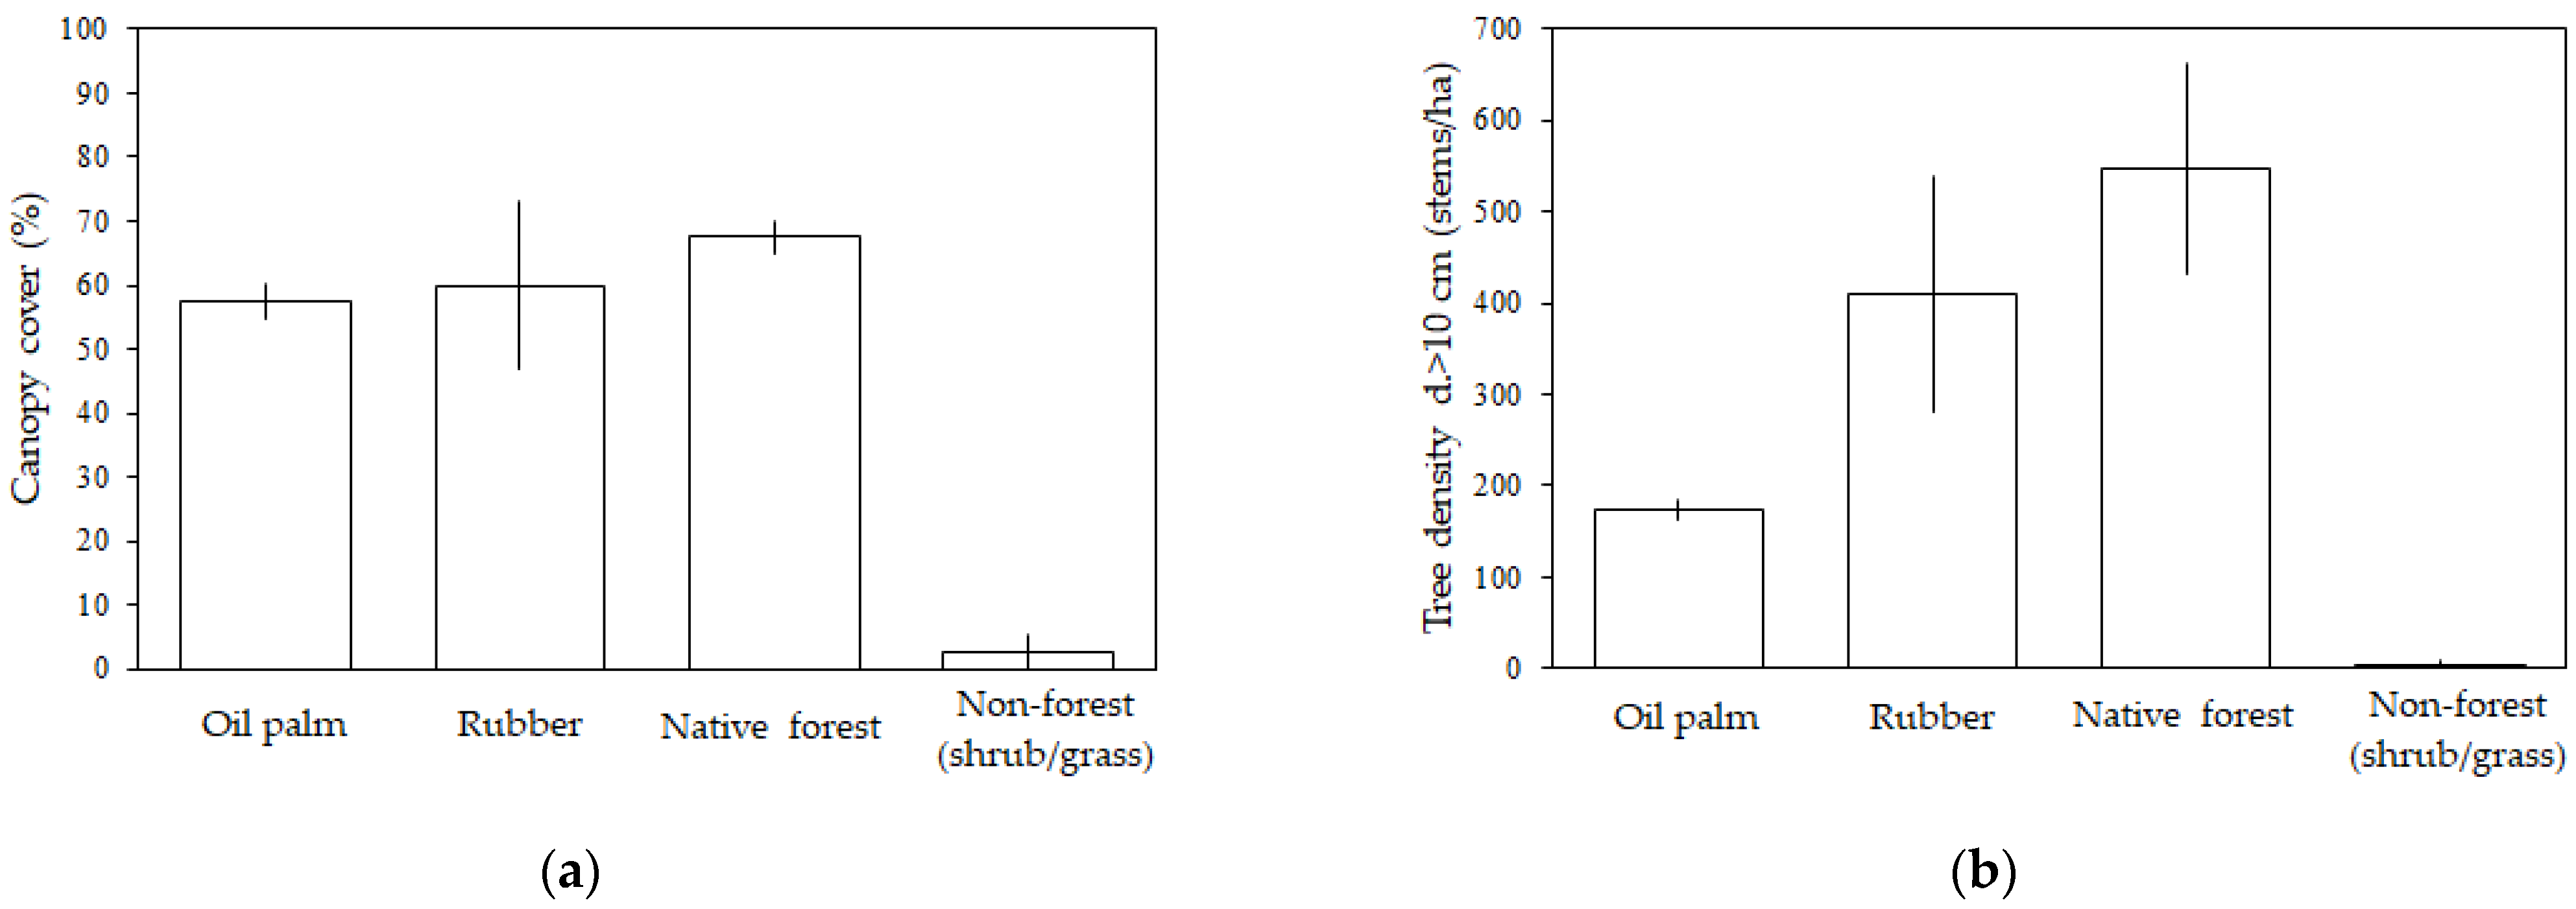
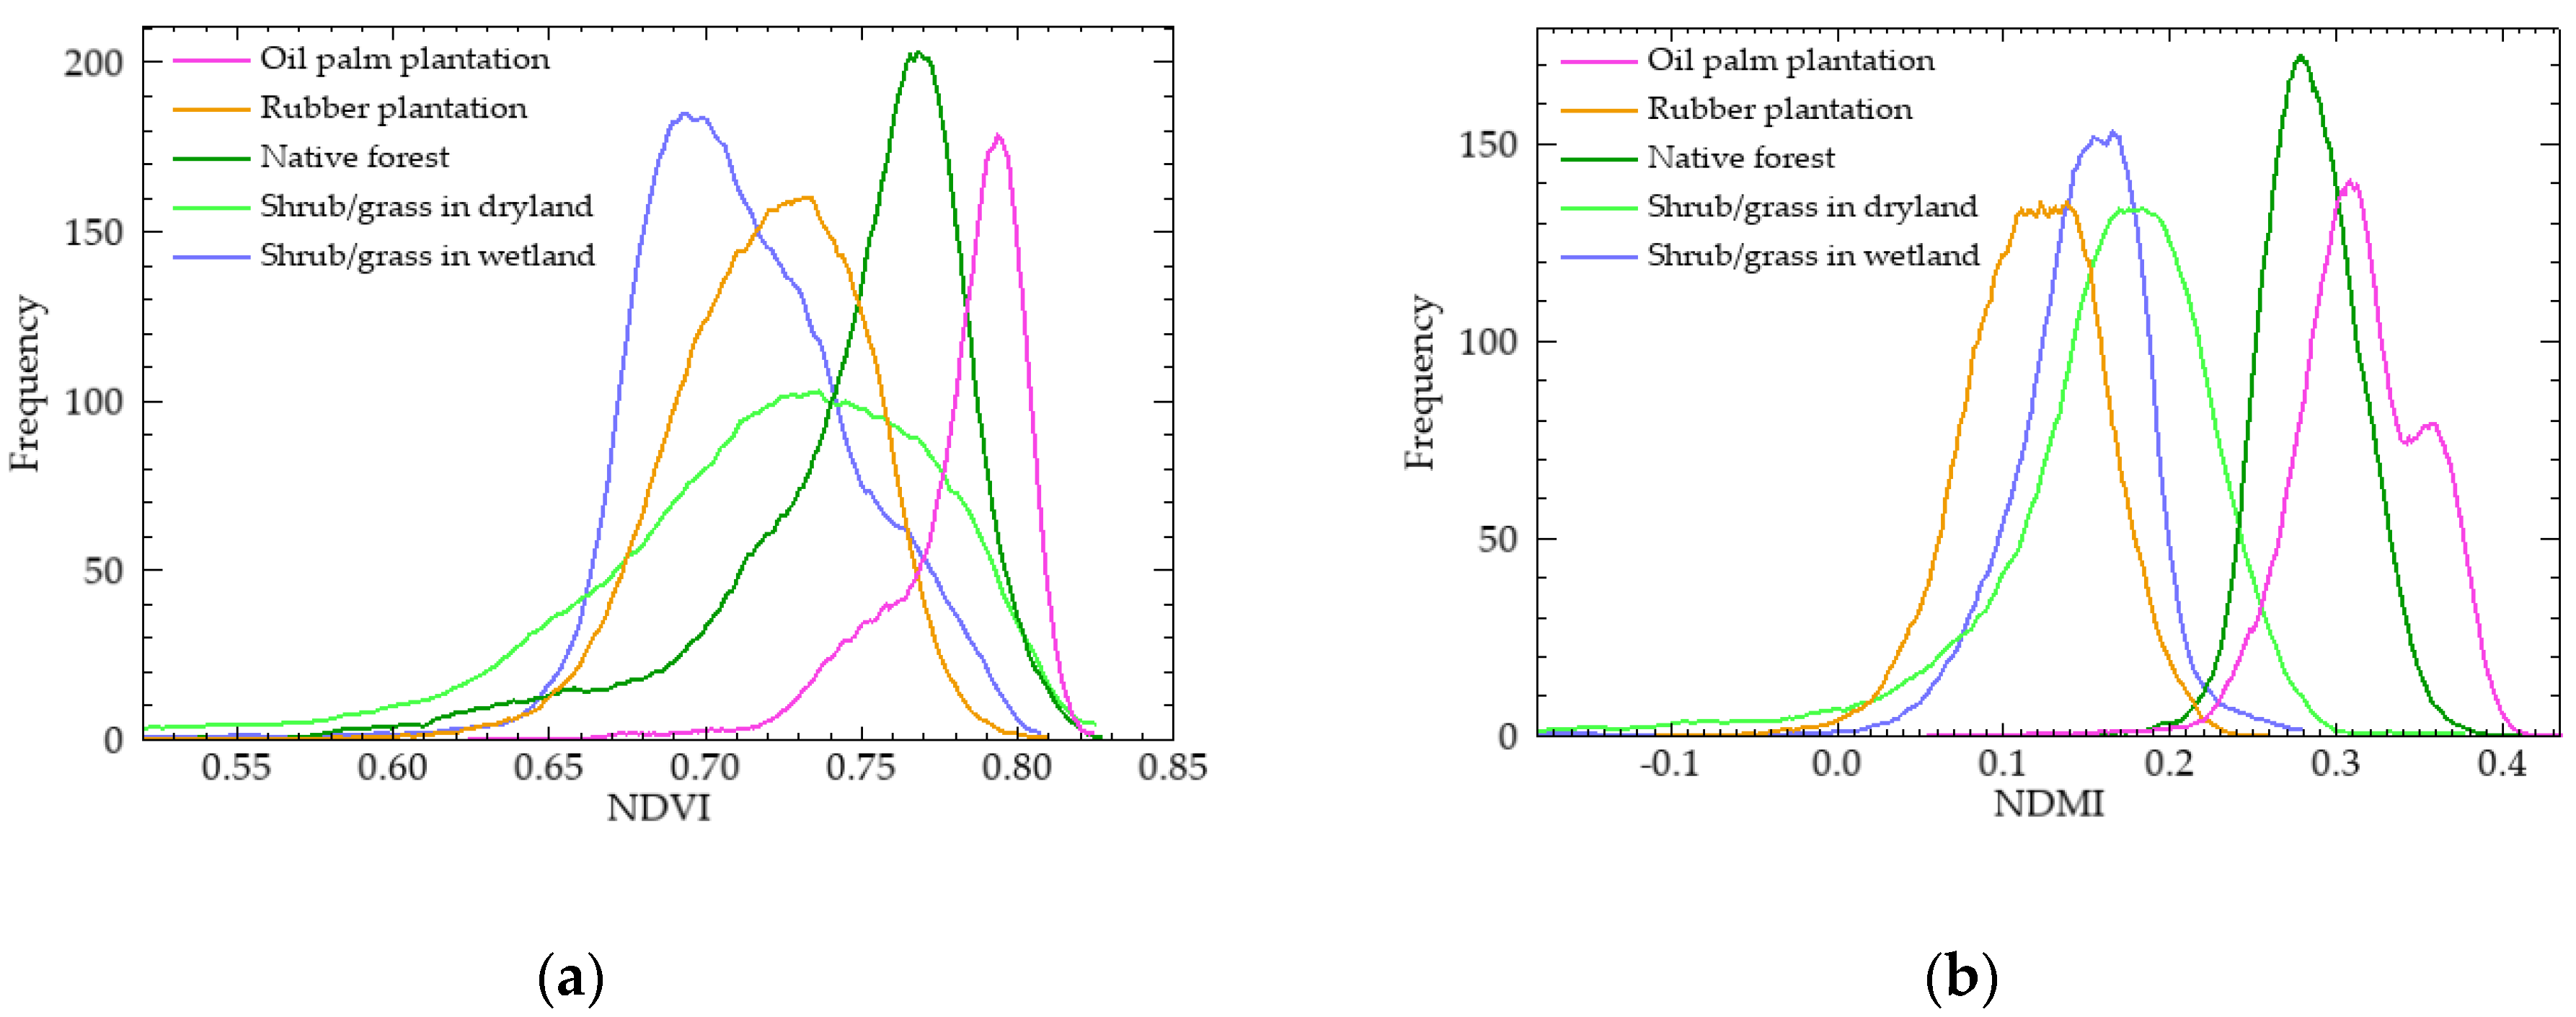
3.1. Field Results
3.2. Algorithm for Mapping Oil Palm Plantation
3.3. Algorithm for Mapping Rubber Plantation
3.4. Land Cover Map and Validation
4. Discussion
5. Conclusions
Author Contributions
Funding
Institutional Review Board Statement
Informed Consent Statement
Data Availability Statement
Acknowledgments
Conflicts of Interest
References
- FAO. FAOSTAT. Available online: http://www.fao.org/faostat/en/#data (accessed on 6 June 2021).
- Austin, K.G.; Schwantes, A.; Gu, Y.F.; Kasibhatla, P.S. What causes deforestation in Indonesia? Environ. Res. Lett. 2019, 14, 9. [Google Scholar] [CrossRef]
- Ocampo-Peñuela, N.; Garcia-Ulloa, J.; Kornecki, I.; Philipson, C.D.; Ghazoul, J. Impacts of four decades of forest loss on vertebrate functional habitat on Borneo. Front. For. Glob. Chang. 2020, 3, 53. [Google Scholar] [CrossRef]
- Carlson, K.M.; Curran, L.M.; Ratnasari, D.; Pittman, A.M.; Soares-Filho, B.S.; Asner, G.P.; Trigg, S.N.; Gaveau, D.A.; Lawrence, D.; Rodrigues, H.O. Committed carbon emissions, deforestation, and community land conversion from oil palm plantation expansion in West Kalimantan, Indonesia. Proc. Natl. Acad. Sci. USA 2012, 109, 7559. [Google Scholar] [CrossRef] [Green Version]
- Ustin, S.L. Remote Sensing for Natural Resource Management and Environmental Monitoring; John Wiley: New York, NY, USA, 2004; pp. 1–729. [Google Scholar]
- Vancutsem, C.; Achard, F.; Pekel, J.F.; Vieilledent, G.; Carboni, S.; Simonetti, D.; Gallego, J.; Aragão, L.E.O.C.; Nasi, R. Long-term (1990–2019) monitoring of forest cover changes in the humid tropics. Sci. Adv. 2021, 7, eabe1603. [Google Scholar] [CrossRef]
- Caccetta, P.; Furby, S.; Wallace, J.; Wu, X.; Richards, G.; Waterworth, R. Long-term monitoring of Australian land cover change using Landsat data: Development, implementation, and operation. In Global Forest Monitoring from Earth Observation; Achard, F., Hansen, M.C., Eds.; Taylor & Francis: New York, NY, USA, 2013. [Google Scholar] [CrossRef]
- Hansen, M.C.; Potapov, P.V.; Moore, R.; Hancher, M.; Turubanova, S.; Tyukavina, A.; Thau, D.; Stehman, S.V.; Goetz, S.J.; Loveland, T.R. High-resolution global maps of 21st-century forest cover change. Science 2013, 342, 850–853. [Google Scholar] [CrossRef] [PubMed] [Green Version]
- Margono, B.A.; Usman, A.B.; Sugardiman, R.A. Indonesia’s forest resource monitoring. Indones. J. Geogr. 2016, 48, 7–20. [Google Scholar] [CrossRef]
- LAPAN. The Remote Sensing Monitoring Program of Indonesia’s National Carbon Accounting System: Methodology and Products, Version 1; LAPAN-IAFCP: Jakarta, Indonesia, 2014; pp. 15–78. Available online: http://incas.menlhk.go.id/methodology/incas-standard-method-forest-cover-change/ (accessed on 4 January 2019).
- Directorate General of Climate Change, Ministry of Environment and Forestry. National Forest Reference Emission Level for Deforestation and Forest Degradation: In the Context of Decision 1/CP.16 Para 70 UNFCCC (Encourages Developing Country Parties to Contribute to Mitigation Actions in the Forest Sector); Ministry of Environment and Forestry: Jakarta, Indonesia, 2016; pp. 6–7. Available online: https://redd.unfccc.int/files/frel_submission_by__indonesia_final.pdf (accessed on 26 April 2020).
- Tropek, R.; Sedláček, O.; Beck, J.; Keil, P.; Musilová, Z.; Šímová, I.; Storch, D. Comment on “High-resolution global maps of 21st-century forest cover change”. Science 2014, 344, 981. [Google Scholar] [CrossRef] [Green Version]
- Kustiyo, K.; Roswintiarti, O.; Tjahjaningsih, A.; Dewanti, R.; Furby, S.; Wallace, J. Annual forest monitoring as part of the Indonesia’s National Carbon Accounting System. Int. Arch. Photogramm. Remote Sens. Spat. Inf. Sci. 2015, 40–47, 441. [Google Scholar] [CrossRef] [Green Version]
- Torbick, N.; Ledoux, L.; Salas, W.; Zhao, M. Regional mapping of plantation extent using multisensor imagery. Remote Sens. 2016, 8, 236. [Google Scholar] [CrossRef] [Green Version]
- Asner, G.P. Cloud cover in Landsat observations of the Brazilian Amazon. Int. J. Remote Sens. 2001, 22, 3855–3862. [Google Scholar] [CrossRef]
- Ministry of Environment and Forestry, Republic of Indonesia. The State of Indonesia’s Forests 2018; Ministry of Environment and Forestry, Republic of Indonesia: Jakarta, Indonesia, 2018; p. 10. Available online: https://www.menlhk.go.id/site/download?start=10 (accessed on 14 May 2019).
- Tarko, A.; Tsendbazar, N.-E.; De Bruin, S.; Bregt, A.K. Producing consistent visually interpreted land cover reference data: Learning from feedback. Int. J. Digit. Earth 2021, 14, 52–70. [Google Scholar] [CrossRef]
- DeFries, R.; Achard, F.; Brown, S.; Herold, M.; Murdiyarso, D.; Schlamadinger, B.; De Souza, C. Earth observations for esti-mating greenhouse gas emissions from deforestation in developing countries. Environ. Sci. Policy 2007, 10, 385–394. [Google Scholar] [CrossRef]
- Hoekman, D.H. Radar backscattering of forest stands. Int. J. Remote Sens. 1985, 6, 325–343. [Google Scholar] [CrossRef]
- Oon, A.; Ngo, K.D.; Azhar, R.; Ashton-Butt, A.; Lechner, A.M.; Azhar, B. Assessment of ALOS-2 PALSAR-2 L-band and Sentinel-1 C-band SAR backscatter for discriminating between large-scale oil palm plantations and smallholdings on tropical peatlands. Remote Sens. Appl. Soc. Environ. 2019, 13, 183–190. [Google Scholar] [CrossRef]
- Shimada, M.; Itoh, T.; Motooka, T.; Watanabe, M.; Shiraishi, T.; Thapa, R.; Lucas, R. New global forest/non-forest maps from ALOS PALSAR data (2007–2010). Remote Sens. Environ. 2014, 155, 13–31. [Google Scholar] [CrossRef]
- Lehmann, E.A.; Caccetta, P.A.; Lowell, K.; Mitchell, A.; Zhou, Z.S.; Held, A.; Milne, T.; Tapley, I. SAR and optical remote sensing: Assessment of complementarity and interoperability in the context of a large-scale operational forest monitoring sys-tem. Remote Sens. Environ. 2015, 156, 335–348. [Google Scholar] [CrossRef]
- Miettinen, J.; Liew, S.C.; Kwoh, L.K. In Usability of Sentinel-1 dual polarization C-band data for plantation detection in insular Southeast Asia. In Proceedings of the 36th Asian Conference on Remote Sensing (ACRS2015), Quezon City, Philippines, 24–28 October 2015. [Google Scholar]
- Miettinen, J.; Liew, S.C. Separability of Insular Southeast Asian woody plantation species in the 50 m resolution ALOS PALSAR mosaic product. Remote Sens. Lett. 2011, 2, 299–307. [Google Scholar] [CrossRef]
- Dong, J.; Xiao, X.; Sheldon, S.; Biradar, C.; Xie, G. Mapping tropical forests and rubber plantations in complex landscapes by integrating PALSAR and MODIS imagery. ISPRS J. Photogramm. Remote Sens. 2012, 74, 20–33. [Google Scholar] [CrossRef]
- Guido, C.; Barry, N.H. Supervised machine learning of fused radar and optical data for land cover classification. J. Appl. Remote Sens. 2012, 6, 063597. [Google Scholar] [CrossRef]
- Tsujino, R.; Yumoto, T.; Kitamura, S.; Djamaluddin, I.; Darnaedi, D. History of forest loss and degradation in Indonesia. Land Use Pol. 2016, 57, 335–347. [Google Scholar] [CrossRef]
- Gaveau, D.L.A.; Locatelli, B.; Salim, M.A.; Yaen, H.; Pacheco, P.; Sheil, D. Rise and fall of forest loss and industrial plantations in Borneo (2000–2017). Conserv. Lett. 2018, 12, e12622. [Google Scholar] [CrossRef]
- Directorate General of Estate Crops, Ministry of Agriculture. Tree Crop Estate Statistics of Indonesia: Palm Oil 2017–2019; Di-rectorate General of Estate Crops, Ministry of Agriculture: South Jakarta, Indonesia, 2018. Available online: https://drive.google.com/file/d/1rlmMNUbPM99DA-Ywo-Prv3cmPnWoFUUp/view (accessed on 23 May 2020).
- Directorate General of Estate Crops, Ministry of Agriculture. Tree Crop Estate Statistics of Indonesia: Rubber 2017–2019; Di-rectorate General of Estate Crops, Ministry of Agriculture: South Jakarta, Indonesia, 2018. Available online: https://drive.google.com/file/d/1hF-ilorfxR8Hx5wxroRWOBpKoNzOlLBL/view (accessed on 23 May 2020).
- Sari, I.L.; Weston, C.J.; Newnham, G.J.; Volkova, L. Assessing accuracy of land cover change maps derived from automated digital processing and visual interpretation in tropical forests in Indonesia. Remote Sens. 2021, 13, 1446. [Google Scholar] [CrossRef]
- Penman, J.; Gytarsky, M.; Hiraishi, T.; Krug, T.; Kruger, D.; Pipatti, R.; Buendia, L.; Miwa, K.; Ngara, T.; Tanabe, K. Good Practice Guidance for Land Use, Land-Use Change and Forestry; Institute for Global Environmental Strategies (IGES): Hayama, Kanagawa, Japan, 2003. Available online: https://www.ipcc.ch/site/assets/uploads/2018/03/GPG_LULUCF_FULLEN.pdf (accessed on 9 January 2021).
- Division of Integrated Data Processing Integration and Statistical Disemination, BPS-Statistics of Kalimantan Tengah Province. Provinsi Kalimantan Tengah Dalam Angka 2018 (Kalimantan Tengah Province in Figures 2018); BPS-Statistics of Kalimantan Tengah Province: Palangka Raya, Indonesia, 2018; Volume 10, pp. 326–327. Available online: https://kalteng.bps.go.id/publication/2018/08/16/ceed046d35684aefde786f04/provinsi-kalimantan-tengah-dalam-angka-2018.html (accessed on 23 May 2020).
- Division of Integrated Data Processing Integration and Statistical Disemination, BPS-Statistics of Kalimantan Timur Province. Provinsi Kalimantan Timur Dalam Angka 2018 (Kalimantan Timur Province in Figures 2018); BPS-Statistics of Kalimantan Timur Province: Samarinda, Indonesia, 2018; Volume 9, pp. 249–250. Available online: https://kaltim.bps.go.id/publication/2018/08/16/9341dae4a1306ccfee98a393/provinsi-kalimantan-timur-dalam-angka-2018.html (accessed on 23 May 2020).
- Division of Integrated Data Processing Integration and Statistical Disemination, BPS-Statistics of Kalimantan Selatan Province. Provinsi Kalimantan Selatan Dalam Angka 2018 (Kalimantan Selatan Province in Figures 2018); BPS-Statistics of Kalimantan Selatan Province: Banjarbaru, Indonesia, 2018; Volume 7, pp. 230–231. Available online: https://kalsel.bps.go.id/publication/2018/08/16/f646d3011e4c3dfb0a4cbd74/provinsi-kalimantan-selatan-dalam-angka-2018.html (accessed on 23 May 2020).
- Sidiyasa, K. Tree diversity in the rain forest of Kalimantan. In Proceedings of the Balance between Biodiversity Conservation and Sus-Tainable Use of Tropical Rain Forest, Wageningen, The Netherlands, 2001; pp. 69–78. Available online: https://www.tropenbos.org/resources/publications/tree+diversity+in+the+rain+forest+of+kalimantan (accessed on 28 May 2019).
- Mackinnon, K.; Hatta, G.; Halim, H.; Mangalik, A. The Ecology of Kalimantan; Periplus Editions (HK) Ltd.: Hong Kong, 1996; pp. 175–310. [Google Scholar]
- Ngatiman, N.; Saridan, A. Ekplorasi jenis-jenis Dipterokarpa di Kabupaten Paser, Kalimantan Timur (Exploration of Dipter-ocarps species in Paser Regency, East Kalimantan). J. Penelit. Ekosist. Dipterokarpa 2012, 6, 1–10. [Google Scholar] [CrossRef] [Green Version]
- Corley, R.H.V.; Tinker, P.B. The Oil Palm; Wiley-Blackwell: West Sussex, UK, 2016; pp. 53–134. [Google Scholar]
- Phuc, T.X.; Nghi, T.H. Rubber Expansion and Forest Protection in Vietnam; Tropenbos International Viet Nam: Hue, Vietnam, 2014; Available online: https://www.tropenbos.org/resources/publications/rubber+expansion+and+forest+protection+in+vietnam (accessed on 28 May 2019).
- World Agroforestry. Agroforestree Database. Available online: http://apps.worldagroforestry.org/treedb/AFTPDFS/Hevea_brasiliensis.PDF (accessed on 12 July 2021).
- Setyawati, T.; Narulita, S.; Bahri, I.P.; Raharjo, G.T. A Guide Book to Invasive Plant Species in Indonesia; Research, Development and Innovation Agency, Ministry of Environment and Forestry Republic of Indonesia: Bogor, Indonesia, 2015; pp. 17, 159, 207. Available online: http://ksdae.menlhk.go.id/assets/publikasi/A_Guide_Book_of_Invasive_Plant_Species_in_Indonesia.pdf (accessed on 10 August 2021).
- Tamai, Y.; Sandan, P.; Gaman, S.; Prawira, Y. Ethnic plant resources in Central Kalimantan. In Tropical Peatland Ecosystems; Osaki, M., Tsuji, N., Eds.; Springer: Tokyo, Japan, 2016. [Google Scholar] [CrossRef]
- Barker, P.C.J. A Technical Manual for Vegetation Monitoring/Phil Barker; Resource Management and Conservation, Department of Primary Industries, Water and Environment: Hobart, TAS, Australia, 2001.
- Mueller-Dombois, D.; Bridges, K.W.; Deahler, C. Biodiversity Assessment of Tropical Island Ecosystems, PABITRA Manual for Interactive Ecology and Management; Bishop Museum Press: Honolulu, HI, USA, 2008; pp. 17–48. [Google Scholar]
- Schomaker, M.E.; Zarnoch, S.J.; Bechtold, W.A.; Latelle, D.J.; Burkman, W.G.; Cox, S.M. Crown-Condition Classification: A Guide to Data Collection and Analysis; General Technical Report SRS-102; USDA Forest Services: Washington, DC, USA, 2007. [CrossRef]
- Kvamme, C.D. A Comparison of Ground Cover and Frequency Estimation Methods for Post-Harvest Soil Monitoring. Master’s Thesis, Michigan Technological University, Houghton, MI, USA, 2010. Available online: https://digitalcommons.mtu.edu/cgi/viewcontent.cgi?article=1142&context=etds (accessed on 23 April 2021).
- Haglöf, A.B. Users Guide Vertex III and Transponder T3; Haglöf Sweden, AB: Långsele, Sweden, 2002. [Google Scholar]
- Friedl, M.A.; Brodley, C.E. Decision Tree classification of land cover from remotely sensed data. Remote Sens. Environ. 1997, 61, 399–409. [Google Scholar] [CrossRef]
- Li, L.; Dong, J.; Njeudeng Tenku, S.; Xiao, X. Mapping oil palm plantations in Cameroon using PALSAR 50-m orthorectified mosaic images. Remote Sens. 2015, 7, 1206–1224. [Google Scholar] [CrossRef] [Green Version]
- Simard, M.; Saatchi, S.S.; Grandi, G.D. The use of decision tree and multiscale texture for classification of JERS-1 SAR data over tropical forest. IEEE Trans. Geosci. Remote. Sens. 2000, 38, 2310–2321. [Google Scholar] [CrossRef] [Green Version]
- Haralick, R.M.; Shanmugam, K.; Dinstein, I. Textural features for image classification. IEEE Trans. Syst. Man Cybern. 1973, SMC-3, 610–621. [Google Scholar] [CrossRef] [Green Version]
- Zhang, C.; Huang, C.; Li, H.; Liu, Q.; Li, J.; Bridhikitti, A.; Liu, G. Effect of textural features in remote sensed data on rubber plantation extraction at different levels of spatial resolution. Forests 2020, 11, 399. [Google Scholar] [CrossRef] [Green Version]
- Kuffer, M.; Sliuzas, R.; Pfeffer, K.; Baud, I. The utility of the co-occurrence matrix to extract slum areas from VHR imagery. In Proceedings of the 2015 Joint Urban Remote Sensing Event (JURSE), Lausanne, Switzerland, 30 March–1 April 2015; pp. 1–4. [Google Scholar]
- Baraldi, A.; Panniggiani, F. An investigation of the textural characteristics associated with Gray Level Cooccurrence Matrix statistical parameters. IEEE Trans. Geosci. Remote Sens. 1995, 33, 293–304. [Google Scholar] [CrossRef]
- Jensen, J.R. Introductory Digital Image Processing: A Remote Sensing Perspective, 3rd ed.; Prentice Hall: Upper Saddle River, NJ, USA, 2005; pp. 364–370. [Google Scholar]
- Congedo, L. Semi-Automatic Classification Plugin: A Python tool for the download and processing of remote sensing images in QGIS. J. Open Source Softw. 2021, 6, 3172. [Google Scholar] [CrossRef]
- Razak, J.A.B.A.; Shariff, A.R.B.; Ahmad, N.; Sameen, M.I. Mapping rubber trees based on phenological analysis of Landsat time series data-sets. Geocarto Int. 2018, 33, 627–650. [Google Scholar] [CrossRef]
- Xiao, C.; Li, P.; Feng, Z. How did deciduous rubber plantations expand spatially in China’s Xishuangbanna Dai Autonomous Prefecture during 1991-2016? Photogramm. Eng. Remote 2019, 85, 687–697. [Google Scholar] [CrossRef]
- Beckschäfer, P. Obtaining rubber plantation age information from very dense Landsat TM & ETM+ time series data and pix-el-based image compositing. Remote Sens. Environ. 2017, 196, 89–100. [Google Scholar] [CrossRef]
- Senf, C.; Pflugmacher, D.; Van der Linden, S.; Hostert, P. Mapping rubber plantations and natural forests in Xishuangbanna (Southwest China) using Multi-Spectral Phenological Metrics from MODIS Time Series. Remote Sens. 2013, 5, 2795–2812. [Google Scholar] [CrossRef] [Green Version]
- Olofsson, P.; Foody, G.M.; Herold, M.; Stehman, S.V.; Woodcock, C.E.; Wulder, M.A. Good practices for estimating area and assessing accuracy of land change. Remote Sens. Environ. 2014, 148, 42–57. [Google Scholar] [CrossRef]
- Anderson, J.R. A Land Use and Land Cover Classification System for Use with Remote Sensor Data; Geological Survey Professional Paper No. 964; US Government Printing Office: Washington, DC, USA, 1976.
- Karsidi, A.; Geospatial Information Agency of Indonesia. Peraturan Kepala Badan Informasi Geospasial Nomor 15 Tahun 2014 Ten-Tang Pedoman Teknis Ketelitian Peta Dasar (Head of Geospatial Information Agency: Technical Guidelines to Determine the Accuracy of the Base Map Number 15 Year 2014); Geospatial Information Agency of Indonesia: Cibinong, Indonesia, 2014; p. 15. Available online: https://jdih.big.go.id/media/resources/files/law/tUF25Yj2xW_Perka_Ketelitian_Peta_Dasar_-_Salinan.pdf (accessed on 12 July 2021).
- Rosenqvist, Å. Evaluation of JERS-1, ERS-1 and Almaz SAR backscatter for rubber and oil palm stands in West Malaysia. Int. J. Remote Sens. 1996, 17, 3219–3231. [Google Scholar] [CrossRef]
- CEOS–Committee on Earth Observation Satellites. A Layman’s Interpretation to L-Band and C-Band Synthetic Aperture Radar Data. Available online: https://ceos.org/document_management/SEO/DataCube/Laymans_SAR_Interpretation_Guide_2.0.pdf (accessed on 11 June 2021).
- Hoekman, D.H.; Vissers, M.A.M.; Wielaard, N. PALSAR wide-area mapping of Borneo: Methodology and map validation. IEEE J. Sel. Top. Appl. Earth Observ. Remote Sens. 2010, 3, 605–617. [Google Scholar] [CrossRef]
- Xiao, C.; Li, P.; Feng, Z.; Liu, X. An updated delineation of stand ages of deciduous rubber plantations during 1987–2018 using Landsat-derived bi-temporal thresholds method in an anti-chronological strategy. Int. J. Appl. Earth Obs.-Vation Geoinf. 2019, 76, 40–50. [Google Scholar] [CrossRef]
- Huete, A.R.; Liu, H.Q.; Batchily, K.; van Leeuwen, W. A comparison of vegetation indices over a global set of TM images for EOS-MODIS. Remote Sens. Environ. 1997, 59, 440–451. [Google Scholar] [CrossRef]
- Grogan, K.; Pflugmacher, D.; Hostert, P.; Kennedy, R.; Fensholt, R. Cross-border forest disturbance and the role of natural rubber in mainland Southeast Asia using annual Landsat time series. Remote Sens. Environ. 2015, 169, 438–453. [Google Scholar] [CrossRef]
- Li, P.; Zhang, J.H.; Feng, Z.M. Mapping rubber tree plantations using a Landsat-based phenological algorithm in Xishuang-banna, Southwest China. Remote Sens. Lett. 2015, 6, 49–58. [Google Scholar] [CrossRef]
- Nurulita, Y.; Adetutu, E.M.; Kadali, K.K.; Zul, D.; Mansur, A.A.; Ball, A.S. The assessment of the impact of oil palm and rubber plantations on the biotic and abiotic properties of tropical peat swamp soil in Indonesia. Int. J. Agric. Sustain. 2015, 13, 150–166. [Google Scholar] [CrossRef]
- Gao, B.C. NDWI—A normalized difference water index for remote sensing of vegetation liquid water from space. Remote Sens. Environ. 1996, 58, 257–266. [Google Scholar] [CrossRef]
- Helmer, E.H.; Brown, S.; Cohen, W.B. Mapping montane tropical forest successional stage and land use with multi-date Landsat imagery. Int. J. Remote Sens. 2000, 21, 2163–2183. [Google Scholar] [CrossRef]
- Sánchez-Azofeifa, G.A.; Castro, K.L.; Rivard, B.; Kalascka, M.R. Remote sensing research priorities in tropical dry forest en-vironments. Biotropica 2003, 35, 134–142. [Google Scholar] [CrossRef]
- Zhongchang, S.; Patrick, L.; Huadong, G.; Chong, H.; Claudia, K. Extracting distribution and expansion of rubber plantations from Landsat imagery using the C5.0 decision tree method. J. Appl. Remote Sens. 2017, 11, 026011. [Google Scholar] [CrossRef] [Green Version]
- Symeonakis, E.; Caccetta, P.A.; Koukoulas, S.; Furby, S.; Karathanasis, N. Multi-temporal land-cover classification and change analysis with conditional probability networks: The case of Lesvos Island (Greece). Int. J. Remote Sens. 2012, 33, 4075–4093. [Google Scholar] [CrossRef]
- Reiche, J.; De Bruin, S.; Hoekman, D.; Verbesselt, J.; Herold, M. A Bayesian approach to combine Landsat and ALOS PALSAR time series for Near Real-Time deforestation detection. Remote Sens. 2015, 7, 4973–4996. [Google Scholar] [CrossRef] [Green Version]


| Landsat-8 | Sentinel-1 (Path 105) | |
|---|---|---|
| Path 117, Row 61 | Path 117, Row 62 | |
| 14 April 30 April 17 June 4 August 20 August 21 September 26 December | 14 April 30 April 1 June 17 June 19 July 20 August 10 December 26 December | 12 January (row 592) 12 January (row 597) 17 February (row 602) |
| Image Bands | Native Forest–Oil Palm | Oil Palm–Rubber | Forest–Rubber |
|---|---|---|---|
| VV, VH | 1.594 | 1.628 | 1.185 |
| VH − VV, VH | 1.907 | 1.995 | 1.596 |
| GLCM variance, VH | 1.978 | 2.0 | 1.624 |
| Image Bands | Native Forest–Rubber | Rubber–Non Forest (Shrubs/ Grass in Dryland) | Rubber–Non Forest (Shrubs/ Grass in Wetland) |
|---|---|---|---|
| NDVI, NDMI | 1.974 | 1.576 | 0.852 |
| NDVI, NDMI, VV, VH | 1.993 | 1.977 | 1.721 |
| Map | Reference | Total | |||
|---|---|---|---|---|---|
| Native Forest | Oil Palm | Rubber | Non-Forest | ||
| Native forest | 342 | 2 | 16 | 7 | 367 |
| Oil palm | 5 | 62 | 2 | 5 | 74 |
| Rubber | 4 | 4 | 52 | 5 | 65 |
| Non-forest | 1 | 0 | 10 | 267 | 278 |
| Total | 352 | 68 | 80 | 284 | 784 |
| Comm. (%) | Omiss. (%) | Producer’s Acc. (%) | User’s Acc. (%) | Overall Acc. (%) | |
| Native forest | 7 | 3 | 97 | 93 | 92 |
| Oil palm | 16 | 9 | 91 | 84 | |
| Rubber | 20 | 35 | 65 | 80 | |
| Non-forest | 4 | 6 | 94 | 96 | |
Publisher’s Note: MDPI stays neutral with regard to jurisdictional claims in published maps and institutional affiliations. |
© 2021 by the authors. Licensee MDPI, Basel, Switzerland. This article is an open access article distributed under the terms and conditions of the Creative Commons Attribution (CC BY) license (https://creativecommons.org/licenses/by/4.0/).
Share and Cite
Sari, I.L.; Weston, C.J.; Newnham, G.J.; Volkova, L. Developing Multi-Source Indices to Discriminate between Native Tropical Forests, Oil Palm and Rubber Plantations in Indonesia. Remote Sens. 2022, 14, 3. https://doi.org/10.3390/rs14010003
Sari IL, Weston CJ, Newnham GJ, Volkova L. Developing Multi-Source Indices to Discriminate between Native Tropical Forests, Oil Palm and Rubber Plantations in Indonesia. Remote Sensing. 2022; 14(1):3. https://doi.org/10.3390/rs14010003
Chicago/Turabian StyleSari, Inggit Lolita, Christopher J. Weston, Glenn J. Newnham, and Liubov Volkova. 2022. "Developing Multi-Source Indices to Discriminate between Native Tropical Forests, Oil Palm and Rubber Plantations in Indonesia" Remote Sensing 14, no. 1: 3. https://doi.org/10.3390/rs14010003