Article

Evaluation and Analysis of Dust Storm Activity in Tianwen-1 Landing Area Based on the Moderate Resolution Imaging Camera Observations and Mars Daily Global Maps

1
Beijing Institute of Spacecraft System Engineering, Beijing 100094, China
2
Shandong Provincial Key Laboratory of Optical Astronomy and Solar-Terrestrial Environment, Institute of Space Sciences, Shandong University, Weihai 264200, China
3
College of Geoexploration Science and Technology, Jilin University, Changchun 130000, China
*
Author to whom correspondence should be addressed.
Remote Sens. 2022, 14(1), 8; https://doi.org/10.3390/rs14010008
Submission received: 10 November 2021 / Revised: 16 December 2021 / Accepted: 18 December 2021 / Published: 21 December 2021
(This article belongs to the Section Satellite Missions for Earth and Planetary Exploration)

Abstract

:
The first Mars exploration mission from China (Tianwen-1) was launched on 23 July 2020 with the goal of “orbiting, landing, and roving”. The occurrence of dust storm activities is an important criterion of assessing atmospheric risk for the Tianwen-1 landing process. Dust storm activities from Mars Year (MY) 24 to MY32 in southern Utopia Planitia were identified. Most dust storms only appeared in one Mars Daily Global Map (MDGM), with a lifetime of less than or equal to solar longitude (Ls) = 0.5°. Only if the lifetime of a dust storm is greater than or equal to Ls = 1° can it reach the primary landing ellipse. From Ls = 0–50°, dust storms are mostly in the diffusion stage with a maximum speed of movement of 2479 km/Ls. Then, the speed gradually decreases to the minimum value of 368 km/Ls when the dust storm is in the dissipation stage. If a dust storm moves at an average speed of 750 km/Ls, the safe landing zone is a circle within a radius of 750 km centered on the primary landing ellipse. From March to May 2021, eight dust storms were identified in the Moderate Resolution Imaging Camera (MoRIC) mosaics. Because there was no dust storm activity in MoRIC mosaic on 13 May 2021, we concluded that there would be no dust storm in the primary landing ellipse on 15 May (MY36, Ls = 45.1°). Therefore, the landing time of the Tianwen-1 probe was finally determined as 15 May, which successfully landed in the south of the Utopia Planitia, and the in-situ investigation was carried out by the Zhurong Mars rover.

1. Introduction

Aiming at “orbiting, landing, and roving”, Tianwen-1, the first Chinese Mars exploration mission, was launched from Wenchang Satellite Launch Centre on 23 July 2020. The final landing of the Tianwen-1 probe on the Martian surface passed through the stages of Earth–Mars transfer, Mars orbit insertion, Mars orbit parking, and deorbit and landing [
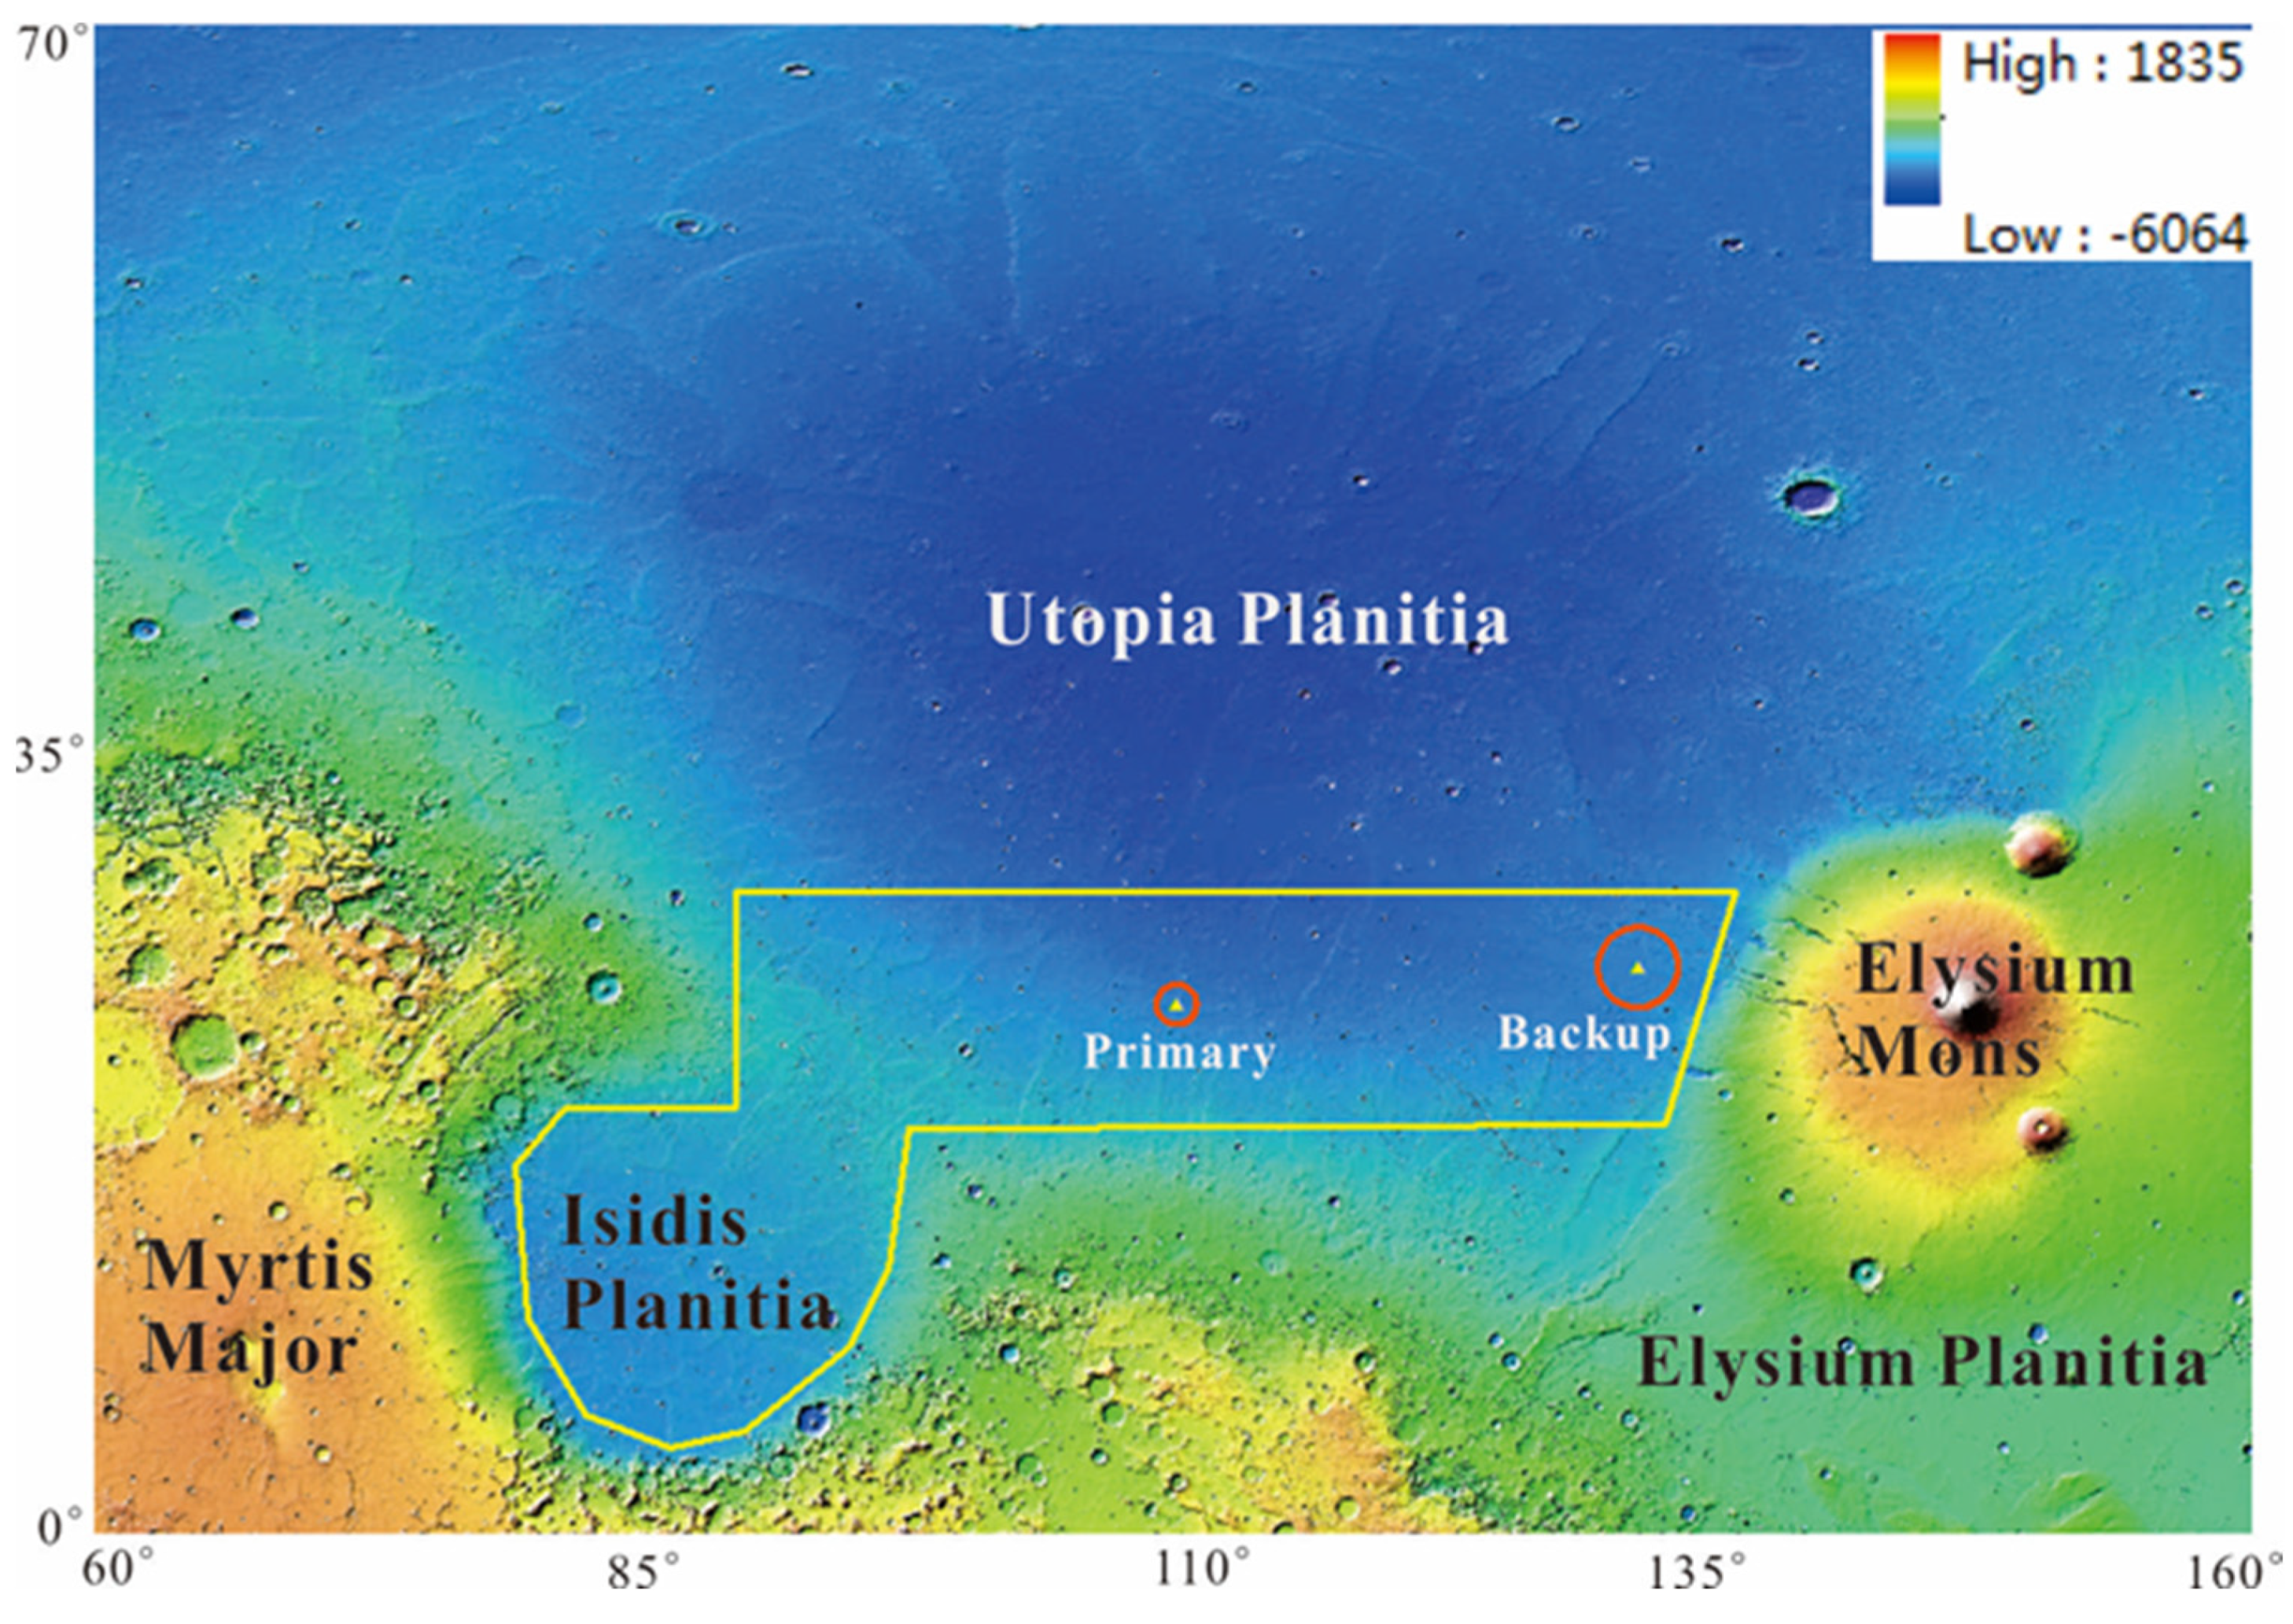
1]. In consideration of the scientific and engineering aspects, southern Utopia Planitia between 5°N and 30°N in Figure 1 was finally determined as the landing area [2].
Utopia Planitia is well-known as the largest impact basin in the northern hemisphere of Mars. The majority of Utopia Planitia on the geological map [3] is covered by extensive sedimentary materials from the Vastitas Borealis interior unit. In the past 15 years, the ice-rich planet Mars has rapidly offered more useful evidence, which has become increasingly varied according to the types of deposit and observational data [4]. Many types of interesting landform, which are similar to those in periglacial landscapes on Earth, appear in the mid-latitudes of Mars, especially in Utopia Planitia, suggesting the presence of ice-rich permafrost. These landforms include debris flows [5], polygons caused by thermal-contraction processes [6], scalloped depressions incurred by degradation of an ice-rich permafrost [7], polygon-junction pits [8], and small pingo-like mounds [9]. These periglacial landforms were formed based on the dominant process of ground-ice melting, but a sublimation process has also been suggested [10]. The Tianwen-1 probe will survey the regolith types, water and ice, weathering and sedimentary conditions in southern Utopia Planitia, via payloads on the rover after landing [11,12].
As one of the typical features of the Martian atmosphere, the scales of dust storm include microscale and global [13]. The thermal structure of the Martian atmosphere and its circulation are greatly influenced by dust storm activity [14]. The Martian atmospheric dust actively participates in the evolution processes of Martian climate, affecting the morphology and albedo of the Martian surface in the long term due to the denudation, migration, and deposition of dust [15]. For a Martian landing mission, the Entry-Descent-Landing (EDL) season is influenced by the thin atmosphere, unpredictable winds, variable dust content, and rough terrain on Mars, which is particularly challenging [16]. The local and regional weather conditions affect the success and accuracy of a Mars landing mission during the EDL season [17]. The energy systems’ efficiency and the optical sensors’ optical properties will be directly influenced by the dust deposits on the surface of the solar cell array and optical sensors of the probe landing on the Martian surface [15]. Hence, the atmospheric risk assessment should follow the probability of dust storm activity, which is significant for a Martian surface mission.
The engineering team of the Tianwen-1 chose two candidate landing sites according to the probability of dust storm occurrences, landing safety, and rover traversing ability [18]. In Figure 1, located at 24.748°N, 110.318°E, the primary landing site is centered with the primary landing ellipse of ~50 km, and located at 26.467°N, 131.626°E; the backup landing site is centered with a backup landing ellipse of ~100 km. The dates of landing for the primary landing site and the backup landing site are set as 15 May 2021 and 8 June 2021, respectively. The dust storms, originating from northern Utopia Planitia and the northern polar region, can travel very long distances from the north to the south [19], which may pass through the primary and backup landing ellipses. In addition, the temporal and spatial probabilities of dust storm activity in southern Utopia Planitia ranges from 0% to 14.13% and 0% to 11.87%, respectively, during the EDL season of the Tianwen-1 mission [20,21]. Dust devil track (DDT) formation rates in the Tianwen-1 landing area were computed and analyzed within the range of 0.00006 to 0.1275 ddt km−2 sol−1, mainly affected by factors such as the season and dust storm occurrence [22]. The spatial aggregation of three Martian surface temperature indicators, including sol average temperature, sol temperature range, and sol-to-sol temperature change, were quantitatively evaluated using clustering analysis at the global scale and in the Tianwen-1 landing area [23,24].
In this paper, the dust storm activities from Mars year (MY) 24 to 32 in southern Utopia Planitia are identified and the dust storm database is established. Then, the temporal and spatial distributions of the dust storm in the two landing ellipses were analyzed, and the orbit of the Tianwen-1 spacecraft and the observation mode of the Moderate Resolution Imaging Camera (MoRIC) [25] were suggested to guarantee that the emergence and movement of dust storms during the EDL season could be monitored. Finally, dust storms in the landing area were identified and analyzed by using the MoRIC mosaic from March to May 2021, and the meteorological condition of the primary landing ellipse on the landing day was predicted. The landing time of the Tianwen-1 probe was finally determined as 15 May, it successfully landed in the south of the Utopia Planitia and the in-situ investigation was carried out by the Zhurong Mars rover. Section 2 describes our data and methodology for dust storm identification from MDGMs and MoRIC. Section 3 verifies the reliability of the dust storm extraction method and analyzes the duration and movement speed of dust storm activity, while Section 4 predicts the dust storm activity before the Tianwen-1 landing based on the MoRIC mosaic. Finally, Section 5 concludes the work.

2. Data and Methods

2.1. Dust Storm Morphology and Classification

Dust storm activity is one of the most well-known phenomena on Mars. Spanning local, regional, and global scales, dust storms strongly influence atmospheric circulation [26]. Dust storms can be recognized as either textured or non-textured. The textures of clouds and dust storms on Mars were studied by Kahn (1984) by taking advantage of Mariner 9 and Viking data [27]. The climatology of Martian textured dust storms was discussed by Guzewich et al. (2015) [28]. Then, textured dust storms were classified into three types, pebbled, puffy, and plume-like, by Kulowski et al. (2017) [26] (see Figure 1 in their paper). Textured dust storms show a visible structure on their cloud tops that are indicative of active dust lifting, while non-textured dust storms are classified as discrete clouds of dust with clearly defined borders without a distinct topside visible texture. Roughly, with the initiation of dust lifting, vertical mixing associated with shear or convection occurs within the dusty column, and textures develop on the top of the dust storm [28]. Once dust lifting ceases, the textures can be smoothed by horizontal mixing and diffusion until a distinctly textured dust storm dissipates in the background. If dissipation occurs by less than one sol, an obvious non-textured dust cloud will be presented in subsequent MDGMs only if new dust storms generate in the region and lose their textures by the time of the next observation. However, in many cases, the occurrence of a textured dust storm is followed by a distinct non-textured dust cloud, which is present for a period of time (typically 1–3 sols). Hence, non-textured dust clouds are regarded as a phase in the decay process of some textured dust storms.
Dust storm activities embrace different lifetimes. The lifetime of some small dust storms is less than one sol, which can only be seen in one MDGM, while organized dust storm activities with a large-scale, i.e., dust storm “sequences”, can span two or more sols. In this paper, according to the obvious differences in the shape and scale of the same dust storm in different images, the lifetime can be divided into three stages: formation, diffusion and dissipation. Dust storms with obvious textures are generally in the formation stage. They are the result of wind stress dust lifting or dust devils lifting and experience turbine shear or constructive activity, developing a distinct texture on top. The safety and accuracy of the Mars landing missions are effected mainly by these dust storms. The textures can be smoothed by horizontal mixing and diffusion once dust storm lifting ceases, entering the diffusion stage. This spreads around quickly, weakening the clarity of the texture. The dust storm in the last stage can be considered as non-textured, and its moving speed decreases until it stops. Its texture disappears, leaving only a thin layer of traces, which can hardly block the Martian surface. We believe that dust storms in the dissipation stage, like thin clouds, will have little influence on the landing process of the Mars probe. In Figure 2a–d, there are four dust storms in four Mars Orbiter Camera (MOC) images from solar longitude (Ls) = 14~15.9°. According to the shape and the movement direction, we hold the view that these four dust storms make up a dust storm sequence which lasts for Ls = 2°. In Figure 2a,b, the dust storms are in the formation and diffusion stage with obvious textures, while the non-textured dust storms in the dissipation stage are shown in Figure 2c,d, which enter the primary landing ellipse.
Based on the above methods, the identified dust storm activity can be divided into textured and non-textured, and into three stages: formation, diffusion and dissipation.

2.2. MDGMs and MoRIC

2.2.1. MDGM Archive

MOC consists of three cameras, a narrow-angle (NA) monochromatic visible system (500–900 nm) with a maximum resolution of 1.4 m/pixel, and two wide-angle (WA) cameras with red and blue band passes aboard the MGS [29]. The WA red images (580–620 nm) have a maximum resolution of 230 m/pixel. Set with two UV (260 and 320 nm) and five visible filters (425, 550, 600, 650, and 725 nm) aboard the Mars Reconnaissance Orbiter (MRO), the Mars Color Imager (MARCI) is a wide-angle push-frame imager, which takes about 13 sets of pole-to-pole image swaths on a daily basis, with a resolution of about 1 km/pixel at nadir and about 4 km/pixel at the limb [30].
As the basic dataset used in this paper, the MDGM archive now extends from Ls = 150° in MY24 to Ls = 110° in MY32. The processed images from two separate orbiter camera systems, the entire MGS MOC set and the MRO MARCI set, are contained in the archive. Each map in the MDGM archive is a mosaic of up to 13 separate global image swaths, which are taken on a given sol by MOC (at 2 PM) or MARCI (at 3 PM). In this way, a MDGM represents a daily view of Mars during the early-to-mid afternoon local time that is gradually built up by the cameras. The period obtained for the MDGMs is shown in Table 1. The MARCI and MOC MDGMs used in this paper are available in https://doi.org/10.7910/DVN/G2VENZ/ (accessed on 20 March 2021). For simplicity’s sake, in the rest of this work we refer to the “M” year as “MY24”, the “E” year as “MY25”, the “R” year as “MY26”, the “S” year as “MY27”, the “P” year as “MY28”, the “B” year as “MY29”, the “G” year as “MY30”, and the “D” year as “MY31”.

2.2.2. MoRIC

The Tianwen-1 spacecraft entered into a Mars parking orbit on 24 February 2021 and then performed an initial survey of the landing area by MoRIC and HiRIC [2]. As a wide-field-of-view camera, the MoRIC can image the Mars surface from an altitude of 800 km to 265 km in orbit, collecting the data to study the topography, geomorphology and geological structure of Mars. The image data can be acquired by MoRIC with a spatial resolution of ~100 m. Its frame width is 400 km × 400 km and its rows and columns are 4096 × 3072 with a field of view of about 53.1° × 41.1°. The images overlap along the flight direction by up to 60%, and the side overlap between adjacent orbits by up to 15% [25].

2.3. Dust Storm Identification

For MDGMs, dust storms in the landing area can be detected by using the visual inspection procedure described in detail by Cantor et al. (2001) and Yao et al. (2020) [20,31]. The textured dust storm has obvious texture and strong color contrast to that of the rocks on the Martian surface. Firstly, we use daily global maps to monitor day-to-day variations of surface albedo, and dust storm structures are looked for once a variation is found, e.g., pebbled, puffy, and plume-like textures caused by air convection or other atmospheric impacts [26,31]. Confused with clouds and water vapor, it is difficult to directly identify a non-textured dust storm. However, two methods can be utilized to distinguish non-textured dust storms. (1) In multiple continuous MDGM images, a non-textured storm can be considered as the result of the development and movement of a textured dust storm. (2) The single scattering albedo and surface albedo of the blue band (ice) condensate cloud are higher than those of the dust [25]. Hence, dust storms are much brighter than clouds at red wavelengths.
The resolution of the MoRIC image (~100 m) is one order of magnitude, which is higher than that of the MOC and MARCI images (~6 km). Therefore, the color of the dust storm in the MoRIC image becomes lighter, from yellow to gray black, and blocks the surface features of Mars. The width of the MoRIC image (400 km) is smaller than that of the MDGM, which covers the whole of Mars, allowing the large dust storm to be partially seen in the MoRIC mosaic and making the details of dust storm texture clearer. Due to the long distance (~55 million kilometers) between Mars and the Earth and the slow data transmission speed, MoRIC can only take photos once every two weeks. The MoRIC image obtained before the Tianwen-1 landing process is not successive, and no day-to-day variations of surface albedo can be used to detect dust storms. As a result, Viking MDIM 2.0 (the mosaic map for no dust storm, ~231 m/pixel) is utilized as the base map, working out the difference between the MoRIC mosaic of landing area and itself, which judges whether it is a dust storm or not. Additionally, before the Tianwen-1 probe landed, shooting by MoRIC occurred 12 times in total from the northern pole to the landing area. Compared with each other, these images obtained at different times can also be used to recognize the dust storms in the landing area.

2.4. Estimation of Dust Storm Moving Speed

Large-scale, organized dust events are known as dust storm “sequences” [19]. One or more dust storm members are collected, which follow a general trajectory, forming these sequences [13]. Sequences defined here have a lifetime of two or more MDGMs and MoRIC mosaics, which is longer than the duration than that of the individual members. The criteria used to identify a given dust storm as the same across multiple MDGMs are as follows: physical proximity from one MDGM to another, and similarities in morphology and texture [32].
In this paper, based on multiple continuous MDGMs and the MoRIC mosaic, the dust storm sequence is tracked and its moving speed is estimated. The dust storm in the Tianwen-1 landing area mainly comes from the northern ice cap and then moves southwards to the landing ellipses [20]. Taking MDGM as an example, the time interval between two consecutive MDGMs is about Ls = ~0.5°, so the moving speed can be estimated according to the positions of the same dust storm in two successive MDGMs. The specific method is as follows:
S = DLs.
where D is the distance between the southernmost points of the same dust storm boundary in two serial MDGMs, ΔLs is the time interval of the two images, and S is the moving speed of the dust storm. In Figure 2e, the dust storm of blue color comes from the dust storm of yellow color. The ΔLs of the two dust storms is Ls = 0.9°, and their distance is ~1600 km. The black dotted arrow in Figure 2e shows the approximate movement direction of the dust storm sequence. We can calculate the moving speed of the dust storm in Figure 2e as ~1800 km/Ls using Equation (1).

3. Verification and Analysis of Dust Storm Database

3.1. Dust Storm Identification Result in the Study Area

According to the dust storm recognition method mentioned above, based on the MDGMs in MY24-32, 367 dust storms in total were identified in the study area (18°–60°N, 85°–150°E) during Ls = 0–90°. The identified result is seen in Figure 3 and Table 2, showing that there are four dust storms entering the primary landing ellipse and 33 dust storms entering the backup landing ellipse in MY24-32. During Ls = 0–50°, most dust storms originated from the northern polar region, moving southwards to enter the two landing ellipses and their nearby areas. These dust storms reaching the landing ellipses are all in the dissipation stage, while almost no dust storms come from the northern pole region during Ls = 50–90°, except MY25. However, the dust storms in MY25 come from the northern pole region, moving to east and west (around the northern pole) instead of south. Neither protogenous dust storm is in primary ellipse and no dust storms come from the the northern pole region. Therefore, the primary ellipse is in a quiet period of atmospheric activity during Ls = 50–90°, making it a safe landing area. During Ls = 50–90°, all dust storms are protogenous and densely appear in the upper right of the backup landing ellipse, which may move into this area. In Figure 3, the dust storm dense area A is an ellipse with a center of 33°N, 133°E and a radius of ~1315 × 776 km. So dust storms occur frequently in the backup ellipse during Ls = 50–90°, which is unsuitable for a Mars mission landing.

3.2. Comparison with MDAD

Mars Dust Activity Database (MDAD) in 8 Mars years (MY24, Ls = 150° to MY32, Ls = 171°) is set up from MDGMs by Battalio and Wang (2021) [13]. A total of 14,974 dust storms are cataloged with area >105 km2 based on a visual interpretation method. The MDAD archive can be downloaded at https://doi.org/10.7910/DVN/F8R2JX/ (accessed on 20 March 2021). In order to verify the correctness and integrity of our results, the dust storms and sequences identified in the study area during Ls = 0–90° are compared with those in MDAD. The specific parameters of dust storms in MDAD are Mars year, Ls, central longitude and latitude, area. The comparison and verification results are shown in Table 3. These (Column 6 in Table 3) consist of three parts: the ratio of the number of dust storms we identified to the number of dust storms in MDAD, the number of dust storms we missed, and the number of dust storms we identified that is more than MDAD. For example, the value (30/31, 1, 21) indicates that we have missed one dust storm in the MDAD in MY25, but we have identified 21 more dust storms than MDAD in MY25.
From Table 3, the results of dust storm and sequences identification in this paper are completely consistent with MDAD in Mars year M, R and B, and 25, 22 and 2 dust storms that are not in MDAD in Mars year M, R and B have been identified separately, which may be because only dust storms with area >105 km2 (or diameter >~316 km) are identified and included in MDAD, while smaller dust storms are not identified and recorded even if they exist in the study area. Moreover, the coincidence rate of dust storms and sequences detection between our results and MDAD reached 97%, 98%, 80%, 76% and 90%, separately in Mars year E, S, P, G and D. However, 21, 11, 5, 4 and 6 dust storms were in MDAD during the five Mars years which were unrecognized. Contrasting with the Martian surface, these unrecognized dust storms possess low clarity, which are all in the dissipation stage or treated as clouds rather than dust storms according to their characteristics. Compared with the MDAD, the average recognition rate of dust storms and sequences in our study is as high as ~93% and 100%. Especially, our identification capability for smaller dust storms (area ≤ 105 km2) is better than that of MDAD.

3.3. Duration of Dust Storm Activity

The duration of dust storms in the landing area was counted. The dust storm may appear in multiple continuous MDGMs, possessing the lifetime of Ls difference between the first MDGM and the last MDGM. The time interval of two consecutive MDGMs is Ls~0.5°. Taking the number of MDGMs as the unit, the duration of dust storms in the study area is shown in Table 4.
(1) As shown in Table 4, only one dust storm lasted for 5 MDGMs in Mars year P, and a total of seven dust storms continued for 4 MDGMs in 6 Mars years, except in P and B. The numbers of dust storms for 3 and 2 MDGMs are 9 and 32, respectively. Most dust storms (200) only appear in one MDGM, so their lifetimes are less than or equal to Ls = 0.5°.
(2) Dust storms in 3–5 MDGMs in MY24-32 are observed from Ls = 0° to 50°, originating from the northern polar region and then moving southwards. Only if the lifetime of a dust storm is greater than or equal to Ls = 1° (or it appears in at least three successive MDGMs) can it reach the primary landing ellipse. Therefore, an image of at least 1° before the landing sol must be obtained when predicting the dust storms within the primary landing ellipse of the Tianwen-1 mission, while from Ls = 50°–90°, most dust storms in the study area are protogenous and only occur in region A (see Figure 3), possessing durations of only 2 MGDMs at most. That is to say, the maximum lifetime of dust storms during Ls = 50°–90° is Ls = ~0.5°. Dust storms in the backup landing ellipse are protogenous dust storms in this sol, or are moving into the backup landing ellipse from region A after Ls = 0.5°. Hence, an image of the landing sol must be obtained when predicting the dust storms in the backup landing ellipse of the Tianwen-1 mission.
(3) In terms of lifetime, the dust storm entering the primary landing ellipse is in the dissipation stage, which is characterized as slow-moving, non-textured and mist-like, having little occlusion effect on the observation of Martian ground materials. The duration of entering the backup landing ellipse of the dust storms is shorter (Ls = 0.5°–1°), and they are mainly sudden and protogenous and can block the ground observation of Martian surfaces due to their obvious textures.

3.4. Movement Speed of Dust Storms

According to the method mentioned above, the movement speed of dust storms in the study area of MY24-32 during Ls = 0–90° is estimated.
(1) Dust storms from Ls = 0–50° in the study area mainly come from the northern pole region with the majority moving clockwise or counterclockwise around the ice sheet and few moving to the south. The maximum moving speed of these dust storms, which are mostly in the diffusion stage, is 2479 km/Ls. Then as the moving speed gradually decreases, the minimum value is 368 km/Ls when the dust storm is in the dissipation stage. After Ls = 50°, almost all the dust storms originate in region A with the maximum duration of Ls = 1° and maximum and minimum movement speed of 980 km/Ls and 95 km/Ls, respectively.
(2) The safety buffer zone can be defined as follows: the dust storm outside the safety buffer zone is unnecessary for consideration if it is found before the landing sol, because it cannot move into the landing ellipse under such a circumstance. From Ls = 0–50°, the maximum moving speed of cap-edge storms in the northern hemisphere is 2479 km/Ls. If the MoRIC image of Ls = 1° before the landing sol can be obtained, the safety buffer zone is a 2479 km circle centered on the landing ellipses. However, the dust storms entering the primary landing ellipse have continuously moved at least Ls = 1° from the northern ice cap, and are in the dissipation stage with a moving speed of much less than that of dust storms in the formation and diffusion stage. In this way, if the moving speed of a dust storm is 750 km/Ls for calculation, the safety buffer zone is a 750 km circle centered on the primary landing ellipse. However, the calculation of the safety buffer zone is not applicable to the backup landing ellipse, because from Ls = 50–90° there are protogenous dust storms in the backup landing ellipse instead of a dust storm moving in from the outside.
(3) According to the temporal and spatial distribution of dust storms in the study area in MY24-32, there is frequent occurrence of protogenous dust storms in the backup landing ellipse during and after Tianwen-1 probe landing process (Ls > 50°). Therefore, the backup landing ellipse is inappropriate, and should be excluded because of its insecurity.

4. Analysis and Prediction of Dust Storm before Tianwen-1 Landing Based on MoRIC Mosaic

From entering the Mars parking orbit (24 February 2021) to landing (15 May 2021), the MoRIC aboard the Tianwen-1 orbiter shot 12 times, respectively, on 6 March and 8 March, 16, 18, 24, 26 March, 1, 3, 5, 7 and 10 April, and 13 May, which was the last time (two days before landing). The corresponding Martian time is MY36 Ls = 12.9° and 13.8°, Ls= 17.6°, 18.6°, 21.4°, 22.3°, 25.1°, 26.1°, 27°, 27.9° and 29.3°, and Ls = 44.2°.

4.1. Registering and Seaming the MoRIC Images

During the process of the Tianwen-1 orbiter flying south from the northern pole to the landing area, 30 successive images of the Martian surface were taken by MoRIC in 20 min with an average time interval of each image of ~40 s. When the orbiter is near the landing area, the shooting frequency of MORIC is accelerated accompanied with a large overlapping area between two adjacent images. According to the preprocessing pipeline of data, the data products are categorized into six levels, Level 0A, Level 0B, Level 1, Level 2A, Level 2B and Level 2C [33]. The Level 2C data products of MoRIC processed by the National Astronomical Observatory of China were used in this paper, which has been corrected and restored in color, finally being stored as 8-bit binary data in RGB and BIL (band interleaved by line) format.
As an image product without registration (no coordinate system), the level 2C data products of MoRIC cannot be directly used for dust storm identification in the study area. The resolution of MoRIC is 100 m/pixel, which is very different from the 6 km/pixel resolution of the MDGM, while in good agreement with the Viking MDIM 2.0 color map, with a resolution of ~231 m/pixel. Therefore, MoRIC images were registered and seamed together in GIS software based on the Viking MDIM 2.0 color map. The northern hemisphere of Mars, far from the landing area, was photographed by MoRIC on 16 and 18 March, 7 and 10 April, which cannot be used to identify and analyze dust storms. Hence, only the images taken on 6, 8, 24 and 26 March, 1, 3 and 5 April, 13 May were registered for the purpose of identifying and analyzing dust storms.

4.2. The Results of Dust Storms Identification and Analysis Based on MoRIC Mosaics

Eight dust storms were identified by MoRIC mosaics from March to May 2021 with two in March 2021 and six in April 2021. The details of eight dust storms are given in Table 5, named in the form of month, day and serial number. For example, the name 3-8-1 and 3-8-2 in Table 5 indicates that there were two dust storms on 8 March. The number of dust storm in the formation, diffusion and dissipation stage is 3, 3 and 2, respectively. In this paper, dust storms 3-24-1, 3-24-2 and 3-26-1 appearing on 24 March and 26 March are taken as examples to illustrate the shape, stage, scope and evolution process of dust storm activities in the study area. Other dust storms are described in Figures S1–S5.
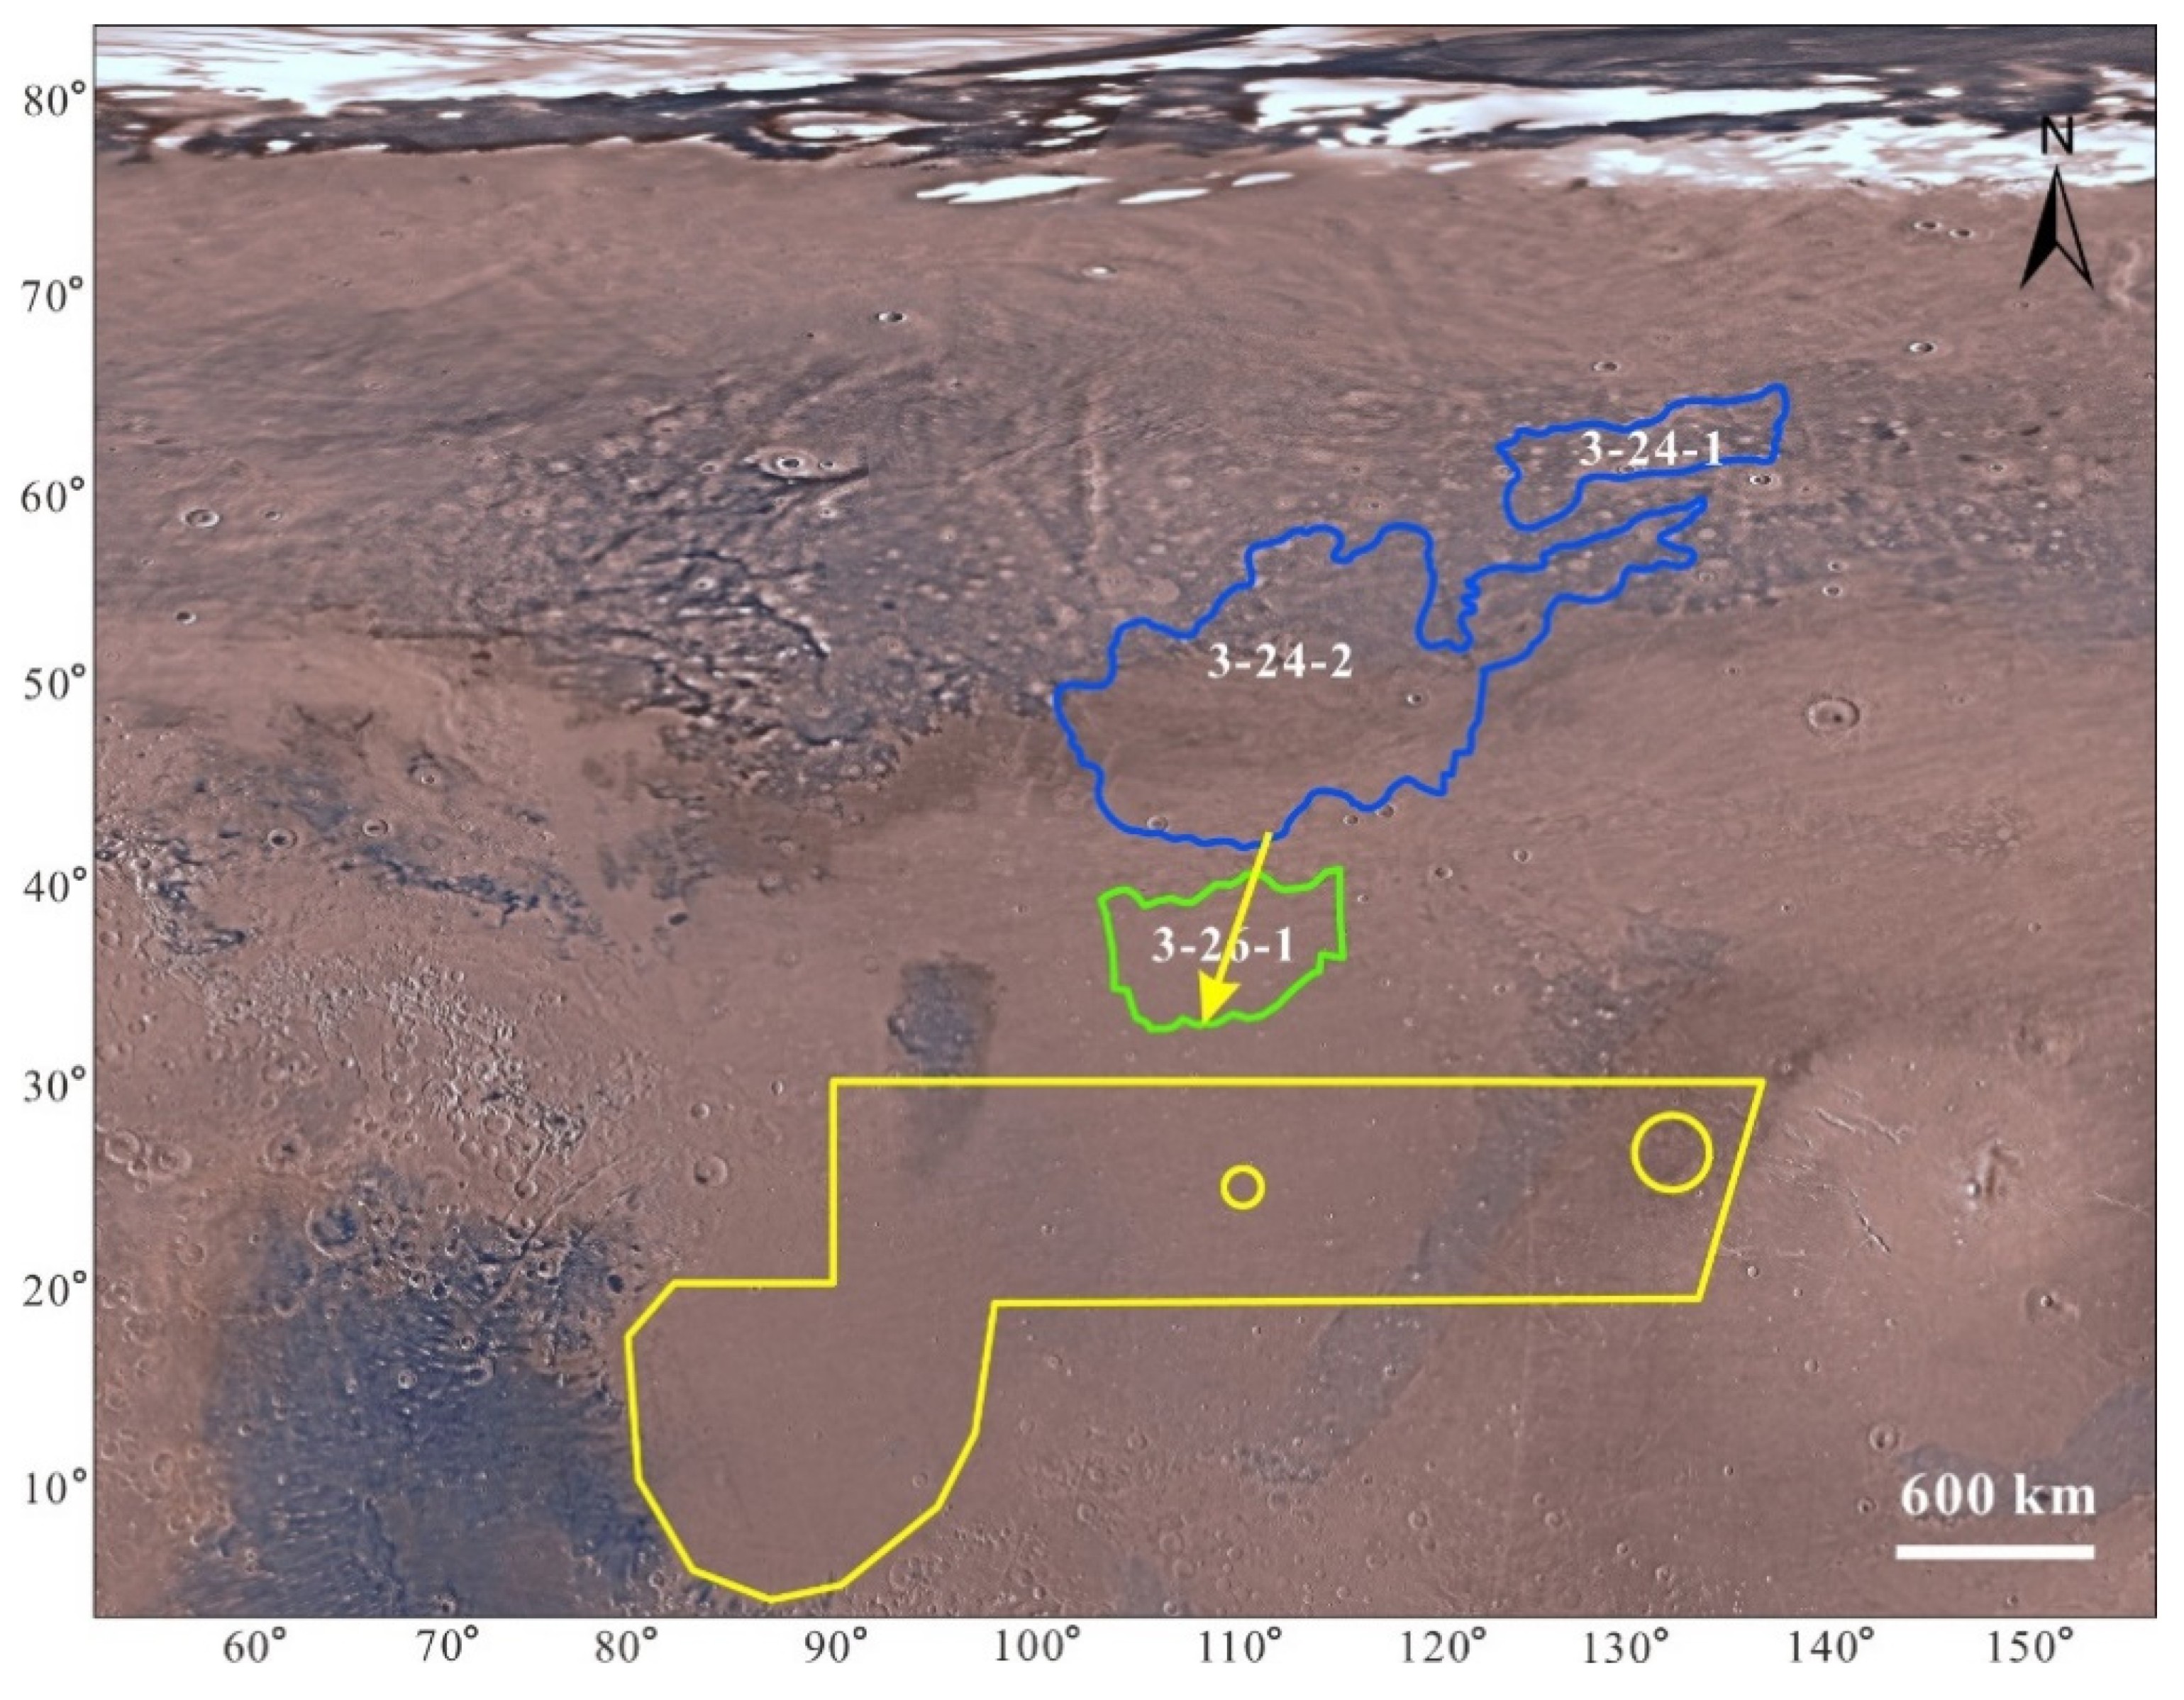
Two textured dust storms (blue polygons, in Figure 4), named 3-24-1 and 3-24-2 respectively, were identified in the MoRIC mosaic on March 24. Located in the northeast of the Utopia Planitia, the dust storm 3-24-1 was centered at 61.3°N, 130.1°E with an area of ~1.2 × 10⁵ km2 and embraced the strip-like feature. Situated in the northern part of the Utopia Planitia, dust storm 3-24-2 was centered at 50.0°N, 116.1°E, covering an area of roughly 7.0 × 10⁵ km2 with a spade shape, which is about 800 km from the boundary of the primary landing ellipse. Owing to the limited area of the MoRIC that can be photographed, the whole dust storm 3-24-1 and 3-24-2 are unable to be observed. No dust storms were found in the landing ellipses on 24 March.
On 26 March, only one dust storm appearing in the middle of the Utopia Planitia (green polygon in Figure 5) was identified in the MoRIC mosaic, which was named as 3-26-1. Situated between 32.6°–40.5°N, 103.2°–115.4°E, it is centered at 36.6°N, 109.5°E, covering an area of ~1.9 × 10⁵ km2 and being nearly rectangular in shape. Because of the quality and range limitations of the MoRIC mosaic, dust storm 3-26-1 may not be fully displayed and identified. It was the nearest to the primary landing ellipse with a distance of ~300 km. No dust storms were found in the landing ellipses on 26 March.
In Figure 4 and Figure 5, dust storm 3-24-1 is far from dust storm 3-26-1 while close to the dust storm 3-24-2, so the following are possible: (1) dust storm 3-24-1 is a single dust storm coming from the northern polar region, or (2) dust storm 3-24-1 and 3-24-2 are two parts of one large dust storm activity, or (3) belong to the same dust storm sequence with 3-26-1, and dust storm 3-24-1 lasted for Ls = 1° in the sequence and moved southward to form the dust storm 3-26-1.
In Figure 4, dust storm 3-24-1 shows characteristics of dense plume-like textures while dust storm 3-24-2 has fluffy textures looking like fish scales. We believe that they are in different stages and thus do not come from the same large-scale dust storm activity. Furthermore, the distance and the time difference between the dust storm 3-24-1 and 3-26-1 are about 1811 km and Ls = 1°, respectively. If the two dust storms belong to one dust storm sequence, the moving speed of dust storm 3-24-1 can be calculated as ~1811 km/Ls. According to the results in Section 2.4, only the moving speed of the dust storm in the formation stage can reach ~1800 km/Ls. However, the dust storm 3-26-1 was in the dissipation state. Therefore, it can be determined that the dust storm 3-24-1 is a separate dust storm activity. The lifetime, movement direction and speed of dust storm 3-24-1 cannot be inferred because of no subsequent MoRIC mosaic near its position.
In Figure 5, both dust storm 3-24-2 and 3-26-1 are located in the central area of the Utopia Planitia with the time difference of about 2 sols (Ls = ~1°). From the perspective of morphology, both are dust storms with fluffy textures, which are in the diffusion or dissipation stage. Therefore, the following are possible: (1) dust storm 3-26-1 is a single and protogenous dust storm in the middle of the Utopia Planitia, (2) belonging to the same dust storm sequence with dust storm 3-26-1, dust storm 3-24-2 continued for Ls = 1°, moving southward to produce the dust storm 3-26-1, (3) dust storm 3-26-1 is neither a protogenous dust storm nor evolved from dust storm 3-24-2, but may be formed by another dust storm sequence, generated between two MoRIC mosaic observation times on 24 March and 26 March.
Dust storm 3-26-1 has fluffy and blurry textures indicating that it is in the dissipation stage. There is no protogenous dust storm in the middle of the Utopian Planitia during Ls = 0–50° according to the dust storms identified in MY24-32. Therefore, dust storm 3-26-1 comes from a dust storm sequence instead of being alone and native. If dust storm 3-26-1 was produced by a dust storm sequence occurring in the northern pole region between the dates of March 24 and March 26, its movement speed would be much faster than 2000 km/Ls, which is inconsistent with that calculated in Section 2.4. However, the dust storms 3-26-1 and 3-24-2 are close to each other and share similar textures and shapes (Figure 4 and Figure 5). If dust storm 3-26-1 is the result of the movement of dust storm 3-24-2, the movement speed can be calculated as ~501.7 km/Ls, which is in line with that of a dust storm in the diffusion and dissipation stage. Hence, we infer that dust storm 3-26-1 and 3-24-2 are from the same dust storm sequence, generated in the northern polar region and then moved southwards, lasting for at least 2 sols (shown by the yellow arrow in Figure 6).

4.3. The Dust Storm Forecast for Tianwen-1 Mission on 15 May

A visual dust storm survey was implemented by comparing the MoRIC mosaic on 13 May 2021 (Figure 7) with the Viking MDIM 2.0 color map. No dust storm activity occurs in the MoRIC mosaic, which is also consistent with the result that no dust storms appeared in the primary landing ellipse during Ls = 44.2° in MY24-32. In addition, according to the temporal and spatial distribution and the moving speed of dust storms mentioned above, the protogenous dust storm will not occur in the primary landing ellipse during Ls > 40° even though a dust storm sequence is from the northern polar region, which will take at least two sols to reach the primary landing ellipse. Therefore, we conclude that there will be no dust storm in the primary landing ellipse on 15 May 2021 (MY36, Ls = 45.1°), and the Tianwen-1 landing process will not be effected by bad weather conditions. As a result, the landing time of the Tianwen-1 probe was finally determined as 15 May, it successfully landed in the south of the Utopia Planitia (25.06°N, 109.92°E) and the in-situ investigation was performed by the Zhurong Mars rover.

5. Discussion

The MDGMs were used to identify dust storm activities from MY24 to MY32 in southern Utopia Planitia, and the dust storm database was established in this paper. Then, the temporal and spatial occurrence of dust storms in two landing ellipses was analyzed, and the orbit of the Tianwen-1 spacecraft and the observation mode of MoRIC were proposed to ensure the emergence and movement of dust storms during EDL season were monitored. In the end, the MoRIC images from March to May are utilized to identify and analyze the dust storms in the landing areas, and the meteorological condition of the primary landing ellipse on the landing sol is predicted.
(1) According to the dust storm recognition method mentioned above, based on the MDGMs in MY24-32, 367 dust storms in total were identified in the study area (18°–60°N, 85°–150°E) during Ls = 0–90°. Compared with the MDAD, the average recognition rate of dust storms and sequences in our study is as high as ~93% and 100%. Especially, our identification capability for the smaller dust storms (area ≤ 105 km2) is better than that of MDAD. It shows that the dust storms and sequences in the study area can be well identified and extracted by our method.
(2) In this paper, we used the MoRIC mosaic to identify the dust storms in southern Utopia Planitia from March to May 2021. The resolution of MoRIC image (~100 m) is one order of magnitude, which is higher than that of the MOC and MARCI image (~6 km). The MoRIC image obtained before the Tianwen-1 landing process is not successive, and no day-to-day variations of surface albedo can be used to detect dust storms. The previous methods of identifying dust storms using MDGMs cannot be directly used in MoRIC images. As a result, Viking MDIM 2.0 was utilized as the base map, finding out the difference between the MoRIC mosaic of landing area and itself, which judges whether it is a dust storm or not. Eight dust storms were identified by MoRIC mosaics from March to May 2021 with two in March 2021 and six in April 2021.
(3) According to previous research the Mars Regional Atmospheric Modeling System (MRAMS) and a nested simulation of the Mars Weather Research and Forecasting model (MarsWRF) were used to predict the local meteorological conditions at the Mars 2020 Perseverance rover landing site inside Jezero crater [34]. Tianwen-1 is China’s first Mars exploration mission. It is difficult for us to obtain real-time satellite images and physical parameters (such as temperature and pressure) required by the MarsWRF model during the EDL season. The duration and moving speed of dust storms in the landing area was estimated. An image at least Ls = 1° before the landing sol must be obtained by the MoRIC, if we want to predict the dust storms in the primary landing ellipse of the Tianwen-1 mission. If dust storm moves at an average speed of 750 km/Ls, the safe landing zone is a circle with radius of 750 km centered on the primary landing ellipse. Because there is no dust storm activity in MoRIC mosaic on 13 May 2021, we conclude that there will be no dust storm in the primary landing ellipse on 15 May (MY36, Ls = 45.1°), and the Tianwen-1 landing process will not be affected by bad weather conditions. Therefore, the landing time for the Tianwen-1 probe was finally determined as 15 May, it successfully landed in the south of the Utopia Planitia and the in-situ investigation was carried out by the Zhurong Mars rover.

Supplementary Materials

The following are available online at https://www.mdpi.com/article/10.3390/rs14010008/s1, Figure S1: The MoRIC mosaic on March 6 and one dust storm 3-6-1 (blue polygon in the north). The white polygon and yellow circles show the tentative landing area and the two landing ellipses of the Tianwen-1 mission, Figure S2: The MoRIC mosaic on March 8 and two dust storm 3-6-1 and 3-8-2 (blue polygons in the north). The white polygon and yellow circles show the tentative landing area and the two landing ellipses of the Tianwen-1 mission, Figure S3: The MoRIC mosaic on April 1 and one dust storm 4-1-1 (blue polygon in the north). The white polygon and yellow circles show the tentative landing area and the two landing ellipses of the Tianwen-1 mission, Figure S4: The MoRIC mosaic on April 3 and one dust storm 4-3-1 (blue polygon in the north). The white polygon and yellow circles show the tentative landing area and the two landing ellipses of the Tianwen-1 mission, Figure S5: The MoRIC mosaic on April 5 and no identified dust storms. The white polygon and yellow circles show the tentative landing area and the two landing ellipses of the Tianwen-1 mission.

Author Contributions

Conceptualization, S.Q., B.L. and J.Z.; methodology, B.L. and J.Z.; software, Y.W. and Y.Z.; validation, C.L., Z.L. and S.C.; resources, S.C., Y.W and C.L.; writing—original draft preparation, S.Q. and B.L.; writing—review and editing, B.L. and J.Z.; visualization, Y.W., C.L and Y.Z.; supervision, S.Q.; project administration, S.Q. and B.L.; funding acquisition, S.C. All authors have read and agreed to the published version of the manuscript.

Funding

This work is supported by the Strategic Leading Science and Technology Special Project of Chinese Academy of Sciences (XDB41000000, XDB18000000), the Shandong Provincial Natural Science Foundation (ZR2019MD015) and National Key R&D Program of China (2020YFE0202100).

Institutional Review Board Statement

Not applicable.

Informed Consent Statement

Not applicable.

Data Availability Statement

The MARCI and MOC MDGMs used in this paper are available on https://doi.org/10.7910/DVN/G2VENZ/ (accessed on 20 March 2021).

Acknowledgments

The authors would like to thank editors for the suggestions to improve our manuscript. We would like to thank the three anonymous reviewers who provided very helpful and useful suggestions for the manuscript. We are grateful to the team members of the Ground Research and Application System, and National Astronomical Observatory of China, who will contribute to data receiving, processing and release of the China’s Mars Mission (Tianwen-1). We also acknowledge the MRO and MGS operations and engineering staffs (past and present) for their diligent work, who have contributed to the success of the MOC and MARCI investigations.

Conflicts of Interest

The authors declare no conflict of interest.

References

  1. He, Z.; Xu, R.; Li, C.; Yuan, L.; Wang, J. Mars Mineralogical Spectrometer (MMS) on the Tianwen-1 Mission. Space Sci Rev 2021, 217, 27. [Google Scholar] [CrossRef]
  2. Zou, Y.; Zhu, Y.; Bai, Y.; Wang, L.; Peng, Y.; Jia, Y.Z.; Shen, W.H.; Fan, Y.; Liu, Y.; Wang, C.; et al. Scientific objectives and payloadsof tianwen-1, china’s first mars exploration mission. Adv. Space Res. 2020, 67, 812–823. [Google Scholar] [CrossRef]
  3. Tanaka, K.L.; Robbins, S.J.; Fortezzo, C.M.; Skinner, J.A.; Hare, T.M. The digital global geologic map of Mars: Chronostratigraphic ages, topographic and crater morphologic characteristics, and updated resurfacing history. Planet. Space Sci. 2014, 95, 11–24. [Google Scholar] [CrossRef]
  4. Costard, F.; Sejourne, A.; Kargel, J.; Godin, E. Modeling and observational occurrences of near-surface drainage in Utopia Planitia, Mars. Geomorphology 2016, 275, 80–89. [Google Scholar] [CrossRef]
  5. Costard, F.; Forget, F.; Mangold, N.; Peulvast, P.J. Formation of Recent Martian Debris Flows by Melting of Near-Surface Ground Ice at High Obliquity. Science 2002, 295, 110–113. [Google Scholar] [CrossRef] [PubMed] [Green Version]
  6. Ulrich, M.; Hauber, E.; Herzschuh, U.; Härtel, S.; Schirrmeister, L. Polygon pattern geomorphometry on Svalbard (Norway) and western Utopia Planitia (Mars) using high-resolution stereo remote-sensing data. Geomorphology 2011, 134, 197–216. [Google Scholar] [CrossRef] [Green Version]
  7. Séjourné, A.; Costard, F.; Gargani, J.; Soare, R.J.; Marmo, C. Scalloped terrain and small-sized polygons in western Utopia Planitia, Mars: A new formation hypothesis. Planet. Space Sci. 2011, 59, 412–422. [Google Scholar] [CrossRef]
  8. Morgenstern, A.; Hauber, E.; Reiss, D.; Van Gasselt, S.; Grosse, G.; Schirrmeister, L. Deposition and degradation of a volatile-rich layer in Utopia Planitia and implication for climate history on Mars. J. Geophys. Res. Atmos. 2007, 112, E06010. [Google Scholar] [CrossRef] [Green Version]
  9. Dundas, C.M.; Mellon, M.T.; Lefort, A.; Thomas, N.; Team, H. HiRISE observations of fractured mounds: Possible Martian pingos. Geophys. Res. Lett. 2008, 35. [Google Scholar] [CrossRef] [Green Version]
  10. Lefort, A.; Russell, P.S.; Thomas, N.; Mcewen, A.S.; Dundas, C.M.; Kirk, R.L. Observations of periglacial landforms in Utopia Planitia with the High Resolution Imaging Science Experiment (HiRISE). J. Geophys. Res. Planets 2009, 114. [Google Scholar] [CrossRef] [Green Version]
  11. Zhao, J.; Xiao, Z.; Huang, J.; Head, J.W.; Wang, J.; Shi, Y.; Wu, B.; Wang, L. Geological characteristics and targets of high scientific interest in the Zhurong landing region on Mars. Geophys. Res. Lett. 2021, 48, e2021GL094903. [Google Scholar] [CrossRef]
  12. Wan, W.; Yu, T.; Di, K.; Wang, J.; Liu, Z.; Li, L.; Liu, B.; Wang, Y.; Peng, M.; Bo, Z.; et al. Visual Localization of the Tianwen-1 Lander Using Orbital, Descent and Rover Images. Remote Sens. 2021, 13, 3439. [Google Scholar] [CrossRef]
  13. Battalio, M.; Wang, H. The Mars Dust Activity Database (MDAD): A comprehensive statistical study of dust storm sequences. Icarus 2020, 354, 114059. [Google Scholar]
  14. Haberle, R.M.; Clancy, R.T.; Forget, F.; Smith, M.D.; Zurek, R.W. The Atmosphere and Climate of Mars; Cambridge University Press, University Printing House: Cambridge, UK, 2017; pp. 229–294. [Google Scholar]
  15. Tang, Z.; Liu, J.; Wang, X.; Ren, X.; Yan, W.; Chen, W. The Temporal Variation of Optical Depth in the Candidate Landing Area of China’s Mars Mission (Tianwen-1). Remote. Sens. 2021, 13, 1029. [Google Scholar] [CrossRef]
  16. Fonseca, R.M.; Zorzano, M.P.; Martín-Torres, J. MARSWRF Prediction of Entry Descent Landing Profiles: Applications to Mars Exploration. Earth Space Sci. 2019, 6, 1440–1459. [Google Scholar] [CrossRef]
  17. Vasavada, A.R.; Chen, A.; Barnes, J.R.; Burkhart, P.D.; Cantor, B.A.; Dwyer-Cianciolo, A.M.; Fergason, R.L.; Hinson, D.P.; Justh, H.L.; Kass, D.M. Assessment of environments for Mars Science Laboratory entry, descent, and surface operations. Space Sci. Rev. 2012, 170, 793–835. [Google Scholar] [CrossRef] [Green Version]
  18. Wu, X.; Liu, Y.; Zhang, C.; Wu, Y.; Zhang, F.; Du, J.; Liu, Z.; Xing, Y.; Xu, R.; He, Z.; et al. Geological characteristics of China’s Tianwen-1 landing site at Utopia Planitia, Mars. Icarus 2021, 370, 114657. [Google Scholar] [CrossRef]
  19. Richardson; Mark, I.; Wang, H. The origin, evolution, and trajectory of large dust storms on Mars during Mars years 24–30 (1999–2011). Icarus Int. J. Sol. Syst. Stud. 2015, 251, 112–127. [Google Scholar]
  20. Yao, P.; Li, C.; Wang, B.; Li, B.; Zhang, J.; Ling, Z.; Chen, S. Evaluating the Dust Storm Probability in Isidis-lysium Planitia, a Tentative Landing Area of Chi-na’s First Mars Mission (Tianwen-1). Earth Space Sci. 2020, 7, e2020EA001242. [Google Scholar] [CrossRef]
  21. Li, B.; Yue, Z.; Qu, S.; Yao, P.; Fu, X.; Ling, Z.; Chen, S. Spatio-Temporal Analysis of Dust Storm Activity in Chryse Planitia Using MGS-MOC Observations from Mars Years 24–28. Universe 2021, 7, 433. [Google Scholar] [CrossRef]
  22. Wang, Y.; Li, B.; Zhang, J.; Ling, Z.; Qiao, L.; Chen, S.; Qu, S. The Preliminary Study of Dust Devil Tracks in Southern Utopia Planitia, Landing Area of Tianwen-1 Mission. Remote Sens. 2021, 13, 2601. [Google Scholar] [CrossRef]
  23. Luo, Y.; Yan, J.; Li, F.; Li, B. Spatial Autocorrelation of Martian Surface Temperature and Its Spatio-Temporal Relationships with Near-Surface Environmental Factors across China’s Tianwen-1 Landing Zone. Remote Sens. 2021, 13, 2206. [Google Scholar] [CrossRef]
  24. Luo, Y.; Yan, J.; Li, F.; Barriot, J.P. Strong Spatial Aggregation of Martian Surface Temperature Shaped by Spatial and Seasonal Variations in Meteorological and Environmental Factors. Res. Astron. Astrophys. 2021. [Google Scholar] [CrossRef]
  25. Li, C.; Zhang, R.; Yu, D.; Dong, G.; Liu, J.; Geng, Y.; Sun, Z.; Yan, W.; Ren, X.; Su, Y.; et al. China’s Mars Exploration Mission and Science Investigation. Space Sci. Rev. 2021, 217, 57. [Google Scholar] [CrossRef]
  26. Kulowski, L.; Wang, H.; Toigo, A.D. The seasonal and spatial distribution of textured dust storms observed by Mars Global Surveyor Mars Orbiter Camera. Adv. Space Res. 2017, 59, 715–721. [Google Scholar] [CrossRef] [Green Version]
  27. Kahn, R. The spatial and seasonal distribution of Martian clouds and some meteorological implications. J. Geophys. Res. Atmos. 1984, 89, 6671–6688. [Google Scholar] [CrossRef]
  28. Guzewich, S.D.; Toigo, A.D.; Kulowski, L.; Wang, H. Mars Orbiter Camera climatology of textured dust storms. Icarus 2015, 258, 1–13. [Google Scholar] [CrossRef]
  29. Malin, M.C.; Danielson, G.E.; Ingersoll, A.P.; Masursky, H.; Veverka, J.; Ravine, M.A.; Soulanille, T.A. Mars Observer Camera. J. Geophys. Res. Atmos. 1992, 97, 7699–7718. [Google Scholar] [CrossRef]
  30. Malin, M.C.; Edgett, K.S. Mars Global Surveyor Mars Orbiter Camera: Interplanetary cruise through primary mission. J. Geophys. Res. Atmos. 2001, 106, 23429–23570. [Google Scholar] [CrossRef]
  31. Cantor, B.A.; James, P.B.; Caplinger, M.; Wolff, M.J. Martian dust storms: 1999 Mars Orbiter Camera observations. J. Geophys. Res. Atmos. 2001, 106, 23653–23687. [Google Scholar] [CrossRef]
  32. Guzewich, S.D.; Toigo, A.D.; Wang, H. An Investigation of Dust Storms Observed with the Mars Color Imager. Icarus 2017, 289, 199–213. [Google Scholar] [CrossRef]
  33. Tan, X.; Liu, J.; Zhang, X.; Yan, W.; Chen, W.; Ren, X.; Zuo, W.; Li, C. Design and Validation of the Scientific Data Products for China’s Tianwen-1 Mission. Space Sci. Rev. 2021, 217, 69. [Google Scholar] [CrossRef]
  34. Pla-García, J.; Rafkin, S.C.R.; Martinez, G.M.; Vicente-Retortillo, Á.; Newman, C.E.; Savijärvi, H.; de la Torre, M.; Rodriguez-Manfredi, J.A.; Gómez, F.; Molina, A.; et al. Meteorological Predictions for Mars 2020 Perseverance Rover Landing Site at Jezero Crater. Space Sci. Rev. 2020, 216, 148. [Google Scholar] [CrossRef] [PubMed]
Figure 1. The primary and backup landing sites of the Tianwen-1 mission in the south of Utopia Planitia. The yellow polygon is the tentative landing area and the two yellow triangles stand for two landing sites within the landing ellipses (two red circles). The base map is the elevation rendering map (units in meters) derived from the Mars Global Surveyor (MGS) and Mars Orbit Laser Altimeter (MOLA) DEM data in the simple cylindrical projection.
Remotesensing 14 00008 g001
Figure 2. The life circle of a dust storm sequence lasted for four MOC images in MY28 with Ls = 14°, 14.9°, 15.4° and 15.9°. (a) The dust storm from the northern polar region in the formation stage. (b) The diffusion stage of the dust storm. (c,d) show the dissipation stage of the dust storm. The two landing ellipses are marked with red circles. (e) The dust storm changed from formation stage (yellow polygon, MY28, Ls = 14°) to diffusion stage (blue polygon, MY28, Ls = 14.9°) in the MOC image (MY28, Ls = 19°). The black dotted arrow shows the approximate moving distance of the two dust storms.
Remotesensing 14 00008 g002
Figure 3. The dust storms identified by MDGMs in MY24-32. The center of the black circle represents the center of the dust storm, and the area of the circle is equal to the area of the dust storm. The red polygon and the two yellow circles are the tentative landing area and the landing ellipses of the Tianwen-1 mission. The green ellipse A shows the dense dust storm region during Ls = 50–90°. The base map is an elevation rendering map derived from MGS MOLA DEM data with a simple cylindrical projection.
Remotesensing 14 00008 g003
Figure 4. The MoRIC mosaic on March 24 and the two dust storms 3-24-1 and 3-24-2 (blue polygons in the north). Due to the quality and range limitations of the MoRIC mosaic, dust storms may not be fully displayed and identified. The yellow polygon and yellow circles show the tentative landing area and the two landing ellipses of the Tianwen-1 mission.
Remotesensing 14 00008 g004
Figure 5. The MoRIC mosaic on March 26 and only one dust storm 3-26-1 (green polygon in the middle). Due to the quality and range limitations of the MoRIC mosaic, dust storm 3-26-1 may not be fully displayed and identified. The yellow polygon and yellow circles show the tentative landing area and the two landing ellipses of the Tianwen-1 mission.
Remotesensing 14 00008 g005
Figure 6. The dust storms are identified on March 24 and 26 by MoRIC mosaic. The base map is Viking MDIM 2.0 at ~231 m resolution. The dust storm 3-26-1 and 3-24-2 are from the same dust storm sequence and the moving direction of dust storm 3-24-2 is pointed out by the yellow arrow. The yellow polygon and yellow circles show the tentative landing area and the two landing ellipses of the Tianwen-1 mission.
Remotesensing 14 00008 g006
Figure 7. The MoRIC mosaic on May13 with no dust storm in the study area. The yellow polygon and yellow circles show the tentative landing area and the two landing ellipses of the Tianwen-1 mission.
Remotesensing 14 00008 g007
Table 1. Eight Mars years’ abbreviations, start and end time, and their corresponding Earth’ date.
AbbreviationsStart TimeEnd TimeEarth’ DateCamera
MMY24 Ls = 150°MY25 Ls = 111°6 June 1999 to 2 February 2001MOC
EMY25 Ls = 111°MY26 Ls = 116°2 February 2001 to 1 January 2003
RMY26 Ls = 116°MY27 Ls = 123°1 January 2003 to 2 December 2004
SMY27 Ls = 123°MY28 Ls = 122°2 December 2004 to 18 October 2006
PMY28 Ls = 122°MY29 Ls = 120°18 October 2006 to 1 September 2008MARCI
BMY29 Ls = 120°MY30 Ls = 112°1 September 2008 to 2 July 2010
GMY30 Ls = 112°MY31 Ls = 118°2 July 2010 to 1 June 2012
DMY31 Ls = 118°MY32 Ls = 110°1 June 2012 to 1 April 2014
Table 2. Number and type of dust storms entering two landing ellipses during Ls = 0–50° and 50–90°. N and P stand for northern pole region and protogenous, respectively.
MYPrimary EllipseBackup EllipseNPLs = 0–50°Ls = 50–90°In Total
NPNP
M05102710502237
E010391224315951
R12461345011359
S24451744011762
P04321632401248
B03112011201831
G02181718001735
D13291526031544
In total433230137224143367
Table 3. Comparison and verification of dust storm events in our results and MDAD.
MYOur ResultsMDADComparison Result
Dust StormSequenceDust StormSequenceDust StormSequence
M37012012/12, 0, 25100%
E51131130/31, 1, 21100%
R59137137/37, 0, 22100%
S62252251/52, 1, 11100%
P48154143/54, 11, 5100%
B31229229/29, 0, 2100%
G35141131/41, 10, 4100%
D44242238/42, 4, 6100%
Table 4. Duration of dust storms in MY24-32 in the study area.
MYDuration (the Number of MDGMs, Ls~0.5°)
12345
M261010
E364220
R275310
S226310
P256001
B122000
G345010
D183110
In total20032971
Table 5. Details of dust storms detected by MoRIC mosaic from March to May 2021.
IndexNameCenter (lat, lon)Area (km2)Ls (°)RangeStageSequence/SingleTextured
13-6-163.2°N, 86.1°E529,148.912.949.4–79.4°N, 59.8–116.5°Eformationsequence, 3-8-2 coming from 3-6-1Y
23-8-247.0°N, 101.2°E200,247.613.842.2°–50.3°N, 91.8–112.6°EdiffusionY
33-8-167.4°N, 96.4°E668,274.213.860.4°–75.3°N, 62.8°–118.5°EformationsingleY
43-24-161.3°N, 130.1°E122,99821.457.4°–64.5°N, 123.1°–137.2°EformationsingleY
53-24-250.0°N, 116.1°E702,17521.441.5°–58.8°N, 101.0°–133.4°Ediffusionsequence, 3-26-1 coming from 3-24-1Y
63-26-136.6°N, 109.5°E193,34822.332.6°–40.5°N, 103.2°–115.4°EdissipationY
74-1-154.6°N, 104.9°E187,242.225.151.6°–57.4°N, 95.4°–114.7°Ediffusionsequence, 4-3-1 coming from 4-1-1Y
84-3-150.3°N, 107.5°E170,608.126.146.2°–54.2°N, 99.5°–115.9°EdissipationN
Publisher’s Note: MDPI stays neutral with regard to jurisdictional claims in published maps and institutional affiliations.

