Article

Influence of Open-Pit Coal Mining on Ground Surface Deformation of Permafrost in the Muli Region in the Qinghai-Tibet Plateau, China

1
Key Laboratory of Remote Sensing of Gansu Province, Northwest Institute of Eco-Environment and Resources, Chinese Academy of Sciences, Lanzhou 730000, China
2
School of Civil Engineering, Northeast Forestry University, Harbin 150040, China
3
State Key Laboratory of Frozen Soil Engineering, Northwest Institute of Eco-Environment and Resources, Chinese Academy of Sciences, Lanzhou 730000, China
*
Author to whom correspondence should be addressed.
Remote Sens. 2022, 14(10), 2352; https://doi.org/10.3390/rs14102352
Submission received: 13 April 2022 / Revised: 9 May 2022 / Accepted: 10 May 2022 / Published: 12 May 2022

Abstract

:
The Qinghai-Tibet Plateau (QTP) is the largest mid-to low latitude and high-altitude permafrost. Open-pit coal mining and other activities have caused serious damage to the alpine ecological environment and have accelerated the degradation of permafrost on the QTP. In this study, the influence of open-pit coal mining on the time series ground surface deformation of the permafrost in the Muli region of the QTP was analyzed from 19 January 2018 to 22 December 2020 based on Landsat, Gaofen, and Sentinel remote sensing data. The primary methods include human-computer interactive visual interpretation and the small baseline subsets interferometric synthetic aperture radar (SBAS-InSAR) method. The results showed that the spatial distribution of displacement velocity exhibits a considerably different pattern in the Muli region. Alpine meadow is the main land use/land cover (LULC) in the Muli region, and the surface displacement was mainly subsidence. The surface subsidence trend in alpine marsh meadows was obvious, with a subsidence displacement velocity of 10–30 mm/a. Under the influence of changes in temperature, the permafrost surface displacement was characteristics of regular thaw subsidence and freeze uplift. Surface deformation of the mining area is relatively severe, with maximum uplift displacement velocity of 74.31 mm/a and maximum subsidence displacement velocity of 167.51 mm/a. Open-pit coal mining had resulted in the destruction of 48.73 km2 of natural landscape in the Muli region. Mining development in the Muli region had increased the soil moisture of the alpine marsh meadow around the mining area, resulting in considerable cumulative displacement near the mining area and the acceleration of permafrost degradation.

1. Introduction

As an important and large part of the cryosphere, permafrost is significantly affected by global warming [1,2]. The Qinghai-Tibet Plateau (QTP) is the largest area of permafrost in the mid-to low latitude and with the highest elevation across the world [3]. With increasing global warming, the permafrost in the QTP has been degrading at a large scale [4,5,6,7,8,9,10]. The landscape structure and hydrothermal regimes of underlying permafrost have changed due to extensive human activities such as mining development, engineering construction, and urban expansion, which affect the soil water content and heat exchange process and intensify the degradation of permafrost [11,12,13,14]. As a result, there is increased surface deformation and active layer thickness, as well as melting of ground ice, which further accelerated the occurrence of a series of thermokarst, such as thermokarst lakes and thaw slump. This poses a significant threat to regional human infrastructure, ecological environment, and water security [15,16,17,18]. In a permafrost region, seasonal freeze-thaw cycles likely result in upward and downward movements of the ground surface [19]. Therefore, long-term and large-scale surface deformation monitoring is crucial as it provides insight about the stability evaluation of engineering facilities, the study of eco-hydrological processes, and the prevention and control of freezing-thawing disasters in permafrost regions [20,21,22].
Contemporary ground surface monitoring techniques such as levelling, surveying, and global navigation satellite systems (GNSSs) have the advantage of high precision in deformation monitoring in permafrost regions. However, it is difficult to monitor permafrost deformation on a large scale due to the necessities of field deployment and relatively sparse monitoring sites [21,23,24,25]. Owing to rapid advances in remote sensing technology, new techniques are available for permafrost monitoring. In particular, a spaceborne interferometric synthetic aperture radar (InSAR) can monitor global permafrost deformation with high precision and resolution without laying ground control points [26,27,28]. Differential InSAR (D-InSAR) measures phase shifts between repeat synthetic aperture radar (SAR) acquisitions of a location to obtain the ground displacement [29]. The D-InSAR is widely used to detect surface deformation caused by freeze-thaw-related ground motion over permafrost regions [19,29,30]. However, the accuracy of D-InSAR is susceptible to temporal and perpendicular decorrelation and atmospheric disturbances [31]. It is more challenging to apply D-InSAR in a heterogeneous landscape and areas with excess vegetation cover [32]. Newly developed time series InSAR technologies such as persistent scatterer InSAR (PS-InSAR) and small baseline subsets InSAR (SBAS-InSAR) [31,33] can overcome temporal and perpendicular decorrelation and obtain continuous and accurate surface deformation information of long time series. These are widely used in permafrost deformation monitoring [32,34,35,36,37]. Based on data from satellites such as Sentinel-1, ENVISAT, and ALOS PALSAR, many engineering activities and typical areas of surface deformation in the permafrost region of the QTP have been studied [20,38,39,40]. A series of improved SBAS-InSAR surface deformation monitoring models have been developed, such as those considering climate factors [20], distributed scatters [38], intermittent coherence [39], and seasonal sinusoidal model [40]. The improved SBAS-InSAR method is used to obtain the highly accurate surface deformation of permafrost regions in the QTP. For example, the surface deformation over the permafrost area of Dangxiong-Yangbajing in the southern QTP was revealed to be 3.6–5 cm [20]. The active layer has alternative frost heave and thaw settlement (4.7–8.4 cm) in the natural permafrost region of the Fenghuoshan Mountains in the QTP [39].
The Muli region is located in the permafrost region of the Qilian Mountains in the northeast margin of the QTP, and it belongs to the alpine permafrost zone of the Altun-Qilian Mountains with relatively warm temperature and high altitude. This area is dominated by ice-rich permafrost, ice-saturated permafrost, and ice with soil inclusions [3,41,42]. The permafrost with thickness ranges from 30 to 90 m here is vulnerable to global warming and human activities. Coal mining in the Muli region accelerated the occurrence of thermokarst, which had significant effects on the surrounding environment and water security, and led to significant degradation of the permafrost. Moreover, the coal mining threatens the safety of human life and infrastructure construction.
In this study, the influence of open-pit coal mining on permafrost in the Muli region of the QTP was investigated. Based on Landsat, Gaofen, and Sentinel remote sensing data, the process of coal mining and land use/land cover (LULC) structure in the Muli region were analyzed. Combined with the results of long-term surface deformation monitoring using SBAS-InSAR, the influence of mining development on the surrounding permafrost was evaluated. This study reported the degradation of permafrost under the background of global warming. Moreover, it may provide scientific basis for the protection, restoration, and sustainable development of alpine ecology in the Qilian Mountains.

2. Materials and Methods
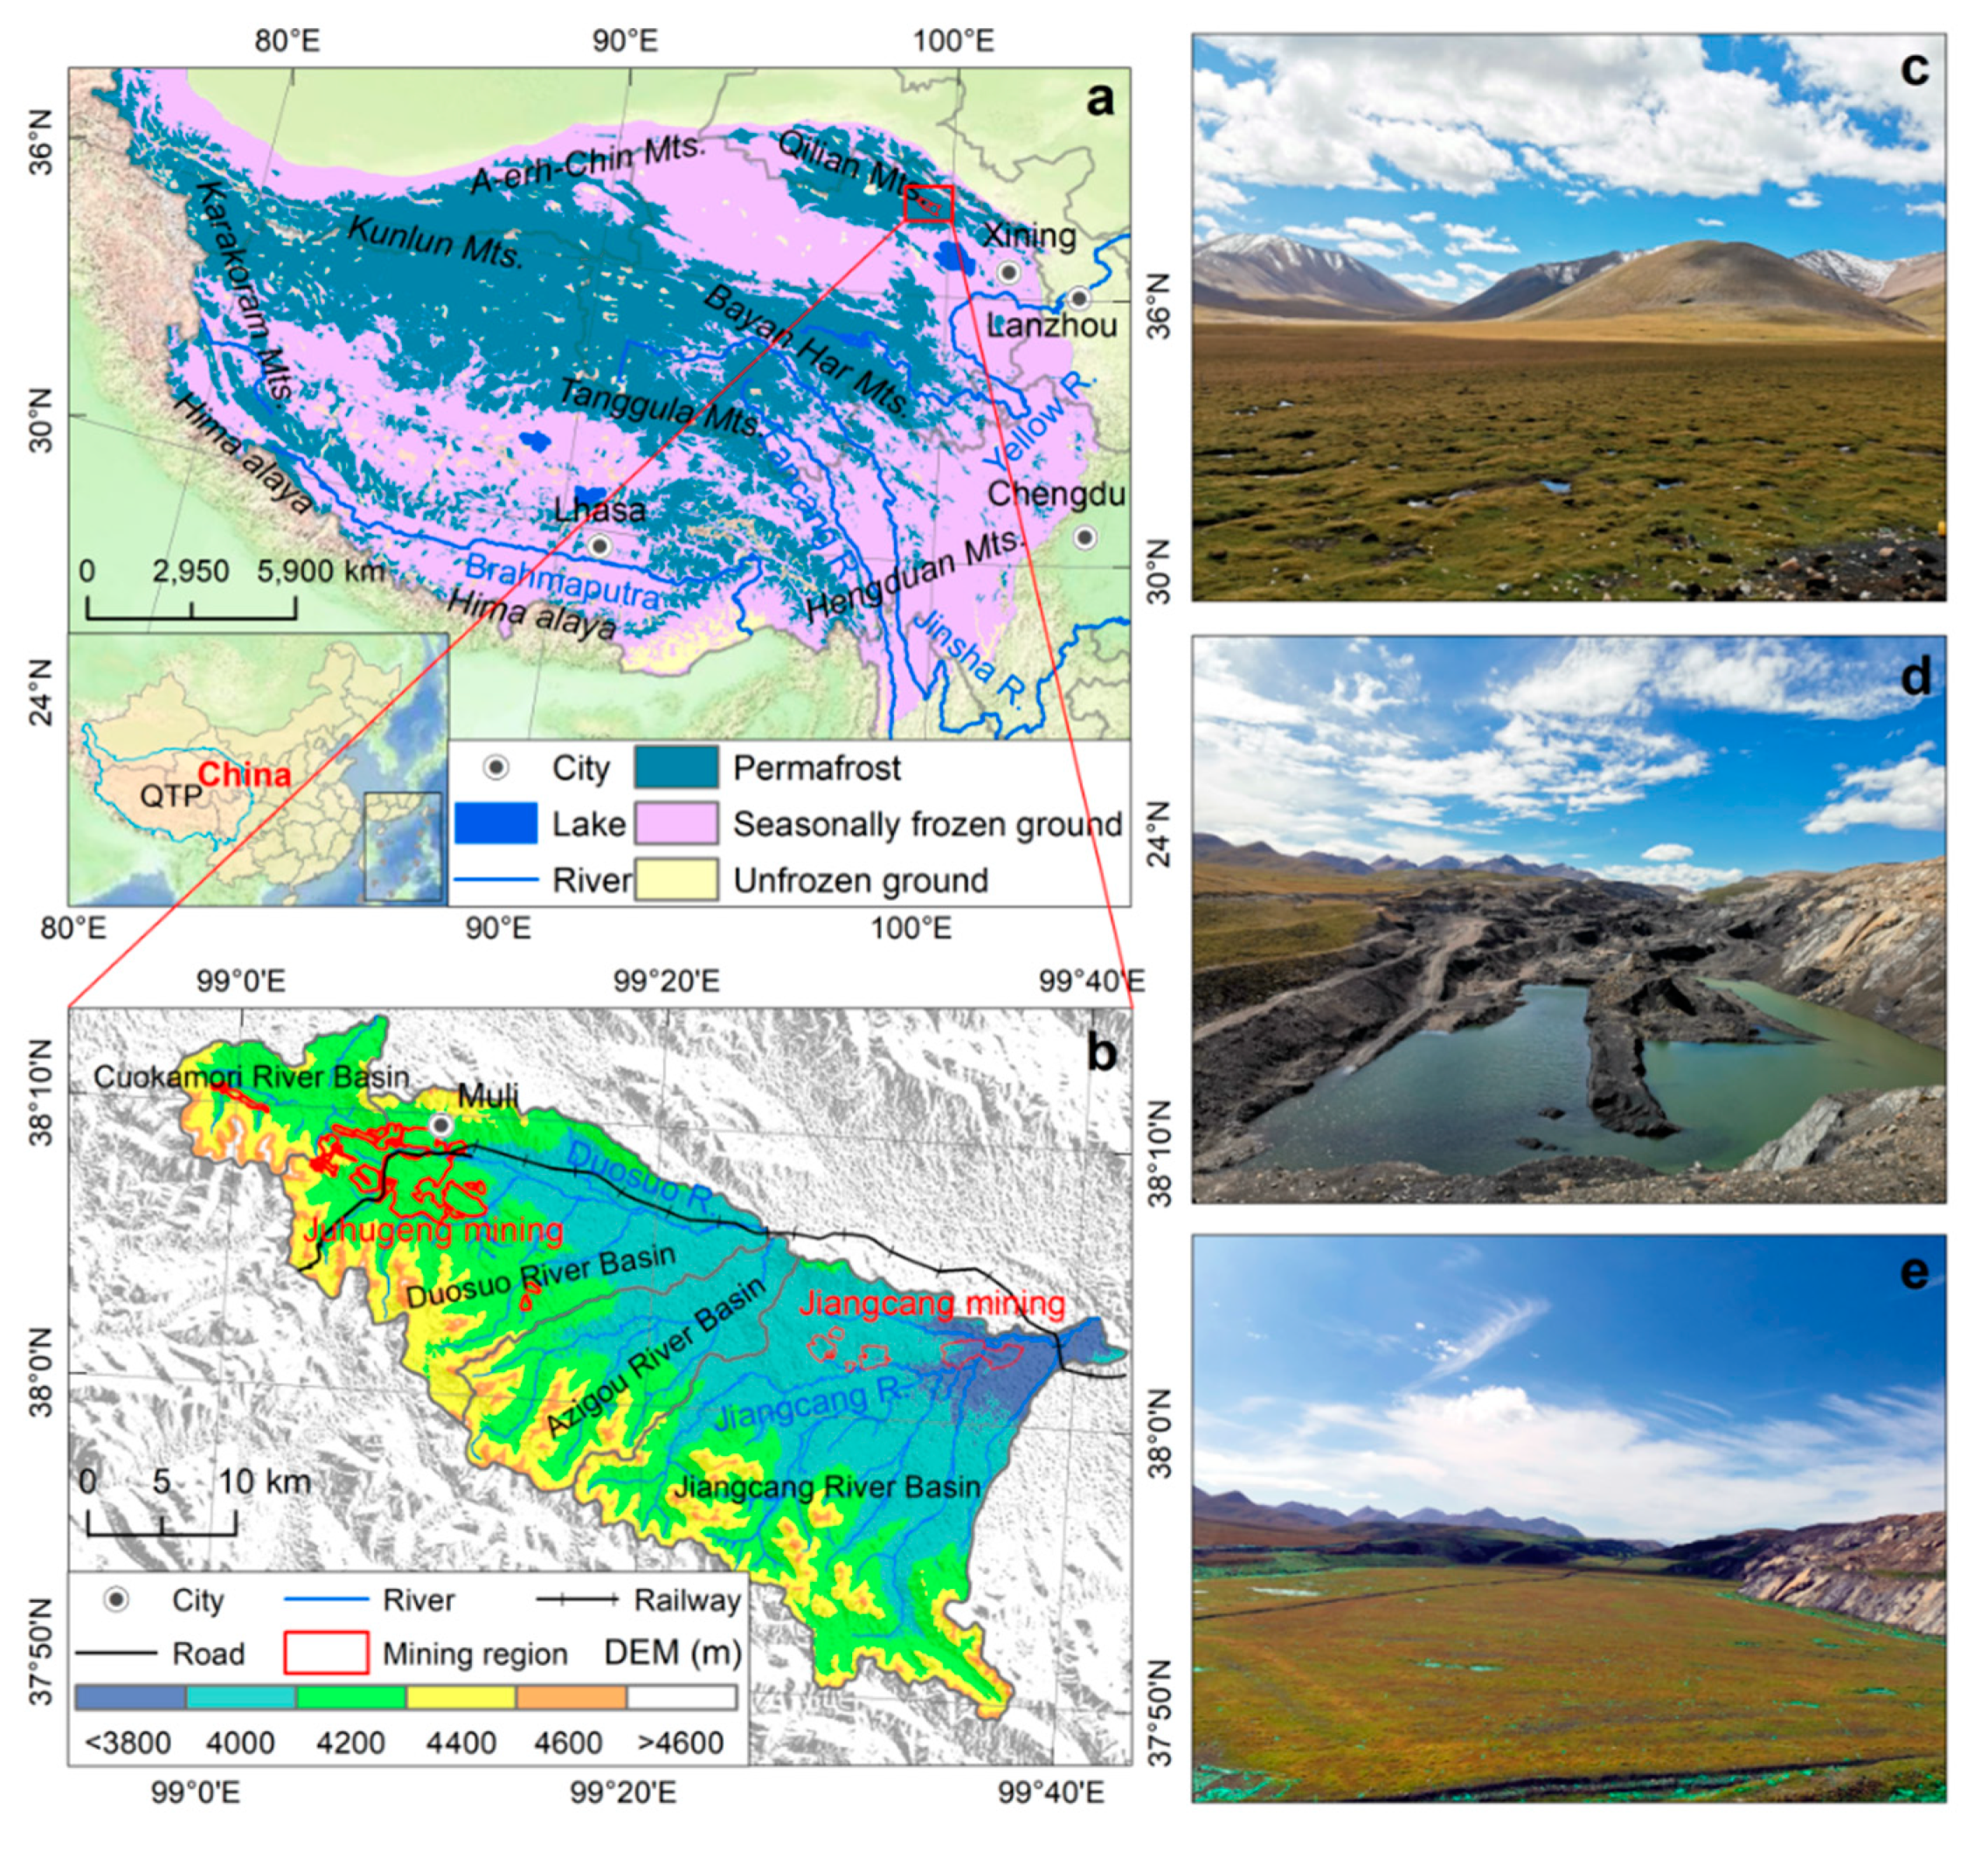
2.1. Study Region

The Muli region is located in the upper reaches of the Datong River, a tributary of the Yellow River, in the Qilian Mountains of the QTP. The geographical extent of the study region is 98°56′42″–99°42′27″E and 37°49′29″–38°13′26″N, and its altitude ranges from 3683 to 4844 m. Muli is home to four drainage basins from east to west, namely, Jiangcang, Azigou, Duosuo, and Cuokamori (Figure 1). The study region has an alpine continental climate [43], with the mean annual air temperature of −4.3 to 3.6 °C and annual precipitation of 466.9–656.2 mm from 2017 to 2019. All of the river systems originate from the Datong River Basin, the major tributaries are Duosuo and Jingcang Rivers, and there are many small lakes in the area. The Muli region is an important water source of Datong River Basin and one of the most important wetland and ecological environment protection areas in China [42]. The coal mines in the Muli region are the largest open-pit coal mines on the QTP, and this region is rich in coal resources. At present, the two main mines are Juhugeng (JHG) mining area (mining began in 2003) and Jiangcang (JC) mining area (mining began in 2004) [44]. JHG mining area is located in an intermontane basin of Duosuo River Basin with an altitude of 4000–4200 m. The terrain is relatively transitional, and the ground surface is covered by dense alpine meadow. JC mining area is located in the intermontane basin of Jiangcang River Basin with an altitude of 2800–3900 m, and it is dominated by alpine marsh meadow [43].

2.2. Data

2.2.1. Sentinel-1 Data

We collected 75 C-band (wavelength = 5.63 cm) single look complex (SLC) images from Sentinel-1A, which were acquired in the interferometric wide (IW) swath mode with VV polarization from 19 January 2018 to 22 December 2020. All scenes were acquired in an ascending orbit, and the incidence angles were approximately 36.83°. The time interval passed between capturing the two images of the same area was 108 days from 26 April 2020 to 12 August 2020 and 60 days from 19 June 2019 to 18 August 2019. The frequency of revisiting other images was 12 or 24 days. To improve the registration accuracy of Sentinel-1A images and remove systematic errors caused by orbit errors, precise orbit ephemerides (POD) data corresponding to the time of Sentinel-1A image data were used. The positioning accuracy of the POD data was >5 cm. Sentinel-1A data were obtained from the Alaska Satellite Facility (ASF) data search Vertex (https://search.asf.alaska.edu (accessed on 20 October 2021)).

2.2.2. Landsat and Gaofen Data

To analyze the historical development process of the mining area, Landsat thematic mapper (TM) and operational land imager (OLI) remote sensing images with a spatial resolution of 30 m were used to extract the boundary of the mining area from 2003 to 2020. The images of Landsat in the Muli region were obtained from the United States Geological Survey (USGS) (https://earthexplorer.usgs.gov (accessed on 1 September 2021)). LULC in the Muli region in 2020 was extracted from Gaofen-1 remote sensing images with a spatial resolution of 2 m. The images of Gaofen were obtained from the China Centre for Resources Satellite Data and Application (http://www.cresda.com (accessed on 1 September 2021)).

2.2.3. Other Data

Data for the digital elevation model (DEM) were obtained from the Shuttle Radar Topography Mission (SRTM) (spatial resolution of 30 m) and the USGS (https://earthexplorer.usgs.gov (accessed on 20 October 2021)). DEM data were used to simulate the topographic phase and geocode displacement results.
The meteorological information consisting of daily temperature and precipitation obtained from the meteorological station in Muli Town. It was used to analyze the relationship between daily mean temperature and daily cumulative precipitation and time series displacement.

2.3. Methods

2.3.1. Human-Computer Interactive Visual Interpretation

Based on Landsat and Gaofen remote sensing images, in combination with the shape, spectrum, texture, and other features of land class, the mining development process from 2003 to 2020 and the LULC of the Muli region in 2020 were extracted based on human-computer interactive visual interpretation. LULC was divided into natural and human activities. Natural land was divided into grassland (alpine meadow), water bodies (river, lake, and pit pond), and unused land (bottomland, bare land, and bare rock). Human activity-related land was divided into mining areas (mine building, mine, finished coal, slag, mine water bodies, and grassland restoration), roads, and settlements.

2.3.2. SBAS-InSAR

SBAS-InSAR is based on interferometric pairs of multiple master images. The deformation information of time series in the study area was recovered based on high coherence points [31]. SBAS-InSAR considers the temporal and perpendicular baseline distribution of images in the selection of interferometric pairs. It can overcome the aforementioned strong temporal decorrelation over permafrost terrain and calculate high-precision time series surface deformation [32].
SBAS-InSAR used m Sentinel-1A images from the same orbit in the same region at different times. According to the set temporal and perpendicular thresholds, n interferograms were generated. A relatively stable target point was selected as the reference pixel point to phase unwrapping of n multi-view differential interferograms. A pixel point (x, r) was indicated in the i differential interferometry phase diagram, and the unwrapped differential interferometry phase can be expressed using Equation (1):
Δ φ i x , r = φ t B , x , r φ t A , x , r = 4 π λ d t B , x , r d t A , x , r + Δ φ i , t o p o x , r + Δ φ i , a r b x , r + Δ φ i , r e s x , r
where tB and tA are the acquisition time of Sentinel-1A master and slave images, respectively; X and r are the pixel azimuth and range direction coordinates, respectively. We assumed that the surface displacement of radar line-of sight (LOS) in this area at reference time t0 was equal to 0. d(tB,x,r) and d(tA,x,r) are the LOS cumulative displacement of the master and slave images relative to t0, respectively; λ is the central wavelength of Sentinel-1A; ∆φi,arb(x,r) is the orbit error phase; ∆φi,res(x,r) is the residual phase, including atmospheric delay, phase noise, high-pass deformation component, and so on; and ∆φi,topo(x,r) is the terrain residual phase, and it is expressed using Equation (2):
Δ φ i , t o p o x , r = 4 π λ B Δ h R i s i n θ i
where ∆h is the elevation error; Ri is the slope distance of Sentinel-1A master image; θi is the incident angle of Sentinel-1A master image; and B is the vertical baseline distance of the interferometric pairs.
SBAS-InSAR was utilized to calculate the mean displacement velocity and time series displacement in the Muli region. The image from 19 May 2018 was selected as the master image. After image clipping, sub-pixel precision level registration was completed based on the master image. To avoid low robustness and accuracy of the final singular value decomposition (SVD) solution owing to the isolation of small baseline sets, the temporal baseline threshold was set to 120 days, and the perpendicular baseline threshold was set to 2% of the critical threshold. Interferometric pairs with low coherence or poor unwrapping were deleted and 249 groups were retained. To suppress the decoherence noise in the interferogram and improve the coherence of the interferogram, 1 × 4 multi-view time and Goldstein adaptive filtering were used. Delaunay minimum cost flow (Delaunay MCF) method was used to complete phase unwrapping. A pixel with coherence coefficient > 0.2 was selected to estimate the displacement velocity and residual topography. After estimating and removing atmospheric delay, the filter window in the perpendicular and temporal domains was set for 1200 and 365 days, respectively.

3. Results

3.1. LULC Structure and Mining Development Process in the Muli Region

The LULC of the Muli region in 2020 interpreted by Gaofen-1 image is shown in Figure 2a; the alpine meadow area is the largest (904.55 km2) in the natural class, accounting for 75.69% of the total area in the study region. The bare rock area is 170.80 km2, accounting for 14.29% of the total area, and it is mainly distributed in mountainous areas with high elevations. The Bare land, bottomland, and water bodies comprise small areas of 40.03 km2, 13.53 km2, and 12.07 km2, respectively (Figure 2b). Mining area is the largest area affected by human activities. The area of natural surface damage due to coal mining is 48.73 km2, which comprises 14.22 km2 mine area and 11.01 km2 slag area. Mine building, finished coal, and mine water bodies have relatively small areas. In recent years, the ecological environment of the mining area has been recovered in the Muli region, with 18.84 km2 mining area recovered to grassland. Areas occupied by roads and settlements are less, with an area of 4.71 km2 and 0.64 km2, respectively (Figure 2c).
Among the mining development processes from 2003 to 2020 (Figure 2d), the development of JHG and JC mining areas was mainly concentrated from 2003 to 2015, with development rates of 2.72 km2/a and 1.05 km2/a, respectively. JHG mining caused more damage to the natural surface. In 2015, the area of JHG mining was 23.61 km2 more than that of JC mining. Under the grass planting ecological restoration and management of the ecological environment of the mining area after 2015, some mines have been backfilled. This is also attributed to the reduced rate of mining.

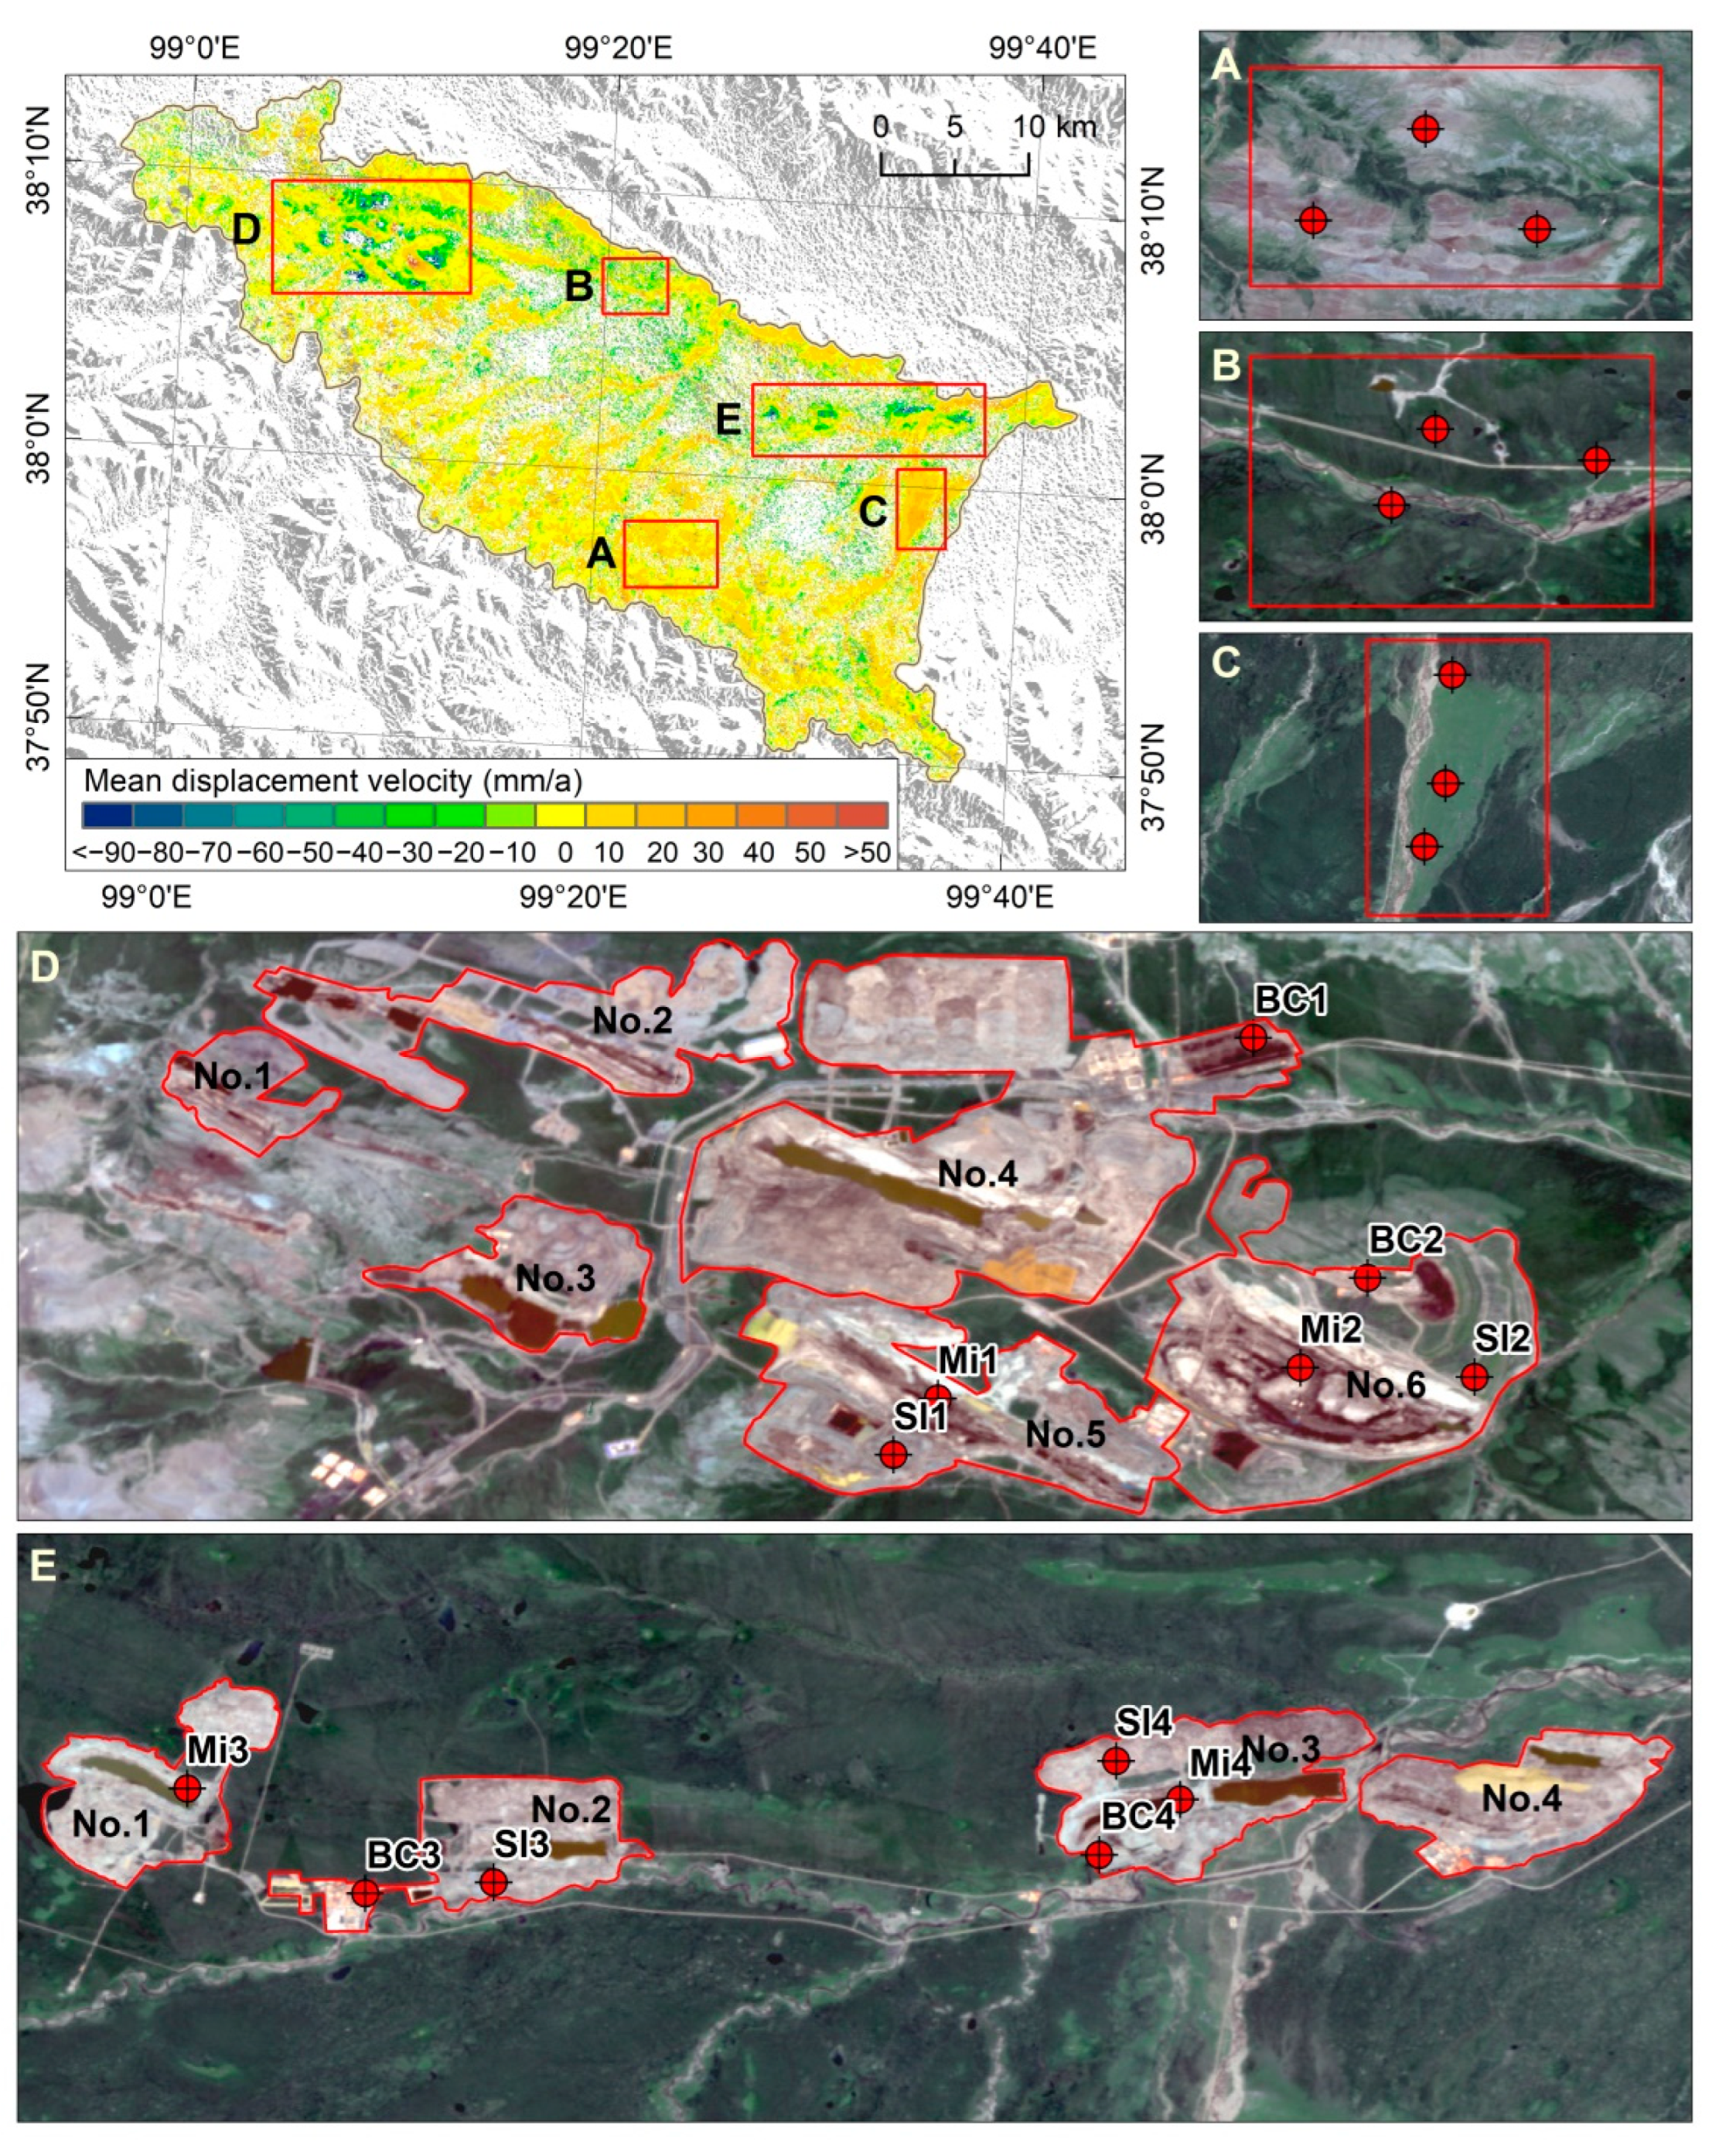
3.2. Surface Displacement Velocity and Time Series Displacement in the Muli Region

Deformation area was 707.93 km2, accounting for 59.28% of the total area of the Muli region. Considerable incoherence was observed in the alpine marsh meadow in the intermontane basin and in some mining areas. The surface displacement in the Muli region was mainly attributed to subsidence, accounting for 76.36% of the total deformation area. There were obvious differences in surface deformation between natural and human activities (Figure 3).

3.2.1. Surface Displacement Velocity and Time Series Displacement of Natural Type

The displacement velocity of natural type was between −30 and 10 mm/a. The main surface displacement was subsidence, accounting for 75.73% of the natural deformation area. The subsidence of alpine marsh meadow in the intermountain basin was the most significant, and the mean surface displacement velocity was between −30 and −10 mm/a. The surface of bare rock in the middle and high mountains in the southern area of Muli was relatively stable, and the mean surface displacement velocity was between −10 and 10 mm/a. In Jiangcang River Basin, the alpine meadow distributed along the river showed a tendency of uplifting, and it was surrounded by the alpine marsh meadow.
According to the characteristic point time series displacement of three typical regions, namely, the stable region of mountain bare rock (A, mean displacement velocity −0.87 mm/a), the subsidence region of alpine marsh meadow (B, mean displacement velocity −12.40 mm/a), and the uplift region of alpine meadow (C, mean displacement velocity 2.85 mm/a) (Figure 4), the surface displacement in bare rock region fluctuated around zero, and there was no obvious periodic deformation trend. The time series displacement of alpine marsh meadow presented a trend of periodic and linear slow subsidence. The time series displacement of alpine meadow showed a trend of periodic and linear slow uplift. Both alpine marsh meadow and alpine meadow are characteristics of obvious freeze-thaw cycles on permafrost surface. Combined with the temperature and precipitation data of Muli Town meteorological station, the annual periodic thaw process in the permafrost region in 2018–2020 started from the end of April or early May to the end of September or early October, and the surface subsidence reached the maximum value. The freeze process started in early October and continued until early May of the following year. The change of permafrost displacement was observed to lag behind climate change. The maximum temperature and precipitation appeared at the end of July or early August, and the maximum time lag of surface thaw subsidence was approximately 60 days. The minimum temperature and precipitation appeared in the end of January or early February, and the maximum time lag of surface freeze uplift was approximately 90 days.

3.2.2. Surface Displacement Velocity and Time Series Displacement of Mining Area

Due to frequent human activities, most areas in JHG mining area were incoherent. The displacement in the center of the mine was mainly uplifted (Figure 3). The point with the maximum uplifted displacement was located at the center of the mine in coal mine No. 3, with a mean displacement velocity of 74.31 mm/a. The surface uplift displacement velocity decreased from the center of the mine to the surrounding area. There was an obvious subsidence displacement at the mine edges of coal mines No. 4, No. 5, and No. 6. The slag of all mine showed obvious subsidence displacement. The maximum subsidence point was located in coal mine No. 5 with a mean displacement velocity of −167.51 mm/a. The displacement of mine building and finished coal was mainly subsidence, but its displacement was smaller than that of slag.
The incoherence area of JC mining area was mainly located in the slag of coal mines No. 1 and No. 3, and an obvious ecological restoration effect was observed in these mines. There was no obvious surface uplift displacement in all mine areas, and a small area at the edge of the mine was slightly uplifted. The maximum uplift displacement was located in the slag area in the north of coal mine No. 1, with a mean displacement velocity of 56.70 mm/a. The other slags were dominated by subsidence displacement. The maximum subsidence displacement velocity was −118.83 mm/a in the southern slag area of coal mine No. 1 (Figure 3).
The typical points of mine, slag, mine building, and finished coal area are shown in Figure 5. The times series displacement at the typical points in the mining area exhibited no obvious periodic change rules of freeze uplift and thaw subsidence. However, in winter, when the temperature was the lowest, the typical points of the BC1-BC4 showed that the subsidence displacement reached the maximum value and then started decreasing slowly. All of the displacements are in the state of subsidence. An increase in fluctuation was observed, and the maximum displace was −80.4 mm. The displacement of the typical points of Mi1–Mi4 showed uplift and linearly increased, and the maximum displacement of uplift was 23.9–106.5 mm. The displacement of the typical points of Sl1–Sl4 showed subsidence and linearly increase. The displacement was higher than the displacement of other typical points, and the maximum displacement was −157.0 to −250.3 mm.

3.3. Mean Cumulative Displacement in Permafrost Region Outside the Mining Area

Further, the influence of open-pit coal mining on permafrost surface deformation in the Muli region was analyzed and evaluated. Based on the boundaries of JHG and JC mining areas, a total of 50 buffer gradient regions (within 5 km outside the mining area) were set at 100 m intervals. The mean value of cumulative displacement was calculated in the buffer gradient region from January 2018 to December 2020. The mean value of cumulative displacement varying with buffer distance was analyzed.
The mean cumulative displacement fluctuated between −23.6 mm (0–100 m) and −19.3 mm (300–400 m), with an average value of −21.4 mm in the 0–700 m buffer zones of JHG mining area. When the buffer distance exceeded 700 m, the mean cumulative displacement decreased with increasing elevation from −21.4 mm (600–700 m) to −8.1 mm (2100–2200 m), and the changing rate was 0.8 mm per 100 m. When the buffer distance exceeded 2200 m, the mean cumulative displacement changed slightly and fluctuated between −14.0 mm and −7.5 mm (Figure 6a). The mean cumulative displacement in the 0–2200 m buffer zones of JC mining area fluctuated between −20.6 mm (1600–1700 m) and −7.5 mm (500–600 m), with an average value of −15.0 mm. When the buffer exceeded 2200 m, the mean cumulative displacement decreased with increasing altitude from −17.3 mm (2100–2200 m) to 0.1 mm (3000–3100 m), with an increase rate of 1.8 mm per 100 m. When the buffer exceeded 3100 m, the mean cumulative displacement varied only slightly and fluctuated from −5.9 mm to 0.1 mm (Figure 6b). Field investigations revealed that the JHG and JC mining areas are located in the valley basin region, and the surrounding area is mainly alpine marsh meadow. The development of open-pit coal mines transformed and changed the runoff path of surface water. The water discharged from the slag mountain now flows directly to the alpine marsh meadow nearby. Furthermore, water-retaining walls were set up around the mine, which led to accumulation of water around the mine into lakes and meadows, increasing soil moisture around the mine (Figure 7). This phenomenon led to a relatively high mean cumulative displacement around the mining area and accelerated the degradation rate of permafrost.

4. Discussion

4.1. Precision Analysis of Surface Deformation Monitoring

The surface deformation obtained through SBAS-InSAR technology was improved by increasing the temporal and perpendicular baseline thresholds. This approach can effectively reduce the incoherence and high phase error of images during calculation, and thus, the monitoring accuracy of surface deformation can reach the millimetre scale [31,46]. This method can be effectively applied to the analysis of mining areas and permafrost surface deformation. From January 2018 to December 2020, the surface displacement velocity in the Muli region in the QTP ranged from −30 mm/a to 10 mm/a, and its displacement velocity was similar to that of Yeniugou (−30 mm/a to 10 mm/a, October 2014 to October 2016) [38], of Beiluhe (−20 mm/a to 20 mm/a, June 2007 to December, 2010) [47], and of Qinghai-Tibet Railway (−30 mm/a to 15 mm/a, March 2017 to March 2020) [48] in the permafrost regions of the QTP.
Surface deformation in permafrost region is complexly affected by vegetation, topography, soil texture, ground ice content, unfrozen water content, and human activities [40,49,50]. The displacement velocity and time series of displacement of permafrost varied with different LULC [40]. In alpine meadow area with dense vegetation cover, permafrost is stable and surface displacement is small [51]. In plain areas where many rivers and lakes dominate in alpine marsh meadow, the soil moisture content is relatively high, and the corresponding surface freeze uplift and thaw subsidence are relatively large [49]. In this study, the mean displacement velocity of the alpine marsh meadow in the Muli region was more than −10 mm/a, and the maximum value was −30 mm/a. Bare rock is mostly located in mountainous areas, whose complex topography and large slope are not conducive to water retention. The unfrozen water content of soil is low, and the surface deformation is small [50]. The mean displacement velocity of bare rock in the Muli region was less than −1 mm/a, and the surface displacement fluctuated within a small range during the year.

4.2. Characteristics of Surface Deformation in Open-Pit Mining Area and Its Influence on Surrounding Permafrost

Human activities exacerbate the surface deformation of permafrost; in particular, open-pit coal mining has more direct and severe influences than linear engineering such as highway and railway [18,43,52,53]. Open-pit coal mining in the Muli region has caused considerable surface deformation as well as the formation of many unstable surfaces. Surface subsidence after mining also disturbs the hydrothermal balance of the surface, which causes the dry-out of surrounding alpine meadow. Thus, the surface thermal radiation changes, and the degradation of permafrost around the mining area is aggravated [54]. In the Muli region, surface deformation in each coal mine was strong, and it was mainly distributed in mine and slag areas. In JC mining area, the slag mountains were mainly characterized by subsidence displacement, and the displacement velocity reached −118.83 mm/a of coal mine No. 1. In JHG mining area, the subsidence displacements were the most significant in slag mountain area, and the maximum displacement velocity was located at the top of the slag mountain, which were −164.87 mm/a and −167.51 mm/a and appeared in coal mines No. 4 and No. 5, respectively. Combined with the changes in the surface landscape in the slag mountain area, backfilling of mines and grass restoration occurred in the slag mountain area. The mining and backfilling of the mine changed the hydrothermal condition of the original natural stratum and the physical properties of the soil [55]. Under the combined influence of the compaction of the original active layer, the compaction of the slag mountain itself, and the insufficient compaction of the surface after backfilling, along with the creep deformation of the permafrost, there was uneven subsidence of the slag mountain and the mine [56,57]. Therefore, mine backfilling, slag hill greening, and natural slope deformation are important factors that lead to large surface deformation of slag hills. The uplift of the bottom of the mine is mainly attributed to the elastic rebound of the overlying soil after excavation. This phenomenon is slow, and it commonly occurs when there are considerable changes in the surface [58].
The development of mines in the Muli region has directly changed the natural geomorphic landscape, the structure, and the freeze-thaw balance of the original permafrost [56]. Mining causes the ground ice to melt, which leads to significant degradation or even disappearance of permafrost in the mining area. The permafrost table continues to deepen under the influence of global warming, and the degradation of permafrost near the table leads to continuous surface subsidence displacement [4,59]. In addition, the destruction of alpine meadow, the change of river system, slope collapse phenomenon, and other related factors, exacerbate the degradation of permafrost around the mining area [60].

5. Conclusions

The Muli region is located in the permafrost region of the QTP. Influenced by global climate change and extensive human activities, the spatial distribution of surface deformation varies significantly. Based on Landsat, Gaofen, and Sentinel satellite remote sensing data, this study analyzed the impact of open-pit coal mine development on surface deformation in the permafrost. Open-pit coal mining in the Muli region has resulted in significant destruction of 48.73 km2 of natural land surface. Based on the analysis of deformation results calculated by SBAS-InSAR, it is determined that the surface deformation of alpine marsh meadow in intermontane basin area is the largest, with the largest contribution of subsidence displacement and the mean displacement velocity between −30 and −10 mm/a. Due to climate change, there are obvious periodic characteristics of thaw settlement and frost heave. The degree of surface deformation is the least in mountain bare rock area. Compared with natural slow deformation, the surface deformation of the mining area is severe, and it is mainly distributed in slag and mining areas. The maximum displacements of typical points in the mining area and slags were 23.9 to 106.5 mm and −157.0 to −250.3 mm, respectively. Open-pit coal mining has significantly exacerbated the surface deformation and accelerated the degradation of permafrost in some surrounding areas. C-band SAR has significant incoherence in areas with high vegetation cover and high soil moisture content, and the deformation in areas with severe outburst in the mining area cannot be monitored. Therefore, there is absence of deformation points in 40.72% of the entire study area. This increased the error and uncertainty of regional deformation results. The deformation calculation methods and data sources will be improved in subsequent studies to obtain deformation results with higher accuracy.

Author Contributions

H.W., Y.Q. and J.Z (Juan Zhang). designed the experiments and wrote the paper; J.Z. (Jinlong Zhang), R.Y., J.G. and S.Z. processed the satellite images and performed the experiments; and J.W. and D.L. reviewed the paper and gave constructive advice. All authors contributed to the redaction of the paper. All authors have read and agreed to the published version of the manuscript.

Funding

This research was funded by the Strategic Priority Research Program of the Chinese Academy of Sciences (XDA20100101), the National Key Research and Development Program of China (Grant No. 2019YFC0507404), and the National Natural Science Foundation of China (NSFC) Program (Grant No. 42101408).

Data Availability Statement

The data presented in this study are available on request from the corresponding author.

Conflicts of Interest

The authors declare no conflict of interest.

References

  1. Gruber, S. Derivation and analysis of a high-resolution estimate of global permafrost zonation. Cryosphere 2012, 6, 221–233. [Google Scholar] [CrossRef] [Green Version]
  2. Nelson, F.E.; Anisimov, O.A.; Shiklomanov, N.I. Subsidence risk from thawing permafrost. Nature 2001, 410, 889–890. [Google Scholar] [CrossRef] [PubMed]
  3. Zhou, Y.W.; Guo, D.X.; Qiu, G.Q.; Cheng, G.D.; Li, S.D. Geocryology in China; Science Press: Beijing, China, 2000; p. 486. (In Chinese) [Google Scholar]
  4. Cheng, G.D.; Zhao, L.; Li, R.; Wu, X.D.; Sheng, Y.; Hu, G.J.; Zou, D.F.; Jin, H.J.; Li, X.; Wu, Q.B. Characteristic, changes and impacts of permafrost on Qinghai-Tibet Plateau. Chin. Sci. Bull. 2019, 64, 2783–2795. (In Chinese) [Google Scholar]
  5. Ding, Y.J.; Zhang, S.Q.; Zhao, L.; Li, Z.Q.; Kang, S.C. Global warming weakening the inherent stability of glaciers and permafrost. Sci. Bull. 2019, 64, 245–253. [Google Scholar] [CrossRef] [Green Version]
  6. Guo, D.L.; Wang, H.J.; Li, D. A projection of permafrost degradation on the Tibetan Plateau during the 21st century. J. Geophys. Res.-Atmos. 2012, 117, D05106. [Google Scholar] [CrossRef]
  7. Luo, D.L.; Jin, H.J.; Jin, X.Y.; He, R.X.; Li, X.Y.; Muskett, R.R.; Marchenko, S.S.; Romanovsky, V.E. Elevation-dependent thermal regime and dynamics of frozen ground in the Bayan Har Mountains, northeastern Qinghai-Tibet Plateau, southwest China. Permafr. Periglac. Process. 2018, 29, 257–270. [Google Scholar] [CrossRef]
  8. Qi, Y.; Li, S.W.; Ran, Y.H.; Wang, H.W.; Wu, J.C.; Lian, X.H.; Luo, D.L. Mapping frozen ground in the Qilian Mountains in 2004–2019 using google earth engine cloud computing. Remote Sens. 2021, 13, 149. [Google Scholar] [CrossRef]
  9. Ran, Y.H.; Li, X.; Cheng, G.D. Climate warming over the past half century has led to thermal degradation of permafrost on the Qinghai–Tibet Plateau. Cryosphere 2018, 12, 595–608. [Google Scholar] [CrossRef] [Green Version]
  10. Wu, Q.B.; Hou, Y.D.; Yun, H.B.; Liu, Y.Z. Changes in active-layer thickness and near-surface permafrost between 2002 and 2012 in alpine ecosystems, Qinghai–Xizang (Tibet) Plateau, China. Glob. Planet. Change 2015, 124, 149–155. [Google Scholar] [CrossRef]
  11. You, Q.G.; Xue, X.; Peng, F.; Dong, S.Y.; Gao, Y.H. Surface water and heat exchange comparison between alpine meadow and bare land in a permafrost region of the Tibetan Plateau. Agric. For. Meteorol. 2017, 232, 48–65. [Google Scholar] [CrossRef]
  12. Peng, H.; Ma, W.; Mu, Y.H.; Jin, L.; Yuan, K. Degradation characteristics of permafrost under the effect of climate warming and engineering disturbance along the Qinghai–Tibet Highway. Nat. Hazards 2015, 75, 2589–2605. [Google Scholar] [CrossRef]
  13. Wu, Q.B.; Dong, X.F.; Liu, Y.Z.; Jin, H.J. Responses of permafrost on the Qinghai-Tibet Plateau, China, to climate change and engineering construction. Arct. Antarct. Alp. Res. 2007, 39, 682–687. [Google Scholar] [CrossRef] [Green Version]
  14. Cao, W.; Sheng, Y.; Wu, J.C.; Li, J.; Chou, Y.L.; Li, J.P. Simulation analysis of the impacts of underground mining on permafrost in an opencast coal mine in the northern Qinghai-Tibet Plateau. Environ. Earth Sci. 2017, 76, 711. [Google Scholar] [CrossRef]
  15. Yang, M.X.; Nelson, F.E.; Shiklomanov, N.I.; Guo, D.L.; Wan, G.N. Permafrost degradation and its environmental effects on the Tibetan Plateau: A review of recent research. Earth-Sci. Rev. 2010, 103, 31–44. [Google Scholar] [CrossRef]
  16. Wang, T.H.; Yang, D.W.; Yang, Y.T.; Piao, S.L.; Li, X.; Cheng, G.D.; Fu, B.J. Permafrost thawing puts the frozen carbon at risk over the Tibetan Plateau. Sci. Adv. 2020, 6, eaaz3513. [Google Scholar] [CrossRef] [PubMed]
  17. Ni, J.; Wu, T.H.; Zhu, X.F.; Wu, X.D.; Qiang, P.Q.; Fu, Z.D.; Chen, J.; Li, R.; Hu, G.J.; Du, Y.Z.; et al. Risk assessment of potential thaw settlement hazard in the permafrost regions of Qinghai-Tibet Plateau. Sci. Total Environ. 2021, 776, 145855. [Google Scholar] [CrossRef]
  18. Hjort, J.; Streletskiy, D.; Doré, G.; Wu, Q.B.; Bjella, K.; Luoto, M. Impacts of permafrost degradation on infrastructure. Nat. Rev. Earth Environ. 2022, 3, 24–38. [Google Scholar] [CrossRef]
  19. Antonova, S.; Sudhaus, H.; Strozzi, T.; Zwieback, S.; Kääb, A.; Heim, B.; Langer, M.; Bornemann, N.; Boike, J. Thaw subsidence of a Yedoma landscape in Northern Siberia, measured in situ and estimated from TerraSAR-X interferometry. Remote Sens. 2018, 10, 494. [Google Scholar] [CrossRef] [Green Version]
  20. Zhao, R.; Li, Z.W.; Feng, G.C.; Wang, Q.J.; Hu, J. Monitoring surface deformation over permafrost with an improved SBAS-InSAR algorithm: With emphasis on climatic factors modeling. Remote Sens. Environ. 2016, 184, 276–287. [Google Scholar] [CrossRef]
  21. Ma, W.; Liu, D.; Wu, Q.B. Monitoring and analysis of embankment deformation in permafrost regions of Qinghai-Tibet Railway. Rock Soil Mech. 2008, 29, 571–579. (In Chinese) [Google Scholar]
  22. Wang, C.; Zhang, Z.J.; Zhang, H.; Wu, Q.B.; Zhang, B.; Tang, Y.X. Seasonal deformation features on Qinghai-Tibet railway observed using time-series InSAR technique with high-resolution TerraSAR-X images. Remote Sens. Lett. 2017, 8, 1–10. [Google Scholar] [CrossRef]
  23. Liu, L.; Larson, K.M. Decadal changes of surface elevation over permafrost area estimated using reflected GPS signals. Cryosphere 2018, 12, 477–489. [Google Scholar] [CrossRef] [Green Version]
  24. Luo, L.H.; Ma, W.; Zhang, Z.Q.; Zhuang, Y.L.; Zhang, Y.N.; Yang, J.Q.; Cao, X.C.; Liang, S.T.; Mu, Y.H. Freeze/thaw-induced deformation monitoring and assessment of the slope in permafrost based on terrestrial laser scanner and GNSS. Remote Sens. 2017, 9, 198. [Google Scholar] [CrossRef] [Green Version]
  25. Little, J.D.; Sandall, H.; Walegur, M.T.; Nelson, F.E. Application of differential global positioning systems to monitor frost heave and thaw settlement in tundra environments. Permafr. Periglac. Process. 2003, 14, 349–357. [Google Scholar] [CrossRef]
  26. Short, N.; Brisco, B.; Couture, N.; Pollard, W.; Murnaghan, K.; Budkewitsch, P. A comparison of TerraSAR-X, RADARSAT-2 and ALOS-PALSAR interferometry for monitoring permafrost environments, case study from Herschel Island, Canada. Remote Sens. Environ. 2011, 115, 3491–3506. [Google Scholar] [CrossRef]
  27. Chen, J.Y.; Wu, Y.; O’Connor, M.; Cardenas, M.B.; Schaefer, K.; Michaelides, R.; Kling, G. Active layer freeze-thaw and water storage dynamics in permafrost environments inferred from InSAR. Remote Sens. Environ. 2020, 248, 112007. [Google Scholar] [CrossRef]
  28. Strozzi, T.; Antonova, S.; Günther, F.; Mätzler, E.; Vieira, G.; Wegmüller, U.; Westermann, S.; Bartsch, A. Sentinel-1 SAR interferometry for surface deformation monitoring in low-land permafrost areas. Remote Sens. 2018, 10, 1360. [Google Scholar] [CrossRef] [Green Version]
  29. Short, N.; LeBlanc, A.M.; Sladen, W.; Oldenborger, G.; Mathon-Dufour, V.; Brisco, B. RADARSAT-2 D-InSAR for ground displacement in permafrost terrain, validation from Iqaluit Airport, Baffin Island, Canada. Remote Sens. Environ. 2014, 141, 40–51. [Google Scholar] [CrossRef]
  30. Rudy, A.C.A.; Lamoureux, S.F.; Treitz, P.; Short, N.; Brisco, B. Seasonal and multi-year surface displacements measured by DInSAR in a High Arctic permafrost environment. Int. J. Appl. Earth Obs. Geoinf. 2018, 64, 51–61. [Google Scholar] [CrossRef]
  31. Berardino, P.; Fornaro, G.; Lanari, R.; Sansosti, E. A new algorithm for surface deformation monitoring based on small baseline differential SAR interferograms. IEEE Trans. Geosci. Remote Sens. 2002, 40, 2375–2383. [Google Scholar] [CrossRef] [Green Version]
  32. Wang, L.X.; Marzahn, P.; Bernier, M.; Ludwig, R. Sentinel-1 InSAR measurements of deformation over discontinuous permafrost terrain, Northern Quebec, Canada. Remote Sens. Environ. 2020, 248, 111965. [Google Scholar] [CrossRef]
  33. Ferretti, A.; Prati, C.; Rocca, F. Permanent scatterers in SAR interferometry. IEEE Trans. Geosci. Remote Sens. 2001, 39, 8–20. [Google Scholar] [CrossRef]
  34. Abe, T.; Iwahana, G.; Efremov, P.V.; Desyatkin, A.R.; Kawamura, T.; Fedorov, A.; Zhegusov, Y.; Yanagiya, K.; Tadono, T. Surface displacement revealed by L-band InSAR analysis in the Mayya area, Central Yakutia, underlain by continuous permafrost. Earth Planets Space 2020, 72, 138. [Google Scholar] [CrossRef]
  35. Chen, J.; Liu, L.; Zhang, T.J.; Cao, B.; Lin, H. Using persistent scatterer interferometry to map and quantify permafrost thaw subsidence: A case study of eboling mountain on the Qinghai-Tibet Plateau. J. Geophy. Res.-Earth Surf. 2018, 123, 2663–2676. [Google Scholar] [CrossRef]
  36. Lu, P.; Han, J.P.; Li, Z.S.; Xu, R.G.; Li, R.X.; Hao, T.; Qiao, G. Lake outburst accelerated permafrost degradation on Qinghai-Tibet Plateau. Remote Sens. Environ. 2020, 249, 112011. [Google Scholar] [CrossRef]
  37. Daout, S.; Doin, M.P.; Peltzer, G.; Socquet, A.; Lasserre, C. Large-scale InSAR monitoring of permafrost freeze-thaw cycles on the Tibetan Plateau. Geophys. Res. Lett. 2017, 44, 901–909. [Google Scholar] [CrossRef]
  38. Chen, Y.X.; Jiang, L.M.; Liang, L.L.; Zhou, Z.W. Monitoring permafrost deformation deformation in the upatream Heihe River, Qilian Mountain by using multi-temporal Sentinel-1 InSAR dataset. Chin. J. Geophys. 2019, 62, 2441–2454. (In Chinese) [Google Scholar]
  39. Yang, H.L.; Jiang, Q.; Han, J.F.; Kang, K.Y.; Peng, J.H. InSAR measurements of surface deformation over permafrost on Fenghuoshan Mountains section, Qinghai-Tibet Plateau. J. Syst. Eng. Electron. 2021, 32, 1284–1303. [Google Scholar]
  40. Zhang, X.F.; Zhang, H.; Wang, C.; Tang, Y.X.; Zhang, B.; Wu, F.; Wang, J.; Zhang, Z.J. Time-series InSAR monitoring of permafrost freeze-thaw seasonal displacement over Qinghai–Tibetan Plateau using Sentinel-1 data. Remote Sens. 2019, 11, 1000. [Google Scholar] [CrossRef] [Green Version]
  41. Cao, W.; Sheng, Y.; Qin, Y.H.; Li, J.; Wu, J.C. An application of a new method in permafrost environment assessment of Muli mining area in Qinghai-Tibet Plateau, China. Environ. Earth Sci. 2011, 63, 609–616. [Google Scholar] [CrossRef]
  42. Cao, W.; Sheng, Y.; Wu, J.C.; Li, J.; Li, J.P.; Chou, Y.L. Simulation analysis of the impact of excavation backfill on permafrost recovery in an opencast coal-mining pit. Environ. Earth Sci. 2016, 75, 837. [Google Scholar] [CrossRef]
  43. Cao, W.; Sheng, Y.; Qin, Y.H.; Li, J.; Wu, J.C. Grey relation projection model for evaluating permafrost environment in the Muli coal mining area, China. Int. J. Min. Reclam. Environ. 2010, 24, 363–374. [Google Scholar] [CrossRef]
  44. Qian, D.W.; Yan, C.Z.; Xing, Z.P.; Xiu, L.N. Monitoring coal mine changes and their impact on landscape patterns in an alpine region: A case study of the Muli coal mine in the Qinghai-Tibet Plateau. Environ. Monit. Assess. 2017, 189, 559. [Google Scholar] [CrossRef] [PubMed]
  45. Zou, D.F.; Zhao, L.; Sheng, Y.; Chen, J.; Hu, G.J.; Wu, T.H.; Wu, J.C.; Xie, C.W.; Wu, X.D.; Pang, Q.Q.; et al. A new map of permafrost distribution on the Tibetan Plateau. Cryosphere 2017, 11, 2527–2542. [Google Scholar] [CrossRef] [Green Version]
  46. Li, Z.W.; Cao, Y.M.; Wei, J.C.; Duan, M.; Wu, L.X.; Hou, J.X.; Zhu, J.J. Time-series InSAR ground deformation monitoring: Atmospheric delay modeling and estimating. Earth-Sci. Rev. 2019, 192, 258–284. [Google Scholar] [CrossRef]
  47. Chen, F.L.; Lin, H.; Zhou, W.; Hong, T.H.; Wang, G. Surface deformation detected by ALOS PALSAR small baseline SAR interferometry over permafrost environment of Beiluhe section, Tibet Plateau, China. Remote Sens. Environ. 2013, 138, 10–18. [Google Scholar] [CrossRef]
  48. Wang, J.; Wang, C.; Zhang, H.; Tang, Y.X.; Duan, W.; Dong, L.K. Freeze-thaw deformation cycles and temporal-spatial distribution of permafrost along the Qinghai-Tibet Railway using multitrack InSAR processing. Remote Sens. 2021, 13, 4744. [Google Scholar] [CrossRef]
  49. Liu, S.B.; Zhao, L.; Wang, L.X.; Zou, D.F.; Zhou, H.Y.; Xie, C.W.; Qiao, Y.P.; Yue, G.Y.; Shi, J.Z. Application of InSAR technology to monitor deformation in permafrost areas. J. Glaciol. Geocryol. 2021, 43, 964–975. (In Chinese) [Google Scholar]
  50. Li, R.X.; Li, Z.S.; Han, J.P.; Lu, P.; Qiao, G.; Meng, X.L.; Hao, T.; Zhou, F.J. Monitoring surface deformation of permafrost in Wudaoliang Region, Qinghai–Tibet Plateau with ENVISAT ASAR data. Int. J. Appl. Earth Obs. Geoinf. 2021, 104, 102527. [Google Scholar] [CrossRef]
  51. Wang, Z.W.; Yue, G.Y.; Wu, X.D. Ground surface deformation characteristics of different alpine-grassland types in the permafrost zones of Qinghai-Tibet Plateau. Acta Ecol. Sin. 2021, 41, 2398–2407. (In Chinese) [Google Scholar]
  52. Wu, Q.B.; Cheng, G.D.; Ma, W. Impact of permafrost change on the Qinghai-Tibet Railroad engineering. Sci. China Ser. D-Earth Sci. 2004, 47, 122–130. [Google Scholar] [CrossRef]
  53. Du, Q.S.; Li, G.Y.; Zhou, Y.; Chai, M.T.; Chen, D.; Qi, S.S.; Wu, G.; Zhao, X.D. Deformation monitoring in an alpine mining area in the Tianshan Mountains based on SBAS-InSAR technology. Adv. Mater. Sci. Eng. 2021, 2021, 9988017. [Google Scholar] [CrossRef]
  54. Cao, W.; Sheng, Y.; Wu, J.C.; Li, J.; Chou, Y.L.; Wang, S.T. Impact of underground mining on permafrost environment. Coal Geol. Explor. 2016, 44, 98–104. (In Chinese) [Google Scholar]
  55. Gao, S.H.; He, R.X.; Jin, H.J.; Huang, Y.D.; Zhang, J.M.; Luo, D.L. Thermal recovery process of a backfilled open-pit in permafrost area at the Gulian strip coal mine in Northeast China. J. Mt. Sci. 2017, 14, 2212–2229. [Google Scholar] [CrossRef]
  56. Li, C.C.; Wang, T.; Wang, H.; Hu, Z.F.; Jiang, X.G.; Wang, W.C.; Du, B. Monitoring technology and method of ecological environment rehabilitation and treatment in Jvhugeng mining area. J. China Coal Soc. 2021, 46, 1451–1462. (In Chinese) [Google Scholar]
  57. Liu, S.W.; Zhang, J.M.; Zhang, H.; Zheng, B. Research on long-term creep test of permafrost on Qinghai-Tibet Plateau. Chin. J. Rock Mech. Eng. 2012, 31, 3245–3253. (In Chinese) [Google Scholar]
  58. Meng, Q.; Hu, C.B.; Shi, Y.L. The study of post-glacial rebound and stress evolution since the Last Ice Age in the northern North Sea of Norway by using viscoelastic finite element model. Chin. J. Geophys. 2020, 63, 3751–3763. (In Chinese) [Google Scholar]
  59. Li, X.; Gou, X.H.; Wang, N.L.; Sheng, Y.; Jin, H.J.; Qi, Y.; Song, X.Y.; Hou, F.J.; Li, Y.; Zhao, C.M.; et al. Tightening ecological management facilitates green development in the Qilian Mountains. Chin. Sci. Bull. 2019, 64, 2928–2937. (In Chinese) [Google Scholar]
  60. Cao, W.; Sheng, Y. Permafrost environment problems and countermeasures in the process of coal mining. Hydrogeol. Eng. Geol. 2013, 40, 91–96. (In Chinese) [Google Scholar]
Figure 1. Overview of the study area. (a) Spatial distribution of permafrost region in the Qinghai-Tibet Plateau (QTP) (the permafrost map is from [45]); (b) digital elevation model (DEM) of the study area; (c) natural landscape in the neighborhood of the mines; (d) waterlogged open-pit mine; and (e) demonstration area showing the mining restoration and treatment.
Remotesensing 14 02352 g001
Figure 2. Land use/land cover (LULC) (2020) and mining development (2003–2020) in the Muli region. (a) LULC map of the Muli region in 2020; Statistical map of (b) human activities and (c) natural land in the Muli region in 2020; (d) graph of mining development process in the Muli region from 2003 to 2020. Notes: Ro: road; Se: settlement; MB: mine building; Mi: mine; FC: finished coal; Sl: slag; MW: mine water bodies; GR: grassland restoration; AM: alpine meadow; LP: lake and pit pond; Ri: river; BL: bare land; BR: bare rock; Bo: bottomland.
Remotesensing 14 02352 g002
Figure 3. Spatial distribution of mean displacement velocity in the Muli region from 2018 to 2020 (Positive and negative values represent uplift and subsidence along the line-of sight (LOS), respectively). Notes: (1) (A): stable region of mountain bare rock; (B): subsidence region of alpine marsh meadow; (C): uplift region of alpine meadow; (D): JHG mining area; (E): JC mining area. (2) BC: characteristic point of mine building and finished coal area; Mi: characteristic point of mine; Sl: characteristic point of slag. (3) (AE) base map is a Gaofen−1 image acquired on 26 July 2020 (RGB 1−2−3).
Remotesensing 14 02352 g003
Figure 4. Time series displacement for different selected feature points in the natural landscape.
Remotesensing 14 02352 g004
Figure 5. Time series displacement of typical points in mining area. (a) BC1 to BC4: typical points in mine building and finished coal area; (b) Mi1 to Mi4: typical points in mine area, and; (c) Sl1 to Sl4: typical points in slag area.
Remotesensing 14 02352 g005
Figure 6. Mean cumulative displacement and elevation change curve of buffer gradient outside the mining area from January 2018 to December 2020. (a,b) JHG and JC mining areas, respectively. Notes: Mean cum dis: Mean cumulative displacement.
Remotesensing 14 02352 g006
Figure 7. Field photos of alpine marsh meadow in different buffer zones outside mining area. (a) JHG coal mine No. 6, 0–100 m buffer zone; (b) JHG coal mine No. 4, 100–200 m buffer zone; (c) JHG coal mine No. 6, 700–800 m buffer zone; (d) JC coal mine No. 2, 100–200 m buffer zone; (e) JC coal mine No. 2, 700–800 m buffer zone, and; (f) JC coal mine No. 3, 1100–1200 m buffer zone.
Remotesensing 14 02352 g007
Publisher’s Note: MDPI stays neutral with regard to jurisdictional claims in published maps and institutional affiliations.

