1. Introduction
Due to human fossil fuel combustion and deforestation, excess carbon dioxide is released into the atmosphere, and about a third of this is absorbed by the oceans [
1,
2]. In 2019 alone, the ocean CO
2 sink was 2.6 ± 0.6 gigatons of carbon (GtC) year
−1, fossil CO
2 emissions were 9.9 ± 0.5 GtC year
−1, and emissions from land-use change were 1.8 ± 0.7 GtC year
−1 [
3]. However, the uptake of anthropogenic CO
2 emissions by seawater also reduces the pH and carbonate ion concentration of seawater, and the latter also reduces the calcium carbonate saturation states. This process is known as ocean acidification [
4,
5]. Changes in seawater pH can affect biochemical reactions, equilibrium conditions, and biological activity in the ocean [
6] and have a dramatic effect on marine animals, especially shell-forming animals, which will have more difficulty obtaining calcium ions from seawater when its pH decreases [
7,
8]. It has been reported that changes in seawater pH significantly affect the growth rate of phytoplankton and consequently the primary production of phytoplankton [
9,
10,
11,
12]. Jiang et al. [
13] inverted the sea surface pH distribution in 1770 by assuming that the historical rates of change of carbon dioxide partial pressure (
pCO
2) and sea surface temperature (SST) were consistent with the ESM2M model’s calculations, and their study revealed that the average pH of seawater decreased by ~0.1 between the 17th century and the 20th century. According to the United Nations Intergovernmental Panel on Climate Change (IPCC [
14]) Representative Concentration Pathway 8.5, ocean pH is expected to decrease by 0.3 in 2100 compared to 2000 [
15]. Therefore, the study of ocean acidification has become a critical topic in ocean and global change research. Moreover, the study of pH, as a direct indicator of ocean acidification, is important to understand changes in ocean acidification and their underlying mechanisms.
pH is defined as the negative logarithm of the hydrogen ion concentration [
6]. In current oceanographic studies, seawater pH data are mainly derived from
in situ observations from cruise and station sampling or indirect calculations based on carbon chemistry principles [
16]. On the global scale, direct measurement of pH is still far from sufficient. Because pH,
pCO
2, total alkalinity (TA), and dissolved inorganic carbon (DIC) are the four major carbonate system parameters, pH can be calculated from two other carbonate parameters [
13,
16]. Millero pointed out that the error arising from the indirect calculation of pH by using
pCO
2 and DIC (error ≤ ±0.025), as well as by using
pCO
2 and TA (error ≤ ±0.026), is lower compared to the calculation using TA and DIC (error ≤ ±0.062) [
16].
Some researchers have conducted satellite inversion of pH data to expand the spatial and temporal understanding of pH variation. The European Space Agency’s Pathfinder Ocean Acidification project, led by Plymouth Marine Laboratory, UK, aims to monitor ocean acidification using Earth observations [
17]. It has calculated the monthly sea surface pH distribution in the North Atlantic for 2010 using climatology
pCO
2 and TA, estimated from the European Space Agency’s Soil Moisture and Ocean Salinity data, with an uncertainty in pH of 0.0035. The Japan Meteorological Agency released carbon dioxide mapping data (the JMA Ocean CO
2 Map) that contain the products of air–sea CO
2 flux,
pCO
2, TA, DIC, and pH data from 1990 to 2019 with a spatial resolution of 1° × 1° and a temporal resolution of one month. For the JMA Ocean CO
2 dataset, the TA and DIC were produced from the model and reanalysis data based on the partition multiple linear regression method, and then the pH was indirectly calculated from the carbonate calculation based on the modeled TA and DIC data [
18,
19]. Copernicus Marine Environment Monitoring Service (CMEMS) also released the dataset of Global Ocean Surface Carbon Product (
https://doi.org/10.48670/moi-00047. Accessed on 1 February 2022), which contains the monthly average global sea surface pH product with 1° × 1° spatial resolution for 1985 to 2020; the pH products were indirectly calculated from the modeled
pCO
2 and reconstructed TA data based on carbonate system calculation [
20]. Currently, the direct inversion of pH is still sparse.
The narrow dynamic range of pH values (~8.1 ± 0.1) [
16] imposes high accuracy and stability requirements on the inversion model. The control mechanism of pH change is complex, which makes pH inversion more difficult and challenging. For example, from the perspective of carbon chemistry principles, pH is strongly influenced by seawater temperature. SST influences pH by controlling the chemical speciation of CO
2 dissolved in seawater; however, SST also affects the air–sea exchange and the associated changes in the DIC/TA ratio [
13]. These two mechanisms can cancel each other out and therefore pose many difficulties for the inversion of pH data. Biological effects also influence the change of pH; for example, algal bloom outbreaks increase pH because of the intake of CO
2 in water when photosynthesis of phytoplankton is strong [
21].
In the past three decades, machine learning has been increasingly used in the field of remote sensing owing to the increase in the quantity of remotely sensed data available and the development of computer technology [
22]. Commonly used machine learning methods include multilayer perceptron, random forest (RF), support vector machine, and deep learning. The backpropagation (BP) neural network was more commonly used in the early days. Keiner et al. inverted the chlorophyll a (Chla) and suspended matter concentrations by using remote sensing reflectance in the first three visible bands of Landsat through a BP neural network model and found the accuracy of the model was higher than that of the conventional regression analysis [
23]. Chen et al. implemented the inversion of sea surface salinity (SSS) in the Gulf of Mexico based on remote sensing reflectance and SST by constructing a BP multilayer perceptron model [
24]. Breiman et al. proposed an RF algorithm based on the decision tree as a base learner to construct bagging integration with better training efficiency and lower generalization error [
25]. Liu et al. constructed an RF inversion model to retrieve the PM2.5 level, based on top-of-atmosphere reflection from the Himawari satellite [
26]. Chen et al. constructed a remote sensing inversion model of seawater
pCO
2 in the Gulf of Mexico based on an RF algorithm, with SST, SSS, Chla, and diffuse attenuation of downwelling irradiance as inputs, and reported that the model had high robustness [
27].
Many studies have demonstrated the unique advantages of machine learning in solving water color remote sensing inversion problems. However, the training of machine learning models still faces many challenges in terms of robustness and generalization ability owing to the lack of sufficient ground truth data, i.e., insufficient training because of few sample points in some regions.
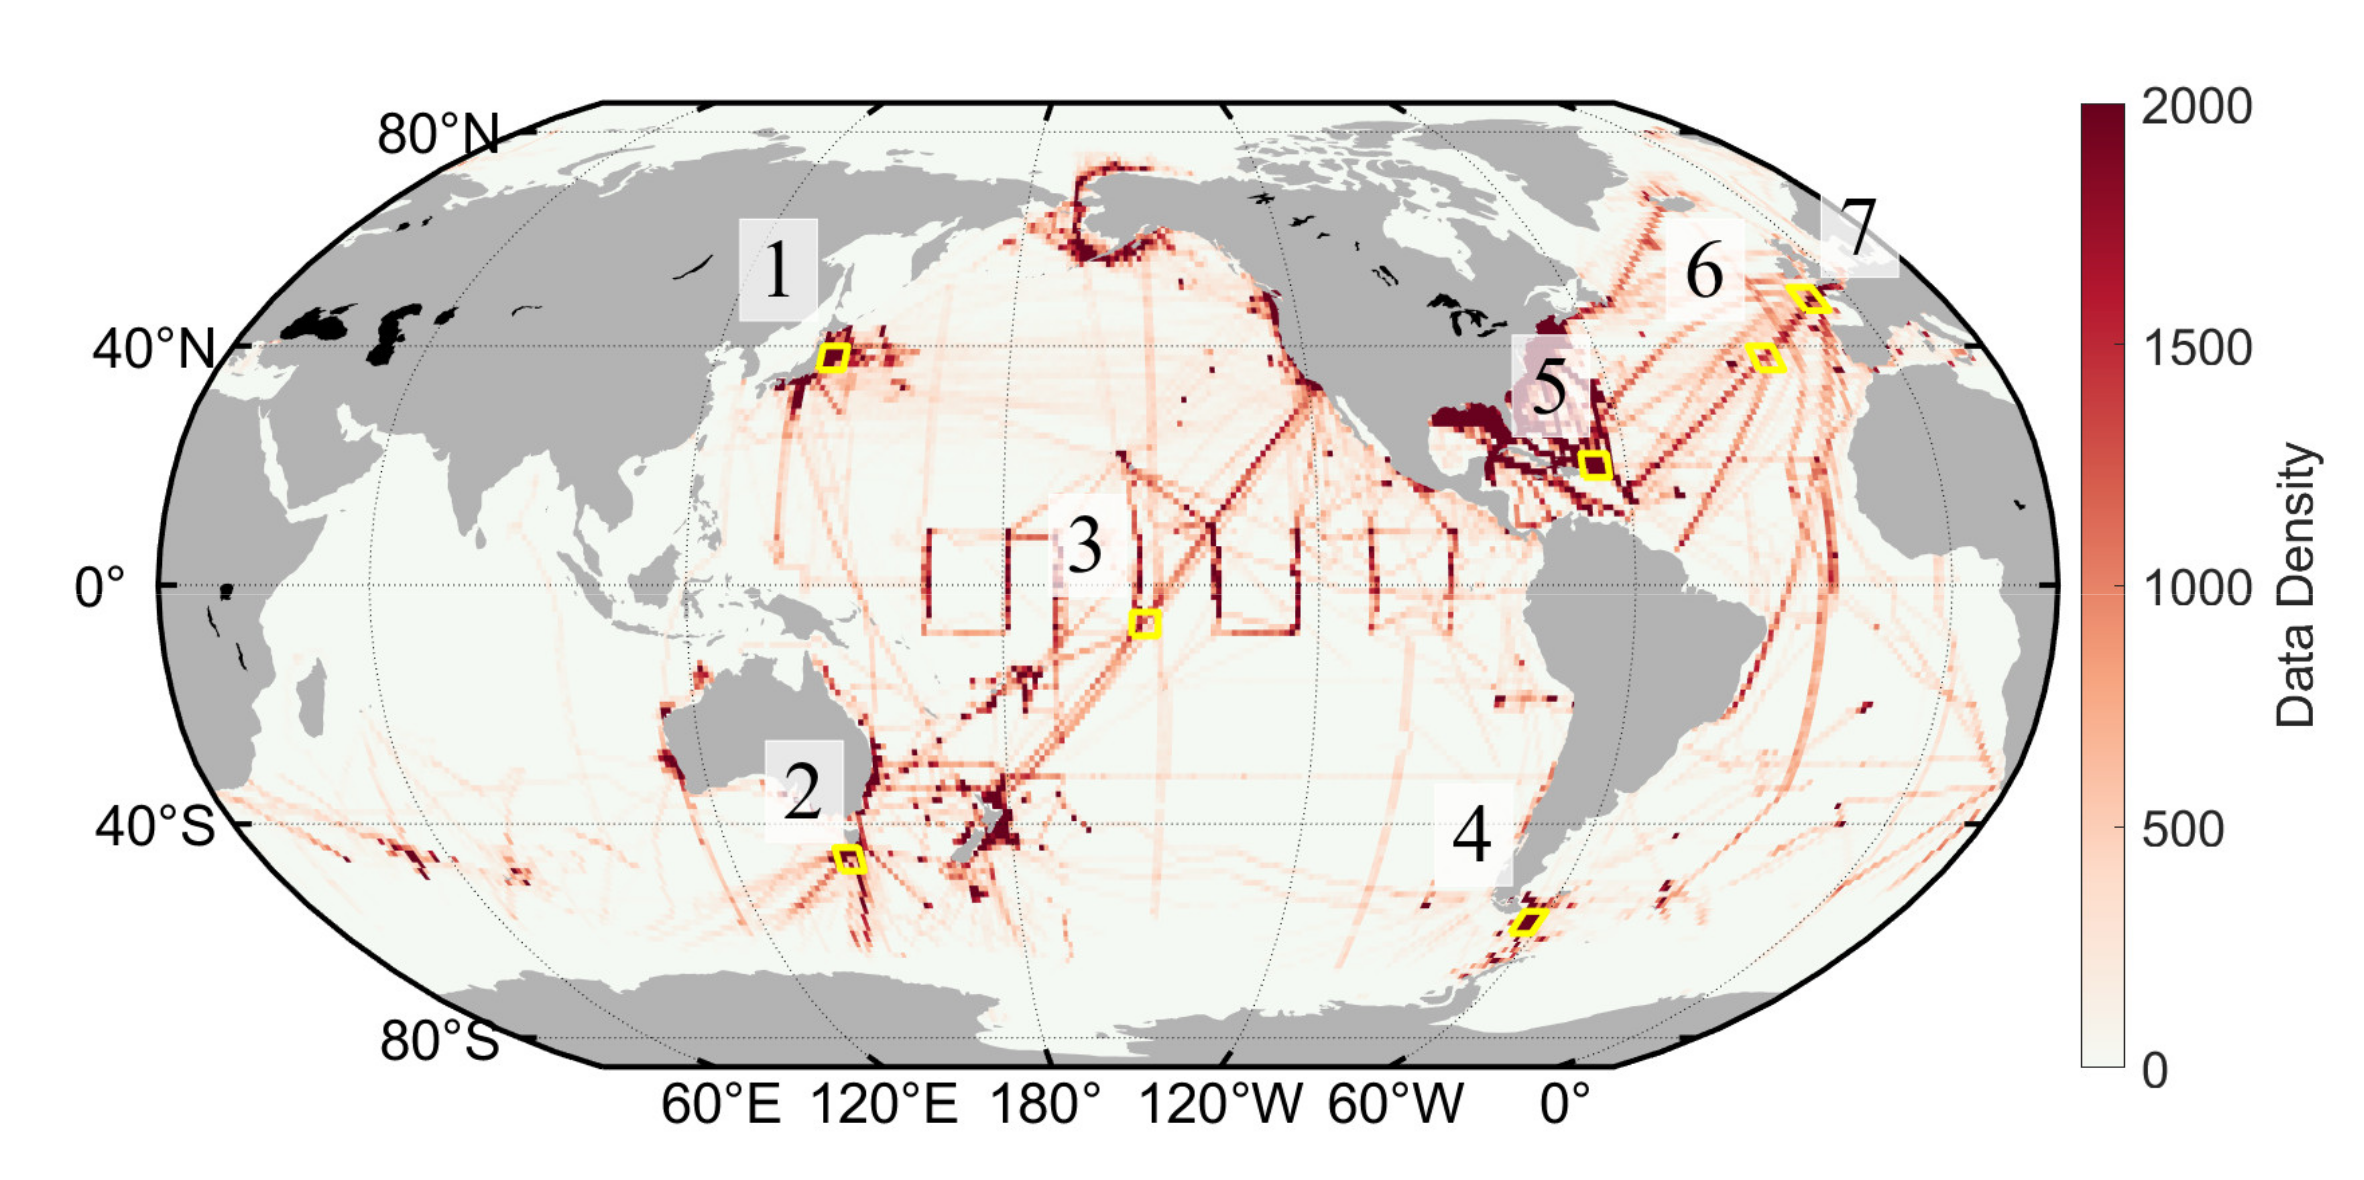
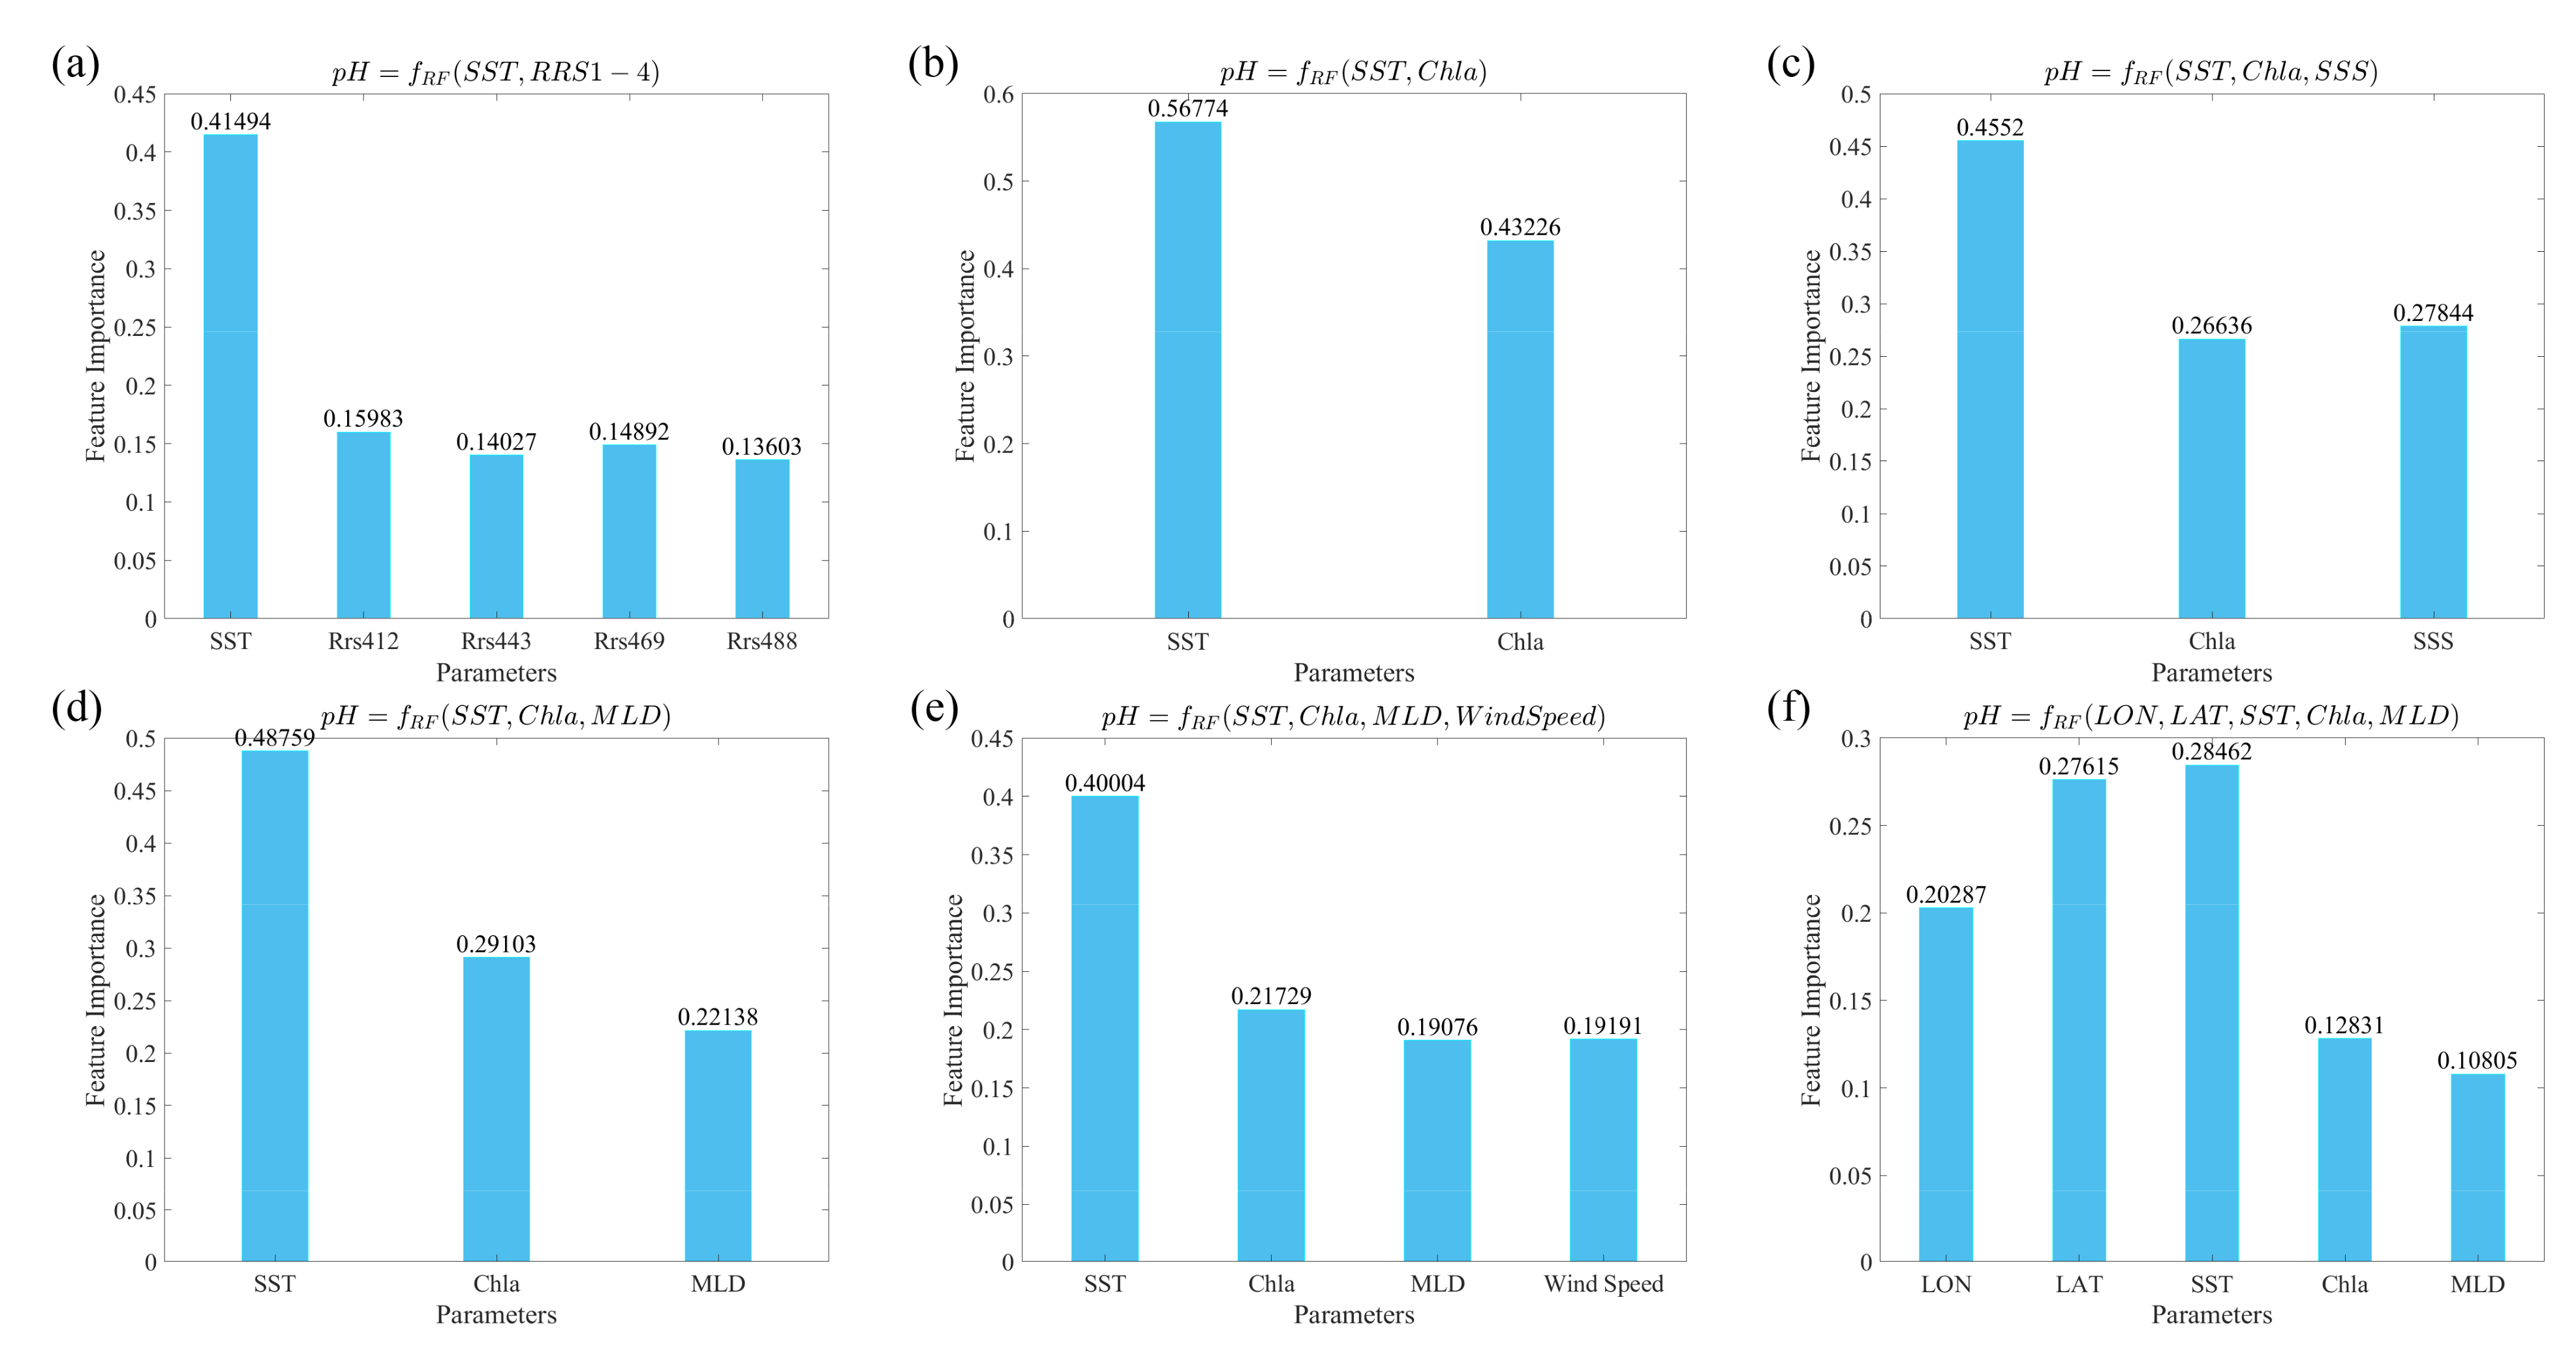
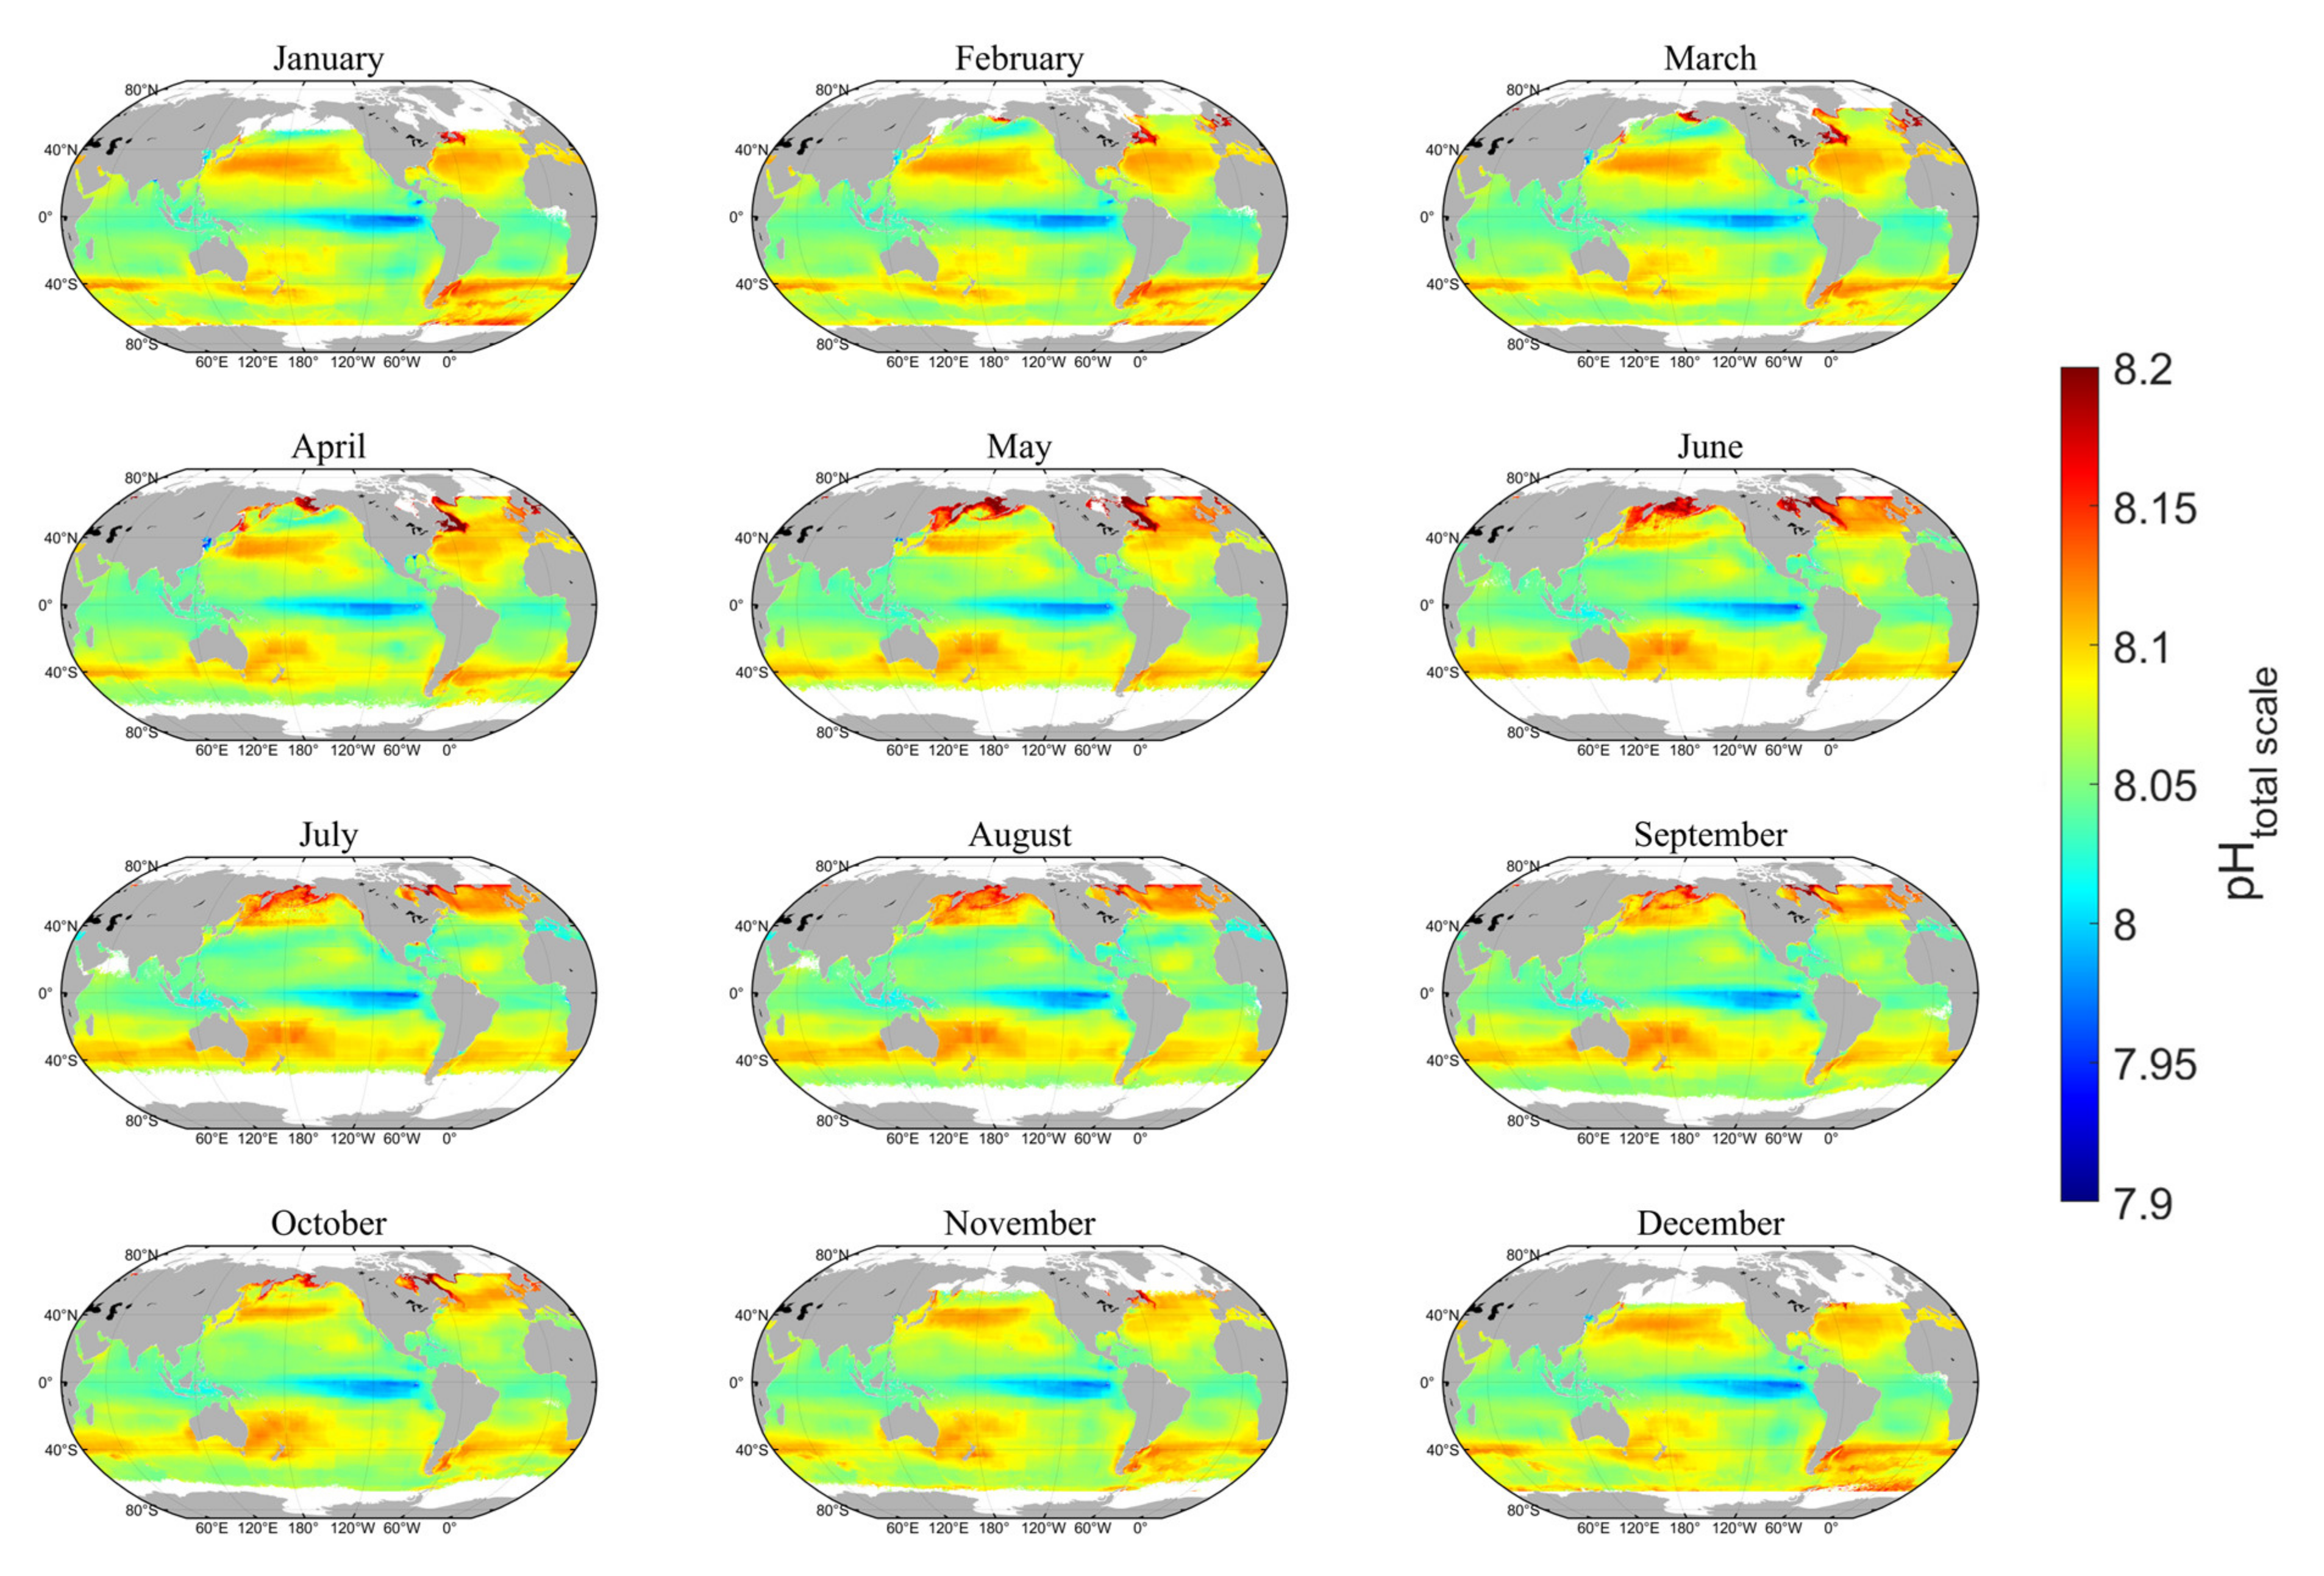
At present, pH inversion research still faces difficulty in insufficient spatial and temporal representativeness of field-measured datasets, identifying the suitable inversion method, and the low spatial and temporal resolution of the products. In this study, we develop a new method to invert the global sea surface pH data by satellite remote sensing, based on a high-precision, large-volume pH dataset from indirect carbonate system calculations and built upon an optimized strategy of input parameter combination and machine learning. Based on the new pH inversion model, we present the temporal and spatial variation of monthly global pH from 2004 to 2019 to show model performance.
5. Conclusions
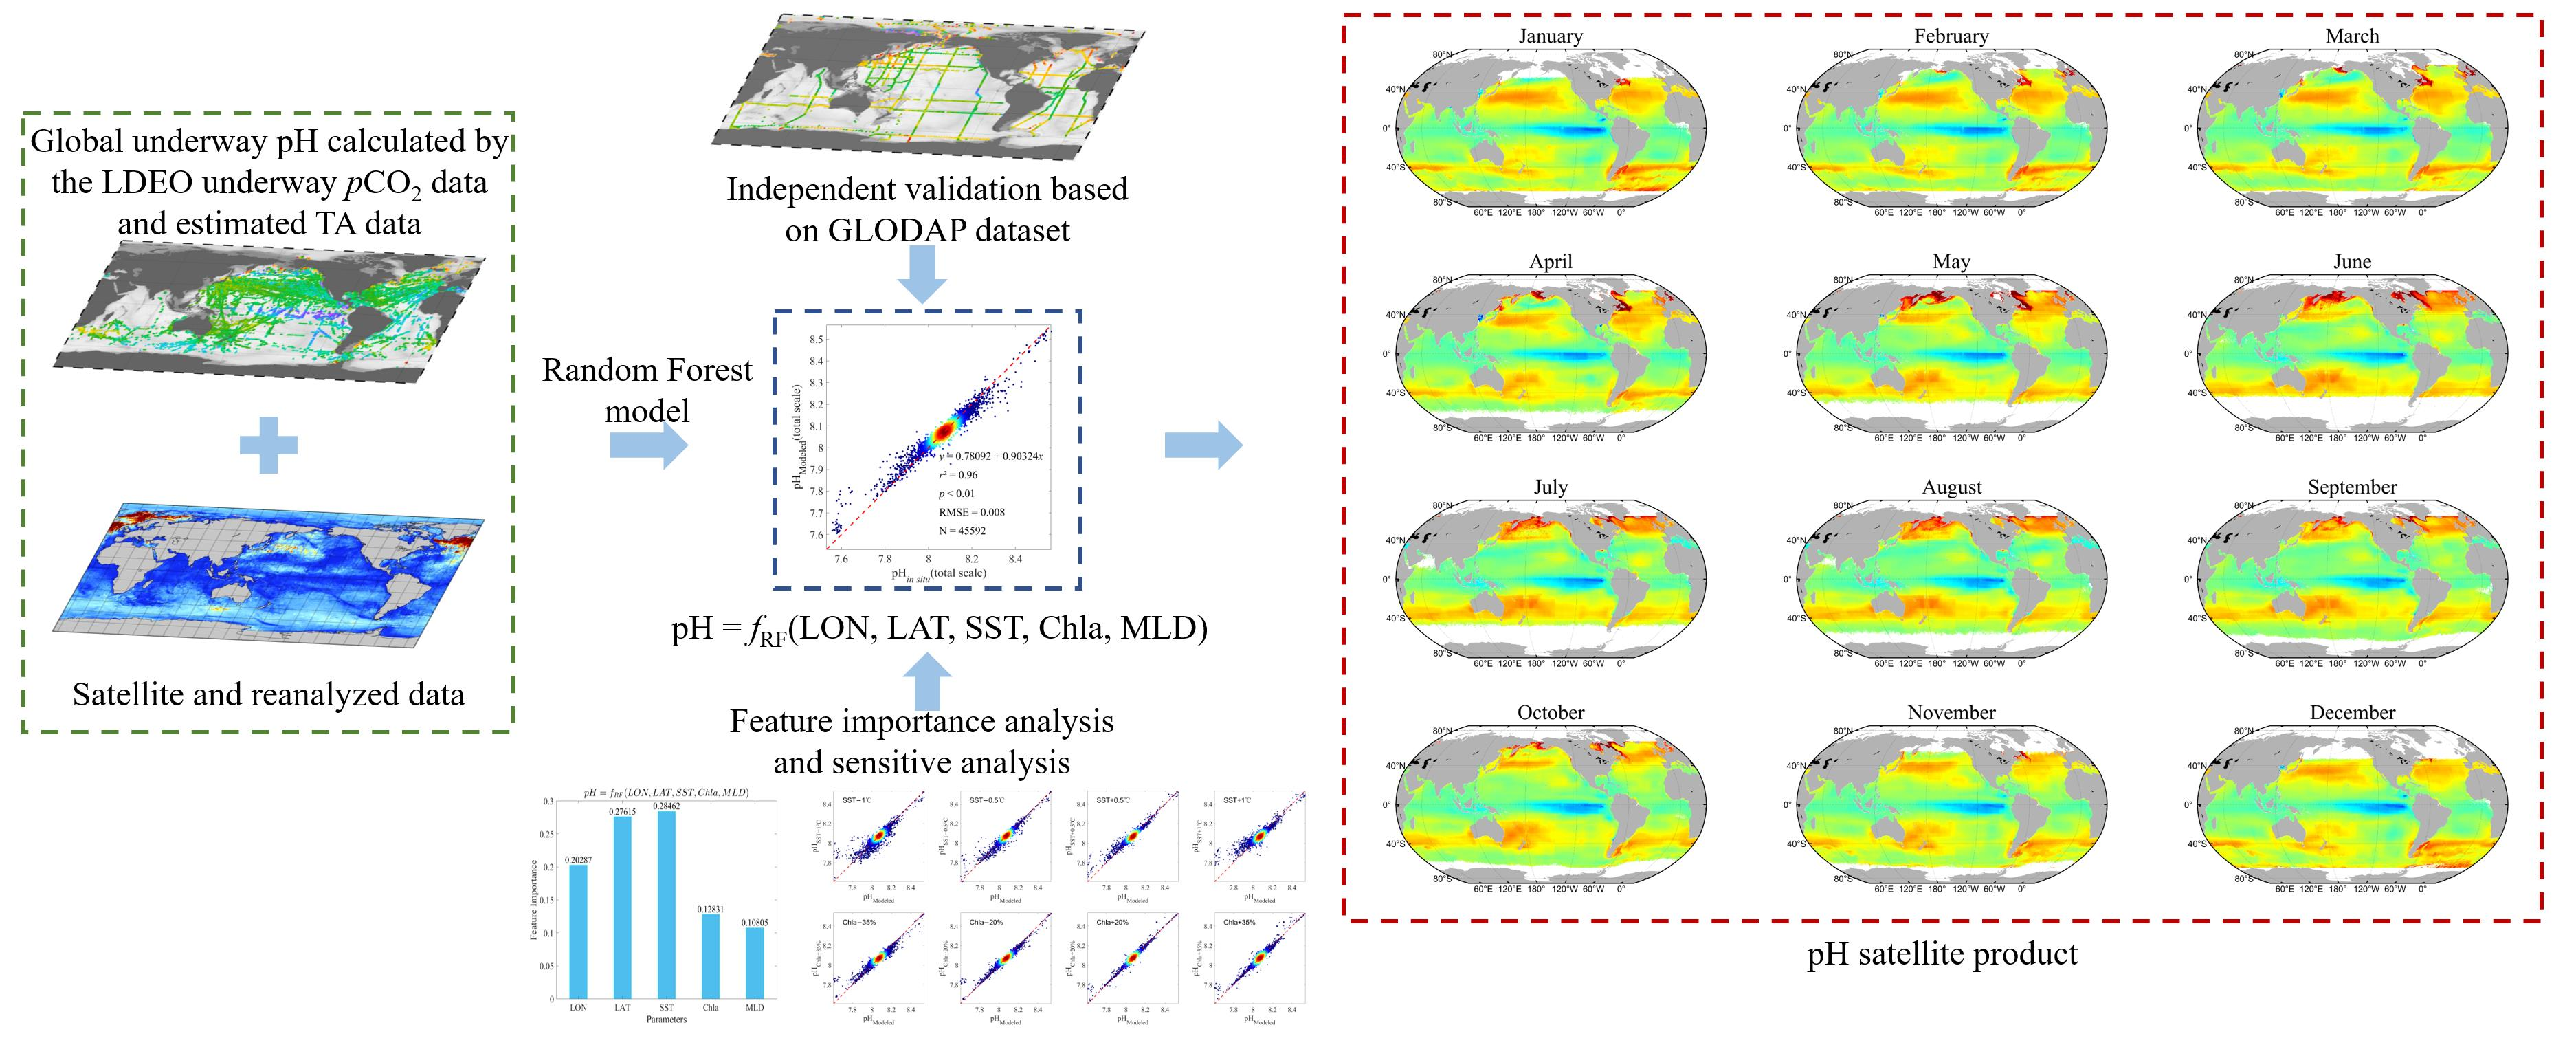
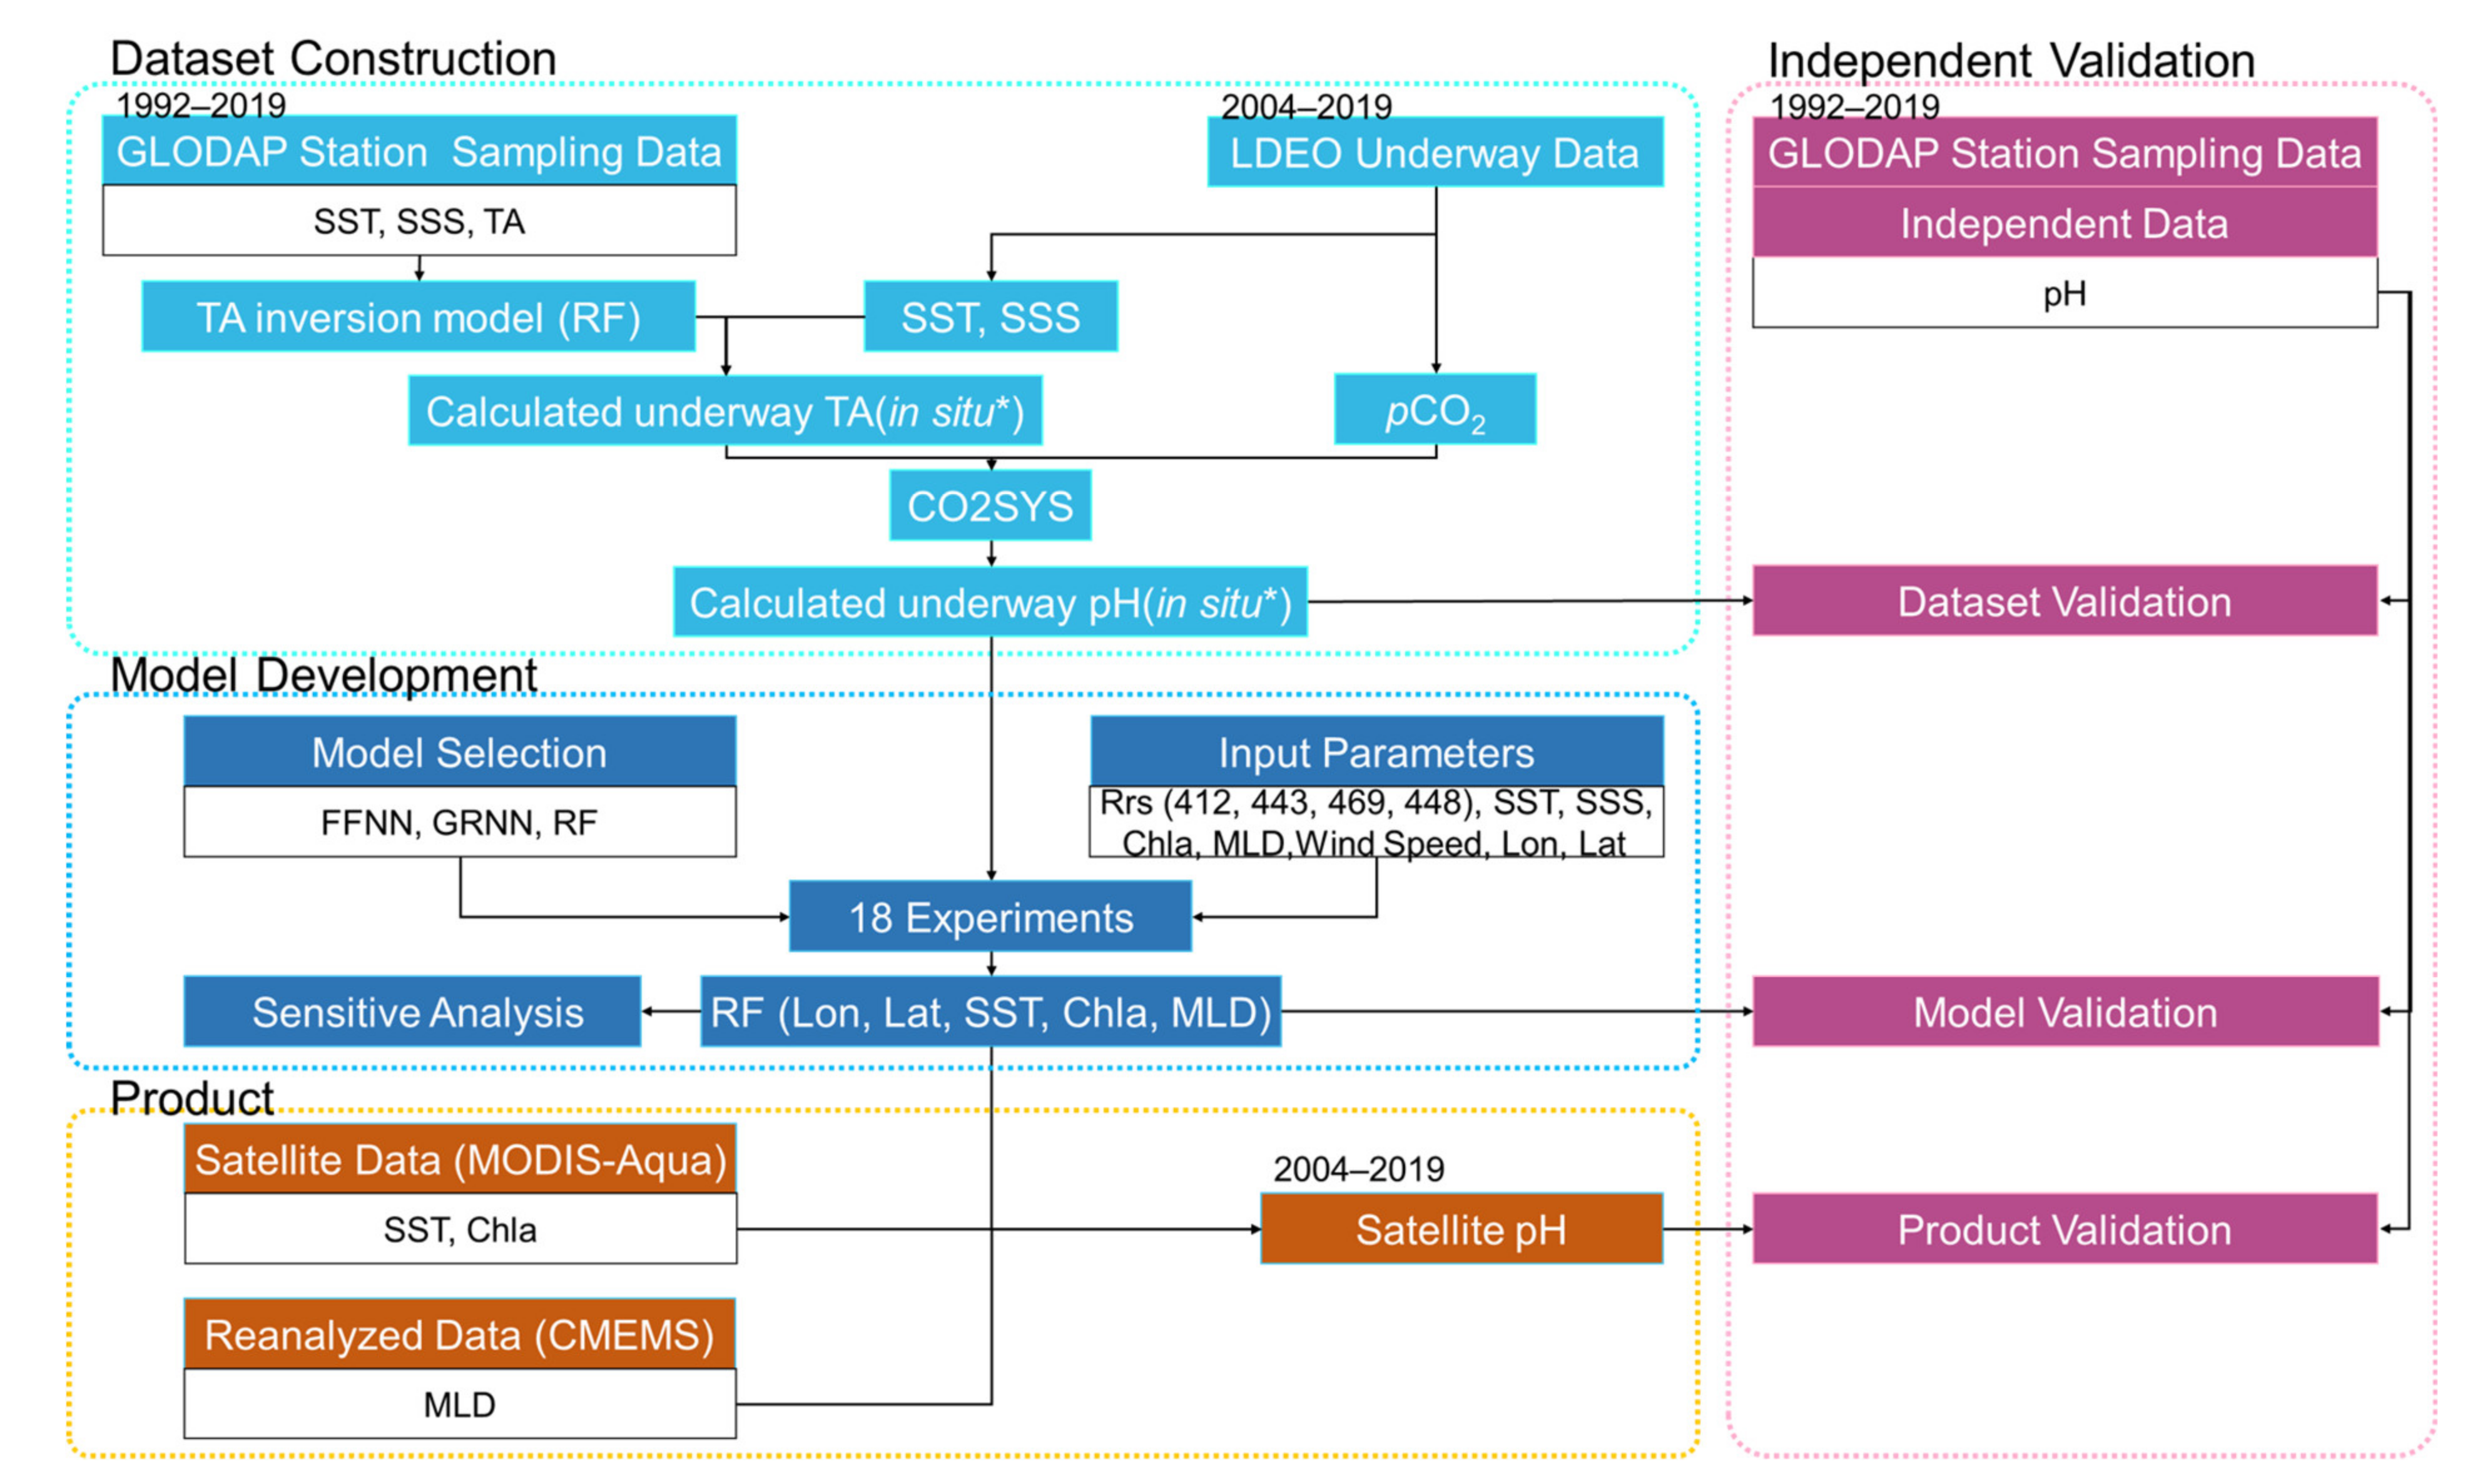
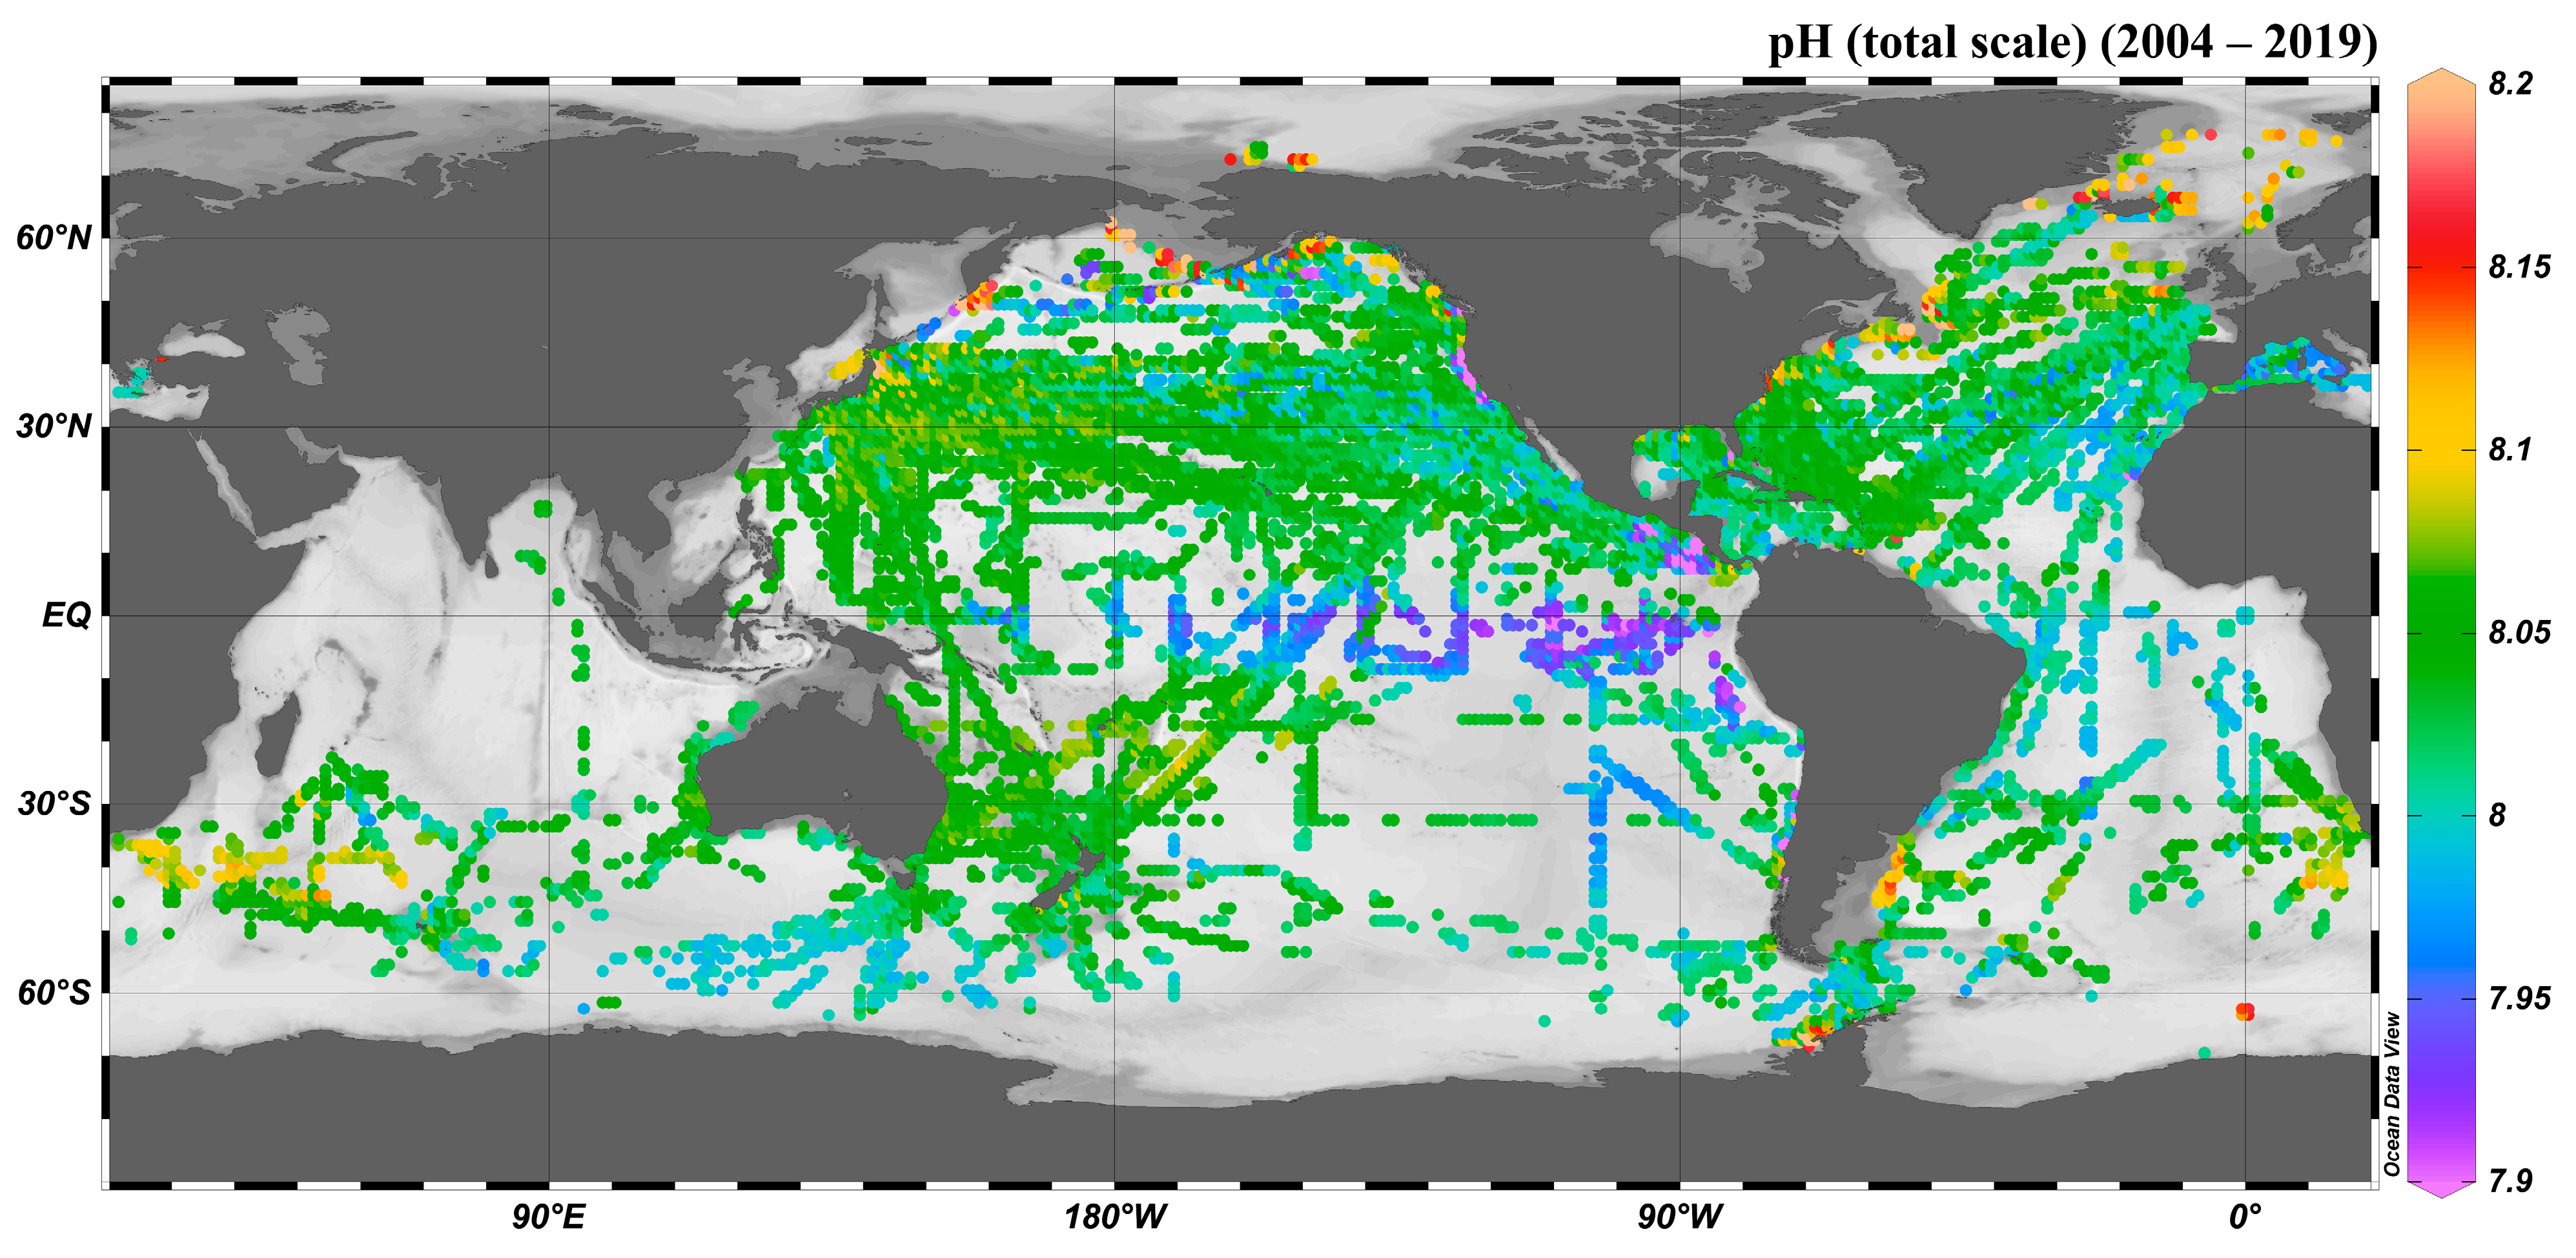
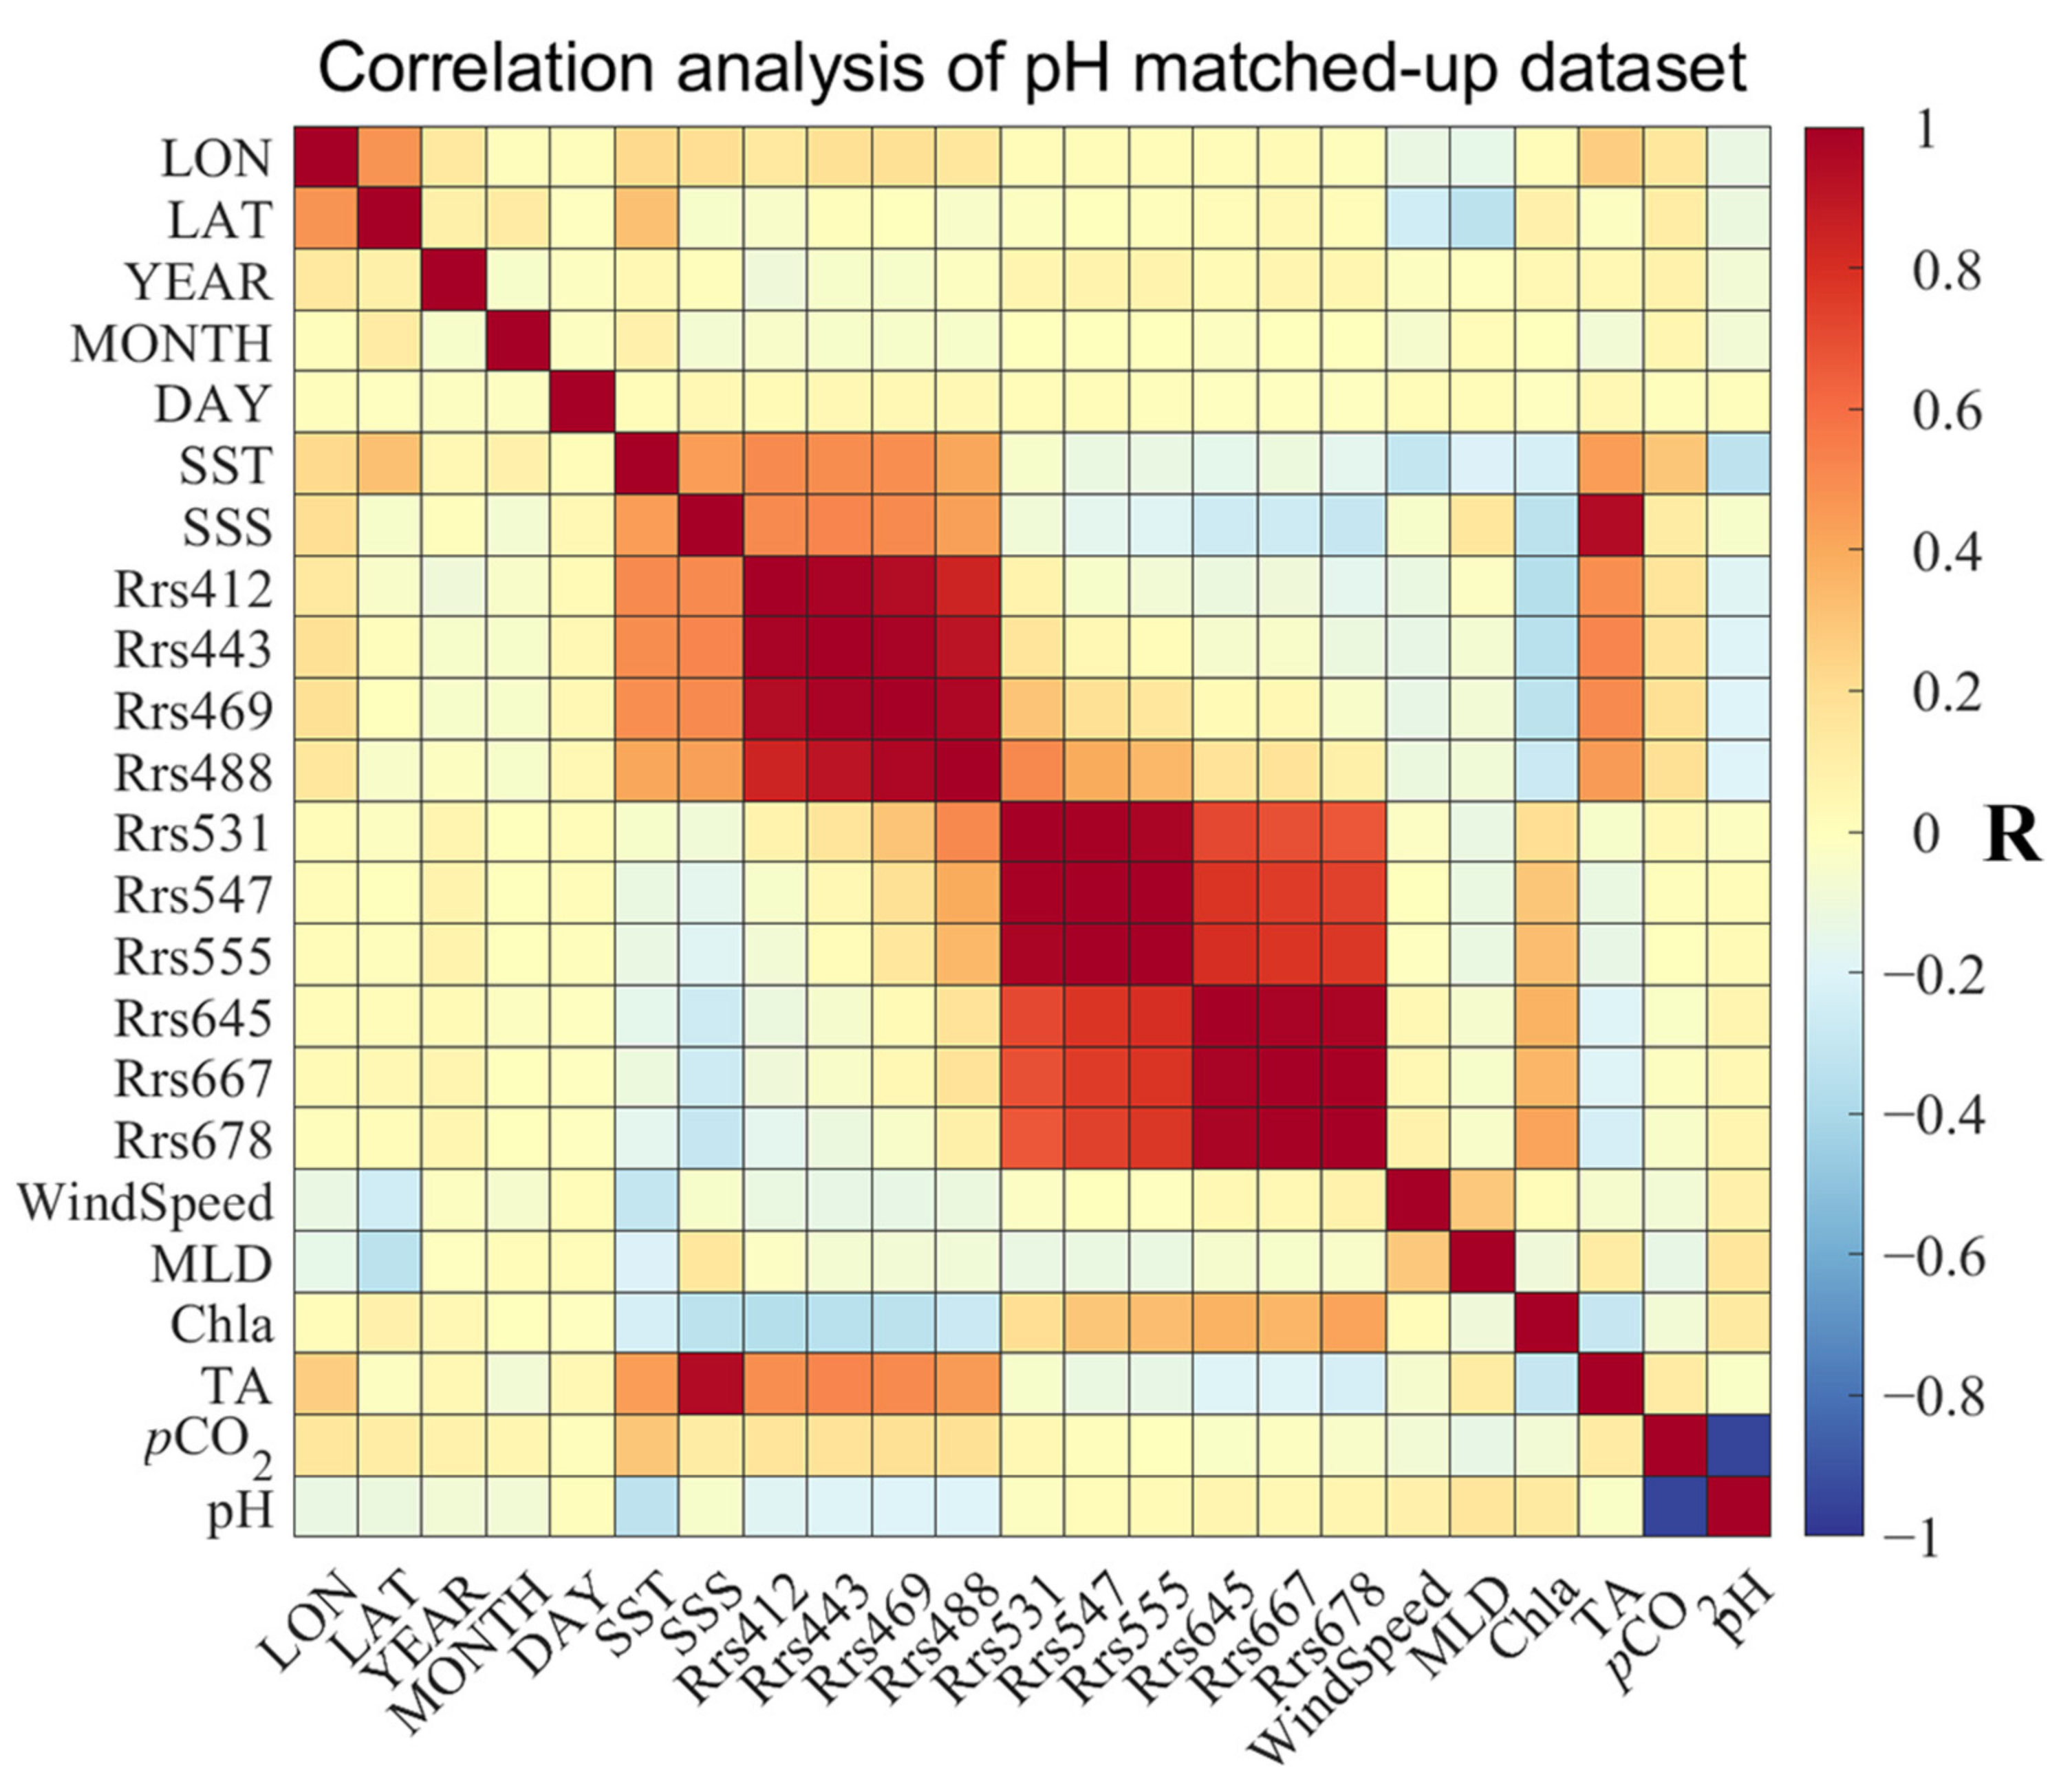
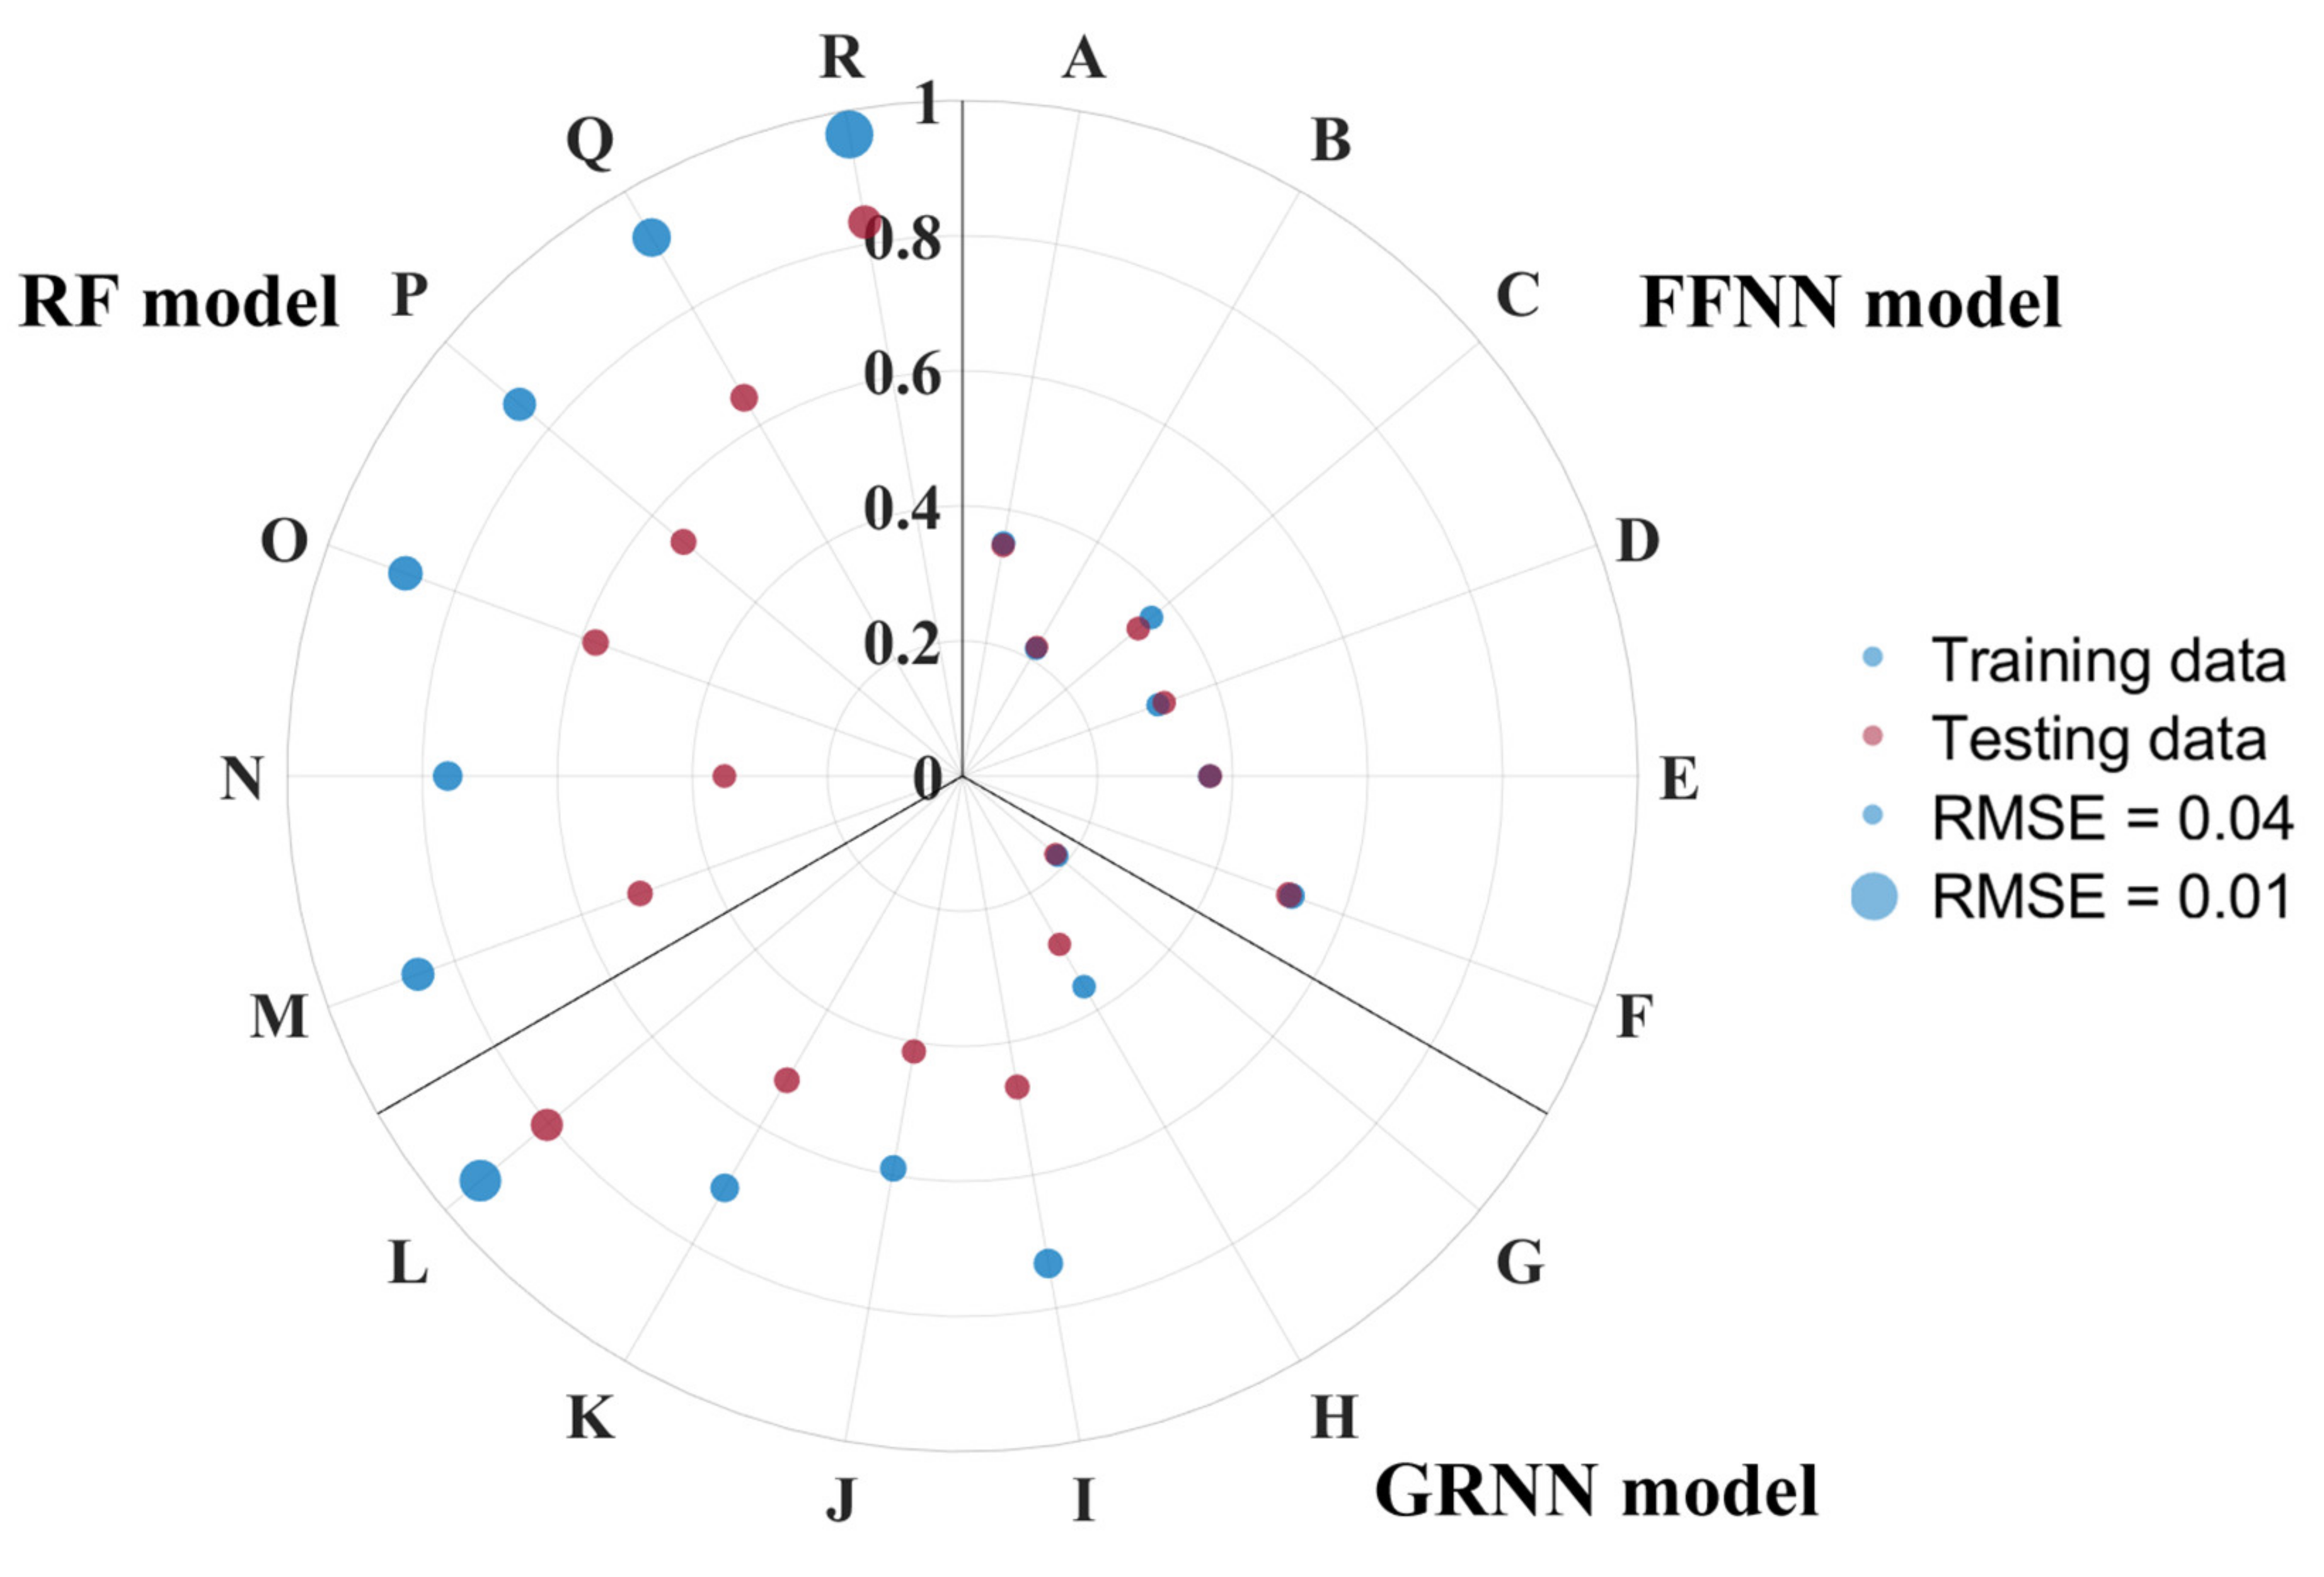
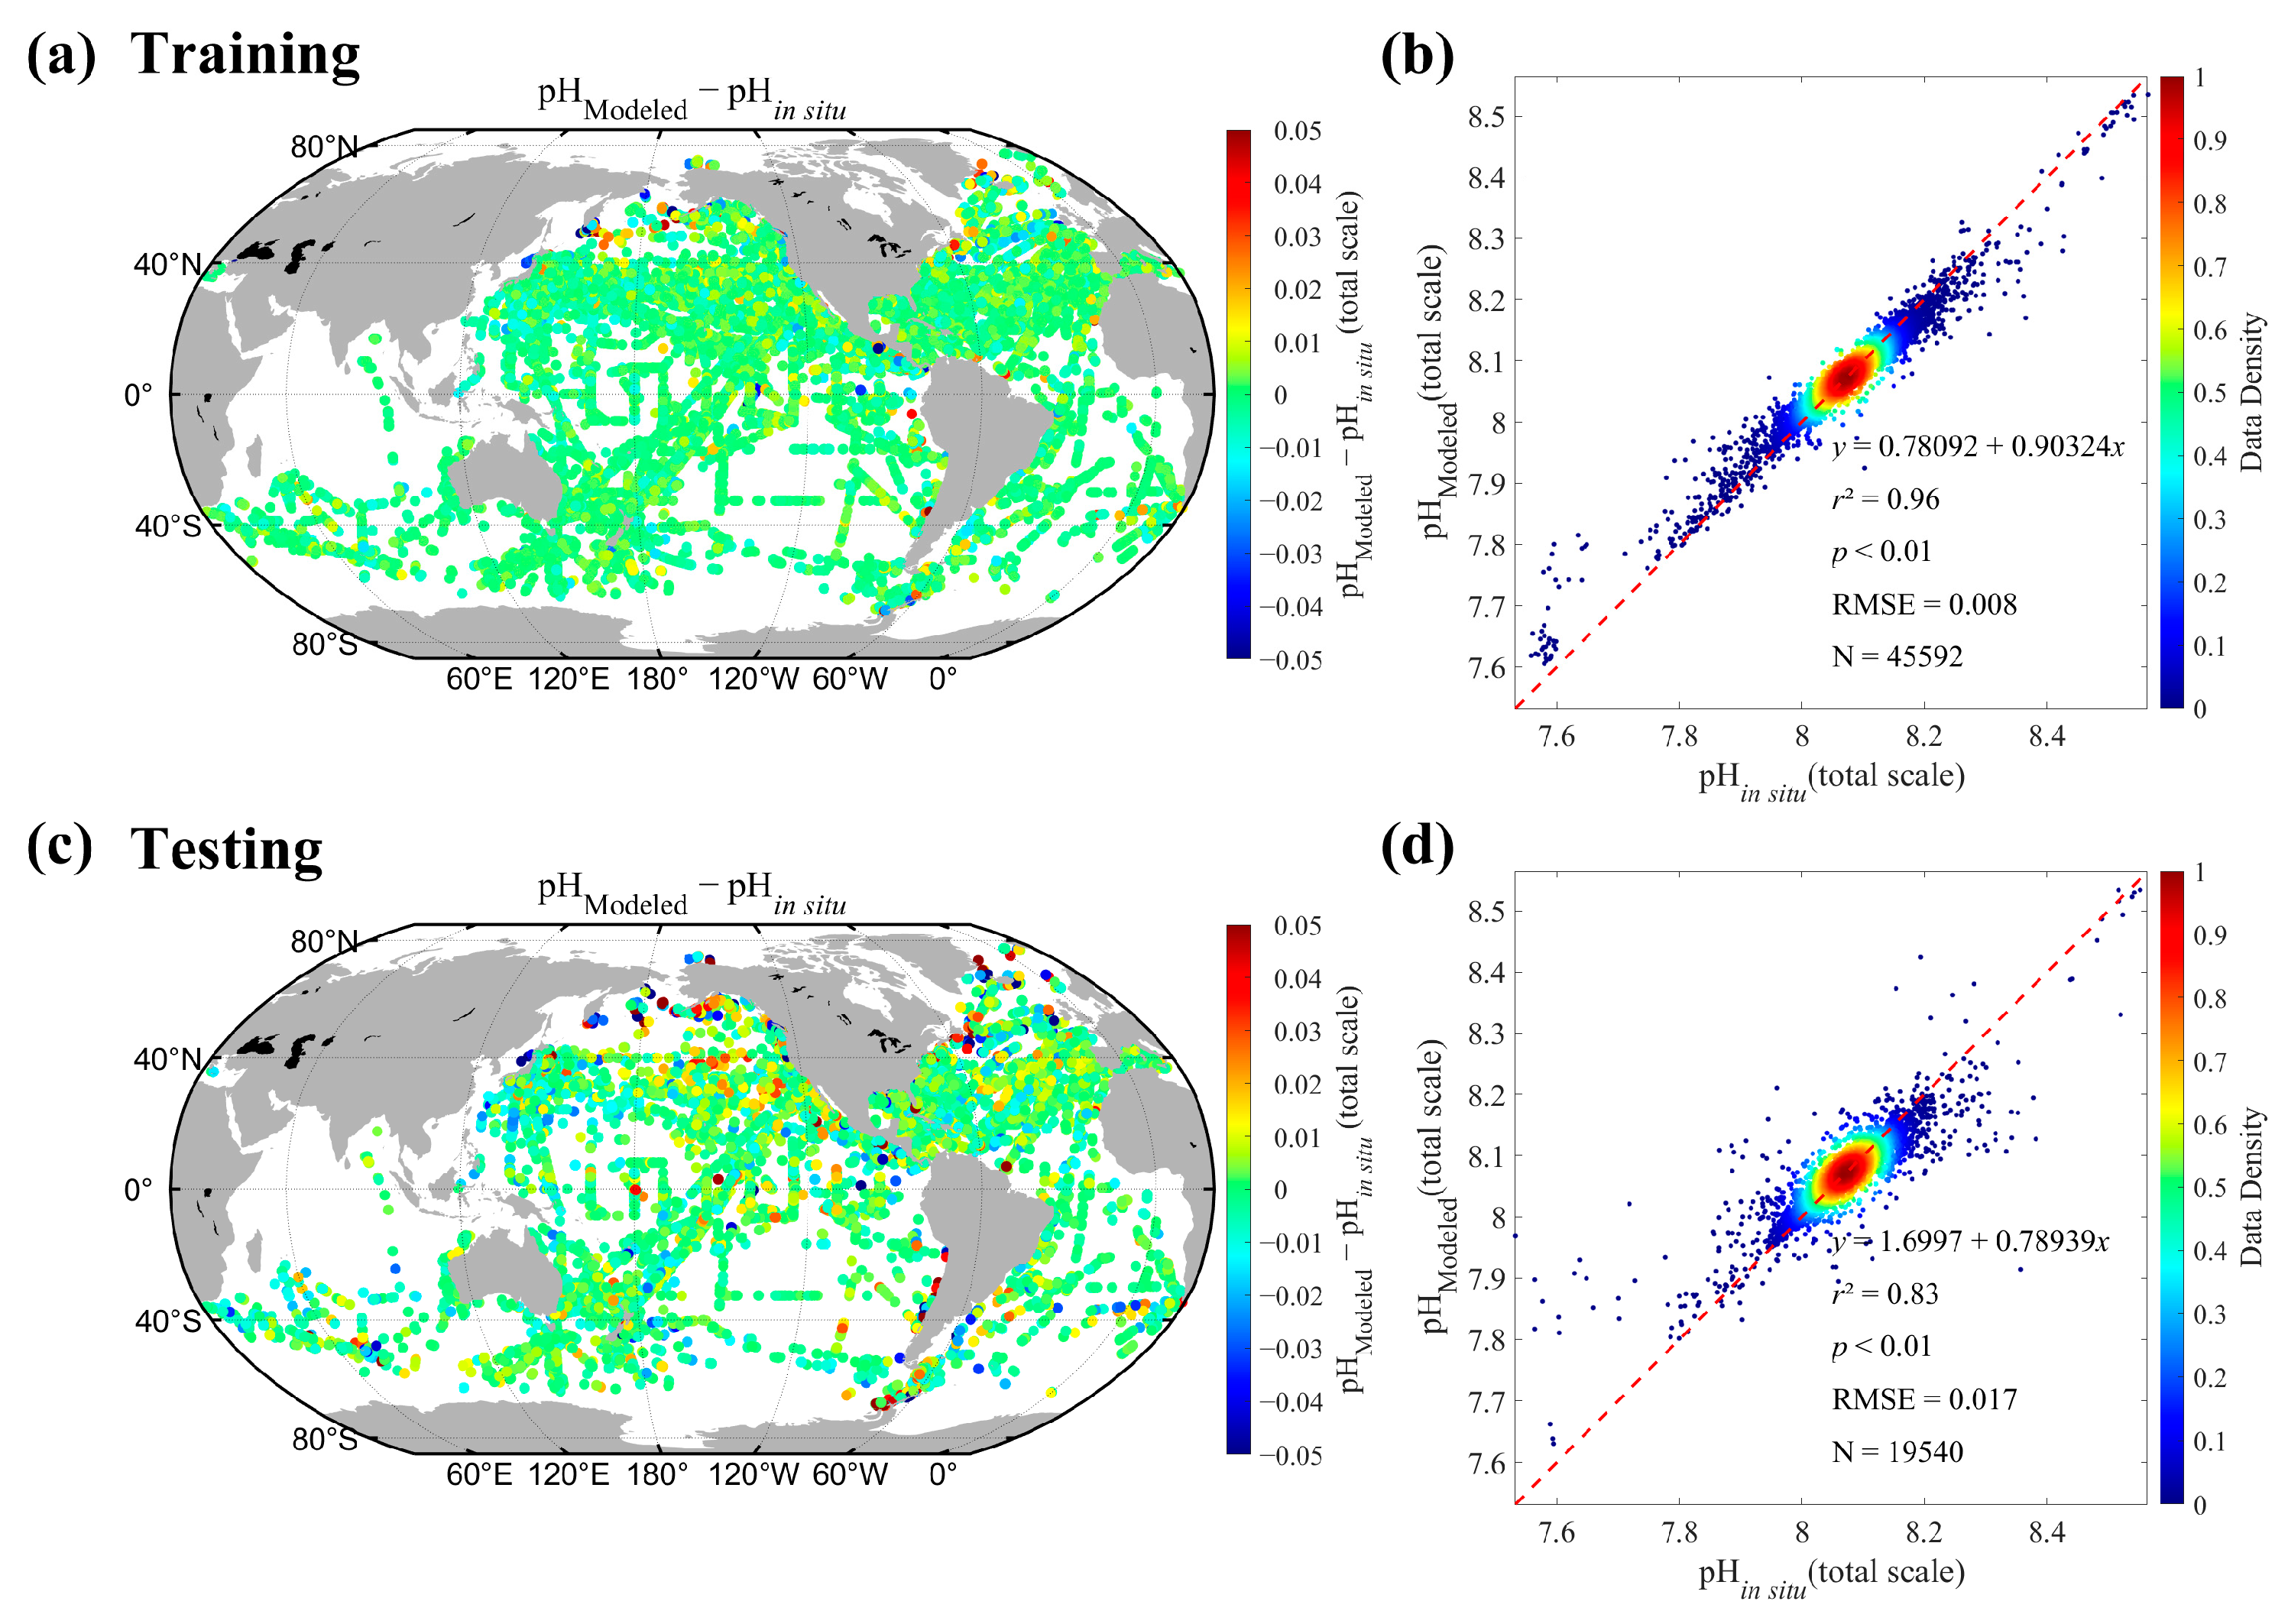
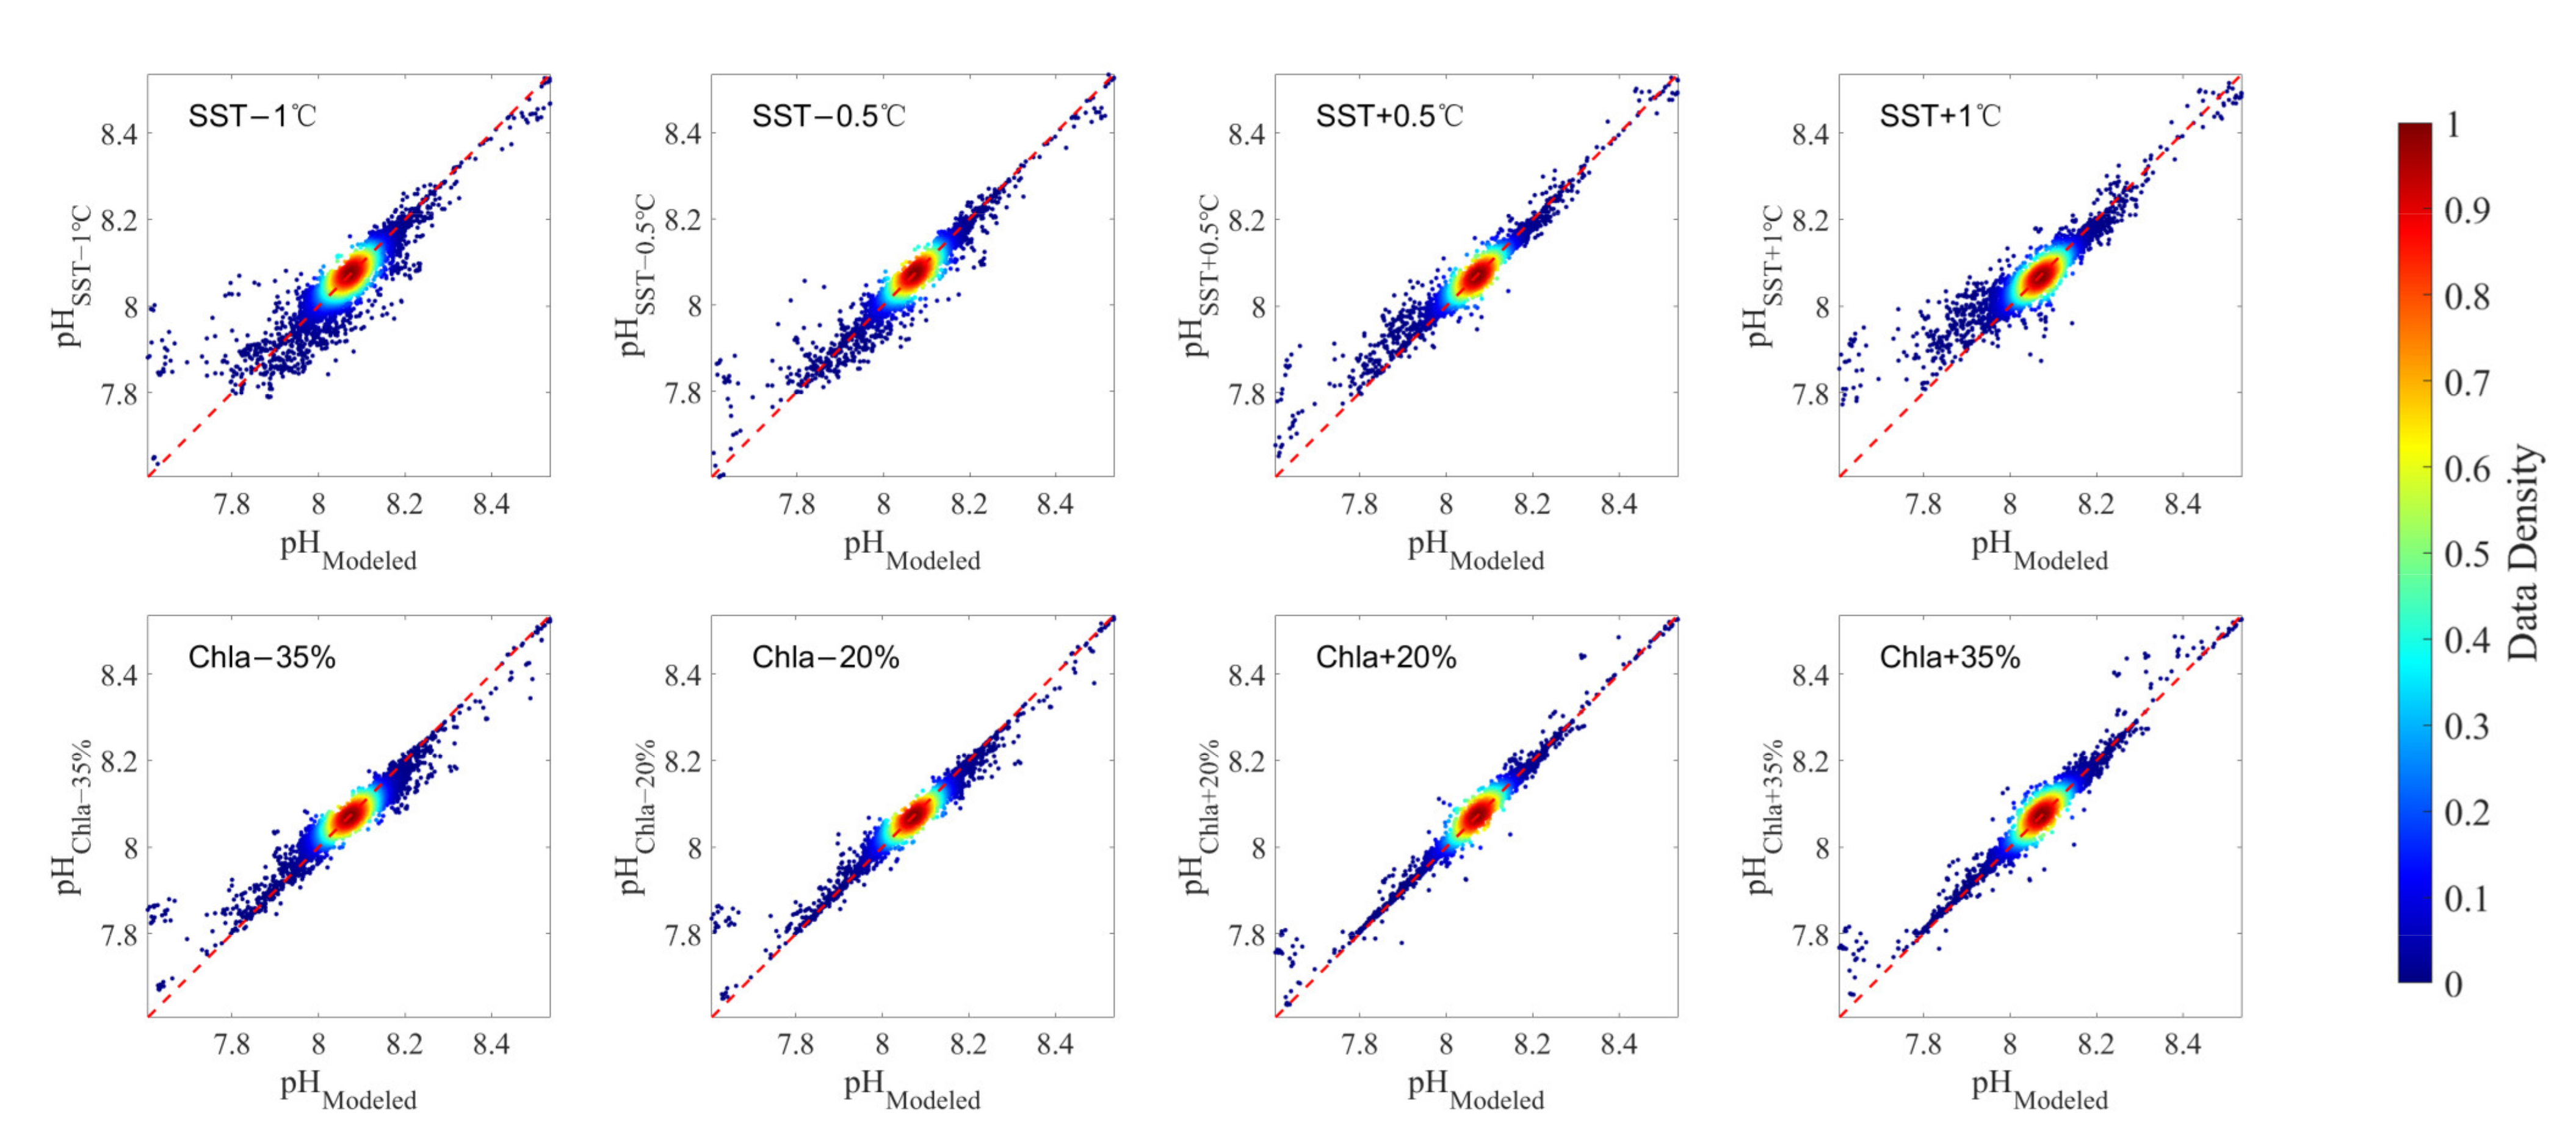
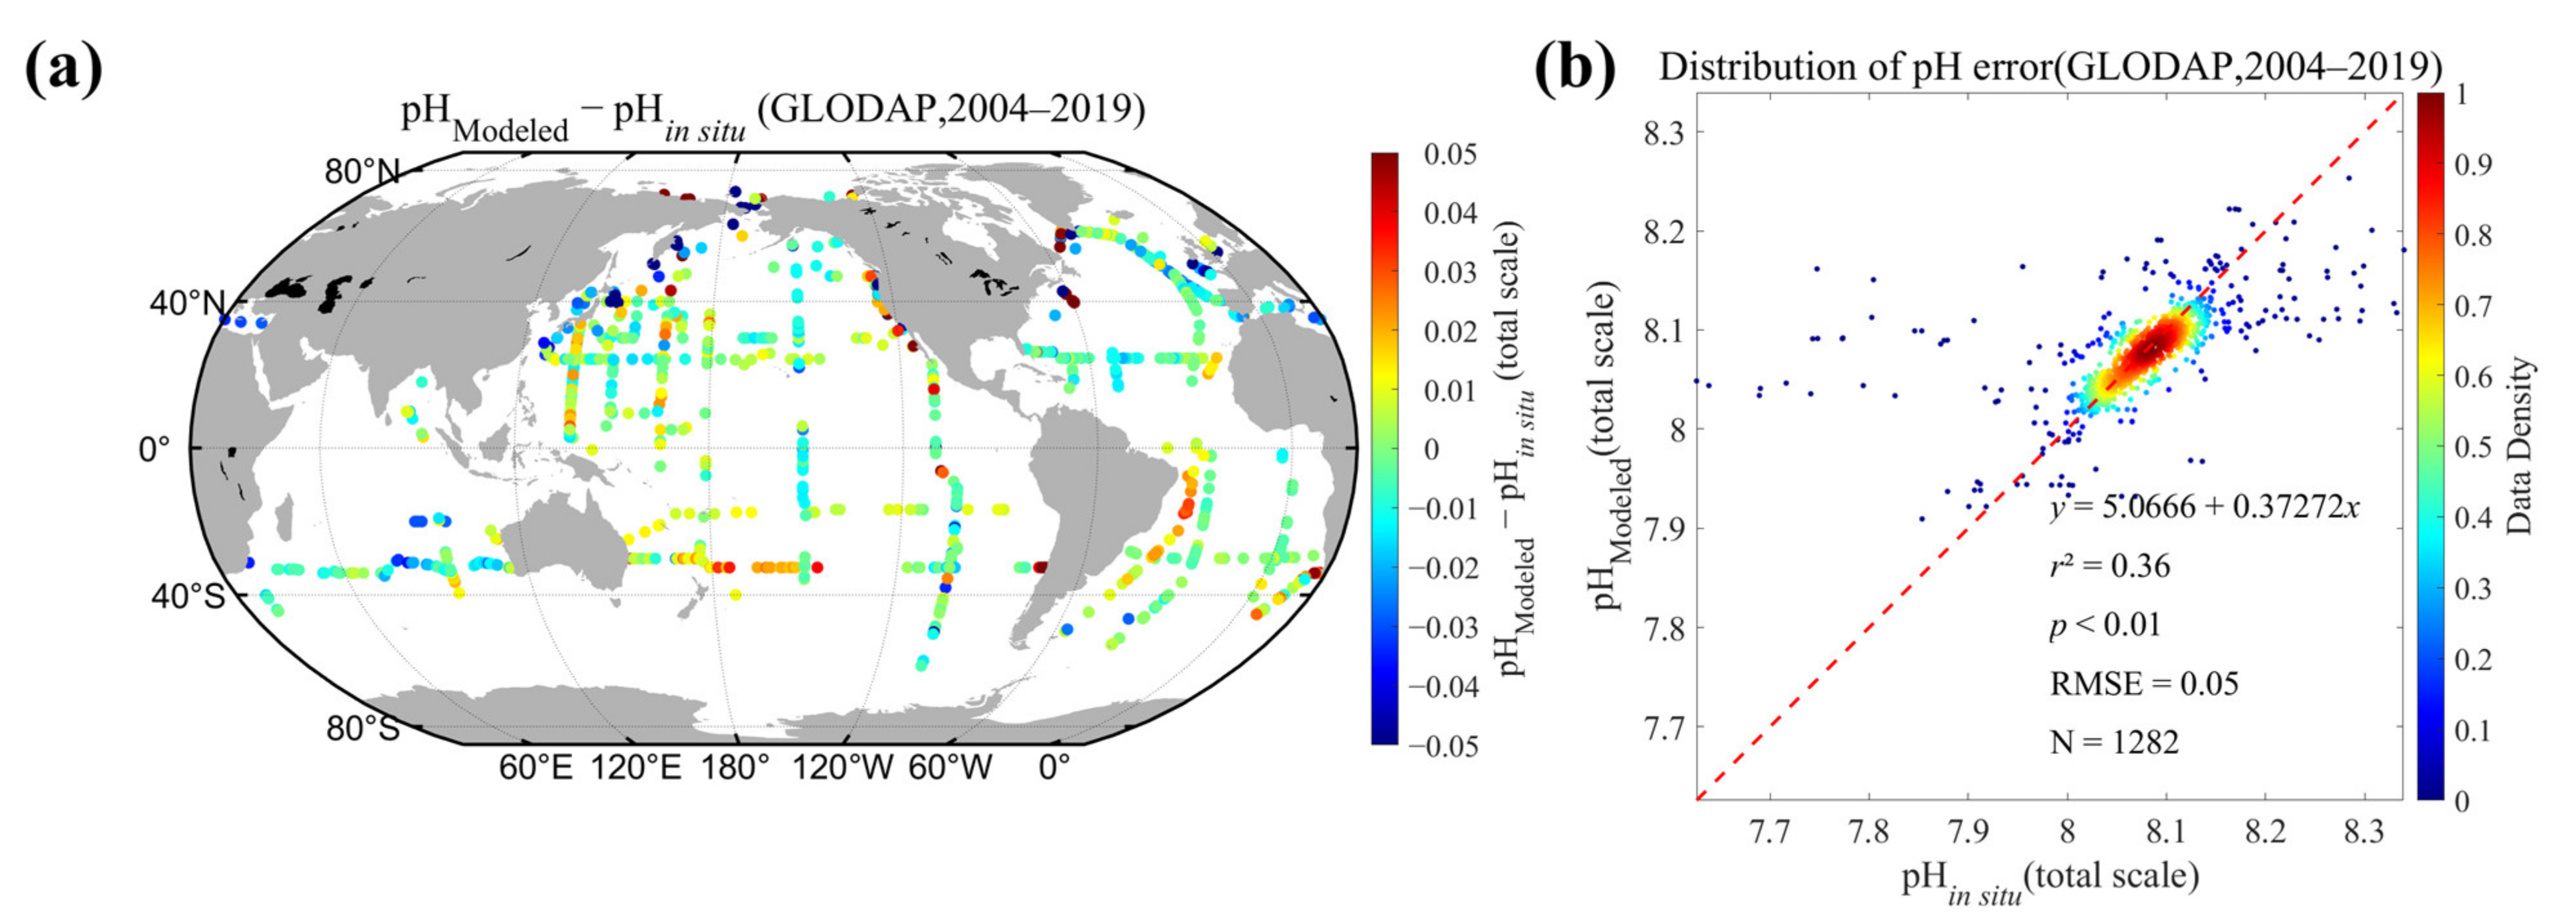
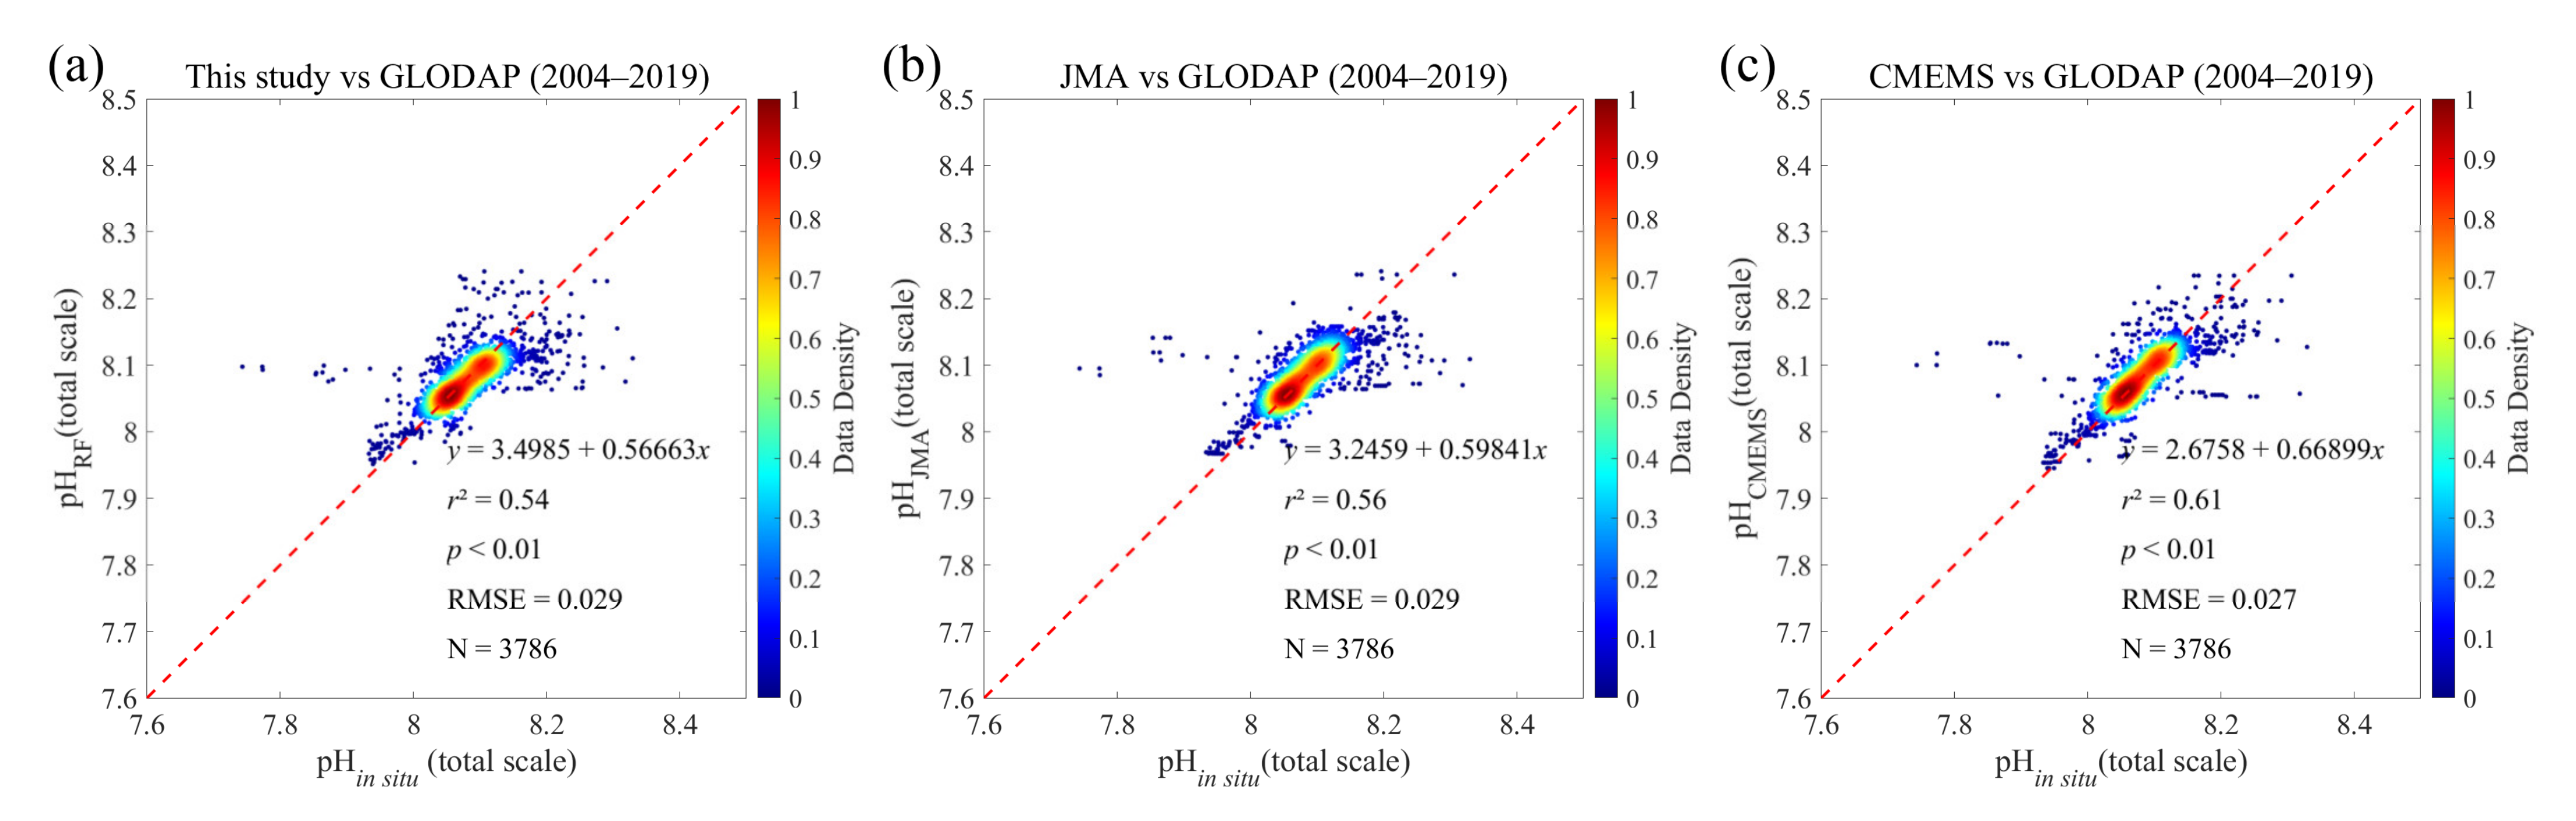
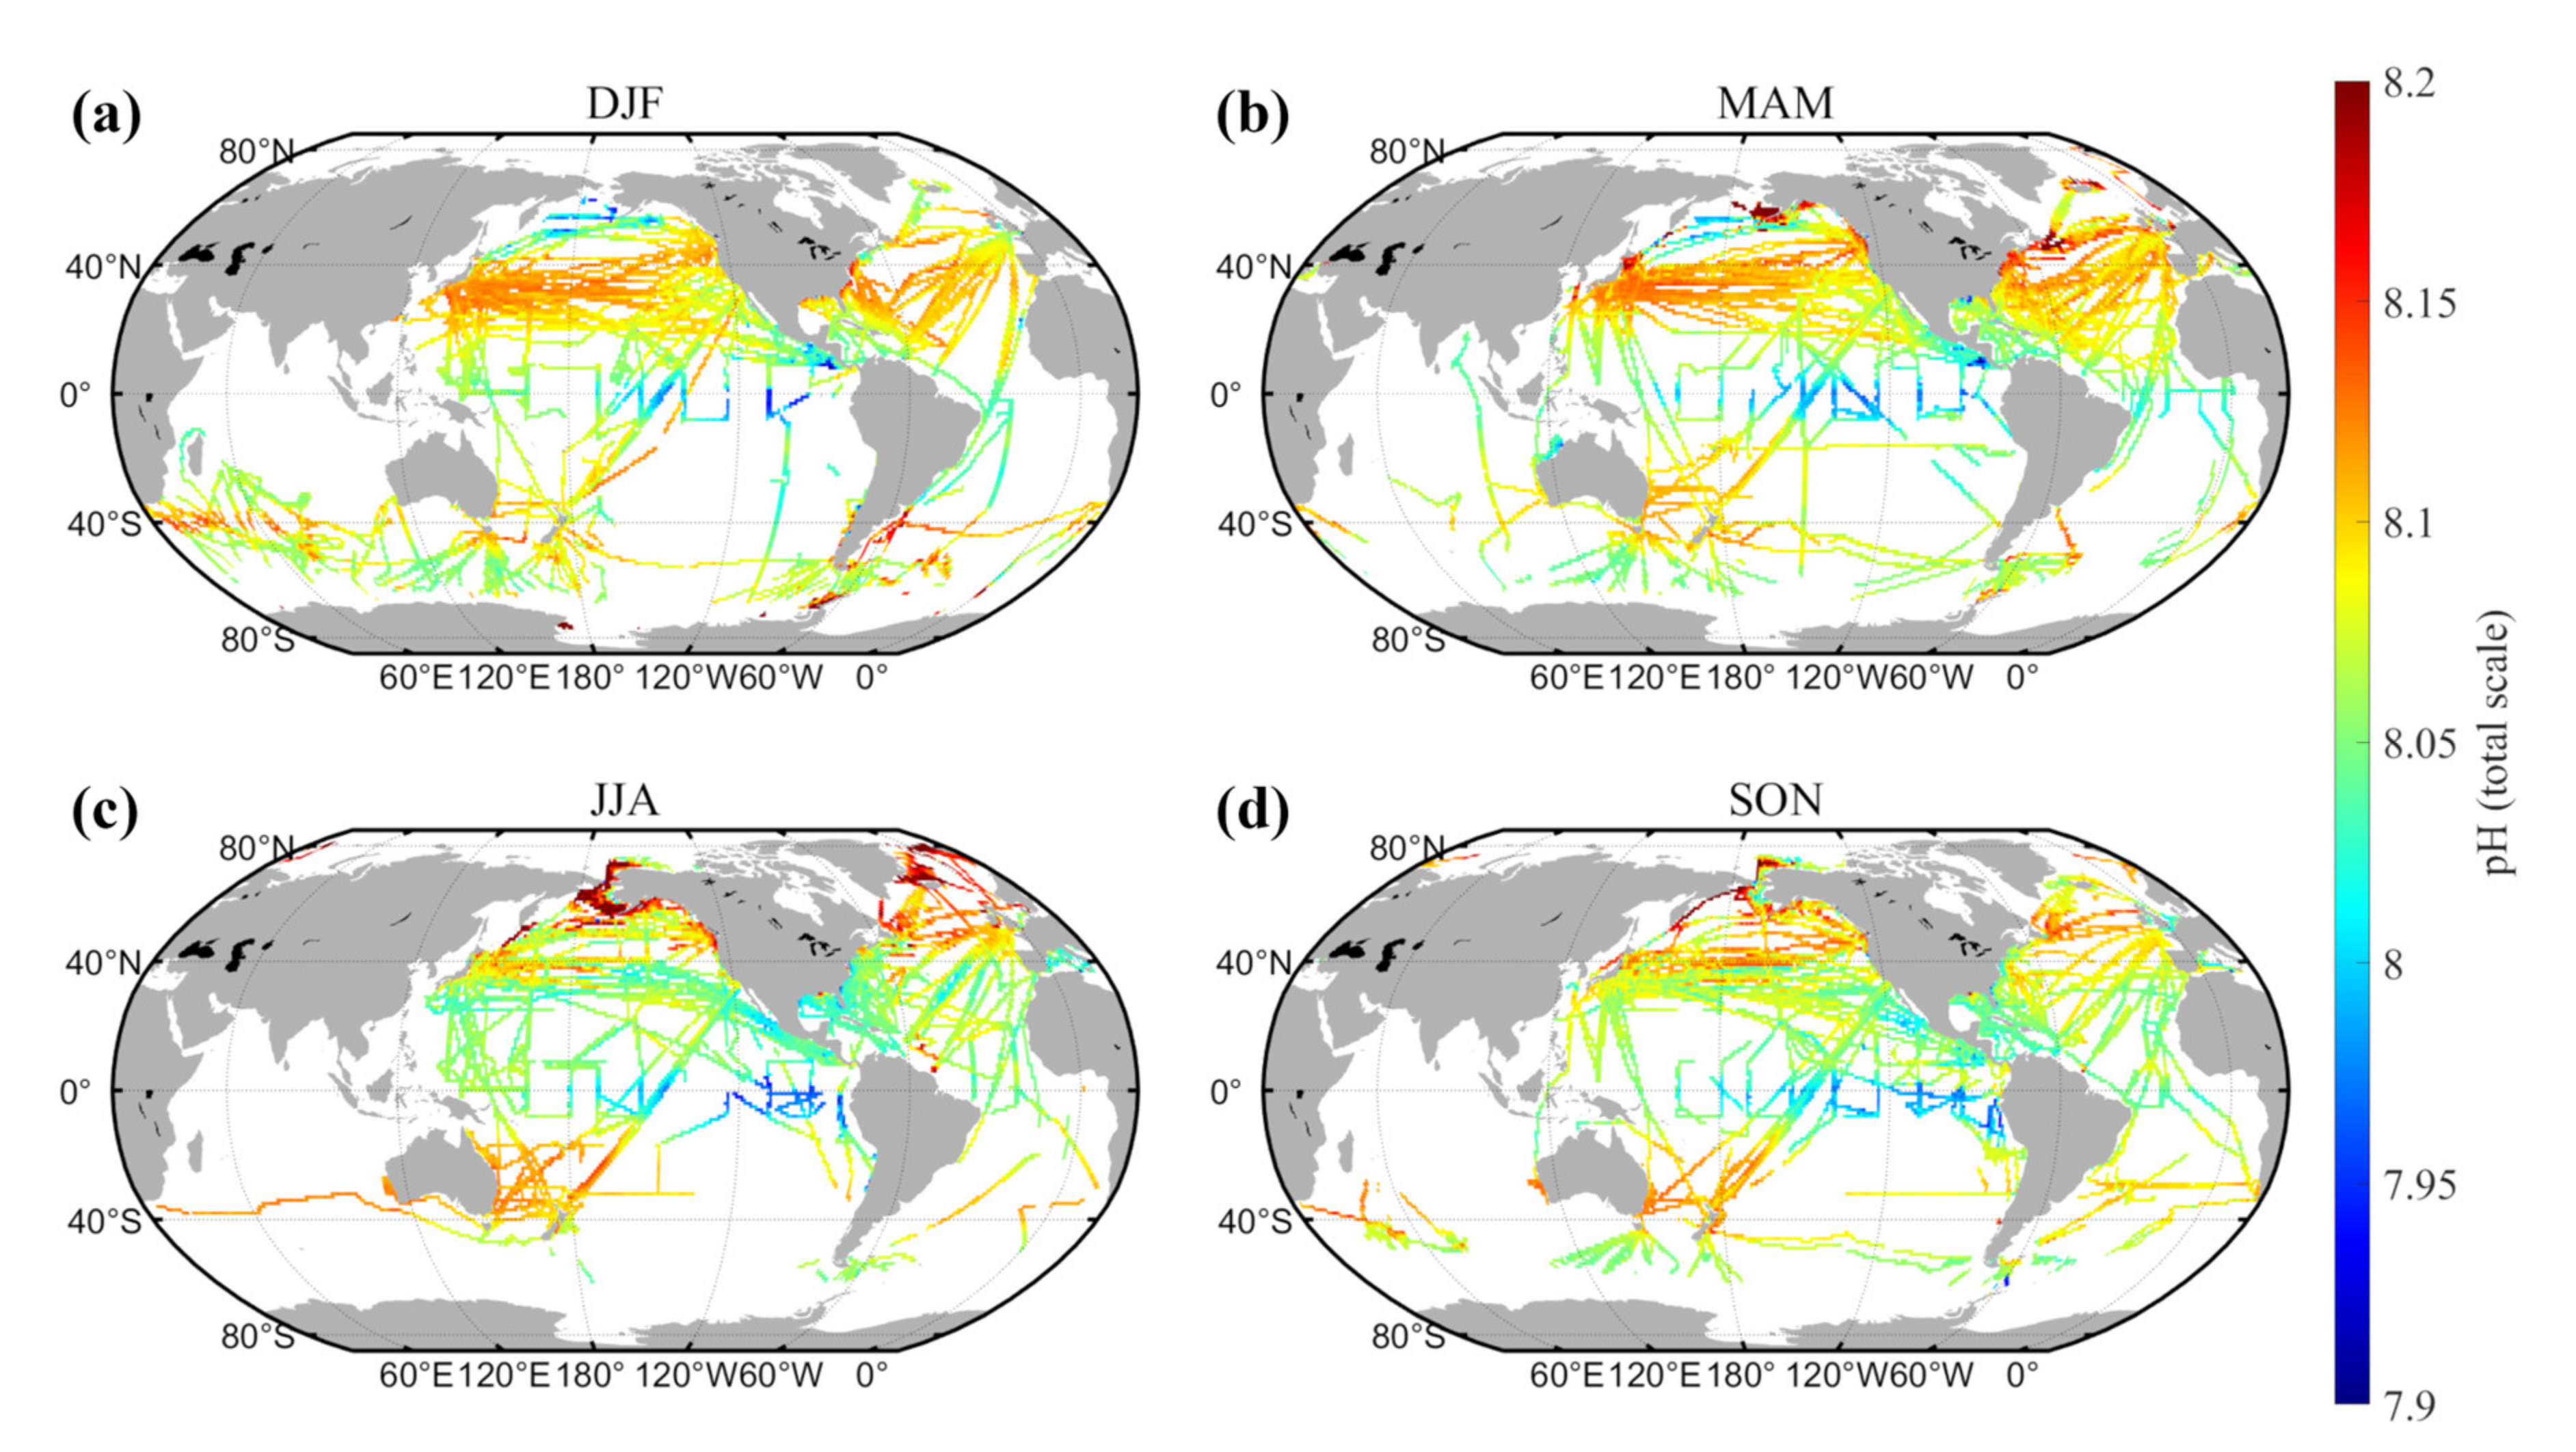
Accurate estimation of sea surface pH by satellite remote sensing has been a challenging task, and it is difficult to simulate mechanistically and to construct models using traditional empirical methods. There is a lack of sufficient spatially and temporally representative datasets for model training. In this study, we developed a method to obtain a large-volume global sea surface pH dataset based on the LDEO underway pCO2 dataset and estimated TA. On this basis, 18 experiments were set to compare three machine learning methods and eleven input parameter configurations. Finally, the RF-model-based sea surface pH remote sensing inversion model with LON, LAT, SST, Chla, and MLD as inputs that reflect spatial differences and physical and biological effects on sea surface pH was established, and it achieved satisfactory results based on various validation and sensitivity tests. Based on the model, we produced a monthly averaged product of sea surface pH at a spatial resolution of 0.25° × 0.25° from 2004 to 2019. Meanwhile, the pH product of this study is at the same accuracy level as similar international products.
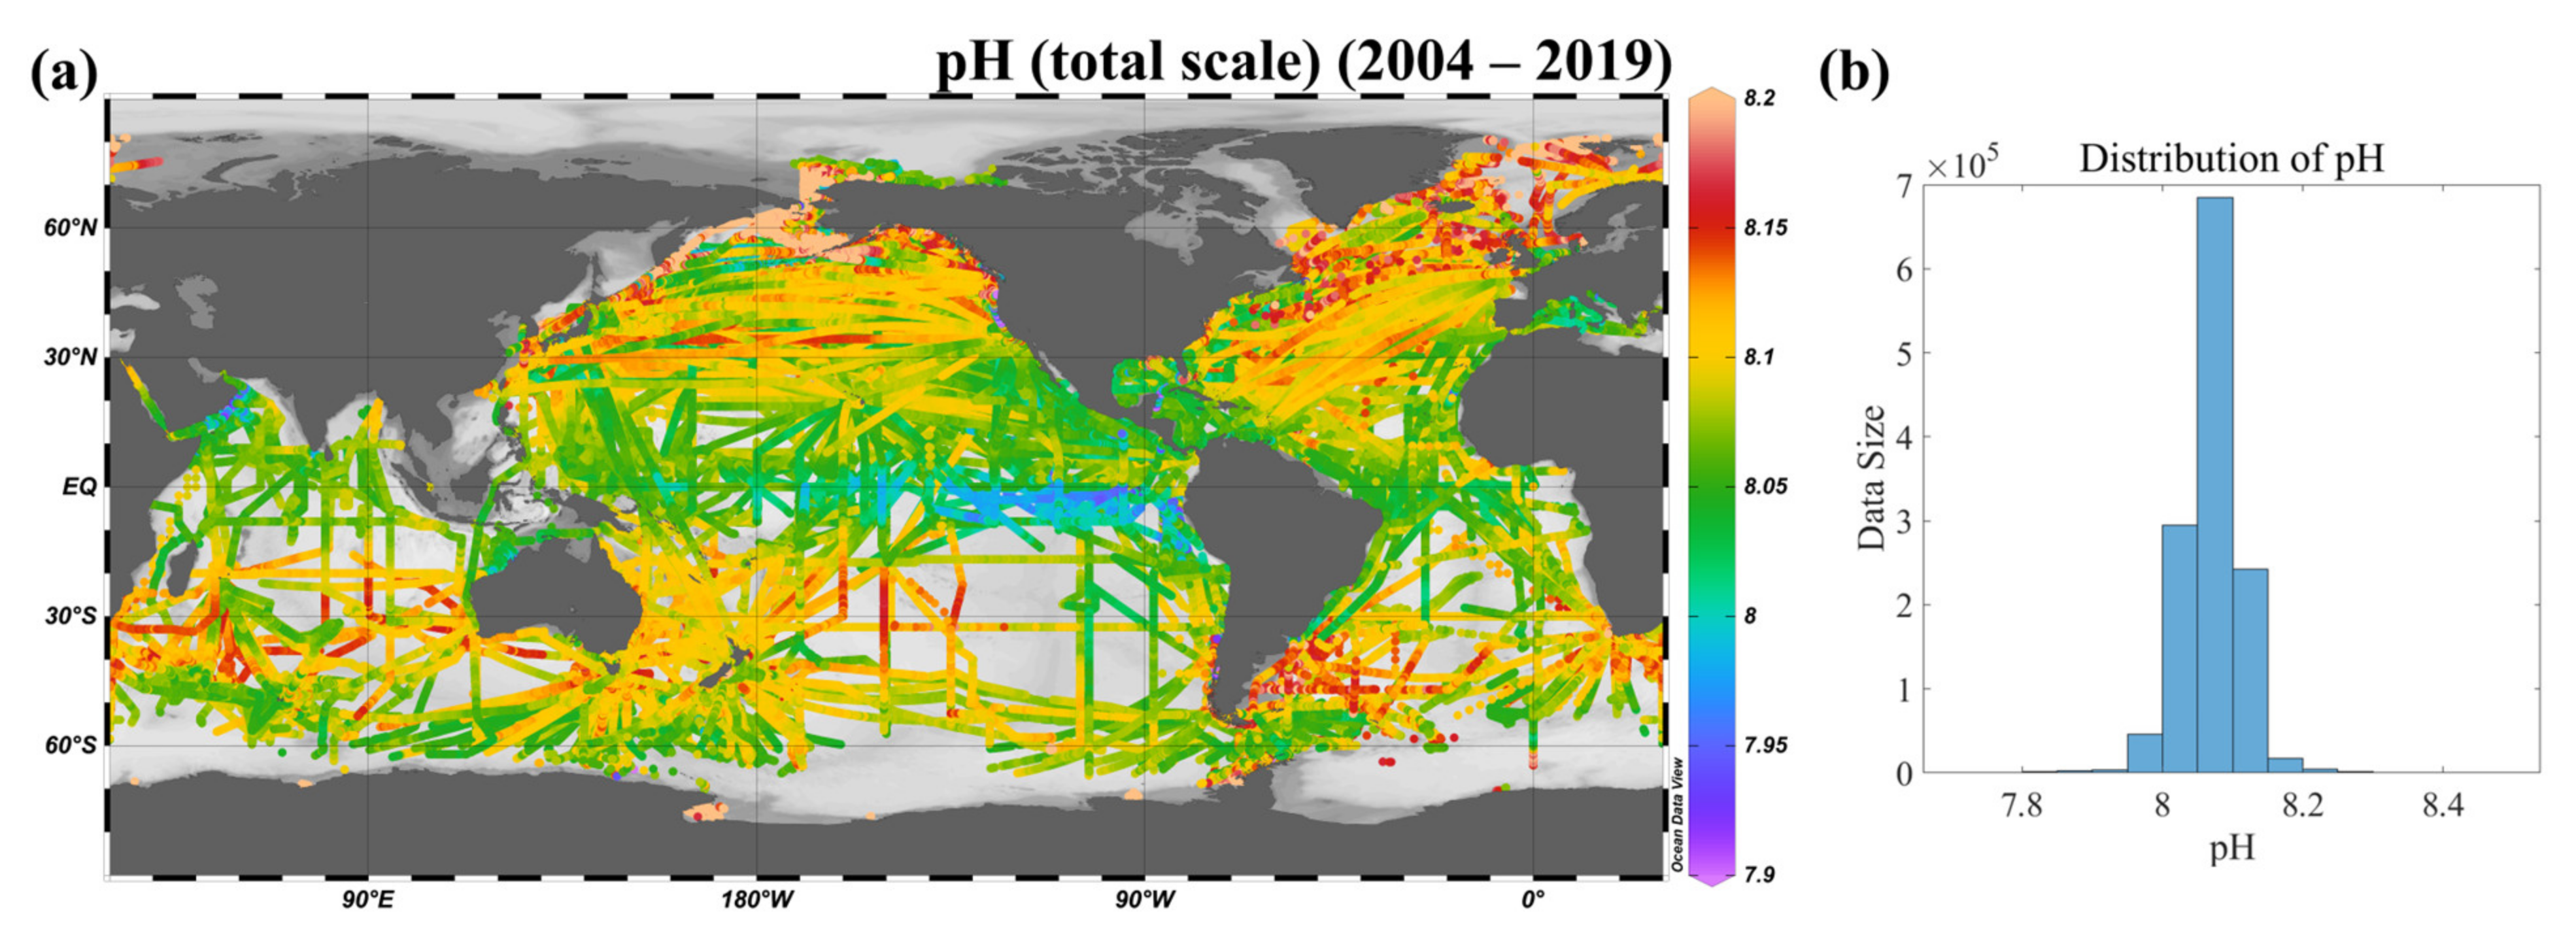
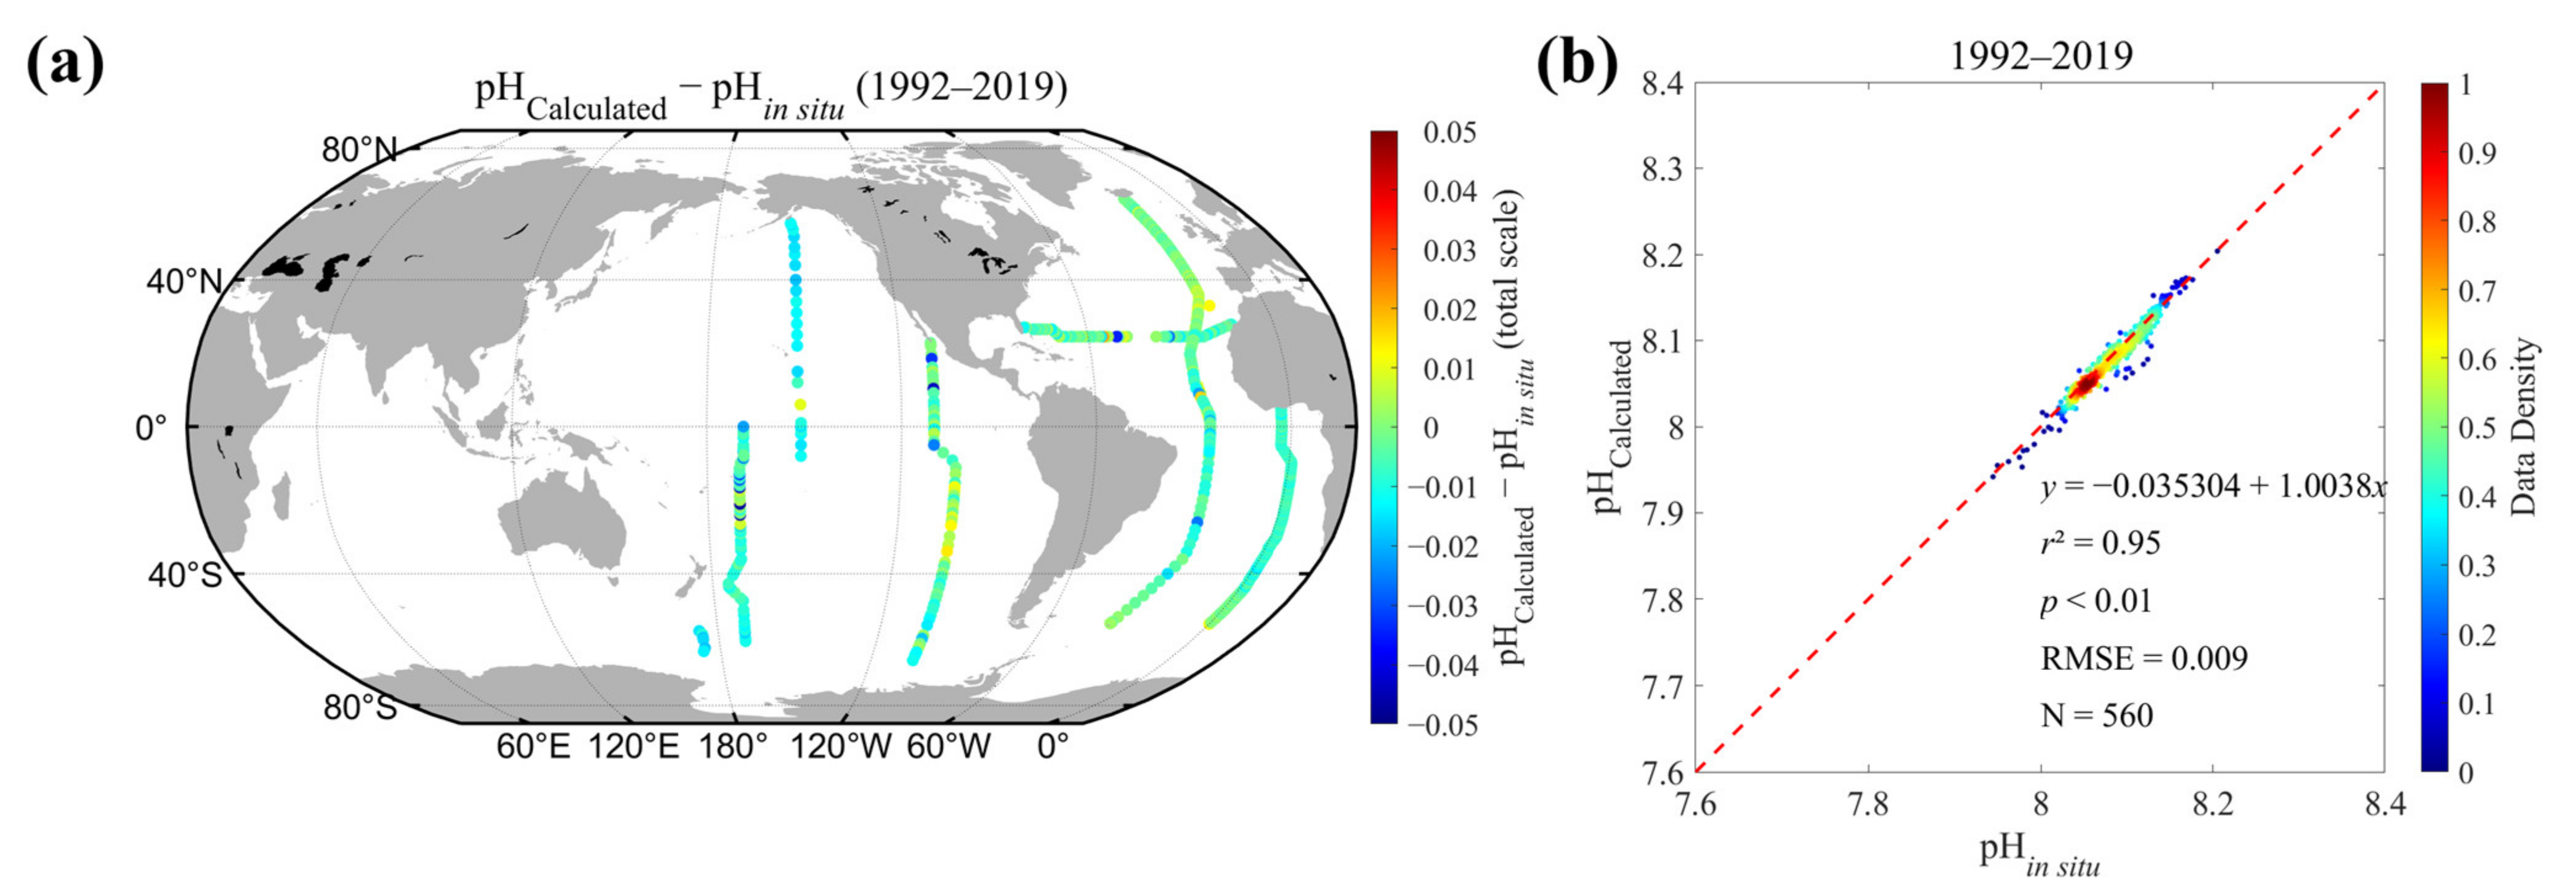
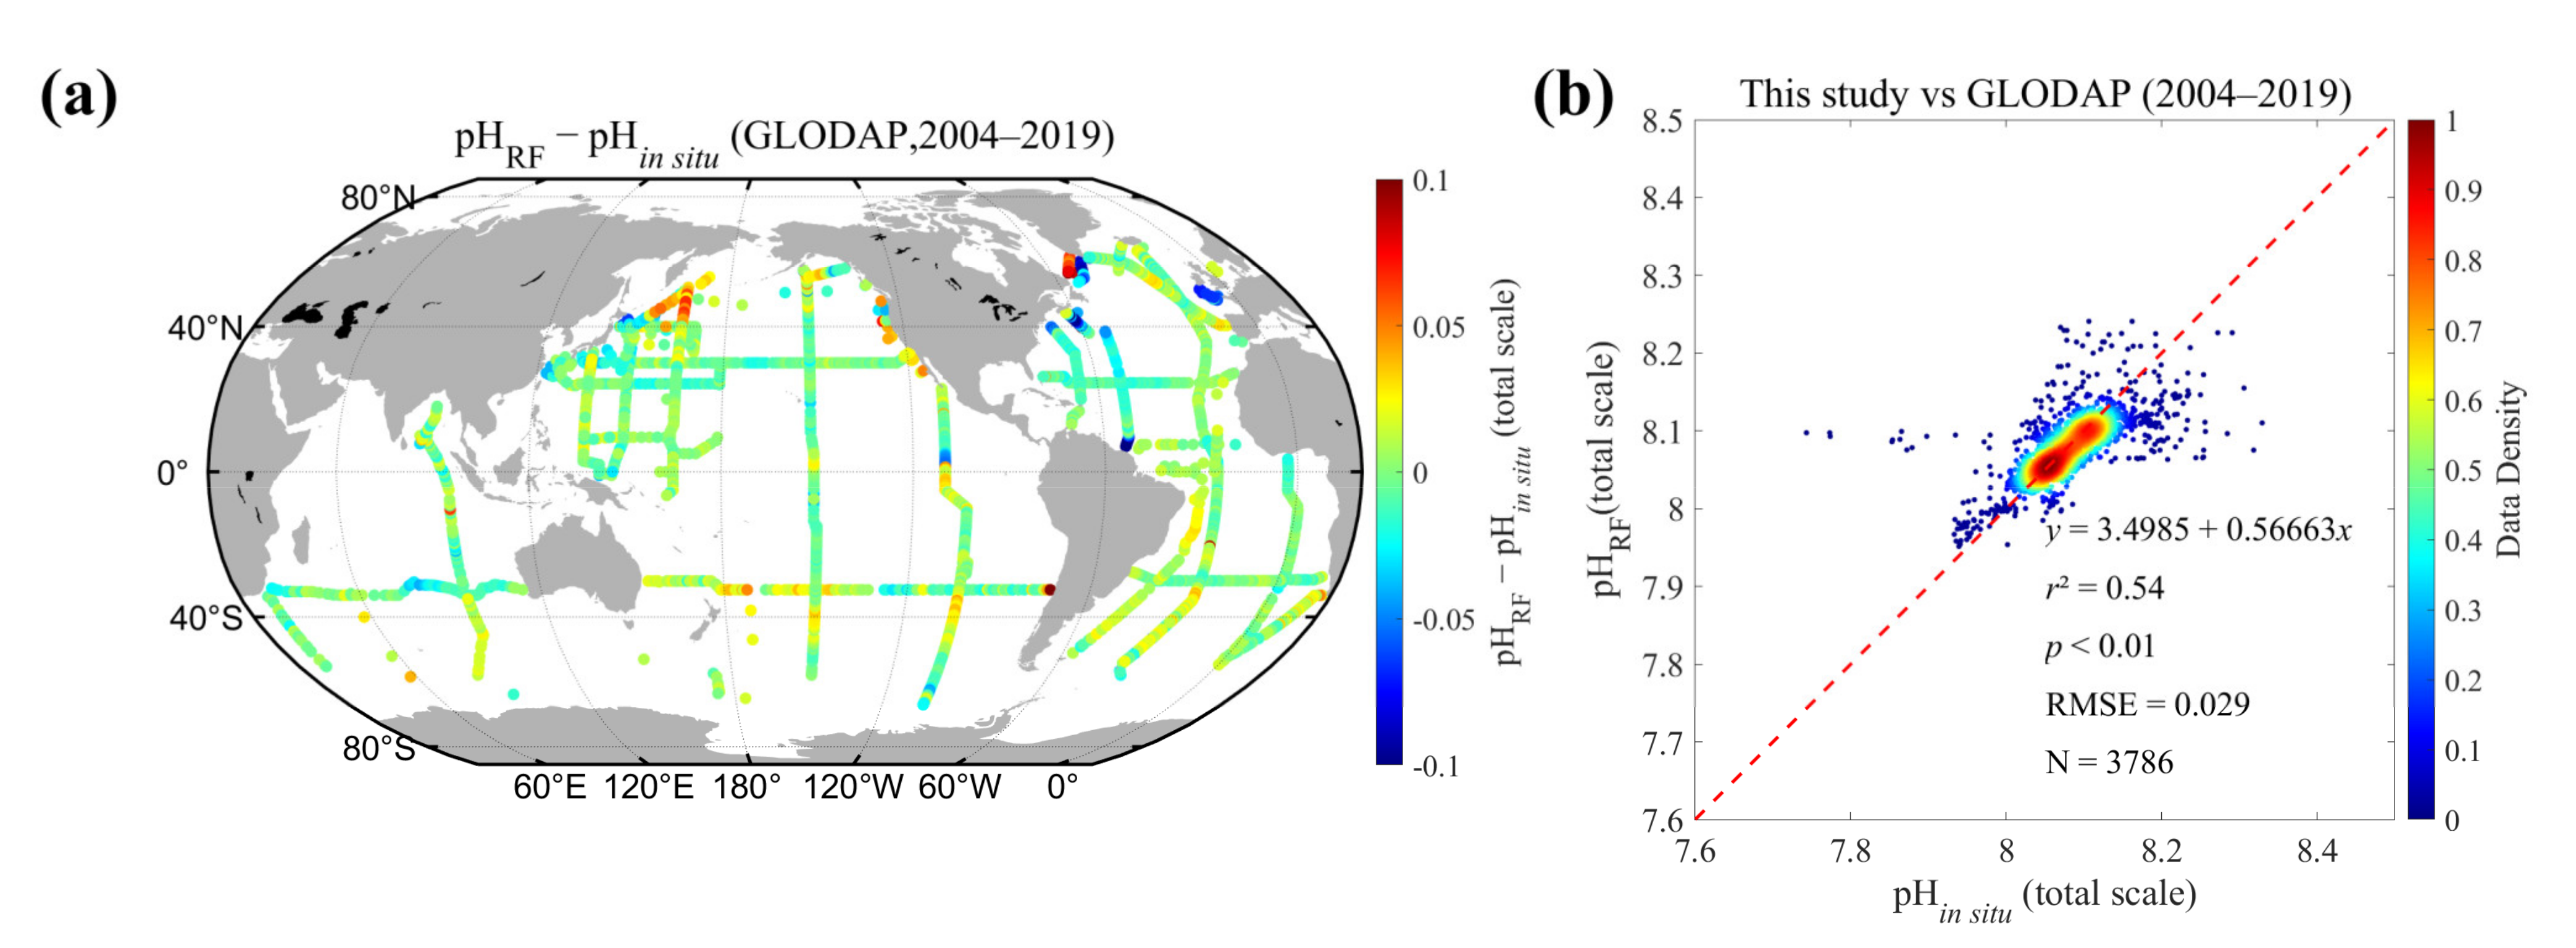
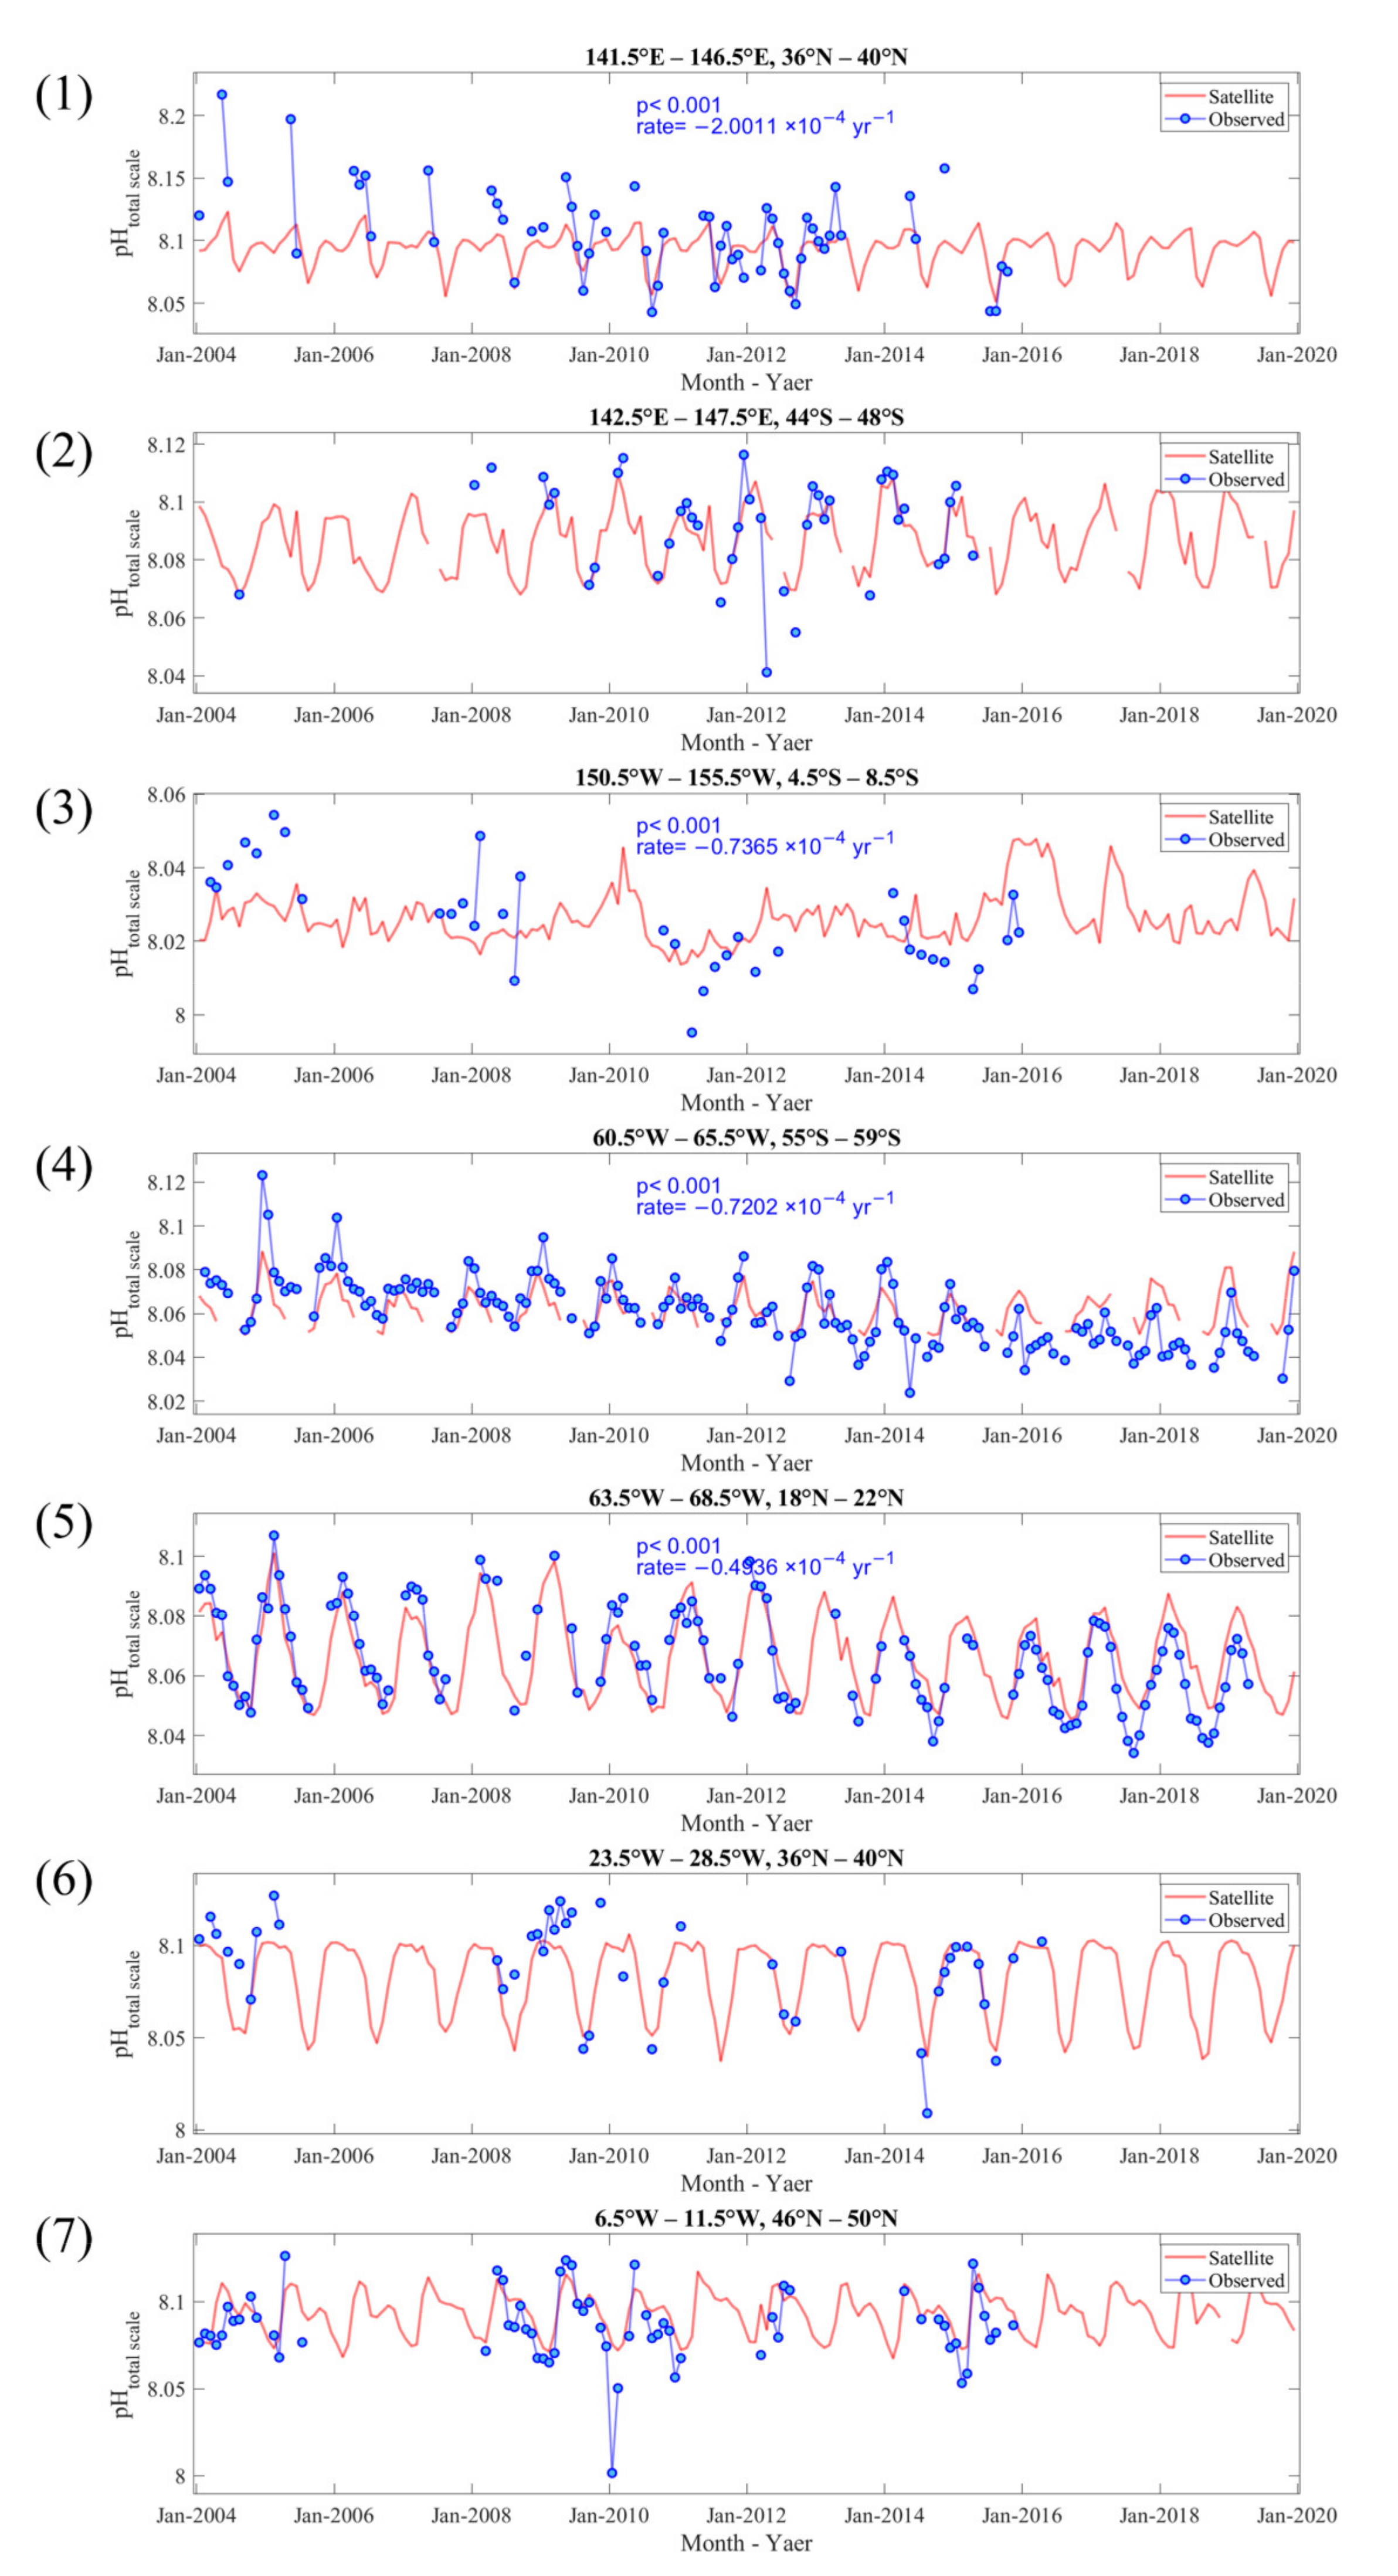
With the constructed calculated pH (in situ*), we could clearly see the decreasing trend in pH in many sea areas globally. Time-series satellite-derived pH values also exhibited similar trends that were generally consistent with pH (in situ*). These time-series datasets provide a refined view of the global pH variation on a high spatial and temporal scale, which will be of great help to global climate change studies and ecological environments.
The pH algorithm we developed was the direct inversion of pH. Although the pH inversion method in its current version was developed successfully and yields good results, there are still some unresolved problems in the pH calculation process: The original
pCO
2 underway data had to be quality controlled twice by the publisher and the authors, and there is still an inevitable measurement error, which is also passed to the pH dataset along with the pH calculation. In addition, because the carbonate dissociation constants of Lueker [
34] were used in the pH calculation, the data with SST of <2 °C were filtered in the calculation, resulting in a certain degree of missing pH data in high-latitude and polar areas. Therefore, the performance of this inversion model in these areas still needs to be optimized. A deeper investigation and parameterization should be conducted to improve the inversion accuracy. In this study, we only present the basic information of the global pH distribution and trends to show the performance of our algorithms and time-series satellite-derived pH dataset. More understanding of pH variation could be revealed based on these time-series datasets with detailed analysis of pH spatiotemporal distribution and inter-regional comparisons, which can also facilitate new parameterizations and algorithm updates.


 ,
, 


