Review

Cropping Patterns of Annual Crops: A Remote Sensing Review

Faculty of Geo-Information Science and Earth Observation (ITC), University of Twente, 7500 AE Enschede, The Netherlands
*
Author to whom correspondence should be addressed.
Remote Sens. 2022, 14(10), 2404; https://doi.org/10.3390/rs14102404
Submission received: 7 April 2022 / Revised: 5 May 2022 / Accepted: 11 May 2022 / Published: 17 May 2022

Abstract

:
Cropping patterns are defined as the sequence and spatial arrangement of annual crops on a piece of land. Knowledge of cropping patterns is crucial for crop production and land-use intensity. While cropping patterns are related to crop production and land use intensity, they are rarely reported in agricultural statistics, especially those relating to small farms in developing countries. Remote sensing has enabled mapping cropping patterns by monitoring crops’ spatial and temporal dynamics. In this paper, we reviewed remote sensing studies of single, sequential and intercropping patterns of annual crops practiced at local and regional scales. A total of 90 studies were selected from 753 publications based on their cropping pattern types and relevance to the scope of this review. The review found that despite the increase in single cropping pattern studies due to the Sentinel missions, studies on intercropping patterns are rare, suggesting that mapping intercropping is still challenging. More so, microwave remote sensing for mapping intercropping has not been fully explored. Given the complexities in mapping intercropping, our review highlights how less frequently used vegetation indices (VIs) that benefit from red-edge and SWIR spectral bands may improve intercropping mapping.

1. Introduction

The global human population is projected to grow to 9.7 billion by 2050 [1] Meeting future food demands will require increased crop production, reduced food waste and changes in consumption patterns [2]. Crop production needs to increase by around 70% by 2050, for which relevant policies and strategies will have to be updated. Several initiatives, including Good Agricultural Practices (GAPs), the 2030 Agenda for Sustainable Development and the Green Deal, have been developed to increase crop production [2,3,4]. The proposed strategies and policies are based on transitioning towards ecological cropping practices to substantially reduce external inputs (fertilisers and pesticides) and increase crop production without expanding cropland and further degrading natural resources.
The use of certain cropping patterns is one of the crop management practices that can fast-track sustainable intensification. Cropping patterns are defined as the sequence and spatial arrangement of annual crops on a piece of land [3,4,5]. Cropping patterns are chosen based on agricultural policies, socio-economic and environmental factors, water availability and crop management practices [6,7,8,9]. Due to these factors, cropping patterns are dynamic; they change both in time and space. Therefore, periodically reporting such changes in cropping patterns is important for policymakers, farmers and agronomists, as this information is required for land management planning and food security assessments [10,11].
In agricultural statistics, the reporting of cropping patterns is rarely conducted; only cropland information such as cropland extent, crop type and crop progress and condition is reported. Cropland information is obtained through household-based surveys or cadastral ground surveys. In addition, the collection of such data is mainly location-specific and rarely covers large areas comprehensively. These data collection approaches are labour intensive, time-consuming, expensive and rarely periodic. Further, cropland information such as fields’ extent, crop conditions and yield estimates obtained from farmers’ reports showed systematic bias and high inaccuracies [12]. These challenges make it difficult to compile reliable and accurate cropland information and understand cropping patterns in a specific location and on a large/regional scale. Consequently, there is an information gap on cropping patterns practiced by different countries.
Unlike traditional surveys, remote sensing capabilities extend beyond a specific location, as cropland information can be obtained at regional and global scales. Multi-source remotely sensed data can be used to estimate and monitor cropland information with an accuracy sufficient to aid the understanding of the agricultural landscape.
However, there is still no comprehensive review focusing on mapping cropping patterns of annual crops using remote sensing.
This paper reviews previous work on different methods and sensors used for mapping cropping patterns of annual crops over the years. To successfully do so, the context, background and importance of mapping cropping patterns are established through (i) defining common cropping patterns as used in this review paper; (ii) presenting current cropping patterns and trends; and (iii) outlining the role of remote sensing in acquiring cropping pattern information. The objectives of this paper are, therefore, (a) to provide an overview of the most common annual cropping patterns practiced and their definitions; (b) to provide an overview of remote sensing studies that considered cropping pattern mapping of annual crops; (c) to highlight remote sensing data and methods used; (d) to present perspectives/future opportunities of using remote sensing as a tool for mapping cropping patterns.

Review Approach

In this review, we selected studies that were based on mapping annual crops with single, sequential and intercropping cropping patterns. The following databases were used for the literature search: Scopus, Web of Science, Google Scholar and ResearchGate. In the relevant remote sensing studies focused on mapping cropping patterns, terms such as cropping systems/cropping practices/cropping intensity were interchangeably used. Thus, these terms were included in our search strategy as: (“cropping pattern” OR “cropping practice” OR “cropping system” OR “cropping intensity” OR “multiple cropping” OR “intercropping” OR “sequential cropping”) AND (“remote sensing” OR “mapping”). The majority of studies were from 2005 onwards, perhaps attributed to the recent availability of MODIS products in the early 2000s. We, therefore, focussed our review of cropping pattern studies from 2005 to 2021. A total of 753 papers were identified, of which 58 were duplicates and hence were removed. For the remaining 695 studies, we adopted the PRISMA method for the identification, screening and eligibility of the papers to be reviewed. The screening method was based on reading the title of the papers and any titles that did not meet our scope and were not on mapping/cropping pattern/cropping practice, etc., were excluded (553). We downloaded the remaining 142 studies and browsed through the full text, including maps and conclusions, to check if the studies were on mapping annual crops in single, sequential and intercropping patterns. The selection was challenging because, among single cropping pattern studies, there were many studies on mapping crop types of single crops. As crop calendar and crop phenology are important parameters in mapping cropping patterns, we also selected studies that focused on crop type mapping using those parameters and used multi-temporal data. A total of 90 papers were eligible and relevant for our review (Figure 1).

2. Cropping Patterns, Cropping Trends and Cropping Pattern Identification Using Crop Characteristics

In the remote sensing literature, cropping patterns have been broadly studied, but historically, much of the focus has been on mapping agricultural land and crop types. Over time, more agricultural research opportunities ensued due to the increasing availability of satellite data and rapid advancements in remote sensing applications, e.g., machine learning methods.
Despite the increase in remote sensing-based agricultural studies, the use of agricultural terms within the context of cropping patterns has been inconsistent and lacks clarity. This is due to the interrelationship in the terminology used to describe various cropping practices, such as cropping patterns. Therefore, it is necessary to define and clarify the context of cropping patterns within cropping systems and understand the crop characteristics used to identify the patterns and discuss current cropping trends before reviewing the related studies.

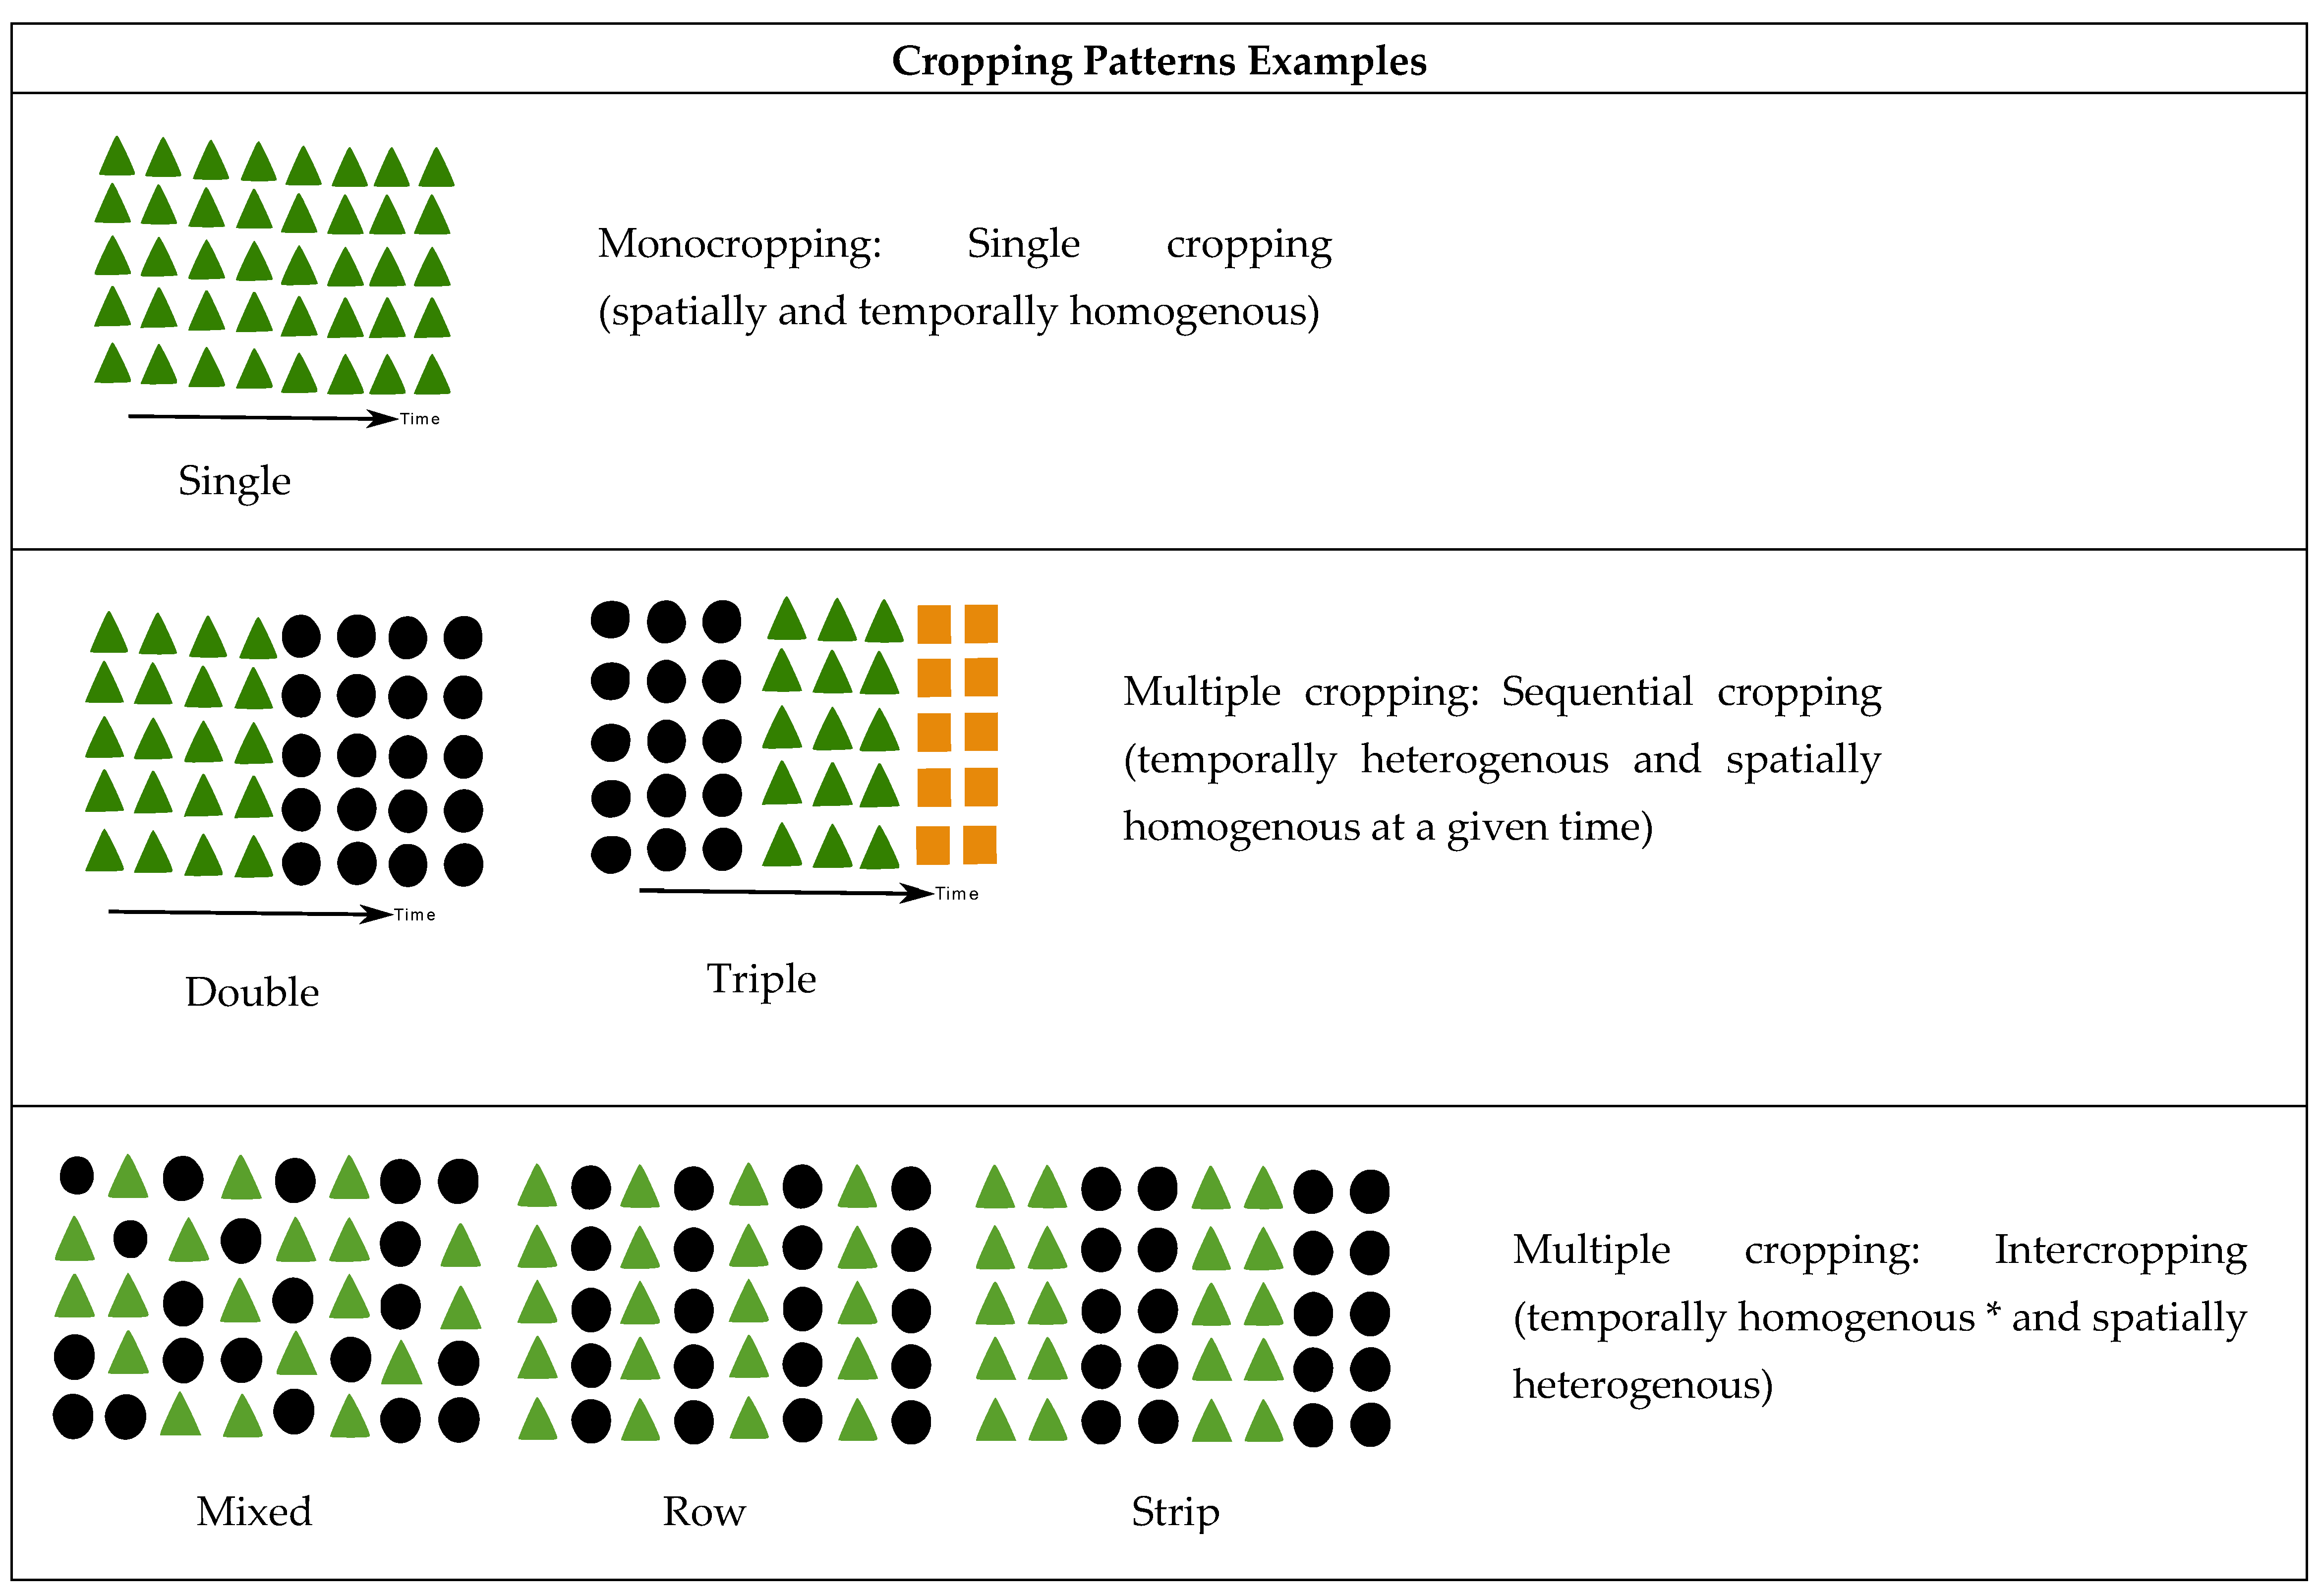
2.1. The Context of Cropping Patterns

Cropping patterns are part of an ensemble of a cropping system, which consists of all the components needed for crop growth and for the good interrelationship between the crops and the environment [13,14]. Cropping system and cropping practice are related terms, as cropping practices describe different components within a cropping system [3] and is not limited only to cropping patterns. The term cropping practice, amongst other components, includes irrigation, tillage, harvest practices, crop varieties and fallow. The effective management of cropping systems is through reasonable control of pests, plant diseases, soil nutrients, water and land usage and the choice of suitable cropping patterns to optimise the use of available resources and maximise yield at the field scale [13,15,16]. Therefore, cropping patterns are closely linked to crop production and land-use intensity [15]. Inappropriate management and choice of cropping patterns can cause negative impacts on water usage, soil health, greenhouse gas emissions (GHG) and regional climate, resulting in reduced crop production and natural resource degradation [15,16]. Therefore, within a cropping system, cropping patterns can play a significant role in sustainably increasing crop production to ensure food security.
Cropping patterns are distinguished through their designed spatial arrangement within a field. There are two main categories, monocropping (one crop in a field per year) and multiple cropping (more than one crop in the same field per year) [3,17] (Figure 2) Multiple cropping has been commonly practiced primarily in small farms of developing countries, whilst monocropping practice (single crop) is more prevalent in large farms of developed countries [10].
Multiple cropping is further categorised into intercropping and sequential cropping (Figure 2). Intercropping is a traditional farming practice that is ancient and dates back thousands of years [18,19]; it can be considered a “complex cropping pattern” compared to the other cropping patterns. It is defined as two or more crops growing simultaneously in the same field [3,18]. The practice is widespread in Asia, Africa and Latin America and up to the 1940s, it was common in Europe and the United States (US) [20]. Among intercropping patterns, agroforestry, mixed, row and strip cropping are widespread (Figure 2) [21]. Agroforestry is considered an entire land-use system where agricultural crops, woody perennials and, at times, animals are managed together in a field [22]. Mixed intercropping is when two or more crops grow together in no distinct row arrangement [20,21]. It is commonly practiced in indigenous slash and burn or fallow agriculture. Row intercropping involves two or more crops that grow simultaneously with at least one crop planted in rows [20,22,23]. In strip intercropping, the crops grow together with enough distance to permit each crop’s cultivation separately but close enough for the crops to interact [20,21].
Sequential cropping is when two crops are planted consecutively in one growing season (the portion of the year in which conditions permit crop growth) and the most commonly practiced type is double cropping. Other types of practices such as triple and quadruple cropping can mean that the sequence of crops extends beyond one calendar year.
The practice of multiple cropping can reduce the risk of crop failure since the failure of one crop can be compensated by the other [20,23]. The complementary pairing of different crops can improve soil fertility [21,24]; legumes can fix nitrogen from the air into the soil then to the crop roots by allowing the rhizobium bacteria to grow nodules on crop roots. In such a system, there is an efficient use of natural nitrogen, reducing chemical fertilisers use. Intercropping practice is also seen as a solution for reducing carbon emissions into the atmosphere through carbon sequestration (capturing carbon dioxide from the atmosphere) [25]. A study by Ferreira et al. [26] showed that carbon stocks in an intercropping system were higher than in monocropping systems. This illustrates that the practice of intercropping within commercial agricultural systems can contribute to reducing GHG emissions. Furthermore, the dense planting of crops in an intercropped field reduces weeds and soil erosion while maximising land use. The higher the heterogeneity of crops, the less compatible the parasites for the crops, resulting in the reduction of pest infestation and plant disease [24,27]. In summary, multiple cropping patterns, particularly intercropping, are efficient cropping practices in terms of resource utilization.

2.2. Current Status and Trends in Cropping Patterns

From the 1960s till 2015, global crop production more than tripled, mainly because of the Green Revolution. The introduction of productivity-enhancing technologies such as hybrid crops, pesticides, fertilisers and herbicides, agricultural land expansion and increased the use of irrigation played a huge role in increasing yield and production [17,28]. The revolution’s focus was to efficiently produce more food at affordable prices whilst increasing farmers’ profit. This led to the widespread adoption of conventional agricultural methods and technologies associated with monocropping practices.
There is increasing evidence of the harmful effects of widespread adoption of conventional farming practices on the environment and climate [28,29,30]. According to FAO [31], GHG emissions have doubled during 1960–2015, because of deforestation due to agricultural expansion and the vast increase in the use of herbicides, pesticides and fertilisers. These inputs can seep through the soil into the groundwater and other water sources, leaving the soil without nutrients and contaminating the water resources [32]. Therefore, land, soil and water resources are at risk; as a result, conventional agricultural practices may no longer sustainably meet food demands.
The advancements brought by the Green Revolution increased crop production; however, many developing countries, especially in sub-Saharan Africa, did not benefit substantially. Either they could not access/afford these productivity-enhancing technologies and inputs, or the technologies were not adapted to the conditions; hence they were left behind [33,34,35]. Limitations, such as access to land, also pushed farmers in these regions to continue to find innovative and low-cost ways to produce more crops from their available land. Continued innovation and adaptation to ensure resilient and sustainable production on limited amounts of land is also needed in the face of climate change.
Incentive programmes such as the United States Department of Agriculture (USDA) Environmental Quality Incentives Program (EQIP), GAP Incentives and ABC Plan contribute to the gradual shift from conventional farming methods to more agroecological farming methods, resulting in a change in cropping patterns. Globally, maintaining sufficient crop production processes remains a challenge; therefore, tracking and tracing changes in cropping practices, such as cropping patterns, can assist in understanding improved crop production processes. Remote sensing can provide spatial and temporal information that allows for tracking and tracing these changes [36]
Various review papers have been based on remote sensing methods and data used for agricultural monitoring and mapping [37,38,39,40,41,42]. The majority of these studies highlighted data and methods but did not sufficiently address the type of cropping patterns. A study by Bégué et al. [3] reviewed the most relevant cropping practices, including cropping patterns. Their review mainly focused on identifying, categorising and defining cropping practices within a remote sensing context. Further, the reviewed studies were based on diverse cropping practices such as agroforestry, crop rotation and other closely related studies on crop management methods (irrigation, fertilisers, harvest/post-harvest practices). However, a review on mapping cropping patterns especially single, sequential and intercropping, of annual crops is still missing. Therefore, it is important to focus on the main types of cropping patterns of annual crops that have been studied over the years using remote sensing data and methods.

2.3. Important Crop Characteristics Used for Identifying Cropping Patterns

Over the last 50 years, the growth in remote sensing data availability, especially optical data and the advancement in methods, has made crop pattern identification possible [43]. Remote sensing approaches can offer low-cost, periodic, up-to-date information at different scales [44,45]. Several studies showed that optical remote sensing data and methods could be used to study croplands and periodically map cropping patterns in various regions all over the globe, from local to regional scales [15,34,44,45,46].
Additionally, there is a growing interest in the utilisation of microwave data due to (almost) all-weather availability and the sensitivity of the signal to the structural make-up of crops, e.g., crop density, size, dielectric properties and orientation [47]. The growth in high spatial and temporal resolution microwave data availability (e.g., Sentinel 1) has led to the utilisation of active microwave sensors for crop monitoring within fields [48,49,50,51].
Cropping pattern mapping is performed through crop monitoring, which can be based on crop type identification using multi-temporal data. Crop type mapping has been studied for decades using multi-temporal optical imagery. There is a correspondence between the characteristics of crop types and optical sensor properties. Generally, crop characteristics are linked to the biochemical, morphological, structural, physiological and phenological traits that influence/impact crop status, growth, reproduction and survival. They indicate how crops respond to the environment and its ecosystem [52,53]. These traits can be sub-divided into different subgroups, including typological (e.g., crop type), biophysical (e.g., leaf area index, crop height), biological (e.g., crop phenology), biochemical (e.g., leaf chlorophyll content, leaf nitrogen content) and geometrical (e.g., plant density, leaf inclination) [54]. The biochemical and biophysical traits are crop type-specific and their variations are also indicators of crop growth stage and crop condition. Biological and typological traits play an important role in identifying cropping patterns [11,46,55]. Crop phenology, particularly the changes in the start and end of crop growing seasons, is critical in differentiating cropping patterns using satellite data. In addition, different crop types have different crop calendar information, which is key in identifying different cropping patterns. The different crop calendar information illustrates that the different cropping patterns, particularly sequential and intercropping, will go through the crop growing stages/cycles at different times (Figure 3). This, therefore, can permit the identification of different cropping patterns in a field using remote sensing data.
In addition to crop type and crop phenology, other crop characteristics such as leaf chlorophyll content, leaf nitrogen content and leaf area index can also be used to identify cropping patterns [55]. For example, the crop’s photosynthetic activity evolves during leaf development as the crop grows through different cycles. This alters the biochemical (e.g., chlorophyll content) and biophysical (e.g., crop height and leaf size) properties of the crops during their growth. In the case of sequential cropping of maize and wheat, they have distinctive growing stages. The tillering and leaf growth stage of winter wheat last the entire winter season whilst the leaves of maize distinctly develop at the vegetative stage [56]. The leaf area index of maize increases rapidly in a short time compared to winter wheat due to its larger leaf size. This makes it possible to identify different cropping patterns, particularly using high temporal remote sensing satellite data.

3. Remote-Sensing Based Studies for Mapping Different Cropping Patterns

3.1. Single Cropping Mapping

Single cropping studies show a wide variation in the use of sensors. Traditionally, optical sensors were the most commonly used sensors for mapping crop types within fields. Optical sensors with high and very high (e.g., UAV) spatial resolutions have enabled accurate identification of single cropping within a field. Such sensors generally cover very limited spatial extents and permit the mapping of crop types in small-sized fields [57,58,59,60]. Hajj et al. [61] made a local study using SPOT 5 HRG multi-temporal data to monitor and map sugarcane fields in North America. Other reviewed studies indicated that most large spatial extent (regional/global scale) mapping used medium to coarse spatial resolution sensors, although there were studies that used sensors with high spatial resolutions [62,63]. Regional and global scale studies used Landsat 8 OLI TIRS, MODIS VI products and PROBA-V optical sensors [64,65,66,67,68]. Sentinel-2 images were also utilized for regional mapping of single crops in China and the US [62,69].
High temporal resolution microwave sensors such as RADARSAT-2, Sentinel-1, ERS and SkyMed have been used to map single cropping both independently and integrated with optical sensors [70,71,72,73,74,75,76,77,78]. Sentinel-1 sensors have also been used for regional mapping of paddy rice in Asia [79,80,81], while Ramadhani et al. [82] integrated microwave data with Sentinel-2 and MODIS MOD13Q1 to map rice in Africa regionally. A review study by Orynbaikyzy et al. [83], showed that over 40 studies from 2013 to 2019 exist on mapping crop types using both optical and microwave sensors. A few other studies used hyperspectral or LIDAR sensors to map single crops [84,85,86,87]. Sentinel sensors were the most used sensors for mapping single cropping in local and regional studies and with rice being the dominating crop in Asia and maize in Africa.
Studies on mapping single cropping patterns were based on crop phenology and the spatial arrangement of crops. Single cropping studies were based on crop type knowledge and not all crop type studies considered annual cropping patterns. Mapping single annual crops using single date imagery can be unsatisfactory because of crop growth changes during the growing season. To determine the type of cropping pattern in different regions, monitoring crop phenology during the growing season was necessary. The mapping of single cropping patterns focuses on exploring high spatial and temporal resolution imagery to monitor, identify and map crop types within different fields throughout the growing season. Single cropping patterns are spatially homogenous compared to other cropping patterns, such as multiple cropping. Their system has one crop type and a single phenological cycle. Overall, our review shows that studies on mapping single cropping exist both on local and regional scales using high spatial and temporal resolutions across different sensor types.

3.2. Mapping Sequential Cropping

Mapping sequential cropping has been done at local, national and regional scales, though mostly on regional scales using coarse resolution optical sensors with high temporal resolution. The majority of studies at the regional scale used MODIS satellite data, although studies by Panigrahy et al. [88], Panigrahy et al. [89] and Manjunath et al. [90] explored the Indian Remote Sensing Satellite (IRS) and Wide Field Sensor (WiFS), respectively. Regionally, mapping of single and double cropping using MODIS VI products was mainly applied to rice, maize and winter wheat crops, predominantly in South America, Brazil and Asia [91,92,93,94,95,96,97,98]. The AVHRR sensor has also been used for single and double cropping patterns in paddy rice systems [99]. In Africa, Xiaong et al. [100] mapped croplands that included single and double cropping patterns on a continental scale. Another study by Kibret et al. [101] used MODIS EVI multi-temporal data to identify cropping patterns in Ethiopia, mainly mapping maize, wheat and beans. The triple cropping pattern was also regionally mapped together with single and double cropping patterns by Lui et al. [17] and Panigrahy et al. [88] using MODIS EVI and IRS WiFS imagery, respectively. Landsat was also used for mapping sequential cropping on regional scales to explore annual changes in cropping patterns in four different years in Arizona, US [102]. Rufin et al. [103] mapped single and double cropping on a national scale using Landsat multi-temporal dataset in Turkey. Other Landsat multi-temporal studies, such as Zhu et al. [104], involved a detection study of rice double cropping patterns in China, whilst another study by Zuo et al. [105] considered multiple cropping efficiency by mapping single, double and triple cropping patterns of paddy rice in China. Landsat-7 and 8 were also integrated with other optical sensors such as MODIS (MOD09A1) and Sentinel-2 to map sequential cropping patterns on regional scales [106,107]. Optical data with reasonably high spatial resolution but medium temporal resolution, such as the IRS Linear Image Self Scanning Systems (LISS) III, Gaofen-1 and SPOT-VGT, have also been used for regional mapping of single, double and triple cropping patterns [108,109,110]. The multi-sensor approach has also used microwave and optical sensors to allow good derivation of temporal profiles from sequential crops [88,111,112]. On a regional scale, SAR backscatter from Sentinel-1’s C-band time-series data has been used for monitoring and mapping single, double and triple cropping patterns of rice in Vietnam [51,113]. Across the studies we reviewed, the most common crop types mapped were corn/maize, rice, wheat and soybean and the sequential cropping patterns’ studies were most common in tropical regions, where the crop season is dictated by the long rainy season.
Mapping sequential cropping patterns presents more complexities compared to single cropping. Although the spatial coverage of sequential cropping at a given time is homogenous, the temporal coverage is heterogeneous (Figure 2). In the same growing season, a different crop is planted, which is commonly a crop suitable to the seasonal climate or sometimes the same crop is planted again, like paddy rice in many Asian countries. This type of cropping pattern requires the growing season to be longer and as a result, there is a more continuous presence of crop cover. Overall, most of the reviewed studies used mainly MODIS satellite data products and Landsat satellite images and mapped sequential cropping on a large scale in China and Brazil.

3.3. Mapping Intercropping Patterns

Most of the studies (7) focused on mapping intercropping used reasonably high spatial resolution data. The utilization of high spatial resolution sensors permits mapping such complex cropping patterns. Sentinel-2 and Landsat data have been explored for mapping intercropping of maize and sorghum and peas and wheat by Luciani et al. [114] and Gumma et al. [115], respectively. The results of their study highlighted the importance of the short-wave infrared region (SWIR) for crop identification. Another study by Kyalo et al. [10] showed that intercropping of maize and beans could be mapped using the red-edge spectral band in RapidEye imagery. The use of UAVs has also shown the possibility of identifying and monitoring intercropping patterns [10]. In Kyalo et al. [10] study, maize and pigeon-pea intercropping were monitored in experimental farms and small local farms in Tanzania. UAV sensors were also used to map zucchini and sunflower intercropped fields in China [116]. Such (very) high spatial resolution sensors can discriminate crop types in intercropped fields; however, they are commonly restricted to local scale applications.
Recently, the potential of using optical sensors in combination with microwave sensors for mapping intercropping on regional scales was shown by Hegarty-Craver et al. [117]. The study attempted to discriminate crop types within intercropped fields by mapping single cropped maize and maize intercropped with beans or cassava. Due to the high variability (field size, local climate, management practices) and the low density of maize crops in the area, the intercropped maize signature was similar to cassava or beans. As a result, maize intercropped fields were misclassified as single crop fields of beans or cassava. The labelling procedure in this study was according to the dominant crop type within a field. The fields with single crop types were easily distinguishable through their distinct spectral signatures, whilst crop types in intercropped fields (heterogeneous and fragmented) had many misclassifications. This was also the same with the Luciani et al. [114] study, where the single crop fields of sorghum were often mistaken with maize intercropped fields, resulting in low classification accuracy.
The studies on mapping intercropping have shown the complexities that arise due to the overlapping of phenological cycles of different crop types. There is a period during the growing season where different crops grow simultaneously, this may cause the phenological cycles to overlap. Mapping intercropping, especially during the overlapping period, results in the above observed challenges. The characteristics of crops planted together play a significant role in mapping intercropping as they directly influence the dominant spectral signatures of the intercropped field. Based on the reviewed studies, monitoring and mapping intercropping using sensors with a large number of spectral bands and high spatial and temporal resolutions improve discrimination accuracy between intercropping and single cropping even though there are still challenges with misclassification [117,118]. Further, when more valuable features such as textural information and crop structural information from SAR multi-temporal satellite data are used, they can enhance the mapping of intercropping patterns [117]. Further work is needed to develop methods that can accurately map single cropping and intercropping patterns.

3.4. Continental Distribution of Cropping Pattern Studies and Sensors Used

Overall, there are more studies on mapping sequential cropping patterns than mapping single cropping patterns. The studies on mapping intercropping patterns are the lowest among the three cropping patterns and we did not find any study on mapping intercropping patterns using microwave sensors (Table 1). The studies on mapping single cropping explored more multi-source data than single data source, whilst studies on mapping sequential cropping used mainly MODIS satellite data. Our review shows that free and open access sensors viz. MODIS and Sentinel have been most used to monitor and map different cropping patterns over time. The Sentinel sensors significantly contributed to the recent increase in cropping pattern studies since their first launch in 2014. Sentinel-2 is the second most used satellite for mapping cropping patterns and optical sensors remain the most used for mapping different cropping patterns. According to our findings, microwave sensors remain less utilized, and the freely available Sentinel-1 remains the most used microwave sensor for mapping cropping patterns (Table 1). The majority of sequential cropping studies are on regional scales, mainly from Asia, followed by South America (Table 2). Whilst, mapping single cropping patterns, studies are predominantly at local scales in Asia and Europe (Table 2).

3.5. Sensor Types and Properties and Their Relation to the Mapping Scale

Different optical sensors have different temporal, spatial, radiometric and spectral resolutions, which facilitate mapping different cropping patterns from diverse landscapes on different scales. Evidently, mapping cropping patterns is highly dependent on multiple-date imagery that is collected throughout the growing season. Thus, it is crucial to have minimal gaps in the imagery acquired during that season or use gap-filling approaches to estimate the spectral bands and VI variabilities amongst different cropping patterns and crop types [102,118].
Microwave sensors are also sensitive to crop moisture and crop structural parameters; hence, identifying, monitoring and mapping cropping patterns using these data become possible [120,121]. In SAR sensors with short wavelengths (e.g., C-band and X-band), the signal can penetrate the crop canopy, particularly in the early crop growth stages when there is less crop density. If the crop canopy is less dense, the bare soil is exposed, resulting in soil roughness contributing to the total backscatter signal. When crop cover is dense, diffusiveness and volume scattering occur as short-wavelength signals do not penetrate through dense vegetation cover [122]. Nevertheless, studies have used C-band and X-band to map cropping patterns [51,73,123]. Other studies [71,124] used other approaches, i.e., interferometry, to estimate biomass and vertical height of the crop. Several microwave sensors such as ENVISAT ASAR, Gaofen-3 and RADARSAT-2 have also been used for cropping pattern mapping [72,125,126].
Further, studies have shown that hyperspectral remote sensing could be explored for crop monitoring and mapping using spectral behaviour of various crop characteristics [84,127,128,129,130,131,132]. Hyperspectral images consist of hundreds of bands that capture detailed spectral responses, providing capabilities of identifying subtle variations in crop cover over time [133]. A review by Sahoo et al. [134] on hyperspectral remote sensing of agriculture considered different studies that used narrow spectral bands to discriminate crop types, monitor the spectral behaviour of crops and quantitatively estimate crop characteristics. The richness in spectral bands can provide invaluable spectral information that can help discriminate different crop types even in complex cropping patterns such as intercropping, which will allow the mapping of different crop types in different cropping patterns.
Mapping cropping patterns at regional scales require sensors that cover a large geographic extent and have high temporal and sufficient spatial resolutions. Sensors such as the advanced very high-resolution radiometer (AVHRR) do not meet the requirements because they do not have all the different resolution characteristics; thus, they are rarely used for such studies. The 250 m daily coverage of the MODIS sensor provides adequate monitoring and mapping of cropping patterns at regional scales. MODIS satellite data such as MOD09Q1, MOD13Q1, MODIS EVI has a low spatial resolution and high temporal resolution. The high temporal resolution of MODIS satellite data products enables phenological parameters to be derived from EVI and NDVI multi-temporal data, which assists in cropping pattern classification [11,45,94,135].
On the other hand, detailed mapping of crop types within various cropping patterns is commonly associated with local scale coverage. For example, very high resolution (VHR) sensors such as RapidEye and optical cameras on UAVs come at a cost and typically cover smaller geographical areas. Much of the restrictions have to do with the capacity to process such high-resolution data. The data files are huge and collecting multiple dates for different areas can make data processing on a large scale more tedious, time-consuming and challenging. However, cloud computing opportunities such as Google Earth Engine (GEE) can provide better processing solutions for large scale mapping of cropping patterns using high-resolution sensors.
The launch of the Sentinel-2 constellation of satellites, offering free access to data with a revisit period of 5 days, high spatial resolutions of 10 m and high spectral resolution of 13 bands, provides a unique opportunity to systematically monitor crops and map cropping patterns. Sentinel-2 imagery can greatly contribute to more detailed mapping of cropping patterns at regional and local scales. More recent studies have used Sentinel-2 data to map cropping patterns in different landscapes [59,74,115,136]. Moreover, studies using microwave sensors are also increasing and as a result, there is a steady increase in studies using multi-source data.

4. Review of Remote Sensing Methods/Models Used for Mapping Cropping Patterns

The premise of mapping cropping patterns is based on two main steps, (i) derive phenological parameters and (ii) image classification. In identifying phenological parameters, multi-temporal data are crucial as they permit the analysis of phenological cycle’ dynamics during the crop growing season. The most common approach to observing these dynamics is through vegetation indices (VIs), assuming that the dynamics observed in multi-temporal VIs dataset correspond to the crop growth stages. A widely used method for cropping pattern identification is the peak counting method [137,138]. The VI values obtained during the crop growth cycles are used to determine the type of cropping patterns, e.g., one peak means one growth cycle associated with a single cropping pattern, two peaks–double cropping, etc. In the case of more complex cropping patterns such as intercropping, the method of peak counting is not sufficient. Therefore, such patterns require detailed information from the sensors (spatial, radiometric, spectral, temporal resolutions) and temporal field observations.

4.1. Vegetation Indices

Vegetation indices (VIs) are the most common method used for mapping cropping patterns. Optical VIs are used to capture the phenological cycles of crops. This is conducted by calculating VIs from multi-temporal datasets to enhance the spectral information of specific spectral bands. Our review shows that NDVI and EVI are the main indices used for capturing the phenological cycles. Studies by Liu et al. [139] and Yan et al. [140] used the MODIS VI products to map sequential cropping in China. Other studies based in China were Son et al. [141] and Guo et al. [142], but they used Sentinel-2 EVI and NDVI multi-temporal data for mapping sequential cropping. In India, SPOT MVC NDVI multi-temporal was also used by de Bie et al. [143] and Manjunath et al. [112] to map single and double cropping.
NDVI and EVI are correlated with vegetation greenness representing photosynthetic activity, vegetation abundance and structure. Thus, they are commonly used for studying crop characteristics. They have a strong relationship with biophysical characteristics that enable crop type discrimination using unique phenological responses [144]. NDVI has high sensitivity to the growth changes of the crop during their greenup and senescence stages, whilst with EVI the sensitivity is high at the peak of the crop growing season for many crops [47].
The red-edge chlorophyll index (Clred), green chlorophyll index (Clgreen), land surface water index (LWSI) and wide-dynamic range vegetation index (WDRVI) are among other VIs that have been used for monitoring cropping patterns, including intercropping of maize with pigeon-pea [47]. Identification of the best index for crop type discrimination within different cropping patterns depends on when crops are most spectrally separable during the crop growing period. The characteristics of various crops are expected to be different during crop growth, resulting in spectral differences between cropping patterns, especially within intercropping fields. Therefore, apart from spectral bands and VIs, temporal information is important because it is at a certain period during the growth cycle when different crop types can be discriminated.

4.2. Remote Sensing-Based Classification Methods for Mapping Cropping Patterns

A general methodology was followed for mapping cropping patterns in most of the reviewed studies and it is based on extracting features of interest from different variables of remote sensing multi-temporal datasets obtained from optical or microwave sensors. These features include spectral (spectral bands/VIs), temporal (phenological) and textural (radiometric) information. The best features for cropping patterns identification are then used for image classification. Both the steps of selecting features and the classification process require training samples. The classification accuracy not only depends on the sensor properties and the quantity and quality of training samples but also on types of cropping patterns, geographical landscape, local climate and management practices.
Different classification algorithms have been used for mapping cropping patterns and our review shows that the three most frequently used are Support Vector Machine (SVM), Decision Tree (DT) and Random Forest (RF), amongst other classification methods such as k-Nearest Neighbour (K-NN), artificial neural networks (ANN), spectral matching technique (SMT), deep neural network (d-NN) and convolutional neural networks (CNN). The RF classifier is the most popular among the three frequently used classifiers and comparisons in cropping mapping studies have shown it performs better than SVM and DT [59,62,73]. RF is made-up of decision trees produced using random samples and operates as an ensemble. It is simple, robust and not sensitive to overfitting [145].
Traditional classifiers, for example, unsupervised classifiers such as K-means and ISODATA were frequently used to discriminate cropland from non-cropland, followed by supervised classification [93,110,146]. The review shows that traditional supervised classification was mostly used in mapping sequential cropping patterns [62,73,93]. Maximum likelihood (MLC), Spectral Angle Mapper (SAM) and ISO-cluster classifiers were compared to DT, RF, ANN and SVM classifiers for mapping single cropping using Sentinel-2 and Sentinel-1 separately and combined [57,62,73].
In past years, the remote-sensing community has focused on neural networks, SVM and the RF, for image classification. However, deep learning has recently led to more renewed interest in neural networks. The remote-sensing community has shifted its attention to deep learning and their algorithms have achieved significant success in monitoring and mapping land use and land cover (LULC) [76,147]. Most of the studies mentioned above used pixel-based methods [9,59,62,148] while a few explored object-based methods, particularly for mapping single cropping patterns [57,119,126]. Pixel-based methods are solely based on the spectral information of each pixel. Object-based classification involves categorising similar objects/features relating to spectral properties, size, shape and context from neighbouring surrounding pixels through segmentation. This approach reduces spectral variations by averaging the object’s pixels and better classification results in mapping cropping patterns.

5. Challenges in Mapping Cropping Patterns Using Remote Sensing

The lack of field data availability limits the calibration and validation methods used for mapping intercropping patterns. Although methods to process and validate results may exist, the availability of field data could be restricted because of commercial confidentiality and high costs in collecting it. As a result, the transferability of methods from local to regional scale studies is still a challenge. However, high and VHR imagery can be utilised to gather reference data for training a model and assessing its accuracy. The increase in the availability of UAV technology also promises more opportunities for collecting reference data. Hergaty et al. [117] successfully used UAV data to train and validate a model to map crop types in Rwanda. Another source of reference data from high-resolution imagery is Google Earth (GE). GE imagery provides invaluable cropland information that can be used as reference data for model calibrations and validations. Platforms such as Geo-Wiki facilitate the generation and availability of reference data without physically going to the field and such platforms are used for validating global land cover products [149,150].
The availability of multiple cloud-free images at relevant seasonal periods is a serious challenge as it requires high revisit frequencies that range from one to eight days to ensure the entire crop growing season is captured [151]. MODIS and AVHRR satellite data can achieve such revisit times, but their coarse spatial resolution does not allow cropping patterns to be mapped for field sizes smaller than the pixel. This was confirmed by Gumma et al. [11] and da Silva Junior et al. [65], where mixed cropping classes were mapped inaccurately and some classes were ignored. In addition, field sizes in most developing countries, particularly in the sub-Saharan region and other parts of Asia, are very small, resulting in challenges when mapping cropping patterns using freely available satellite data such as those from Sentinel sensors.
The limitation in the number of spectral bands of most sensors contributes to the challenge of spectral mixing, especially in intercropping patterns. Unlike sequential cropping, where mapping requires observing the changes in vegetation peaks at different times, in intercropping, the growth of the two crops overlaps, resulting in some of the crop stages being intertwined at some point in time. Different crops that share the same crop calendar in some cropping patterns, e.g., intercropping, result in similar crop growth periods that cause spectral mixing. Sensors with limited number of relatively broad spectral bands cannot identify the subtle variations caused by the characteristics of different crops. This challenge is also common when differentiating crop-related signatures from non-agricultural vegetation signatures [144].

6. Current Status on Relevant Policies for Cropping Pattern Practices

To meet food demands, 90% of the growth in crop production has to come from intensive farming (producing more food per unit area) and 80% of this is expected to come from developing countries [152]. Sustainable land use intensification involves adopting diverse management practices, including cropping pattern practices, which are included in policy instruments such as CAP and certification systems such as GAP.
GAP aims to ensure safe, steady and efficient crop production using sustainable agricultural methods that reduce the use of pesticides and herbicides. The GAP guidelines promote efficient water use and better soil management at a field scale [153]. Similarly, the European Commission presented a new proposal on the common agricultural policy (CAP) in 2018. The CAP framework broadly wants to ensure a smooth transition into a green agricultural economy that is efficient and sustainable. CAP contributes significantly to the European Green deal, particularly on farm-to-fork and biodiversity strategies [4].
The US and Europe have developed incentive and subsidies programmes to encourage farmers to adopt new practices that promote sustainable intensification (increasing yield without increasing the land) [4,154]. The shift from conventional farming methods to traditional agricultural methods resulting in diverse cropping pattern practices is evident through the abovementioned initiatives. These initiatives result in an increase in demand for monitoring changes in cropping pattern practices, which can be met by remote sensing.
According to the recent work of Giller et al. [155], Africa has the largest population growth rate and growth in food demand. Meeting this demand requires rapid changes in agricultural systems, including cropping patterns, and the adoption and impact of these should be tracked and monitored. In contrast to this information need, cropping pattern studies have been predominantly conducted in Asia, Europe and South America, while there have been very few studies in Africa on local and regional scales. Given the expected changes, it is imperative to have more remote sensing studies in diverse farming systems across Africa, including mapping cropping patterns that promote sustainable intensification.

7. Research Gaps, Future Scope and Opportunities in Mapping Cropping Patterns

The use of remote sensing for mapping cropping patterns has been growing in recent years, especially on regional and global scales. Despite this, there are still gaps in using remote sensing data and methods for mapping different cropping patterns at various scales. Studies on mapping cropping patterns using high temporal, spatial and spectral resolution are still rare. Mapping cropping patterns have been mostly performed using MODIS and AVHRR satellite multi-temporal-based datasets. Due to their high acquisition frequency, these sensors permit crop monitoring, leading to cropping pattern identification and mapping. However, the use of sensors with both high temporal and spatial resolution and rich spectral information is needed. Freely available Sentinel data with high spatial resolution and adequate acquisition frequency present opportunities for mapping cropping patterns.
While several studies have used surface reflectance from optical sensors to map cropping patterns, there is still a lack of studies that used SAR data for this purpose. This presents an opportunity to explore SAR capabilities for mapping cropping patterns, particularly sequential and intercropping. Since optical sensors can suffer from cloud coverage during critical crop growth periods, the use of microwave data is advantageous in such conditions. A multi-sensor approach, such as the combination of microwave and optical sensors, could improve the accuracy of cropping pattern mapping. Utilizing microwave sensors can help fill data gaps and provide useful information on crop canopies structures to improve the mapping of cropping patterns. A few reviewed studies have shown that a multi-source approach improved classification [117,136].
The launch of Sentinel-1 and Sentinel-2, the combination of Landsat-8 and 9 and the harmonization of Landsat and Sentinel data provide an excellent opportunity for crop monitoring and identification of cropping patterns. Further, the upcoming S-band CIRES radar sensor that can penetrate vegetation also creates another opportunity to study cropping patterns with similar cropping calendars and intercropping studies. These sensors with high temporal resolution can allow multi-temporal analysis to map different cropping patterns at the local and regional scales.
The increasing availability of different types of sensors provides an opportunity for multi-sensor approach studies to be explored, requiring new and advanced mapping methods for cropping patterns, especially in complex landscapes. Currently, artificial intelligence (AI) is an emerging technology that can be used for accurate discrimination of different vegetation species. CNN have been used for crop type classification but not yet explored for mapping crop types in intercropped fields. Further, red-edge and SWIR spectral bands for mapping sequential and intercropping remain less utilized even though they are known to be applicable for mapping vegetation. This provides a new perspective for solving the problem of spectral mixing in intercropping and eventually mapping intercropping patterns using products such as Sentinel-2.
Reference datasets can be acquired and compiled through geo-tagged photographs and local knowledge. This method of collecting training datasets requires detailed knowledge from local farmers, the public and agricultural experts. Such information can provide more insights into the agricultural landscape, indicate cropping pattern practices of the area and describe crops and other cropping practices [9]. These illustrate that the increasing availability of high and very high-resolution imagery can contribute towards obtaining reference data for accuracy assessments and model training in future.
Our review identified only seven studies related to mapping intercropping. None of the studies could successfully map the different crop types within the intercropped fields but mainly classified the dominant crop type. The intercropping studies primarily focused on discriminating between single and intercropping and used one type of sensor. According to our review, no studies have successfully mapped intercropping patterns and identified different crop type proportions within the intercropped fields. Most of these studies are on a local scale. Much work remains to be conducted on mapping intercropping patterns and upscaling such projects to larger scales.

Author Contributions

Conceptualization, M.M., R.D. and A.N.; methodology, M.M. and R.D.; article review, M.M.; writing—original draft preparation, M.M.; reviewing and editing the manuscript, M.M., R.D. and A.N. All authors have read and agreed to the published version of the manuscript.

Funding

National Research Foundation (NRF) of South Africa and Nuffic (Grant number: 120226).

Conflicts of Interest

The authors declare no conflict of interest.

References

  1. UN 9.7 billion on Earth by 2050. Available online: https://www.un.org/en/academic-impact/97-billion-earth-2050-growth-rate-slowing-says-new-un-population-report (accessed on 22 August 2021).
  2. Food and Agriculture Organization (FAO). Food and Agriculture Organization (FAO) The 10 Elements of Agroecology Guiding the Transition to Sustainable Food and Agricultural Systems; FAO: Rome, Italy, 2018. [Google Scholar]
  3. Bégué, A.; Arvor, D.; Bellon, B.; Betbeder, J.; de Abelleyra, D.; Ferraz, R.P.D.; Lebourgeois, V.; Lelong, C.; Simões, M.; Verón, S.R. Remote sensing and cropping practices: A review. Remote Sens. 2018, 10, 99. [Google Scholar] [CrossRef] [Green Version]
  4. European Commission. The European Green Deal; European Commission: Brussels, Belgium, 2019; p. 24. [Google Scholar]
  5. Food and Agriculture Organization (FAO). Guidelines: Agro-Ecological Zoning; FAO: Rome, Italy, 1996; ISBN 9251038902. [Google Scholar]
  6. Nguyen, T.T.H.; de Bie, C.A.J.M.; Ali, A.; Smaling, E.M.A.; Chu, T.H. Mapping the irrigated rice cropping patterns of the Mekong delta, Vietnam, through hyper-temporal SPOT NDVI image analysis. Int. J. Remote Sens. 2012, 33, 415–434. [Google Scholar] [CrossRef]
  7. Naimur, R. Crops pattern change and agricultural diversification: A case study of Domar Upazila, Nilphamari. Int. J. Agric. Sci. Food Technol. 2020, 6, 022–029. [Google Scholar] [CrossRef] [Green Version]
  8. Boughton, D.; Haggblade, S.; Kham, L.S.; Longabaugh, S.; Thaung, M. Overcoming isolation: An exploration of the rapid growth in pulse exports from Myanmar. Int. Conf. Agric. Econ. 2015. [Google Scholar] [CrossRef]
  9. Feyisa, G.L.; Palao, L.K.; Nelson, A.; Gumma, M.K.; Paliwal, A.; Win, K.T.; Nge, K.H.; Johnson, D.E. Characterizing and mapping cropping patterns in a complex agro-ecosystem: An iterative participatory mapping procedure using machine learning algorithms and MODIS vegetation indices. Comput. Electron. Agric. 2020, 175, 105595. [Google Scholar] [CrossRef]
  10. Richard, K.; Abdel-Rahman, E.M.; Subramanian, S.; Nyasani, J.O.; Thiel, M.; Jozani, H.; Borgemeister, C.; Landmann, T. Maize cropping systems mapping using rapideye observations in agro-ecological landscapes in Kenya. Sensors 2017, 17, 2537. [Google Scholar] [CrossRef] [Green Version]
  11. Gumma, M.K.; Tsusaka, T.W.; Mohammed, I.; Chavula, G.; Ganga Rao, N.V.P.R.; Okori, P.; Ojiewo, C.O.; Varshney, R.; Siambi, M.; Whitbread, A. Monitoring changes in the cultivation of pigeonpea and groundnut in Malawi using time series satellite imagery for sustainable food systems. Remote Sens. 2019, 11, 1475. [Google Scholar] [CrossRef] [Green Version]
  12. Lobell, D.B.; Azzari, G.; Marshall, B.; Gourlay, S.; Jin, Z.; Kilic, T.; Murray, S. Eyes in the Sky, Boots on the Ground: Assessing Satellite- and Ground-Based Approaches to Crop Yield Measurement and Analysis in Uganda; World Bank: Washington, DC, USA, 2018. [Google Scholar] [CrossRef] [Green Version]
  13. Leenhardt, D.; Angevin, F.; Biarnès, A.; Colbach, N.; Mignolet, C. Describing and locating cropping systems on a regional scale. A review. Agron. Sustain. Dev. 2010, 30, 131–138. [Google Scholar] [CrossRef] [Green Version]
  14. Sebillotte, M. Agronomy and agriculture. Agronomist Task Analysis Essay. Cah. ORSTOM 1974, 24, 3–25. [Google Scholar]
  15. Blanco-Canqui, H.; Lal, R. Crop residue removal impacts on soil productivity and environmental quality. CRC. Crit. Rev. Plant Sci. 2009, 28, 139–163. [Google Scholar] [CrossRef]
  16. Yang, T.; Siddique, K.H.M.; Liu, K. Cropping systems in agriculture and their impact on soil health-A review. Glob. Ecol. Conserv. 2020, 23, e01118. [Google Scholar] [CrossRef]
  17. Liu, J.; Zhu, W.; Atzberger, C.; Zhao, A.; Pan, Y.; Huang, X. A phenology-based method to map cropping patterns under a wheat-maize rotation using remotely sensed time-series data. Remote Sens. 2018, 10, 1203. [Google Scholar] [CrossRef] [Green Version]
  18. Gan, Y.; Liang, C.; Chai, Q.; Lemke, R.L.; Campbell, C.A.; Zentner, R.P. Improving farming practices reduces the carbon footprint of spring wheat production. Nat. Commun. 2014, 5, 5012. [Google Scholar] [CrossRef] [Green Version]
  19. Vandermeer, J.H. The Ecology of Agroecosystems; Jones and Bartlett Publishers: Sudbury, MA, USA, 2009; ISBN 0763771538. [Google Scholar]
  20. Vandermeer, J. The Ecology of Intercropping; Cambridge University Press: New York, NY, USA, 1989; ISBN 0521346894. [Google Scholar]
  21. Kass, D.C.L. Polyculture Cropping Systems:Review and Analysis; Cornell International Agricultural Bulletin, Ed.; Cornell University: Ithaca, NY, USA, 1978. [Google Scholar]
  22. Machado, S. Does intercropping have a role in modern agriculture? J. Soil Water Conserv. 2009, 64, 55–57. [Google Scholar] [CrossRef] [Green Version]
  23. Sullivan, P. Intercropping Principles and Production Practices. Agronomy Systems Guide; Appropriate Technology Transfer for Rural Areas Publication: Fayetteville, AR, USA, 2003; pp. 1–12. [Google Scholar]
  24. FAO. Agroforestry. Available online: https://www.fao.org/forestry/agroforestry/en/ (accessed on 11 August 2021).
  25. Reddy, K.S.; Maruthi, V.; Kumar, M.; Pankaj, P.K.; Reddy, A.G.K.; Umesha, B. Enhancing economic water productivity under on farm reservoirs in diversified rainfed cropping systems. GUASNR Int. J. Plant Prod. 2017, 11, 1735–8043. [Google Scholar]
  26. Brooker, R.W.; Bennett, A.E.; Cong, W.F.; Daniell, T.J.; George, T.S.; Hallett, P.D.; Hawes, C.; Iannetta, P.P.; Jones, H.G.; Karley, A.J.; et al. Improving intercropping: A synthesis of research in agronomy, plant physiology and ecology. New Phytol. 2015, 206, 107–117. [Google Scholar] [CrossRef]
  27. Fang, S.; Xue, J.; Tang, L. Biomass production and carbon sequestration potential in poplar plantations with different management patterns. J. Environ. Manag. 2007, 85, 672–679. [Google Scholar] [CrossRef]
  28. Ferreira, R.V.; Tavares, R.L.M.; de Medeiros, S.F.; da Silva, A.G.; da Silva Júnior, J.F. Carbon stock and organic fractions in soil under monoculture and sorghum bicolor–urochloa ruziziensis intercropping systems. Bragantia 2020, 79, 425–433. [Google Scholar] [CrossRef]
  29. Gaba, S.; Lescourret, F.; Boudsocq, S.; Enjalbert, J.; Hinsinger, P.; Journet, E.P.; Navas, M.L.; Wery, J.; Louarn, G.; Malézieux, E. Multiple cropping systems as drivers for providing multiple ecosystem services: From concepts to design. Agron. Sustain. Dev. 2015, 35, 607–623. [Google Scholar] [CrossRef] [Green Version]
  30. Tilman, D.; Reich, P.B.; Knops, J.; Wedin, D.A.; Mielke, T. Diversity and productivity in a long-term grassland experiment. Science 2001, 294, 843–845. [Google Scholar] [CrossRef] [Green Version]
  31. FAO. The Future of Food and Agriculture; FAO: Rome, Italy, 2017; pp. 1–52. [Google Scholar]
  32. Mthembu, B.E.; Everson, T.M.; Everson, C.S. Intercropping for enhancement and provisioning of ecosystem services in smallholder, rural farming systems in KwaZulu-Natal Province, South Africa: A review. J. Crop Improv. 2019, 33, 145–176. [Google Scholar] [CrossRef]
  33. Jin, Z.; Azzari, G.; Burke, M.; Aston, S.; Lobell, D.B. Mapping smallholder yield heterogeneity at multiple scales in eastern Africa. Remote Sens. 2017, 9, 931. [Google Scholar] [CrossRef] [Green Version]
  34. Jain, M.; Mondal, P.; DeFries, R.S.; Small, C.; Galford, G.L. Mapping cropping intensity of smallholder farms: A comparison of methods using multiple sensors. Remote Sens. Environ. 2013, 134, 210–223. [Google Scholar] [CrossRef] [Green Version]
  35. Eskandari, H.; Ghanbhari, A.; Javanmard, A. Intercropping of cereals and legumes for forage production. Not. Sci. Biol. 2009, 1, 7–13. [Google Scholar] [CrossRef] [Green Version]
  36. Atzberger, C. Advances in remote sensing of agriculture: Context description, existing operational monitoring systems and major information needs. Remote Sens. 2013, 5, 949–981. [Google Scholar] [CrossRef] [Green Version]
  37. Sishodia, R.P.; Ray, R.L.; Singh, S.K. Applications of remote sensing in precision agriculture: A review. Remote Sens. 2020, 12, 3136. [Google Scholar] [CrossRef]
  38. Joshi, N.; Baumann, M.; Ehammer, A.; Fensholt, R.; Grogan, K.; Hostert, P.; Jepsen, M.R.; Kuemmerle, T.; Meyfroidt, P.; Mitchard, E.T.A. A review of the application of optical and radar remote sensing data fusion to land use mapping and monitoring. Remote Sens. 2016, 8, 70. [Google Scholar] [CrossRef] [Green Version]
  39. Chaves, M.E.D.; Picoli, M.C.A.; Sanches, I.D. Recent applications of Landsat 8/OLI and Sentinel-2/MSI for land use and land cover mapping: A systematic review. Remote Sens. 2020, 12, 3062. [Google Scholar] [CrossRef]
  40. Jin, X.; Kumar, L.; Li, Z.; Feng, H.; Xu, X.; Yang, G.; Wang, J. A review of data assimilation of remote sensing and crop models. Eur. J. Agron. 2018, 92, 141–152. [Google Scholar] [CrossRef]
  41. McNairn, H.; Brisco, B. The application of C-band polarimetric SAR for agriculture: A review. Can. J. Remote Sens. 2004, 30, 525–542. [Google Scholar] [CrossRef]
  42. McNairn, H.; Shang, J. A review of multitemporal synthetic aperture radar (SAR) for crop monitoring. In Remote Sensing and Digital Image Processing; Springer: Cham, Switzerland, 2016; Volume 20, pp. 317–340. [Google Scholar]
  43. Gumma, M.K.; Thenkabail, P.S.; Teluguntla, P.; Rao, M.N.; Mohammed, I.A.; Whitbread, A.M. Mapping rice-fallow cropland areas for short-season grain legumes intensification in South Asia using MODIS 250 m time-series data. Int. J. Digit. Earth 2016, 9, 981–1003. [Google Scholar] [CrossRef] [Green Version]
  44. Weiss, M.; Jacob, F.; Duveiller, G. Remote sensing for agricultural applications: A meta-review. Remote Sens. Environ. 2020, 236, 111402. [Google Scholar] [CrossRef]
  45. Chen, Y.; Lu, D.; Moran, E.; Batistella, M.; Dutra, L.V.; Sanches, I.D.A.; da Silva, R.F.B.; Huang, J.; Luiz, A.J.B.; de Oliveira, M.A.F. Mapping croplands, cropping patterns, and crop types using MODIS time-series data. Int. J. Appl. Earth Obs. Geoinf. 2018, 69, 133–147. [Google Scholar] [CrossRef]
  46. Gumma, M.K.; Nelson, A.; Thenkabail, P.S.; Singh, A.N. Mapping rice areas of South Asia using MODIS multitemporal data. J. Appl. Remote Sens. 2011, 5, 053547. [Google Scholar] [CrossRef] [Green Version]
  47. Wardlow, B.D.; Egbert, S.L.; Kastens, J.H. Analysis of time-series MODIS 250 m vegetation index data for crop classification in the U.S. Central Great Plains. Remote Sens. Environ. 2007, 108, 290–310. [Google Scholar] [CrossRef] [Green Version]
  48. Chauhan, S.; Darvishzadeh, R.; Boschetti, M.; Nelson, A. Estimation of crop angle of inclination for lodged wheat using multi-sensor SAR data. Remote Sens. Environ. 2020, 236, 111488. [Google Scholar] [CrossRef]
  49. Fikriyah, V.N.; Darvishzadeh, R.; Laborte, A.; Khan, N.I.; Nelson, A. Discriminating transplanted and direct seeded rice using Sentinel-1 intensity data. Int. J. Appl. Earth Obs. Geoinf. 2019, 76, 143–153. [Google Scholar] [CrossRef] [Green Version]
  50. Chauhan, S.; Darvishzadeh, R.; Boschetti, M.; Pepe, M.; Nelson, A. Remote sensing-based crop lodging assessment: Current status and perspectives. ISPRS J. Photogramm. Remote Sens. 2019, 151, 124–140. [Google Scholar] [CrossRef] [Green Version]
  51. Minh, H.V.T.; Thu, M.; Avtar, R.; Mohan, G.; Misra, P.; Kurasaki, M.; Minh, H.V.T.; Avtar, R.; Mohan, G.; Misra, P. Monitoring and mapping of rice cropping pattern in flooding area in the Vietnamese Mekong Delta using Sentinel-1A Data: A case of an Giang Province. ISPRS Int. J. Geo-Inf. 2019, 8, 211. [Google Scholar] [CrossRef] [Green Version]
  52. McNairn, H.; Kross, A.; Lapen, D.; Caves, R.; Shang, J. Early season monitoring of corn and soybeans with TerraSAR-X and RADARSAT-2. Int. J. Appl. Earth Obs. Geoinf. 2014, 28, 252–259. [Google Scholar] [CrossRef]
  53. Violle, C.; Navas, M.L.; Vile, D.; Kazakou, E.; Fortunel, C.; Hummel, I.; Garnier, E. Let the concept of trait be functional! Oikos 2007, 116, 882–892. [Google Scholar] [CrossRef]
  54. Nock, C.A.; Vogt, R.J.; Beisner, B.E. Functional Traits. In eLs; John Wiley & Sons, Ltd.: Chichester, UK, 2016; pp. 1–8. [Google Scholar]
  55. Yonah, I.B.; Mourice, S.K.; Tumbo, S.D.; Mbilinyi, B.P.; Dempewolf, J. Unmanned aerial vehicle-based remote sensing in monitoring smallholder, heterogeneous crop fields in Tanzania. Int. J. Remote Sens. 2018, 39, 5453–5471. [Google Scholar] [CrossRef]
  56. Yan, H.; Fu, Y.; Xiao, X.; Huang, H.Q.; He, H.; Ediger, L. Modeling gross primary productivity for winter wheat-maize double cropping system using MODIS time series and CO2 eddy flux tower data. Agric. Ecosyst. Environ. 2009, 129, 391–400. [Google Scholar] [CrossRef]
  57. Song, Q.; Zhou, Q.; Wu, W.; Hu, Q.; Lu, M.; Liu, S. Mapping regional cropping patterns by using GF-1 WFV sensor data. J. Integr. Agric. 2017, 16, 337–347. [Google Scholar] [CrossRef]
  58. Nowakowski, A.; Mrziglod, J.; Spiller, D.; Bonifacio, R.; Ferrari, I.; Mathieu, P.P.; Garcia-Herranz, M.; Kim, D.H. Crop type mapping by using transfer learning. Int. J. Appl. Earth Obs. Geoinf. 2021, 98, 102313. [Google Scholar] [CrossRef]
  59. Maponya, M.G.; van Niekerk, A.; Mashimbye, Z.E. Pre-harvest classification of crop types using a Sentinel-2 time-series and machine learning. Comput. Electron. Agric. 2020, 169. [Google Scholar] [CrossRef]
  60. Xie, B.; Zhang, H.K.; Xue, J. Deep convolutional neural network for mapping smallholder agriculture using high spatial resolution satellite image. Sensors 2019, 19, 2398. [Google Scholar] [CrossRef] [Green Version]
  61. El Hajj, M.; Bégué, A.; Guillaume, S.; Martiné, J.F. Integrating SPOT-5 time series, crop growth modeling and expert knowledge for monitoring agricultural practices—The case of sugarcane harvest on Reunion Island. Remote Sens. Environ. 2009, 113, 2052–2061. [Google Scholar] [CrossRef]
  62. Feng, S.; Zhao, J.; Liu, T.; Zhang, H.; Zhang, Z.; Guo, X. Crop type identification and mapping using machine learning algorithms and Sentinel-2 time series data. IEEE J. Sel. Top. Appl. Earth Obs. Remote Sens. 2019, 12, 3295–3306. [Google Scholar] [CrossRef]
  63. Wang, S.; Azzari, G.; Lobell, D.B. Crop type mapping without field-level labels: Random forest transfer and unsupervised clustering techniques. Remote Sens. Environ. 2019, 222, 303–317. [Google Scholar] [CrossRef]
  64. Dimitrov, P.; Dong, Q.; Eerens, H.; Gikov, A.; Filchev, L.; Roumenina, E.; Jelev, G. Sub-pixel crop type classification using PROBA-V 100 m NDVI time series and reference data from Sentinel-2 classifications. Remote Sens. 2019, 11, 1370. [Google Scholar] [CrossRef] [Green Version]
  65. da Silva Junior, C.A.; Leonel-Junior, A.H.S.; Rossi, F.S.; Filho, W.L.F.C.; Santiago, D.; de Barros Santiago, D.; de Oliveira-Júnior, J.F.; Teodoro, P.E.; Lima, M.; Capristo-Silva, G.F. Mapping soybean planting area in midwest Brazil with remotely sensed images and phenology-based algorithm using the Google Earth Engine platform. Comput. Electron. Agric. 2020, 169, 105194. [Google Scholar] [CrossRef]
  66. Boschetti, M.; Stroppiana, D.; Brivio, P.A.; Bocchi, S. Multi-year monitoring of rice crop phenology through time series analysis of MODIS images. Int. J. Remote Sens. 2009, 30, 4643–4662. [Google Scholar] [CrossRef]
  67. Gumma, M.K.; Mohanty, S.; Nelson, A.; Arnel, R.; Mohammed, I.A.; Das, S.R. Remote sensing based change analysis of rice environments in Odisha, India. J. Environ. Manag. 2015, 148, 31–41. [Google Scholar] [CrossRef] [PubMed] [Green Version]
  68. Dong, J.; Xiao, X.; Menarguez, M.A.; Zhang, G.; Qin, Y.; Thau, D.; Biradar, C.; Moore, B. Mapping paddy rice planting area in northeastern Asia with Landsat 8 images, phenology-based algorithm and Google Earth Engine. Remote Sens. Environ. 2016, 185, 142–154. [Google Scholar] [CrossRef] [PubMed] [Green Version]
  69. Wang, S.; Di Tommaso, S.; Faulkner, J.; Friedel, T.; Kennepohl, A.; Strey, R.; Lobell, D.B. Mapping crop types in southeast india with smartphone crowdsourcing and deep learning. Remote Sens. 2020, 12, 2957. [Google Scholar] [CrossRef]
  70. Nasrallah, A.; Baghdadi, N.; El Hajj, M.; Darwish, T.; Belhouchette, H.; Faour, G.; Darwich, S.; Mhawej, M. Sentinel-1 data for winter wheat phenology monitoring and mapping. Remote Sens. 2019, 11, 2228. [Google Scholar] [CrossRef] [Green Version]
  71. Mestre-Quereda, A.; Lopez-Sanchez, J.M.; Vicente-Guijalba, F.; Jacob, A.W.; Engdahl, M.E. Time-series of Sentinel-1 interferometric coherence and backscatter for crop-type mapping. IEEE J. Sel. Top. Appl. Earth Obs. Remote Sens. 2020, 13, 4070–4084. [Google Scholar] [CrossRef]
  72. Valcarce-Diñeiro, R.; Arias-Pérez, B.; Lopez-Sanchez, J.M.; Sánchez, N. Multi-temporal dual- and quad-polarimetric synthetic aperture radar data for crop-type mapping. Remote Sens. 2019, 11, 1518. [Google Scholar] [CrossRef] [Green Version]
  73. Kenduiywo, B.K.; Bargiel, D.; Soergel, U. Crop-type mapping from a sequence of Sentinel 1 images. Int. J. Remote Sens. 2018, 39, 6383–6404. [Google Scholar] [CrossRef]
  74. Abubakar, G.A.; Wang, K.; Shahtahamssebi, A.; Xue, X.; Belete, M.; Gudo, A.J.A.; Shuka, K.A.M.; Gan, M. Mapping maize fields by using multi-temporal Sentinel-1A and Sentinel-2A images in Makarfi, Northern Nigeria, Africa. Sustainability 2020, 12, 2539. [Google Scholar] [CrossRef] [Green Version]
  75. Villa, P.; Stroppiana, D.; Fontanelli, G.; Azar, R.; Brivio, P.A. In-season mapping of crop type with optical and X-band SAR data: A classification tree approach using synoptic seasonal features. Remote Sens. 2015, 7, 12859–12886. [Google Scholar] [CrossRef] [Green Version]
  76. Kussul, N.; Lavreniuk, M.; Skakun, S.; Shelestov, A. Deep learning classification of land cover and crop types using remote sensing data. IEEE Geosci. Remote Sens. Lett. 2017, 14, 778–782. [Google Scholar] [CrossRef]
  77. Xiao, W.; Xu, S.; He, T. Mapping paddy rice with sentinel-1/2 and phenology-, object-based algorithm—A implementation in Hangjiahu plain in China using gee platform. Remote Sens. 2021, 13, 990. [Google Scholar] [CrossRef]
  78. Ahlawat, I.; Sheoran, H.S.; Dahiya, G.; Sihag, P. Analysis of sentinel-1 data for regional crop classification: A multi-data approach for rabi crops of district Hisar (Haryana). J. Appl. Nat. Sci. 2020, 12, 165–170. [Google Scholar] [CrossRef]
  79. Nguyen, D.B.; Gruber, A.; Wagner, W. Mapping rice extent and cropping scheme in the Mekong Delta using Sentinel-1A data. Remote Sens. Lett. 2016, 7, 1209–1218. [Google Scholar] [CrossRef]
  80. Rudiyanto; Minasny, B.; Shah, R.M.; Soh, N.C.; Arif, C.; Setiawan, B.I. Automated near-real-time mapping and monitoring of rice extent, cropping patterns, and growth stages in Southeast Asia using Sentinel-1 time series on a Google Earth Engine platform. Remote Sens. 2019, 11, 1666. [Google Scholar] [CrossRef] [Green Version]
  81. Zhan, P.; Zhu, W.; Li, N. An automated rice mapping method based on flooding signals in synthetic aperture radar time series. Remote Sens. Environ. 2021, 252, 112112. [Google Scholar] [CrossRef]
  82. Ramadhani, F.; Pullanagari, R.; Kereszturi, G.; Procter, J. Automatic mapping of rice growth stages using the integration of sentinel-2, mod13q1, and sentinel-1. Remote Sens. 2020, 12, 3613. [Google Scholar] [CrossRef]
  83. Orynbaikyzy, A.; Gessner, U.; Conrad, C. Crop type classification using a combination of optical and radar remote sensing data: A review. Int. J. Remote Sens. 2019, 40, 6553–6595. [Google Scholar] [CrossRef]
  84. Salas, E.A.L.; Subburayalu, S.K.; Slater, B.; Zhao, K.; Bhattacharya, B.; Tripathy, R.; Das, A.; Nigam, R.; Dave, R.; Parekh, P. Mapping crop types in fragmented arable landscapes using AVIRIS-NG imagery and limited field data. Int. J. Image Data Fusion 2020, 11, 33–56. [Google Scholar] [CrossRef]
  85. Zhao, J.; Zhong, Y.; Hu, X.; Wei, L.; Zhang, L. A robust spectral-spatial approach to identifying heterogeneous crops using remote sensing imagery with high spectral and spatial resolutions. Remote Sens. Environ. 2020, 239, 111605. [Google Scholar] [CrossRef]
  86. Nigam, R.; Tripathy, R.; Dutta, S.; Bhagia, N.; Nagori, R.; Chandrasekar, K.; Kot, R.; Bhattacharya, B.K.; Ustin, S. Crop type discrimination and health assessment using hyperspectral imaging. Curr. Sci. 2019, 116, 1108–1123. [Google Scholar] [CrossRef]
  87. Prins, A.J.; Van Niekerk, A. Crop type mapping using LiDAR, Sentinel-2 and aerial imagery with machine learning algorithms. Geo-Spat. Inf. Sci. 2021, 24, 215–227. [Google Scholar] [CrossRef]
  88. Panigrahy, S.; Manjunath, K.R.; Ray, S.S. Deriving cropping system performance indices using remote sensing data and GIS. Int. J. Remote Sens. 2005, 26, 2595–2606. [Google Scholar] [CrossRef]
  89. Panigrahy, S.; Ray, S.S.; Manjunath, K.R.; Pandey, P.S.; Sharma, S.K.; Sood, A.; Yadav, M.; Gupta, P.C.; Kundu, N.; Parihar, J.S. A spatial database of cropping system and its characteristics to aid climate change impact assessment studies. J. Indian Soc. Remote Sens. 2011, 39, 355–364. [Google Scholar] [CrossRef]
  90. Manjunath, K.R.; Kundu, N.; Ray, S.S.; Panigrahy, S.; Parihar, J.S. Cropping systems dynamics in the lower Gangetic Plains of India using geospatial technologies. Int. Arch. Photogramm. Remote Sens. Spat. Inf. Sci. 2012, XXXVIII-8/W20, 40–45. [Google Scholar] [CrossRef]
  91. Liang, S.Z.; Ma, W.D.; Sui, X.Y.; Yao, H.M.; Li, H.Z.; Liu, T.; Hou, X.H.; Wang, M. Extracting the spatiotemporal pattern of cropping systems from NDVI Time Series using a combination of the Spline and HANTS Algorithms: A case study for Shandong Province. Can. J. Remote Sens. 2017, 43, 1–15. [Google Scholar] [CrossRef]
  92. Galford, G.L.; Mustard, J.F.; Melillo, J.; Gendrin, A.; Cerri, C.C.; Cerri, C.E.P. Wavelet analysis of MODIS time series to detect expansion and intensification of row-crop agriculture in Brazil. Remote Sens. Environ. 2008, 112, 576–587. [Google Scholar] [CrossRef]
  93. Mingwei, Z.; Qingbo, Z.; Zhongxin, C.; Jia, L.; Yong, Z.; Chongfa, C. Crop discrimination in Northern China with double cropping systems using Fourier analysis of time-series MODIS data. Int. J. Appl. Earth Obs. Geoinf. 2008, 10, 476–485. [Google Scholar] [CrossRef]
  94. Arvor, D.; Jonathan, M.; Meirelles, M.S.P.; Dubreuil, V.; Durieux, L. Classification of MODIS EVI time series for crop mapping in the state of Mato Grosso, Brazil. Int. J. Remote Sens. 2011, 32, 7847–7871. [Google Scholar] [CrossRef]
  95. Zhang, M.; Abrahao, G.; Cohn, A.; Campolo, J.; Thompson, S. A MODIS-based scalable remote sensing method to estimate sowing and harvest dates of soybean crops in Mato Grosso, Brazil. Heliyon 2021, 7, e07436. [Google Scholar] [CrossRef] [PubMed]
  96. Chu, L.; Jiang, C.; Wang, T.; Li, Z.; Cai, C. Mapping and forecasting of rice cropping systems in central China using multiple data sources and phenology-based time-series similarity measurement. Adv. Space Res. 2021, 68, 3594–3609. [Google Scholar] [CrossRef]
  97. Spera, S.A.; Cohn, A.S.; Vanwey, L.K.; Mustard, J.F.; Rudorff, B.F.; Risso, J.; Adami, M. Recent cropping frequency, expansion, and abandonment in Mato Grosso, Brazil had selective land characteristics. Environ. Res. Lett. 2014, 9, 064010. [Google Scholar] [CrossRef] [Green Version]
  98. Wang, L.; Qi, F.; Shen, X.; Huang, J. Monitoring multiple cropping index of Henan Province, China based on MODIS-EVI time series data and savitzky-golay filtering algorithm. CMES-Comput. Model. Eng. Sci. 2019, 119, 331–348. [Google Scholar] [CrossRef] [Green Version]
  99. Wu, W.; Yang, P.; Tang, H.; Zhou, Q.; Chen, Z.; Shibasaki, R. Characterizing spatial patterns of phenology in cropland of china based on remotely sensed data. Agric. Sci. China 2010, 9, 101–112. [Google Scholar] [CrossRef]
  100. Xiong, J.; Thenkabail, P.S.; Gumma, M.K.; Teluguntla, P.; Poehnelt, J.; Congalton, R.G.; Yadav, K.; Thau, D. Automated cropland mapping of continental Africa using Google Earth Engine cloud computing. ISPRS J. Photogramm. Remote Sens. 2017, 126, 225–244. [Google Scholar] [CrossRef] [Green Version]
  101. Kibret, K.S.; Marohn, C.; Cadisch, G. Use of MODIS EVI to map crop phenology, identify cropping systems, detect land use change and drought risk in Ethiopia–an application of Google Earth Engine. Eur. J. Remote Sens. 2020, 53, 176–191. [Google Scholar] [CrossRef]
  102. Fan, C.; Zheng, B.; Myint, S.W.; Aggarwal, R. Characterizing changes in cropping patterns using sequential Landsat imagery: An adaptive threshold approach and application to Phoenix, Arizona. Int. J. Remote Sens. 2014, 35, 7263–7278. [Google Scholar] [CrossRef]
  103. Rufin, P.; Frantz, D.; Ernst, S.; Rabe, A.; Griffiths, P.; Özdoğan, M.; Hostert, P. Mapping cropping practices on a national scale using intra-annual Landsat time series binning. Remote Sens. 2019, 11, 232. [Google Scholar] [CrossRef] [Green Version]
  104. Zhu, L.; Liu, X.; Wu, L.; Liu, M.; Lin, Y.; Meng, Y.; Ye, L.; Zhang, Q.; Li, Y. Detection of paddy rice cropping systems in southern China with time series Landsat images and phenology-based algorithms. GISci. Remote Sens. 2021, 58, 733–755. [Google Scholar] [CrossRef]
  105. Zuo, L.J.; Wang, X.; Liu, F.; Yi, L. Spatial exploration of multiple cropping efficiency in china based on time series remote sensing data and econometric model. J. Integr. Agric. 2013, 12, 903–913. [Google Scholar] [CrossRef]
  106. Liu, L.; Xiao, X.; Qin, Y.; Wang, J.; Xu, X.; Hu, Y.; Qiao, Z. Mapping cropping intensity in China using time series Landsat and Sentinel-2 images and Google Earth Engine. Remote Sens. Environ. 2020, 239, 111624. [Google Scholar] [CrossRef]
  107. Ding, M.; Guan, Q.; Li, L.; Zhang, H.; Liu, C.; Zhang, L. Phenology-based rice paddy mapping using multi-source satellite imagery and a fusion algorithm applied to the Poyang Lake plain, Southern China. Remote Sens. 2020, 12, 1022. [Google Scholar] [CrossRef] [Green Version]
  108. Jamil, M.; Sajjad, H. Deriving cropping system efficiency pattern using remote sensing and GIS: A case study of Bijnor district, India. Int. J. Adv. Remote Sens. GIS Geogr. 2016, 4, 27–40. [Google Scholar]
  109. Mondal, S.; Jeganathan, C.; Sinha, N.K.; Rajan, H.; Roy, T.; Kumar, P. Extracting seasonal cropping patterns using multi-temporal vegetation indices from IRS LISS-III data in Muzaffarpur District of Bihar, India. Egypt. J. Remote Sens. Sp. Sci. 2014, 17, 123–134. [Google Scholar] [CrossRef] [Green Version]
  110. Singh, N.J.; Kudrat, M.; Jain, K.; Pandey, K. Cropping pattern of Uttar Pradesh using IRS-P6 (AWiFS) data. Int. J. Remote Sens. 2011, 32, 4511–4526. [Google Scholar] [CrossRef]
  111. Asilo, S.; de Bie, K.; Skidmore, A.; Nelson, A.; Barbieri, M.; Maunahan, A. Complementarity of two rice mapping approaches: Characterizing strata mapped by hypertemporal MODIS and rice paddy identification using multitemporal SAR. Remote Sens. 2014, 6, 12789–12814. [Google Scholar] [CrossRef] [Green Version]
  112. Manjunath, K.R.; More, R.S.; Jain, N.K.; Panigrahy, S.; Parihar, J.S. Mapping of rice-cropping pattern and cultural type using remote-sensing and ancillary data: A case study for South and Southeast Asian countries. Int. J. Remote Sens. 2015, 36, 6008–6030. [Google Scholar] [CrossRef]
  113. Lasko, K.; Vadrevu, K.P.; Tran, V.T.; Justice, C. Mapping double and single crop paddy rice with Sentinel-1A at varying spatial scales and polarizations in Hanoi, Vietnam. IEEE J. Sel. Top. Appl. Earth Obs. Remote Sens. 2018, 11, 498–512. [Google Scholar] [CrossRef]
  114. Luciani, R.; Laneve, G.; Jahjah, M. Agricultural monitoring, an automatic procedure for crop mapping and yield estimation: The great rift valley of Kenya case. IEEE J. Sel. Top. Appl. Earth Obs. Remote Sens. 2019, 12, 2196–2208. [Google Scholar] [CrossRef]
  115. Gumma, M.K.; Tummala, K.; Dixit, S.; Collivignarelli, F.; Holecz, F.; Kolli, R.N.; Whitbread, A.M. Crop type identification and spatial mapping using Sentinel-2 satellite data with focus on field-level information. Geocarto Int. 2020. [Google Scholar] [CrossRef]
  116. Huang, S.; Han, W.; Chen, H.; Li, G.; Tang, J. Recognizing zucchinis intercropped with sunflowers in UAV visible images using an improved method based on OCRNet. Remote Sens. 2021, 13, 2706. [Google Scholar] [CrossRef]
  117. Hegarty-Craver, M.; Polly, J.; O’Neil, M.; Ujeneza, N.; Rineer, J.; Beach, R.H.; Lapidus, D.; Temple, D.S. Remote crop mapping at scale: Using satellite imagery and UAV-acquired data as ground truth. Remote Sens. 2020, 12, 1984. [Google Scholar] [CrossRef]
  118. Zhang, Y.; Liu, J.; Zhang, J.; Liu, H.; Liu, S.; Zhai, L.; Wang, H.; Lei, Q.; Ren, T.; Yin, C. Row ratios of intercropping maize and soybean can affect agronomic efficiency of the system and subsequent wheat. PLoS ONE 2015, 10, e0129245. [Google Scholar] [CrossRef]
  119. Belgiu, M.; Csillik, O. Sentinel-2 cropland mapping using pixel-based and object-based time-weighted dynamic time warping analysis. Remote Sens. Environ. 2018, 204, 509–523. [Google Scholar] [CrossRef]
  120. Veloso, A.; Mermoz, S.; Bouvet, A.; Le Toan, T.; Planells, M.; Dejoux, J.F.; Ceschia, E. Understanding the temporal behavior of crops using Sentinel-1 and Sentinel-2-like data for agricultural applications. Remote Sens. Environ. 2017, 199, 415–426. [Google Scholar] [CrossRef]
  121. McNairn, H.; Champagne, C.; Shang, J.; Holmstrom, D.; Reichert, G. Integration of optical and Synthetic Aperture Radar (SAR) imagery for delivering operational annual crop inventories. ISPRS J. Photogramm. Remote Sens. 2009, 64, 434–449. [Google Scholar] [CrossRef]
  122. Schumann, G.J.P.; Moller, D.K. Microwave remote sensing of flood inundation. Phys. Chem. Earth 2015, 83–84, 84–95. [Google Scholar] [CrossRef]
  123. Useya, J.; Shengbo, C. Exploring the Potential of Mapping Cropping Patterns on Smallholder Scale Crop-lands Using Sentinel-1 SAR Data. Chin. Geogr. Sci. 2019, 29, 626–639. [Google Scholar] [CrossRef] [Green Version]
  124. Erten, E.; Lopez-Sanchez, J.M.; Yuzugullu, O.; Hajnsek, I. Retrieval of agricultural crop height from space: A comparison of SAR techniques. Remote Sens. Environ. 2016, 187, 130–144. [Google Scholar] [CrossRef] [Green Version]
  125. Bouvet, A.; Le Toan, T.; Lam-Dao, N. Monitoring of the rice cropping system in the Mekong Delta using ENVISAT/ASAR dual polarization data. IEEE Trans. Geosci. Remote Sens. 2009, 47, 517–526. [Google Scholar] [CrossRef] [Green Version]
  126. Cui, J.; Zhang, X.; Wang, W.; Wang, L. Integration of optical and sar remote sensing images for crop-type mapping based on a novel object-oriented feature selection method. Int. J. Agric. Biol. Eng. 2020, 13, 178–190. [Google Scholar] [CrossRef]
  127. Mariotto, I.; Thenkabail, P.S.; Huete, A.; Slonecker, E.T.; Platonov, A. Hyperspectral versus multispectral crop-productivity modeling and type discrimination for the HyspIRI mission. Remote Sens. Environ. 2013, 139, 291–305. [Google Scholar] [CrossRef]
  128. Ray, S.S.; Das, G.; Singh, J.P.; Panigrahy, S. Evaluation of hyperspectral indices for LAI estimation and discrimination of potato crop under different irrigation treatments. Int. J. Remote Sens. 2006, 27, 5373–5387. [Google Scholar] [CrossRef]
  129. Kumar, A.; Manjunath, K.R.; Meenakshi; Suda, R.K.; Singh, R.D.; Panigrahy, S. Field hyperspectral data analysis for discriminating spectral behavior of tea plantations under various management practices. Int. J. Appl. Earth Obs. Geoinf. 2013, 23, 352–359. [Google Scholar] [CrossRef]
  130. Schmidt, K.S.; Skidmore, A.K. Spectral discrimination of vegetation types in a coastal wetland. Remote Sens. Environ. 2003, 85, 92–108. [Google Scholar] [CrossRef]
  131. Manjunath, K.R.; Ray, S.S.; Panigrahy, S. Discrimination of spectrally-close crops Using ground-based hyperspectral data. J. Indian Soc. Remote Sens. 2011, 39, 599–602. [Google Scholar] [CrossRef]
  132. Zhao, Y.; Liu, X.; Tong, C.; Wu, Y. Effect of root interaction on nodulation and nitrogen fixation ability of alfalfa in the simulated alfalfa/triticale intercropping in pots. Sci. Rep. 2020, 10, 4269. [Google Scholar] [CrossRef] [Green Version]
  133. Lu, B.; Dao, P.D.; Liu, J.; He, Y.; Shang, J. Recent advances of hyperspectral imaging technology and applications in agriculture. Remote Sens. 2020, 12, 2659. [Google Scholar] [CrossRef]
  134. Sahoo, R.N.; Ray, S.S.; Manjunath, K.R. Hyperspectral remote sensing of agriculture. Curr. Sci. 2015, 108, 848–859. [Google Scholar] [CrossRef]
  135. Gumma, M.K.; Thenkabail, P.S.; Deevi, K.C.; Mohammed, I.A.; Teluguntla, P.; Oliphant, A.; Xiong, J.; Aye, T.; Whitbread, A.M. Mapping cropland fallow areas in myanmar to scale up sustainable intensification of pulse crops in the farming system. GISci. Remote Sens. 2018, 55, 926–949. [Google Scholar] [CrossRef]
  136. Sun, R.; Chen, S.; Su, H.; Mi, C.; Jin, N. The effect of NDVI time series density derived from spatiotemporal fusion of multisource remote sensing data on crop classification accuracy. ISPRS Int. J. Geo-Inf. 2019, 8, 502. [Google Scholar] [CrossRef] [Green Version]
  137. Sakamoto, T.; Van Nguyen, N.; Ohno, H.; Ishitsuka, N.; Yokozawa, M. Spatio-temporal distribution of rice phenology and cropping systems in the Mekong Delta with special reference to the seasonal water flow of the Mekong and Bassac rivers. Remote Sens. Environ. 2006, 100, 1–16. [Google Scholar] [CrossRef]
  138. Hao, P.Y.; Tang, H.J.; Chen, Z.X.; Yu, L.; Wu, M.Q. High resolution crop intensity mapping using harmonized Landsat-8 and Sentinel-2 data. J. Integr. Agric. 2019, 18, 2883–2897. [Google Scholar] [CrossRef]
  139. Liu, Z.; Hu, Q.; Tan, J.; Zou, J. Regional scale mapping of fractional rice cropping change using a phenology-based temporal mixture analysis. Int. J. Remote Sens. 2019, 40, 2703–2716. [Google Scholar] [CrossRef]
  140. Yan, H.; Liu, F.; Niu, Z.; Gu, F.; Yang, Y. Changes of multiple cropping in Huang-Huai-Hai agricultural region, China. J. Geogr. Sci. 2018, 28, 1685–1699. [Google Scholar] [CrossRef] [Green Version]
  141. Son, N.T.; Chen, C.F.; Chen, C.R.; Guo, H.Y. Classification of multitemporal Sentinel-2 data for field-level monitoring of rice cropping practices in Taiwan. Adv. Space Res. 2020, 65, 1910–1921. [Google Scholar] [CrossRef]
  142. Guo, Y.; Xia, H.; Pan, L.; Zhao, X.; Li, R.; Bian, X.; Wang, R.; Yu, C. Development of a new phenology algorithm for fine mapping of cropping intensity in complex planting areas using sentinel-2 and google earth engine. ISPRS Int. J. Geo-Inf. 2021, 10, 587. [Google Scholar] [CrossRef]
  143. de Bie, C.A.J.M.; Khan, M.R.; Smakhtin, V.U.; Venus, V.; Weir, M.J.C.; Smaling, E.M.A. Analysis of multi-temporal SPOT NDVI images for small-scale land-use mapping. Int. J. Remote Sens. 2011, 32, 6673–6693. [Google Scholar] [CrossRef]
  144. Wardlow, B.D.; Egbert, S.L. Large-area crop mapping using time-series MODIS 250 m NDVI data: An assessment for the U.S. Central Great Plains. Remote Sens. Environ. 2008, 112, 1096–1116. [Google Scholar] [CrossRef]
  145. Belgiu, M.; Drăgu, L. Random forest in remote sensing: A review of applications and future directions. ISPRS J. Photogramm. Remote Sens. 2016, 114, 24–31. [Google Scholar] [CrossRef]
  146. Belgiu, M.; Bijker, W.; Csillik, O.; Stein, A. Phenology-based sample generation for supervised crop type classification. Int. J. Appl. Earth Obs. Geoinf. 2021, 95, 102264. [Google Scholar] [CrossRef]
  147. Campos-Taberner, M.; García-Haro, F.J.; Martínez, B.; Izquierdo-Verdiguier, E.; Atzberger, C.; Camps-Valls, G.; Gilabert, M.A. Understanding deep learning in land use classification based on Sentinel-2 time series. Sci. Rep. 2020, 10, 17188. [Google Scholar] [CrossRef]
  148. Jin, Z.; Azzari, G.; You, C.; Di Tommaso, S.; Aston, S.; Burke, M.; Lobell, D.B. Smallholder maize area and yield mapping at national scales with Google Earth Engine. Remote Sens. Environ. 2019, 228, 115–128. [Google Scholar] [CrossRef]
  149. Fritz, S.; McCallum, I.; Schill, C.; Perger, C.; See, L.; Schepaschenko, D.; van der Velde, M.; Kraxner, F.; Obersteiner, M. Geo-Wiki: An online platform for improving global land cover. Environ. Model. Softw. 2012, 31, 110–123. [Google Scholar] [CrossRef]
  150. Laso Bayas, J.C.; Lesiv, M.; Waldner, F.; Schucknecht, A.; Duerauer, M.; See, L.; Fritz, S.; Fraisl, D.; Moorthy, I.; McCallum, I. A global reference database of crowdsourced cropland data collected using the Geo-Wiki platform. Sci. Data 2017, 4, 170136. [Google Scholar] [CrossRef]
  151. Whitcraft, A.K.; Becker-Reshef, I.; Justice, C.O. A framework for defining spatially explicit earth observation requirements for a global agricultural monitoring initiative (GEOGLAM). Remote Sens. 2015, 7, 1461–1481. [Google Scholar] [CrossRef] [Green Version]
  152. Lowder, S.K.; Sánchez, M.V.; Bertini, R. Which farms feed the world and has farmland become more concentrated? World Dev. 2021, 142, 105455. [Google Scholar] [CrossRef]
  153. Poisot, A.-S.; Speedy, A.; Kueneman, E. Good Agricultural Practices—A Working Concept Background Paper for the FAO Internal Workshop on Good Agricultural Practices; FAO: Rome, Italy, 2004; p. 34. [Google Scholar]
  154. Lawson, G.; Dupraz, C.; Liagre, F.; Moreno, G.; Paris, P.; Papanastasis, V. Quality of Life and Management of Living Resources Silvoarable Agroforestry For Europe (SAFE); Options for Agroforestry Policy in the European Union: Paris, France, 2005. [Google Scholar]
  155. Giller, K.E.; Delaune, T.; Silva, J.V.; Descheemaeker, K.; van de Ven, G.; Schut, A.G.T.; van Wijk, M.; Hammond, J.; Hochman, Z.; Taulya, G.; et al. The future of farming: Who will produce our food? Food Secur. 2021, 13, 1073–1099. [Google Scholar] [CrossRef]
Figure 1. Selection process of the papers reviewed.
Remotesensing 14 02404 g001
Figure 2. Types of cropping patterns and examples; * homogenous during the period when the different crops are growing at the same time.
Remotesensing 14 02404 g002
Figure 3. Examples of crop calendar information from Manyara region in Tanzania for different cropping patterns during 2018.
Remotesensing 14 02404 g003
Table 1. The number (#) of reviewed studies that used different types of sensors for mapping cropping patterns.
Cropping Patterns (#)Optical Sensors (#)Microwave Sensors (#)Hyperspectral (#)Multi-Source (#)
Single (32)MODIS (3)
Landsat (3)
Sentinel-2 (3)
PROBA-V (1)
UAV (1)
Gaofen-1 (1)
SPOT (1)
Sentinel-1 (6)AVIRIS-NG (1)Sentinel-1, Sentinel-2,
Gaofen-3, Gaofen-2,
Landsat, RADARSAT, SPOT, ERS, COSMO-SkyMed, UAV (12)
Sequential (51)MODIS (21)
Sentinel-2 (5)
SPOT (3)
IRS (3)
Gaofen-1 (1)
Landsat (4)
UAV (1)
NOAA (1)
Sentinel-1 (3)
ENVISAT-ASAR (1)
-Sentinel-1, Landsat, Gaofen-2, Gaofen-3, IRS, RADARSAT, AWiFS (8)
Intercropping (7)RapidEye (1)
UAV (1)
MODIS (1)
Landsat (1)
--Landsat, Sentinel-2, Sentinel-1 (3)
Table 2. Continental distribution of local and regional remote sensing studies on mapping cropping patterns.
ContinentalLocal Scale StudiesRegional Scale Studies
SingleSequentialIntercroppingSingleSequentialIntercropping
Africa413114
Asia *74-732-
Europe *71-3--
North America *21-12-
South America-2-17-
* Two studies covered two different continents (Belgui and Csillik, [119]; Zhao et al. [85]).
Publisher’s Note: MDPI stays neutral with regard to jurisdictional claims in published maps and institutional affiliations.

