
Distribution and Characteristics of Damming Landslides Triggered by 1920 M~8 Haiyuan Earthquake, NW China


Abstract
:1. Introduction
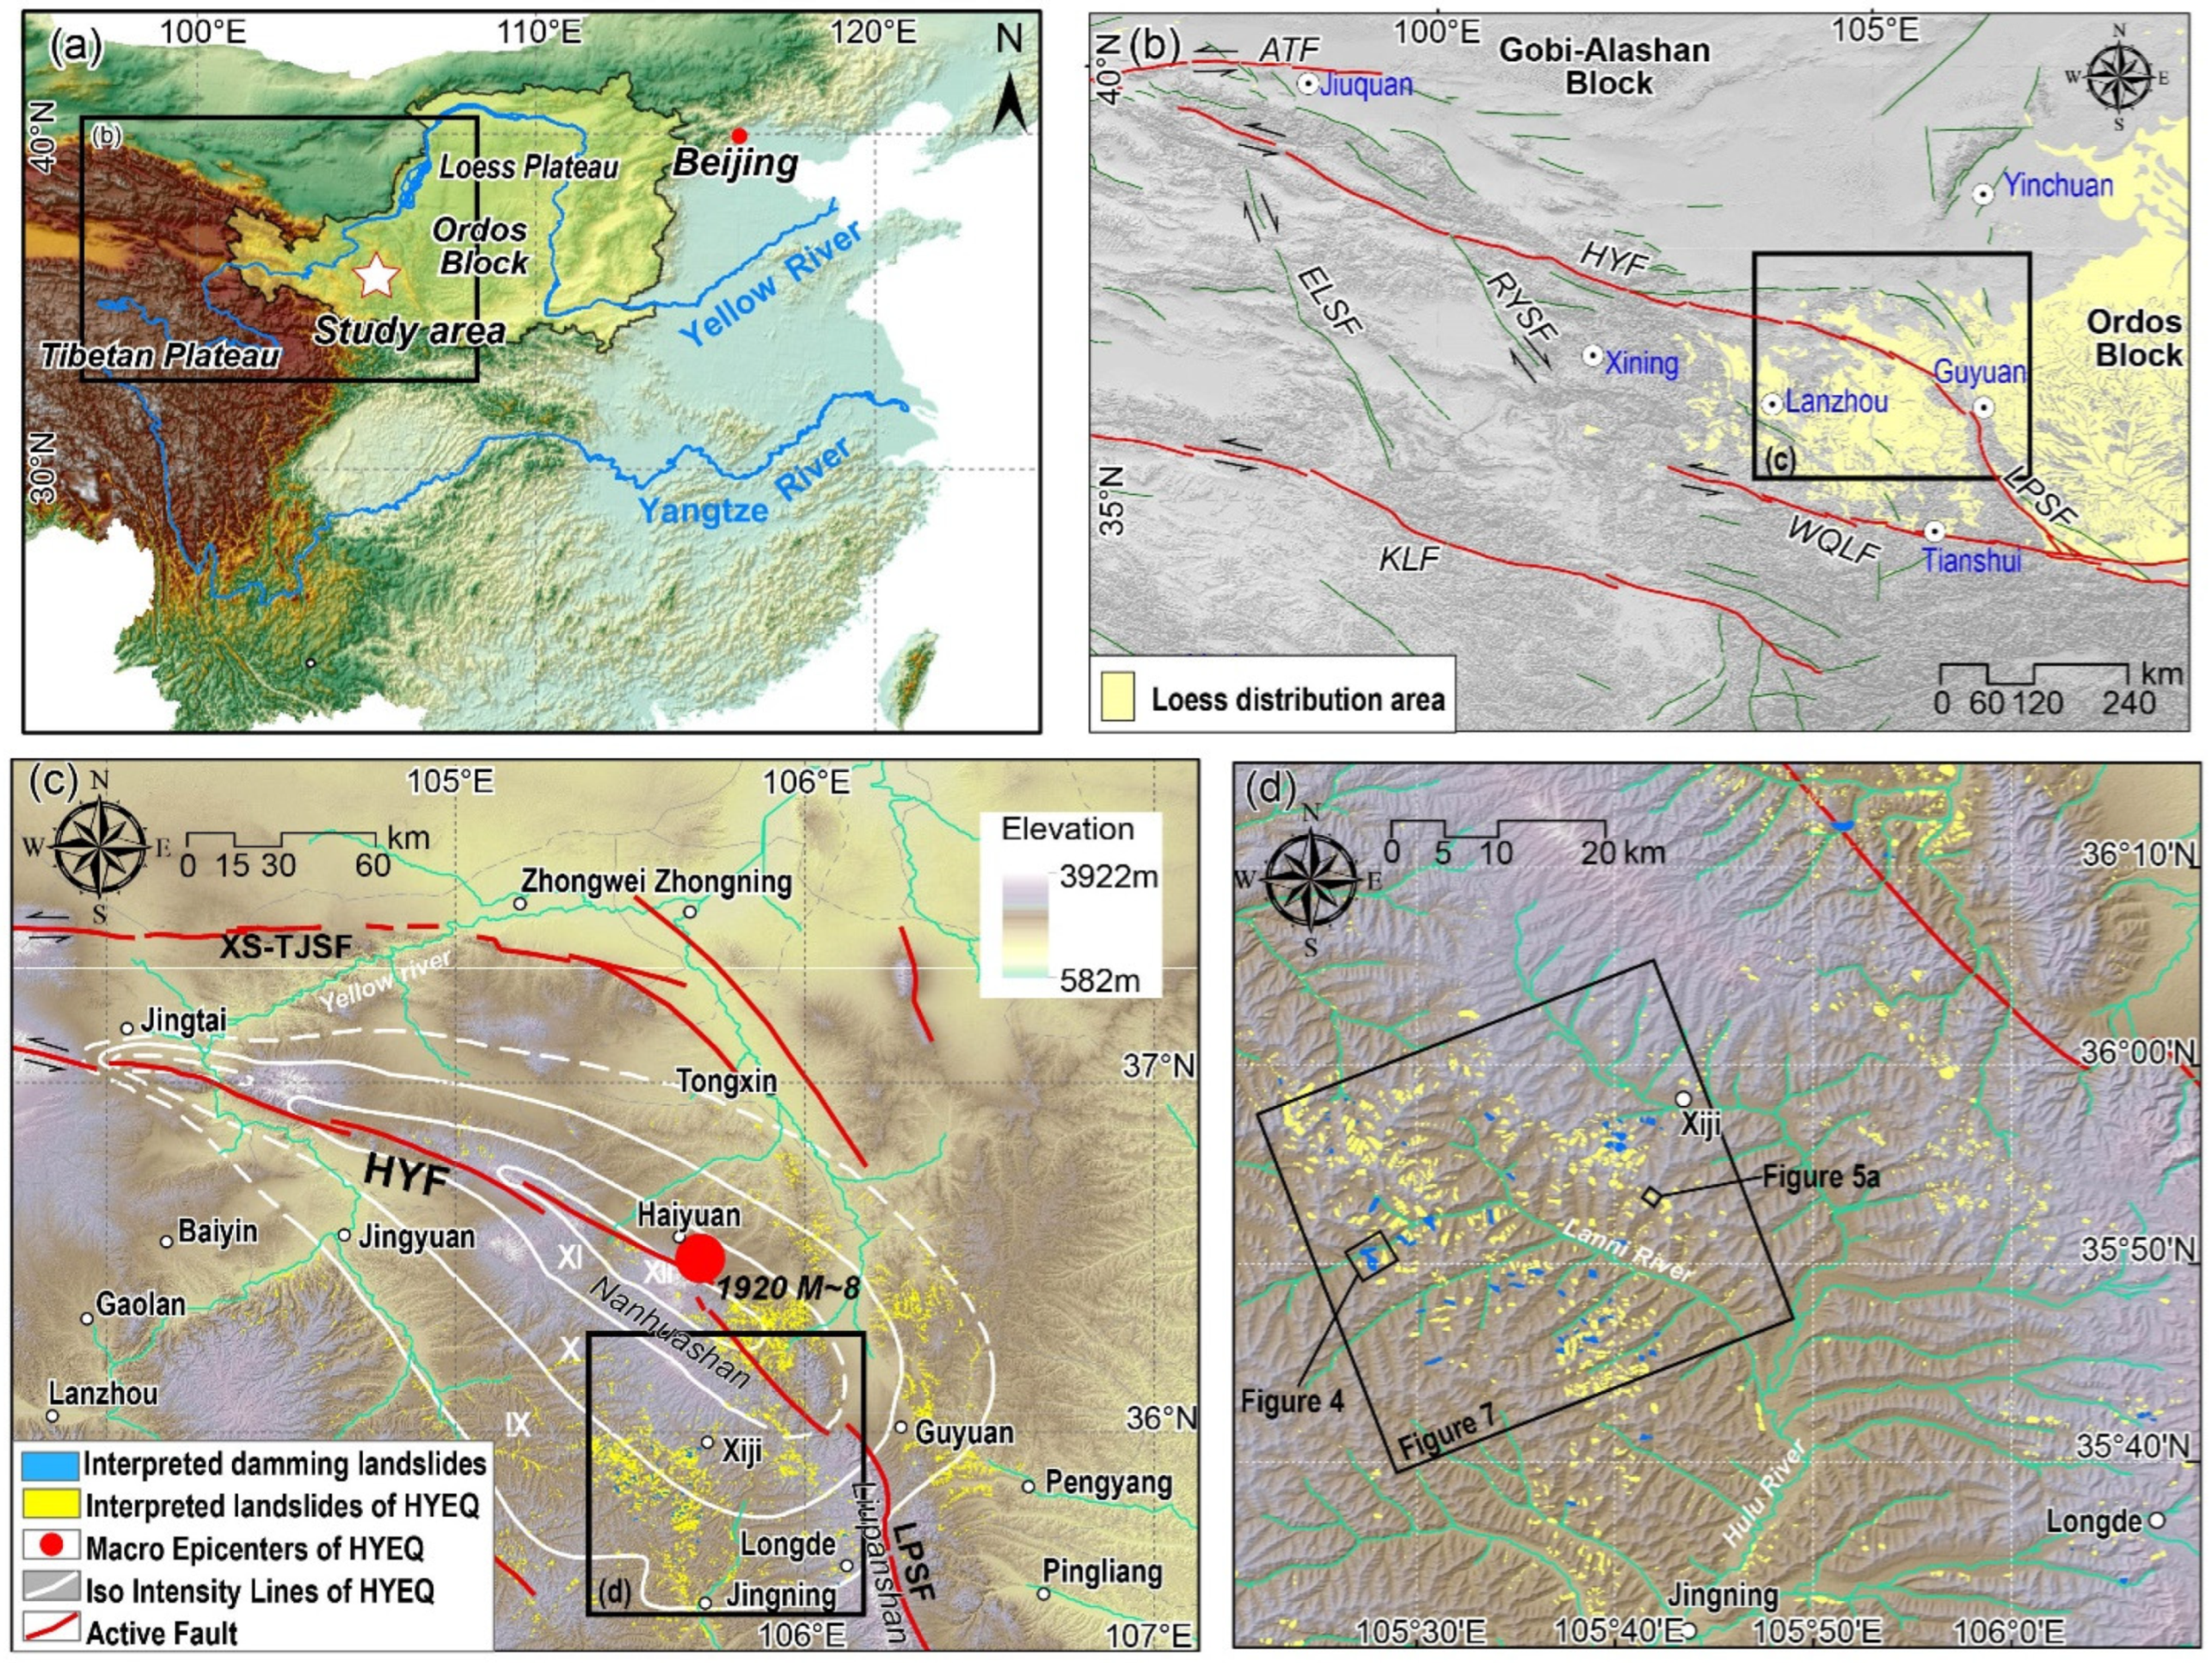
2. Study Area
3. Materials and Methods
3.1. Damming Landslide Inventory and Controlling Factor Preparation
3.2. Spatial Distribution Analysis of Damming Landslides
3.3. Morphometry Analysis of Damming Landslides
4. Results
4.1. Survey of Damming Landslides
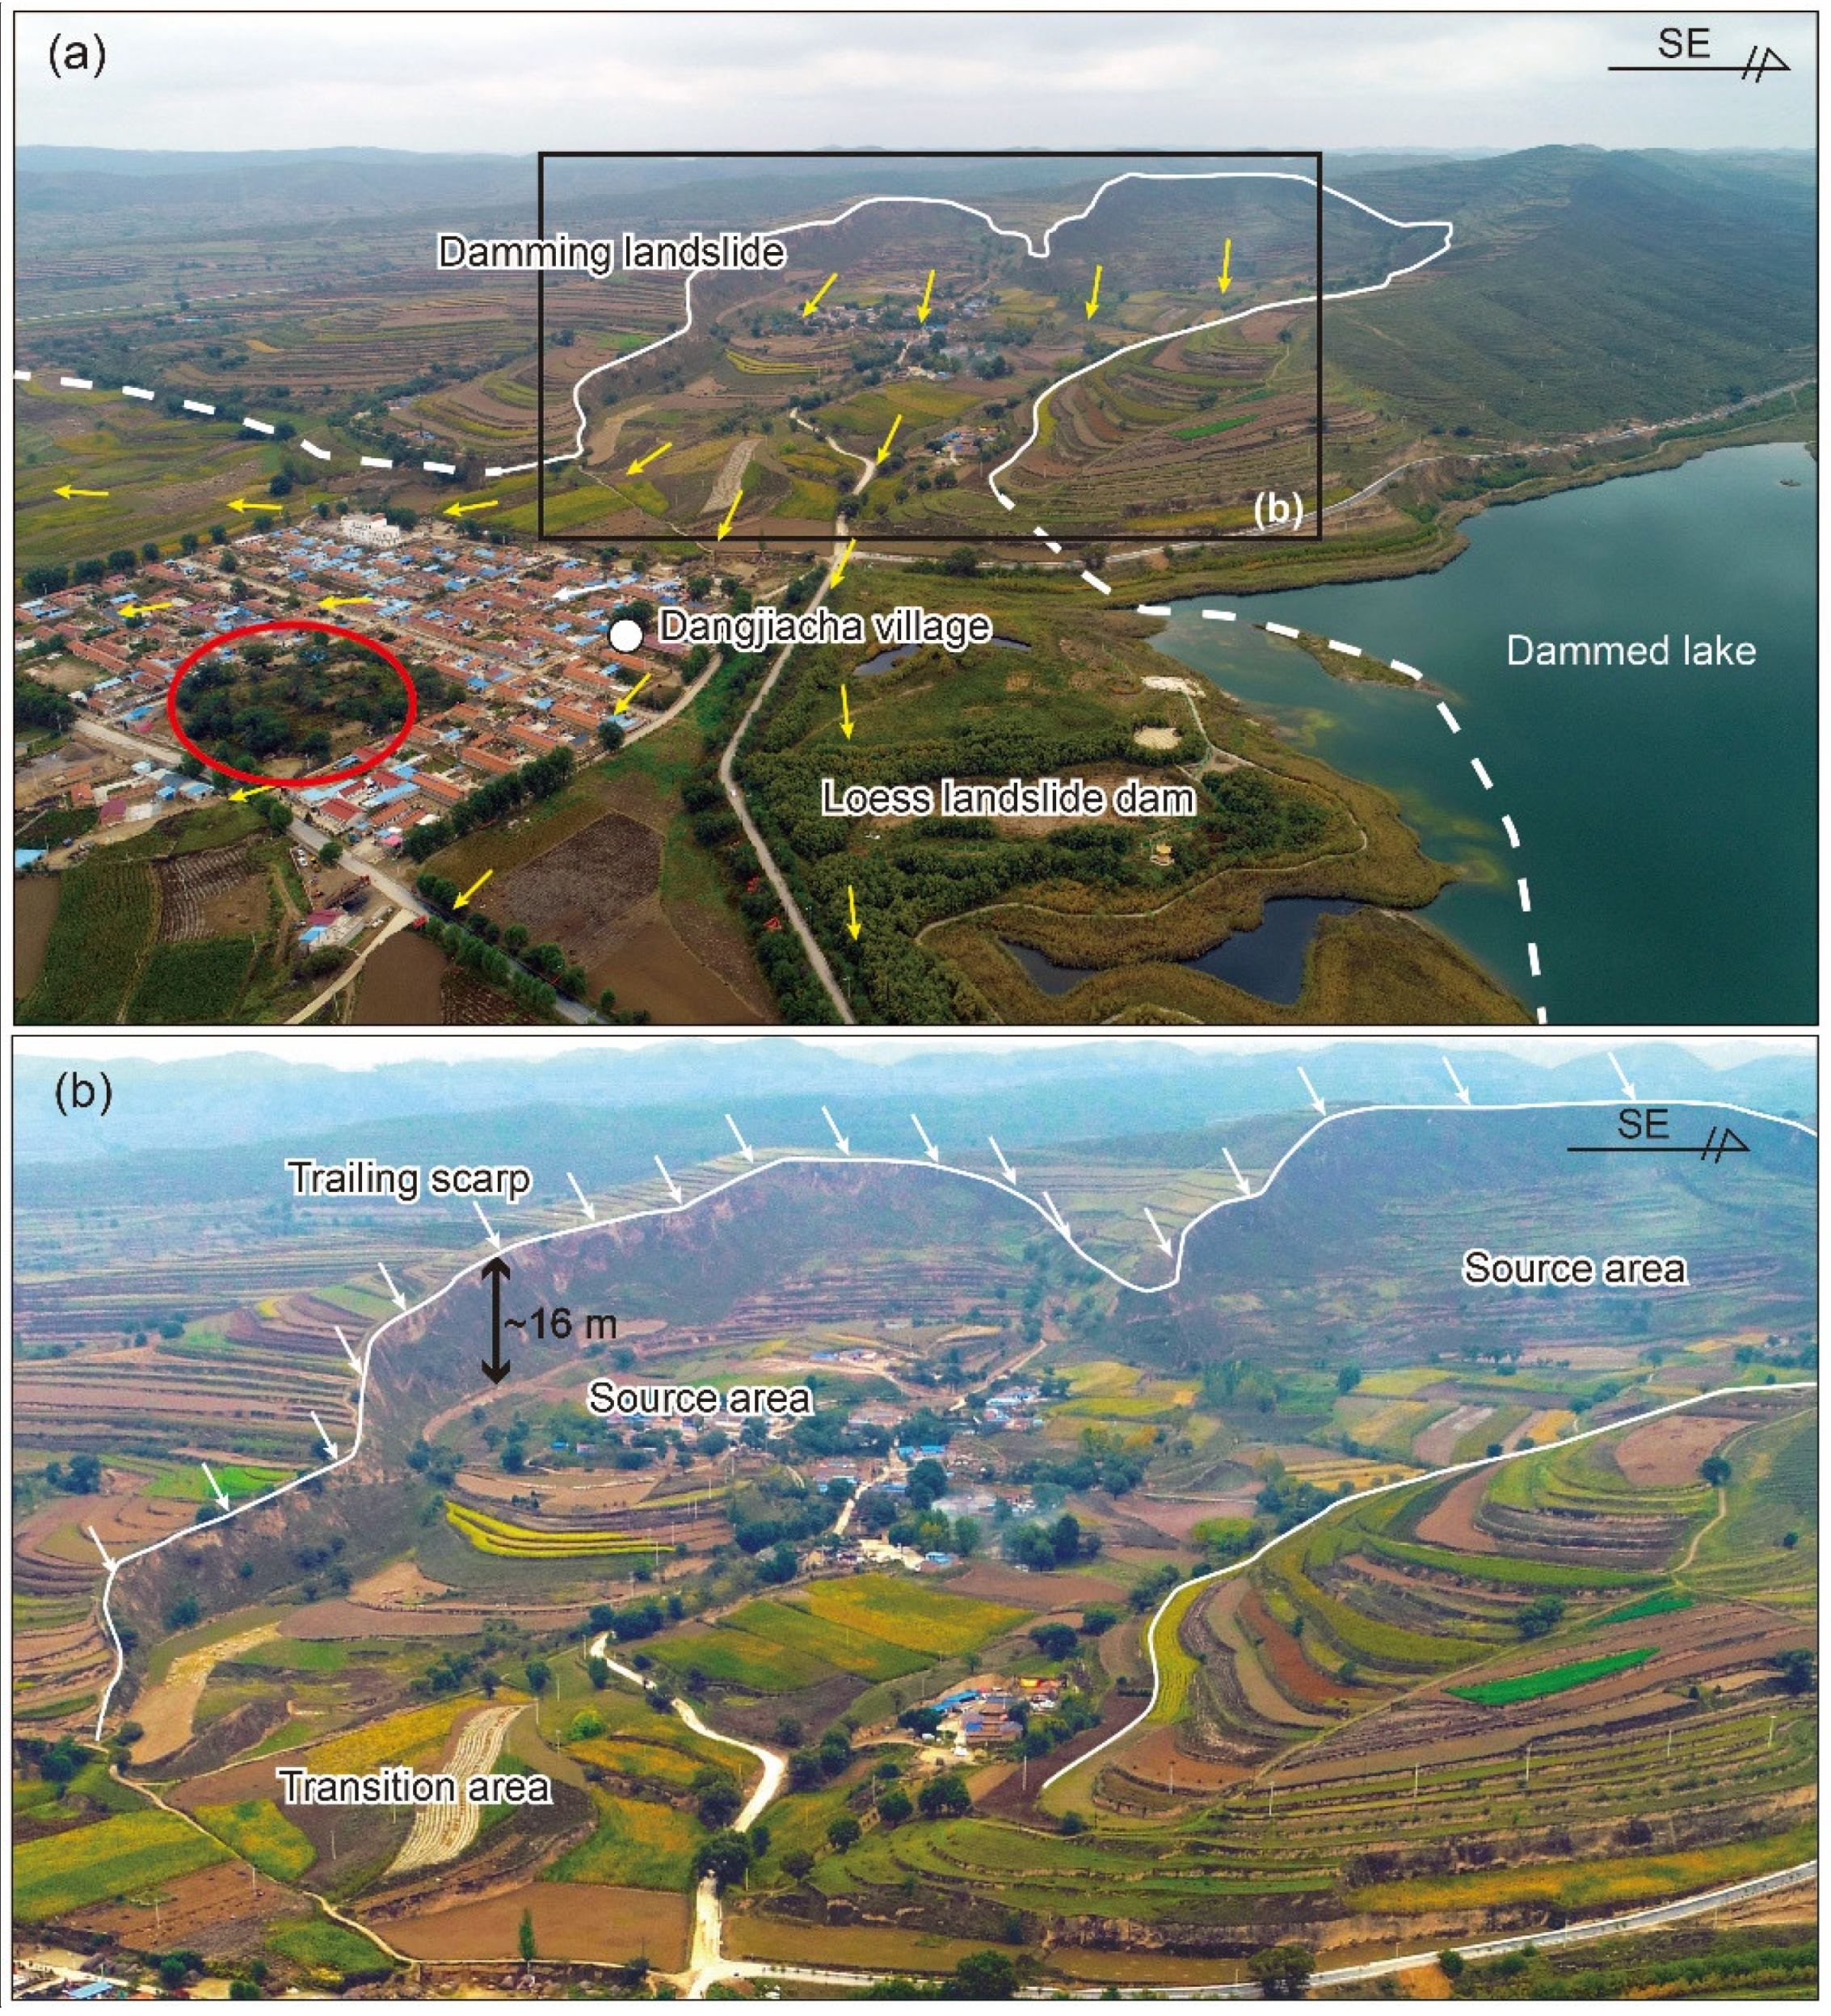
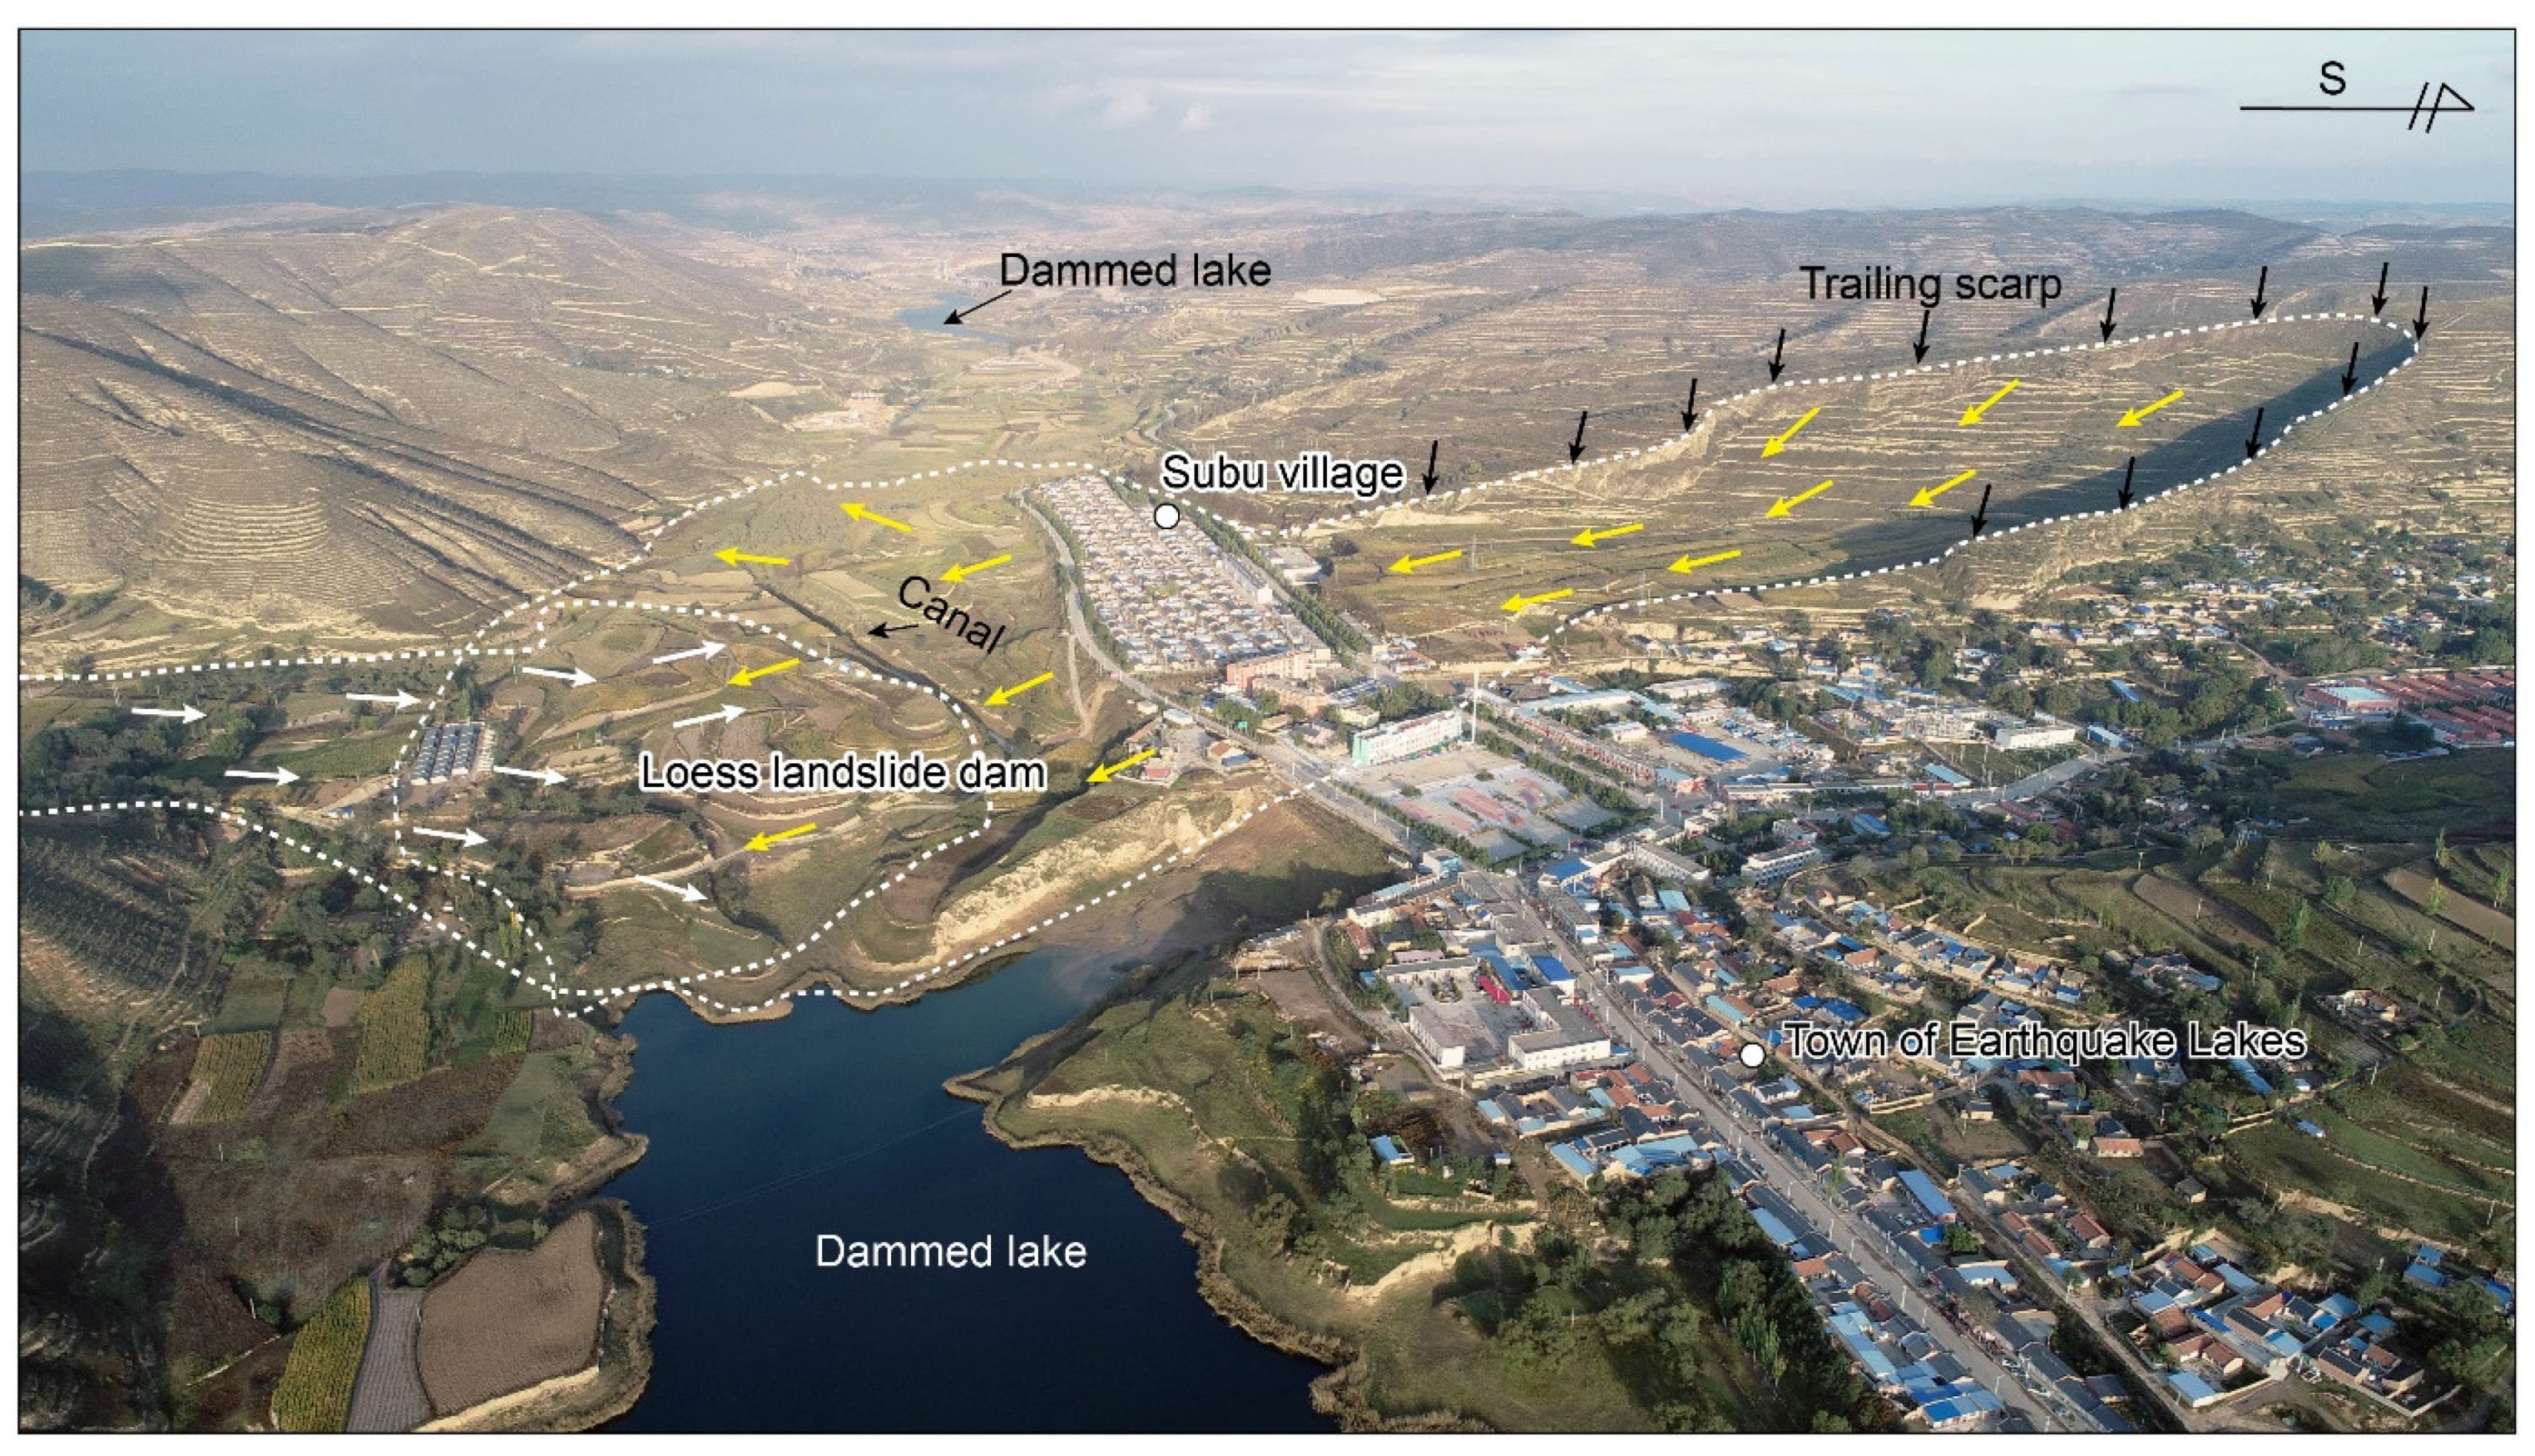
4.2. Features of Representative Damming Landslides
4.3. Spatial Analysis of Damming Landslide Distribution
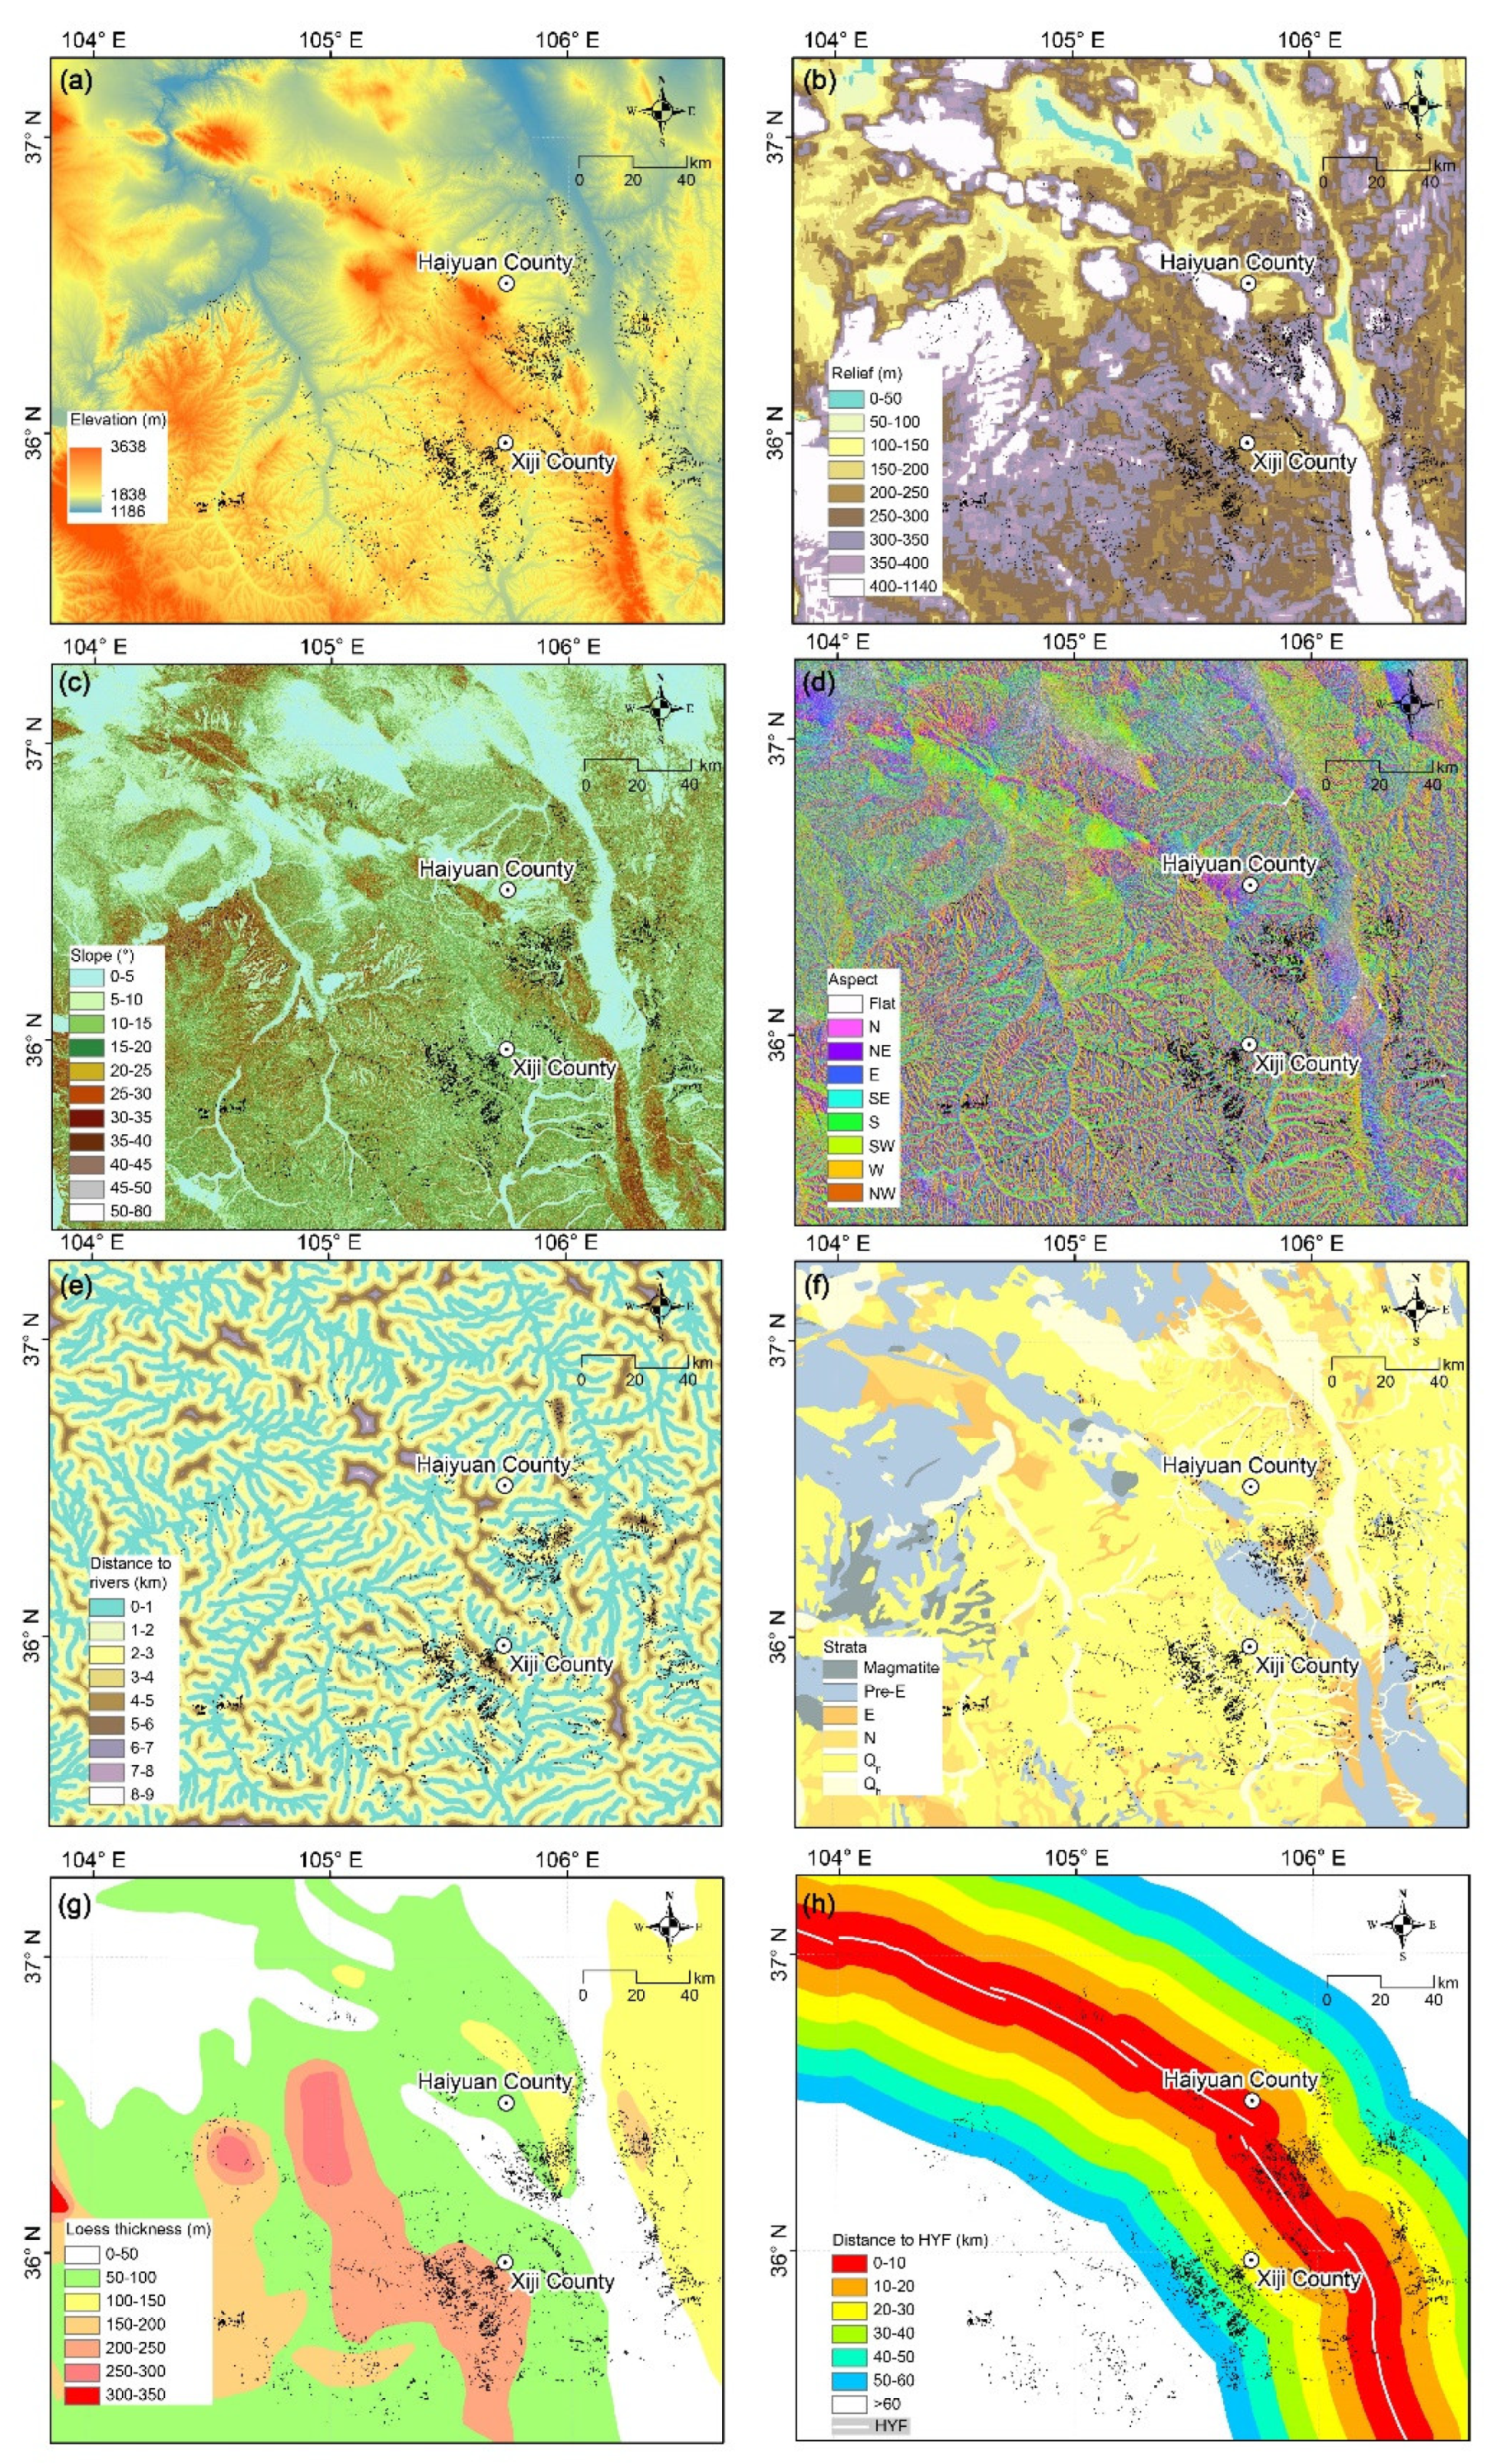
4.3.1. Terrain Factors of Damming Landslides
4.3.2. Geological Factors of Damming Landslides
4.3.3. Seismic Factors of Damming Landslides
4.3.4. Importance Ranking of the Controlling Factors
4.4. Morphometry of Damming Landslides
5. Discussion
5.1. Characteristic Comparison between Damming and Non-Damming Landslides in the LP
5.2. Comparison of Characteristics of Landslide Dams in the LP and the Global Database
5.3. Landscape Implications of Damming Landslides in LP
5.4. Deficiencies and Prospects
6. Conclusions
Supplementary Materials
Author Contributions
Funding
Conflicts of Interest
References
- Tacconi, S.C.; Catani, F.; Casagli, N. Geomorphological investigations on landslide dams. Geoenviron. Disasters 2015, 2, 21. [Google Scholar] [CrossRef] [Green Version]
- Delaney, K.B.; Evans, S.G. The 2000 Yigong landslide (Tibetan plateau), rockslide-dammed lake and outburst flood: Review, remote sensing analysis, and process modeling. Geomorphology 2015, 246, 377–393. [Google Scholar] [CrossRef]
- Zhong, Q.M.; Chen, S.S.; Wang, L.; Shan, Y.B. Back analysis of breaching process of Baige landslide dam. Landslides 2020, 17, 1681–1692. [Google Scholar] [CrossRef]
- Fan, X.M.; Yang, F.; Subramanian, S.S.; Xu, Q.; Feng, Z.T.; Mavrouli, O.; Peng, M.; Ouyang, C.J.; Jansen, J.D.; Huang, R.Q. Prediction of a multi-hazard chain by an integrated numerical simulation approach: The Baige landslide, Jinsha River, China. Landslides 2020, 17, 147–164. [Google Scholar] [CrossRef]
- Guo, X.Y.; Guo, Q.; Feng, Z.K. Detecting the vegetation change related to the creep of 2018 Baige landslide in Jinsha river, SE Tibet using spot data. Front. Earth Sci. 2021, 9, 706998. [Google Scholar] [CrossRef]
- Korup, O. Geomorphometric characteristics of New Zealand landslide dams. Eng. Geol. 2004, 73, 13–35. [Google Scholar] [CrossRef]
- Ermini, L.; Casagli, N. Prediction of the behaviour of landslide dams using a geomorphological dimensionless index. Earth Surf. Process. Landf. 2003, 28, 31–47. [Google Scholar] [CrossRef]
- Evans, S.G.; Delaney, K.B.; Hermanns, R.L.; Strom, A.; Scarascia-Mugnozza, G. The Formation and Behaviour of Natural and Artificial Rockslide Dams; Implications for Engineering performance and Hazard Management. In Natural and Artificial Rockslide Dams; Lecture Notes in Earth Sciences; Springer: Cham, Switzerland, 2010; pp. 1–75. [Google Scholar] [CrossRef]
- Harrison, L.M.; Dunning, S.A.; Woodward, J.; Davies, T.R.H. Post-rock-avalanche dam outburst flood sedimentation in Ram Creek, Southern Alps, New Zealand. Geomorphology 2015, 241, 135–144. [Google Scholar] [CrossRef] [Green Version]
- Fan, X.M.; Dufresne, A.; Subramanian, S.S.; Strom, A.; Hermanns, R.; Stefanelli, C.T.; Hewitt, K.; Yunus, A.P.; Dunning, S.; Capra, L.; et al. The formation and impact of landslide dams-state of the art. Earth-Sci. Rev. 2020, 203, 103116. [Google Scholar] [CrossRef]
- Xu, W.J.; Xu, Q.; Wang, Y.J. The mechanism of high-speed motion and damming of the Tangjiashan landslide. Eng. Geol. 2013, 157, 8–20. [Google Scholar] [CrossRef]
- Luo, J.; Pei, X.J.; Evans, S.G.; Huang, R.Q. Mechanics of the earthquake-induced Hongshiyan landslide in the 2014 MW6.2 Ludian earthquake, Yunnan, China. Eng. Geol. 2018, 251, 197–213. [Google Scholar] [CrossRef]
- Fan, X.M.; Western, C.J.V.; Xu, Q.; Gorum, T.; Dai, F.C. Analysis of landslide dams induced by the 2008 Wenchuan earthquake. J. Asian Earth Sci. 2012, 57, 25–37. [Google Scholar] [CrossRef]
- Tang, R.; Fan, X.M.; Scaringi, G.; Xu, Q.; Western, C.J.V.; Ren, J.; Havenith, H.B. Distinctive controls on the distribution of river-damming and non-damming landslides induced by the 2008 Wenchuan earthquake. Bull. Eng. Geol. Environ. 2019, 78, 4075–4093. [Google Scholar] [CrossRef]
- Wang, Y.; Cui, L.; Zhang, C.; Chen, W.; Xu, Y.; Zhang, Q. A Two-Stage Seismic Damage Assessment Method for Small, Dense, and Imbalanced Buildings in Remote Sensing Images. Remote Sens. 2022, 14, 1012. [Google Scholar] [CrossRef]
- Fan, X.; Scaringi, G.; Korup, O.; West, A.J.; van Westen, C.J.; Tanyas, H.; Hovius, N.; Hales, T.C.; Jibson, R.W.; Allstadt, K.; et al. Earthquake-induced chains of geologic hazards: Patterns, mechanisms, and impacts. Rev. Geophys. 2019, 57, 421–503. [Google Scholar] [CrossRef] [Green Version]
- Guzzetti, F.; Mondini, A.C.; Cardinali, M.; Fiorucci, F.; Santangelo, M.; Chang, K.T. Landslide inventory maps: New tools for an old problem. Earth-Sci. Rev. 2012, 112, 42–66. [Google Scholar] [CrossRef] [Green Version]
- Keefer, D.K. Investigating landslides caused by earthquakes—A historical review. Surv. Geophys. 2002, 23, 473–510. [Google Scholar] [CrossRef]
- Van Westen, C.J.; Castellanos, E.; Kuriakose, S.L. Spatial data for landslide susceptibility, hazard, and vulnerability assessment: An overview. Eng. Geol. 2008, 102, 112–131. [Google Scholar] [CrossRef]
- Xu, Y.R.; Allen, M.B.; Zhang, W.H.; Li, W.Q.; He, H.L. Landslide characteristics in the loess plateau, northern China. Geomorphology 2020, 359, 107150. [Google Scholar] [CrossRef]
- Xu, Y.R.; Liu-Zeng, J.; Allen, M.B.; Zhang, W.H.; Du, P. Landslides of the 1920 Haiyuan earthquake, northern China. Landslides 2021, 18, 935–953. [Google Scholar] [CrossRef]
- Zhang, W.H.; Xu, Y.R.; Du, P.; Li, W.Q.; Tian, Q.J.; Chen, L.Z. Interpretation of the spatial distribution characteristics of the coseismic landslides induced by the 1920 Haiyuan M 8 1/2 earthquake using remote sensing images. Earthq. Res. China 2020, 34, 523–545. [Google Scholar] [CrossRef]
- Du, P.; Xu, Y.R.; Tian, Q.J.; Li, W.Q. Using Google Earth Images to Extract Dense Landslides Induced by Historical Earthquakes at the Southwest of Ordos, China. Front. Earth. Sci. 2020, 8, 633342. [Google Scholar] [CrossRef]
- Du, P.; Xu, Y.R.; Tian, Q.J.; Zhang, W.H.; Liu, S. The Spatial Distribution and Attribute Parameter Statistics of Landslides Triggered by the May 12th, 2008, MW7.9 Wenchuan Earthquake. Earthq. Res. China 2020, 34, 29–49. [Google Scholar] [CrossRef]
- Xu, Y.R.; Du, P.; Li, W.Q.; Zhang, W.H.; Tian, Q.J.; Xiong, R.W.; Wang, L. A case study on AD 1718 Tongwei M7.5 earthquake triggered landslides- Application of landslide database triggered by historical strong earthquakes on the Loess Plateau. Chin. J. Geophys. 2020, 63, 1235–1248, (In Chinese with English abstract). [Google Scholar] [CrossRef]
- Xu, Y.R.; Liu-Zeng, J.; Allen, M.B.; Du, P.; Zhang, W.H.; Li, W.Q.; Tian, Q.J. Understanding historical earthquakes by mapping coseismic landslides in the Loess Plateau, northwest China. Earth Surf. Process. Landf. 2022, 1–17. [Google Scholar] [CrossRef]
- Lanzhou Institute of Seismology; SSB; Seismic Crew of Ningxia Hui Autonomous Region. AD 1920 Haiyuan Great Earthquake; Seismological Press: Beijing, China, 1980. (In Chinese) [Google Scholar]
- Close, U.; McCormick, E. Where the mountains walked. Natl. Geogr. Mag. 1922, 41, 445–464. [Google Scholar]
- Zhang, Z.; Wang, L. Geological Disasters in loess areas during the 1920 Haiyuan earthquake, China. GeoJournal 1995, 36, 269–274. [Google Scholar] [CrossRef] [Green Version]
- Zhuang, J.Q.; Peng, J.B.; Xu, C.; Li, Z.H.; Densmore, A.; Milledge, D.; Iqbal, J.; Cui, Y.F. Distribution and characteristics of loess landslides triggered by the 1920 Haiyuan earthquake, northwest of China. Geomorphology 2018, 314, 1–12. [Google Scholar] [CrossRef] [Green Version]
- Xu, C.; Tian, Y.Y.; Ma, S.Y.; Xu, X.W.; Zhou, B.G.; Wu, X.Y.; Zhuang, J.Q.; Gao, Y.X.; Wu, W.Y.; Huang, X.Q. Inventory and spatial distribution of landslides IN Ⅸ-Ⅺ high-intensity areas of 1920 Haiyuan (China) M8.5 earthquake. J. Eng. Geol. 2018, 26, 1188–1195, (In Chinese with English abstract). [Google Scholar] [CrossRef]
- Guo, X.Y.; Fu, B.H.; Du, J.; Shi, P.L.; Li, J.X.; Li, Z.; Chen, Q.Y.; Fu, H. Monitoring and assessment for the susceptibility of landslide changes after the 2017 ms 7.0 Jiuzhaigou earthquake using the remote sensing technology. Front. Earth Sci. 2021, 9, 633117. [Google Scholar] [CrossRef]
- Zhang, D.; Wang, G. Study of the 1920 Haiyuan earthquake-induced landslides in loess (China). Eng. Geol. 2007, 94, 76–88. [Google Scholar] [CrossRef]
- Wang, G.H.; Zhang, D.X.; Gen, F.; Yang, J. Pore-pressure generation and fluidization in a loess landslide triggered by the 1920 Haiyuan earthquake, China: A case study. Eng. Geol. 2014, 174, 36–45. [Google Scholar] [CrossRef] [Green Version]
- Pei, X.J.; Zhang, X.C.; Guo, B.; Wang, G.H.; Zhang, F.Y. Experimental case study of seismically induced loess liquefaction and landslide. Eng. Geol. 2017, 223, 23–30. [Google Scholar] [CrossRef]
- Tapponnier, P.; Xu, Z.Q.; Roger, F.; Meyer, B.; Arnaud, N.; Wittlinger, G.; Yang, J. Oblique stepwise rise and growth of the Tibet Plateau. Science 2001, 294, 1671–1677. [Google Scholar] [CrossRef]
- Burchfiel, B.C.; Zhang, P.Z.; Wang, Y.P.; Zhang, W.Q.; Song, F.M.; Deng, Q.D.; Molnar, P.; Royden, L. Geology of the Haiyuan fault zone, Ningxia-hui autonomous region, china, and its relation to the evolution of the northeastern margin of the Tibetan plateau. Tectonics 1991, 10, 1091–1110. [Google Scholar] [CrossRef]
- Ren, Z.K.; Zhang, Z.Q.; Chen, T.; Yan, S.L.; Yin, J.H.; Zhang, P.Z.; Zheng, W.J.; Zhang, H.P.; Li, C.Y. Clustering of offsets on the Haiyuan fault and their relationship to paleoearthquakes. Geol. Soc. Am. Bull. 2015, 128, 3–18. [Google Scholar] [CrossRef]
- Lanzhou Institute of Seismology; State Seismology Bureau. Summary of Gansu Historical Earthquake Record; Seismological Press: Beijing, China, 1989. (In Chinese) [Google Scholar]
- Liu-Zeng, J.; Shao, Y.X.; Xie, K.J.; Yuan, D.Y.; Lei, Z.S. Variability in magnitude of paleoearthquakes revealed by trenching and historical records, along the Haiyuan Fault, China. J. Geophys. Res.-Solid Earth 2015, 120, 8304–8333. [Google Scholar] [CrossRef] [Green Version]
- Han, H.; Hou, J.; Huang, M.; Li, Z.; Wang, C. Impact of soil and water conservation measures and precipitation on streamflow in the middle and lower reaches of the Hulu river basin, china. Catena 2020, 195, 104792. [Google Scholar] [CrossRef]
- Deng, Q.D.; Zhang, P.Z.; Ran, Y.K.; Yang, X.P.; Min, W.; Chu, Q.Z. Basic characteristics of active tectonics in China. Sci. China-Earth Sci. 2002, 32, 1020–1031. (In Chinese) [Google Scholar]
- Keefer, D.K. Statistical analysis of an earthquake-induced landslide distribution-the 1989 Loma Prieta, California event. Eng. Geol. 2000, 58, 231–249. [Google Scholar] [CrossRef]
- Guo, X.Y.; Fu, B.H.; Du, J.; Shi, P.L.; Chen, Q.Y.; Zhang, W.Y. Applicability of Susceptibility Model for Rock and Loess Earthquake Landslides in the Eastern Tibetan Plateau. Remote Sens. 2021, 13, 2546. [Google Scholar] [CrossRef]
- Fan, X.M.; Yunus, A.P.; Scaringi, G.; Catani, F.; Subramanian, S.S.; Xu, Q.; Huang, R.Q. Rapidly evolving controls of landslides after a strong earthquake and implications for hazard assessments. Geophys. Res. Lett. 2021, 48, e2020GL090509. [Google Scholar] [CrossRef]
- Huang, R.Q.; Li, W.L. Research on development and distribution rules of geohazards induced by Wenchuan earthquake on 12th May 2008. Chin. J. Rock Mech. Eng. 2008, 27, 2585–2592. (In Chinese) [Google Scholar] [CrossRef]
- Talaei, R. Landslide Susceptibility Zonation Mapping Using Logistic Regression and its Validation in Hashtchin Region, Northwest of Iran. J. Geol. Soc. India. 2014, 84, 68–86. [Google Scholar] [CrossRef]
- Larsen, I.J.; Montgomery, D.R.; Korup, O. Landslide erosion controlled by hillslope material. Nat. Geosci. 2010, 3, 247–251. [Google Scholar] [CrossRef]
- Wang, T.M.; Wu, J.G.; Kou, X.J.; Ge, J.P. Ecologically asynchronous agricultural practice erodes sustainability of the Loess Plateau of China. Ecol. Appl. 2010, 20, 1126–1135. [Google Scholar] [CrossRef] [PubMed]
- Peng, J.B.; Fan, Z.J.; Wu, D.; Huang, Q.B.; Wang, Q.Y.; Zhuang, J.Q.; Che, W.Y. Landslides triggered by excavation in the loess plateau of China: A case study of Middle Pleistocene loess slopes. J. Asian Earth Sci. 2019, 171, 246–258. [Google Scholar] [CrossRef]
- Qi, S.; Xu, Q.; Lan, H.; Zhang, B.; Liu, J. Spatial distribution analysis of landslides triggered by 2008.5.12 Wenchuan earthquake, China. Eng. Geol. 2010, 116, 95–108. [Google Scholar] [CrossRef]
- Wang, L.M.; Wu, Z.J.; Xia, K.; Liu, K.; Wang, P.; Pu, X.W.; Li, L. Amplification of thickness and topography of loess deposit on seismic ground motion and its seismic design methods. Soil Dyn. Earthq. Eng. 2019, 126, 105090. [Google Scholar] [CrossRef]
- Peng, J.B.; Zhuang, J.Q.; Wang, G.H.; Dai, F.C.; Zhang, F.Y.; Huang, W.L.; Xu, Q. Liquefaction of loess landslides as a consequence of irrigation. Q. J. Eng. Geol. Hydrogeol. 2018, 51, 330–337. [Google Scholar] [CrossRef]
- Costa, J.E.; Schuster, R.L. The formation and failure of natural dams. Geol. Soc. Am. Bull. 1988, 100, 1054–1068. [Google Scholar] [CrossRef]
- Fan, X.M.; Westen, C.J.V.; Korup, O.; Gorum, T.; Xu, Q.; Dai, F.C.; Huang, R.Q.; Wang, G.H. Transient water and sediment storage of the decaying landslide dams induced by the 2008 Wenchuan earthquake, China. Geomorphology 2012, 172, 58–68. [Google Scholar] [CrossRef]
- Fan, X.M.; Rossiter, D.G.; Westen, C.; Xu, Q.; Gorum, T. Empirical prediction of coseismic landslide dam formation. Earth Surf. Process. Landf. 2014, 39, 1913–1926. [Google Scholar] [CrossRef]
- Fan, X.M.; Xu, Q.; van Westen, C.J.; Huang, R.Q.; Tang, R. Characteristics and classification of landslide dams associated with the 2008 Wenchuan earthquake. Geoenviron. Disasters 2017, 4, 12. [Google Scholar] [CrossRef] [Green Version]
- Guan, Y.B.; Yang, S.T.; Zhao, C.S.; Lou, H.Z.; Chen, K.; Zhang, C.B.; Wu, B.W. Monitoring long-term gully erosion and topographic thresholds in the marginal zone of the Chinese loess plateau. Soil Tillage Res. 2021, 205, 104800. [Google Scholar] [CrossRef]


| Factors | Classification | |
|---|---|---|
| Terrain | Elevation (m) | (1) <1500, (2) 1500–1700, (3) 1700–1900, (4) 1900–2100, (5) 2100–2300, (6) 2300–2500, (7) >2500. |
| Relief (m) | (1) <200, (2) 200–400, (3) 400–600, (4) 600–800, (5) 800–1000, (6) 1000–1200. | |
| Slope (°) | (1) <5, (2) 5–10, (3) 10–15, (4) 15–20, (5) 20–25, (6) 25–30, (7) 30–35, (8) 35–40, (9) 40–45, (10) 45–50, (11) >50. | |
| Aspect | (1) Flat, (2) N, (3) NE, (4) E, (5) SE, (6) S, (7) SW, (8) W, (9) NW. | |
| Distance to rivers (km) | (1) <1, (2) 1–2, (3) 2–3, (4) 3–4, (5) 4–5, (6) 5–6, (7) 6–7. | |
| Geology | Loess thickness (m) | (1) 0, (2) 0–50, (3) 50–100, (4) 100–150, (5) 150–200, (6) 200–250, (7) >250. |
| Strata | (1) Qh, (2) Qp, (3) N, (4) E, (5) Pre-E, (6) Magmatite. | |
| Seismic | Distance to HYF (km) | (1) <10, (2) 10–20, (3) 20–30, (4) 30–40, (5) 40–50, (6) 50–60, (7) 60–160. |
| Ranking | Damming Landslides | Non-Damming Landslides | All Landslides | |||
|---|---|---|---|---|---|---|
| 1. | Loess thickness | 0.007845 | Relief | 0.133636 | Relief | 0.131218 |
| 2. | Distance to fault | 0.004142 | Slope | 0.075333 | Distance to fault | 0.071287 |
| 3. | Slope | 0.002112 | Distance to fault | 0.072278 | Elevation | 0.069379 |
| 4. | Elevation | 0.002104 | Elevation | 0.071701 | Slope | 0.067805 |
| 5. | Relief | 0.002074 | Strata | 0.053099 | Strata | 0.049012 |
| 6. | Strata | 0.001515 | Loess thickness | 0.044867 | Loess thickness | 0.041564 |
| 7. | Distance to river | 0.000942 | Aspect | 0.027055 | Aspect | 0.02316 |
| 8. | Aspect | 0.000268 | Distance to river | 0.003304 | Distance to river | 0.00002 |
| Types [54] | Amount | Features | Ratio (%) |
|---|---|---|---|
| I | 22 | Landslide dams partially blocking the river | 41 |
| II | 17 | Landslide dams totally blocking the river | 31 |
| III | 5 | Landslide dams filling the valley from side to side, and with accumulated materials distributed both upstream and downstream of the release area | 9 |
| IV | 10 | Contemporary movement of two landslides detached from opposite sides of the same valley | 19 |
Publisher’s Note: MDPI stays neutral with regard to jurisdictional claims in published maps and institutional affiliations. |
© 2022 by the authors. Licensee MDPI, Basel, Switzerland. This article is an open access article distributed under the terms and conditions of the Creative Commons Attribution (CC BY) license (https://creativecommons.org/licenses/by/4.0/).
Share and Cite
Zhang, W.; Xu, Y.; Guo, X.; Li, W.; Du, P.; Tian, Q. Distribution and Characteristics of Damming Landslides Triggered by 1920 M~8 Haiyuan Earthquake, NW China. Remote Sens. 2022, 14, 2427. https://doi.org/10.3390/rs14102427
Zhang W, Xu Y, Guo X, Li W, Du P, Tian Q. Distribution and Characteristics of Damming Landslides Triggered by 1920 M~8 Haiyuan Earthquake, NW China. Remote Sensing. 2022; 14(10):2427. https://doi.org/10.3390/rs14102427
Chicago/Turabian StyleZhang, Weiheng, Yueren Xu, Xinyi Guo, Wenqiao Li, Peng Du, and Qinjian Tian. 2022. "Distribution and Characteristics of Damming Landslides Triggered by 1920 M~8 Haiyuan Earthquake, NW China" Remote Sensing 14, no. 10: 2427. https://doi.org/10.3390/rs14102427
APA StyleZhang, W., Xu, Y., Guo, X., Li, W., Du, P., & Tian, Q. (2022). Distribution and Characteristics of Damming Landslides Triggered by 1920 M~8 Haiyuan Earthquake, NW China. Remote Sensing, 14(10), 2427. https://doi.org/10.3390/rs14102427