Article

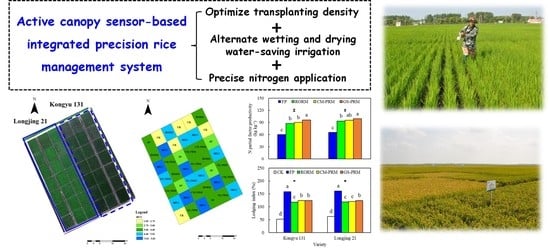
Developing an Active Canopy Sensor-Based Integrated Precision Rice Management System for Improving Grain Yield and Quality, Nitrogen Use Efficiency, and Lodging Resistance

1
Agro-Geoinformatics Research Center (ARC), School of Surveying and Land Information Engineering, Henan Polytechnic University, Jiaozuo 454000, China
2
Cultivated Land Quality Monitoring and Protection Center, Ministry of Agriculture and Rural Affairs, Beijing 100125, China
3
Precision Agriculture Center, Department of Soil, Water and Climate, University of Minnesota, St. Paul, MN 55108, USA
4
College of Agronomy, Heilongjiang Bayi Agricultural University, Daqing 163319, China
5
Qixing Farm, Jiansanjiang, Jiamusi 156300, China
6
National Engineering and Technology Center for Information Agriculture, Nanjing Agricultural University, Nanjing 210095, China
7
Center for Precision Agriculture, Norwegian Institute of Bioeconomy Research (NIBIO), Nylinna 226, 2849 Østre Toten, Norway
*
Author to whom correspondence should be addressed.
These authors contributed equally to this work.
Remote Sens. 2022, 14(10), 2440; https://doi.org/10.3390/rs14102440
Submission received: 10 April 2022 / Revised: 17 May 2022 / Accepted: 18 May 2022 / Published: 19 May 2022
(This article belongs to the Special Issue Proximal and Remote Sensing for Precision Crop Management)

Abstract

:
Active crop sensor-based precision nitrogen (N) management can significantly improve N use efficiency but generally does not increase crop yield. The objective of this research was to develop and evaluate an active canopy sensor-based precision rice management system in terms of grain yield and quality, N use efficiency, and lodging resistance as compared with farmer practice, regional optimum rice management system recommended by the extension service, and a chlorophyll meter-based precision rice management system. Two field experiments were conducted from 2011 to 2013 at Jiansanjiang Experiment Station of China Agricultural University in Heilongjiang, China, involving four rice management systems and two varieties (Kongyu 131 and Longjing 21). The results indicated that the canopy sensor-based precision rice management system significantly increased rice grain yield (by 9.4–13.5%) over the farmer practice while improving N use efficiency, grain quality, and lodging resistance. Compared with the already optimized regional optimum rice management system, in the cool weather year of 2011, the developed system decreased the N rate applied in Kongyu 131 by 12% and improved N use efficiency without inducing yield loss. In the warm weather year of 2013, the canopy sensor-based management system recommended an 8% higher N rate to be applied in Longjing 21 than the regional optimum rice management, which improved rice panicle number per unit area and eventually led to increased grain yield by over 10% and improved N use efficiency. More studies are needed to further test the developed active canopy sensor-based precision rice management system under more diverse on-farm conditions and further improve it using unmanned aerial vehicle or satellite remote sensing technologies for large-scale applications.

Graphical Abstract

1. Introduction

How to simultaneously increase crop yield and resource use efficiency to achieve food security and sustainable development is one of the most significant challenges of the 21st century [1,2]. Precision agriculture has been regarded as a promising approach to meet this challenge [3]. Currently, precision agriculture research is mainly focused on nutrient [4,5], water [6,7], pesticide [8,9], and tillage [10,11] management to improve resource use efficiency, often without significantly affecting crop yield. Therefore, precision agriculture must proceed from considering a single management practice into developing integrated precision crop management systems, contributing to spatially and temporally optimizing all the key factors that influence crop yield, quality, and profitability [12,13].
China produces 28% of the world’s rice (Oryza sativa L.) supply in about 19% of the global production area. However, rice production in China consumes about 36% of the total nitrogen (N) fertilizer used for rice production in the world [14]. To improve N use efficiency (NUE), scientists at the International Rice Research Institute have developed a chlorophyll meter-based site-specific N management strategy [15]. This strategy has been evaluated across China and was reported to decrease N application by 32% and increase yield by 5% compared with conventional farmer’s practice (FP). Field experiments conducted in the Sanjiang Plain of northeast China indicated that this strategy could increase rice N partial factor productivity (PFP) by 68% compared with FP [16]. However, the chlorophyll meter-based strategy is time-consuming for applications across large fields or areas [17]. To upscale this technology, several canopy sensor-based precision N management (PNM) strategies have been developed for rice. The GreenSeeker active canopy sensor (Trimble Navigation Limited, Sunnyvale, CA, USA) has been used in PNM of wheat (Triticum aestivum L.) [18,19,20,21], maize (Zea mays L.) [22,23,24], and rice [5,16,25]. This sensor is equipped with an artificial light source allowing for flexible usage not limited by the solar illumination or the time of the day when it can be used [26]. Yao et al. (2012) developed a GreenSeeker sensor-based PNM strategy for rice in northeast China, with a regional optimum N rate (RONR) recommended by the extension service in the region as an initial rough estimate of total N rate, and applied 45% as basal N fertilizer before transplanting, and 20% at the tillering stage [16]. Then, the GreenSeeker sensor was used to estimate topdressing N rate at the stem elongation stage. This strategy increased N PFP by 48% but did not significantly impact grain yield compared with FP. Xue et al. (2014) developed a GreenSeeker sensor-based PNM strategy for rice, called the spectrally determined N topdressing model. This strategy could make topdressing N recommendations for both tillering and panicle initiation stages, with 19.5% and 6.3% N agronomic efficiency (AE) and 27.5% and 9.4% N recovery efficiency (RE) increases at low and high planting density, respectively, compared with FP [25]. The grain yield, however, was not significantly affected there as well. Bijay-Singh et al. (2015) developed a similar GreenSeeker-based PNM strategy for rice in India [27]. Compared with FP, this strategy increased NUE but again resulted in a similar yield [27].
To increase rice yield, NUE, and reduce lodging risks simultaneously, integrated precision crop management systems need to be developed [28,29,30,31]. Cao and Yin (2015) developed an integrated rice management system including low sowing rate, increased transplanting density, alternate wetting and drying irrigation, low N fertilizer rate (225 kg N ha−1), and high fertilizer application frequency (four splits) [28]. This integrated management system increased grain yield and NUE by 14% and 51–57%, with a 25% N application rate decrease and 52% ammonia volatilization reduction compared with FP [28]. Zhang et al. (2010) optimized transplanting density and nutrient management to reduce lodging resistance of rice in northeast China [32]. Compared with FP, their integrated management system significantly increased grain yield by 24% and decreased 1–2 internode length of the basal stem and lodging index by 6% and 9%, respectively [32]. However, the abovementioned rice management systems used fixed N application rate, split ratio, and timing. Since the optimum N rates can vary from year to year and from field to field [29,33], it would be more desirable to develop an integrated precision rice management (PRM) system to better match N supply with crop N demand in space and time. Xue et al. (2013) combined chlorophyll sensor-based management practice and an alternate wetting and drying irrigation method for rice management, increasing rice grain yield and NUE by 14% and 64%, respectively [34]. Zhao et al. (2013) combined chlorophyll sensor-based N management with co-optimizing transplanting density, nutrient management, and water management [35]. The results of small plot experiment indicated that this PRM system increased rice yield by 10% and NUE by 51–97% over FP [35]. The results of the on-farm demonstration indicated that this system increased grain production and NUE over FP by 16% and 27%, respectively [35].
In order to facilitate more practical on-farm applications, it is important to develop an integrated PRM system by replacing the chlorophyll meter with active canopy sensing technologies. However, to date, little has been reported on developing and evaluating active canopy sensor-based PRM systems for grain yield, quality, NUE, and lodging resistance. Therefore, the objective of this research was to develop a PRM system by integrating active canopy sensor-based PNM into a high-yield rice management system and evaluate it in terms of grain yield and quality, NUE, and lodging resistance in comparison with FP, regional optimum rice management (RORM), and a chlorophyll meter-based PRM system (CM_PRM) in northeast China.

2. Materials and Methods
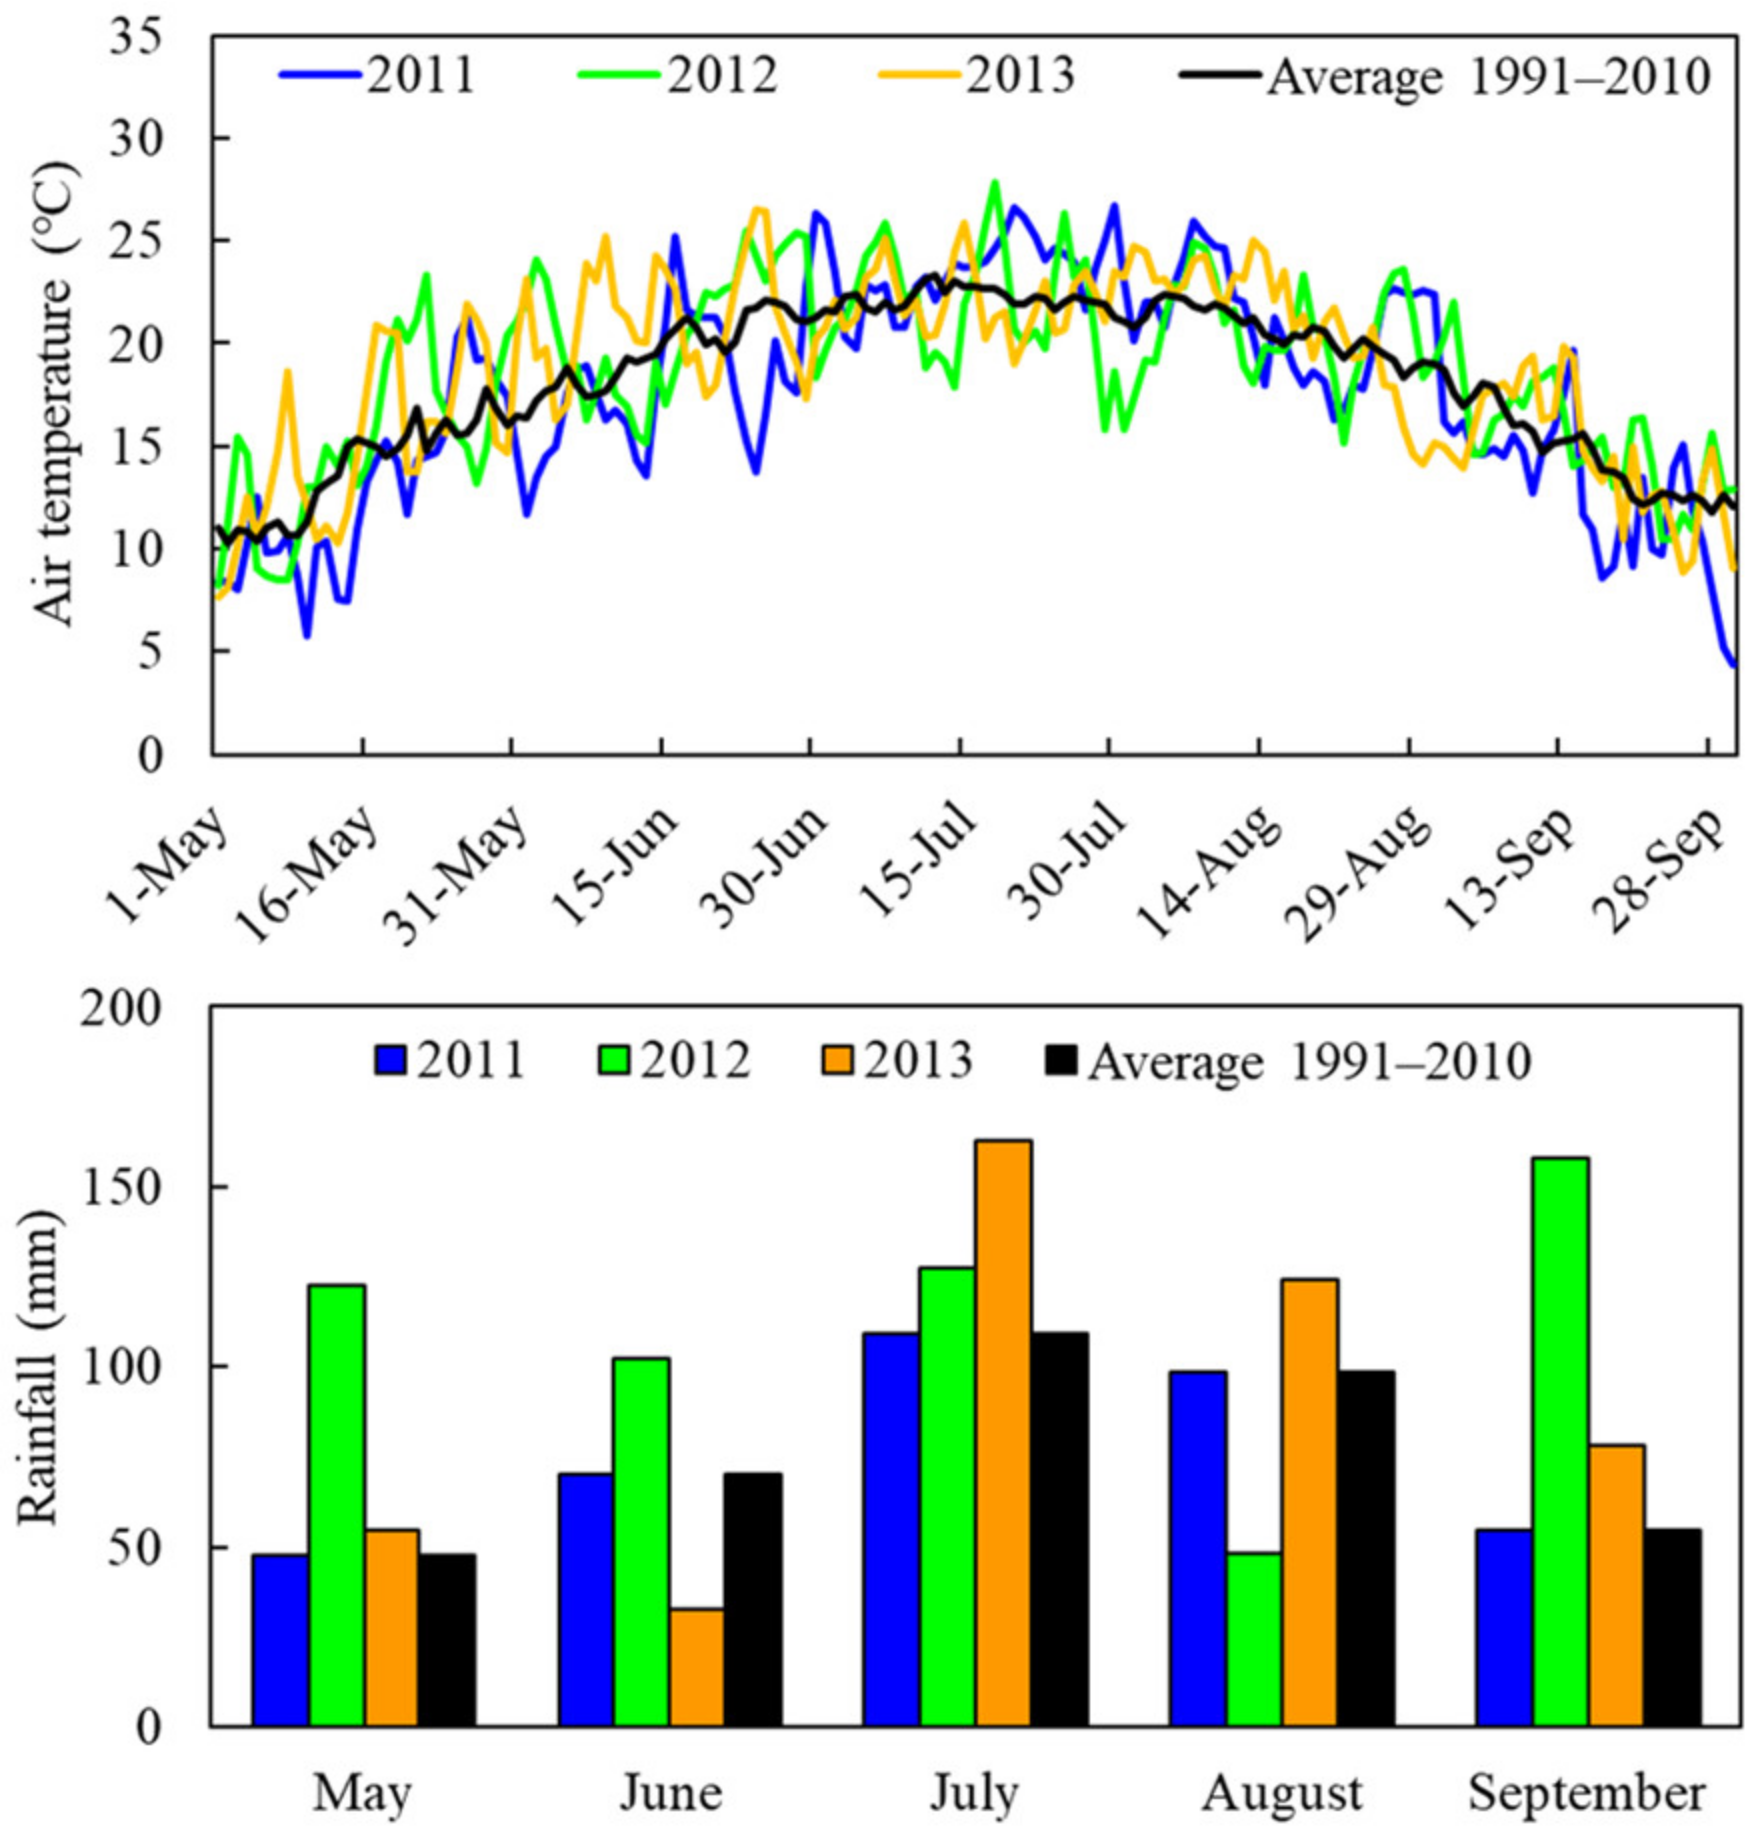
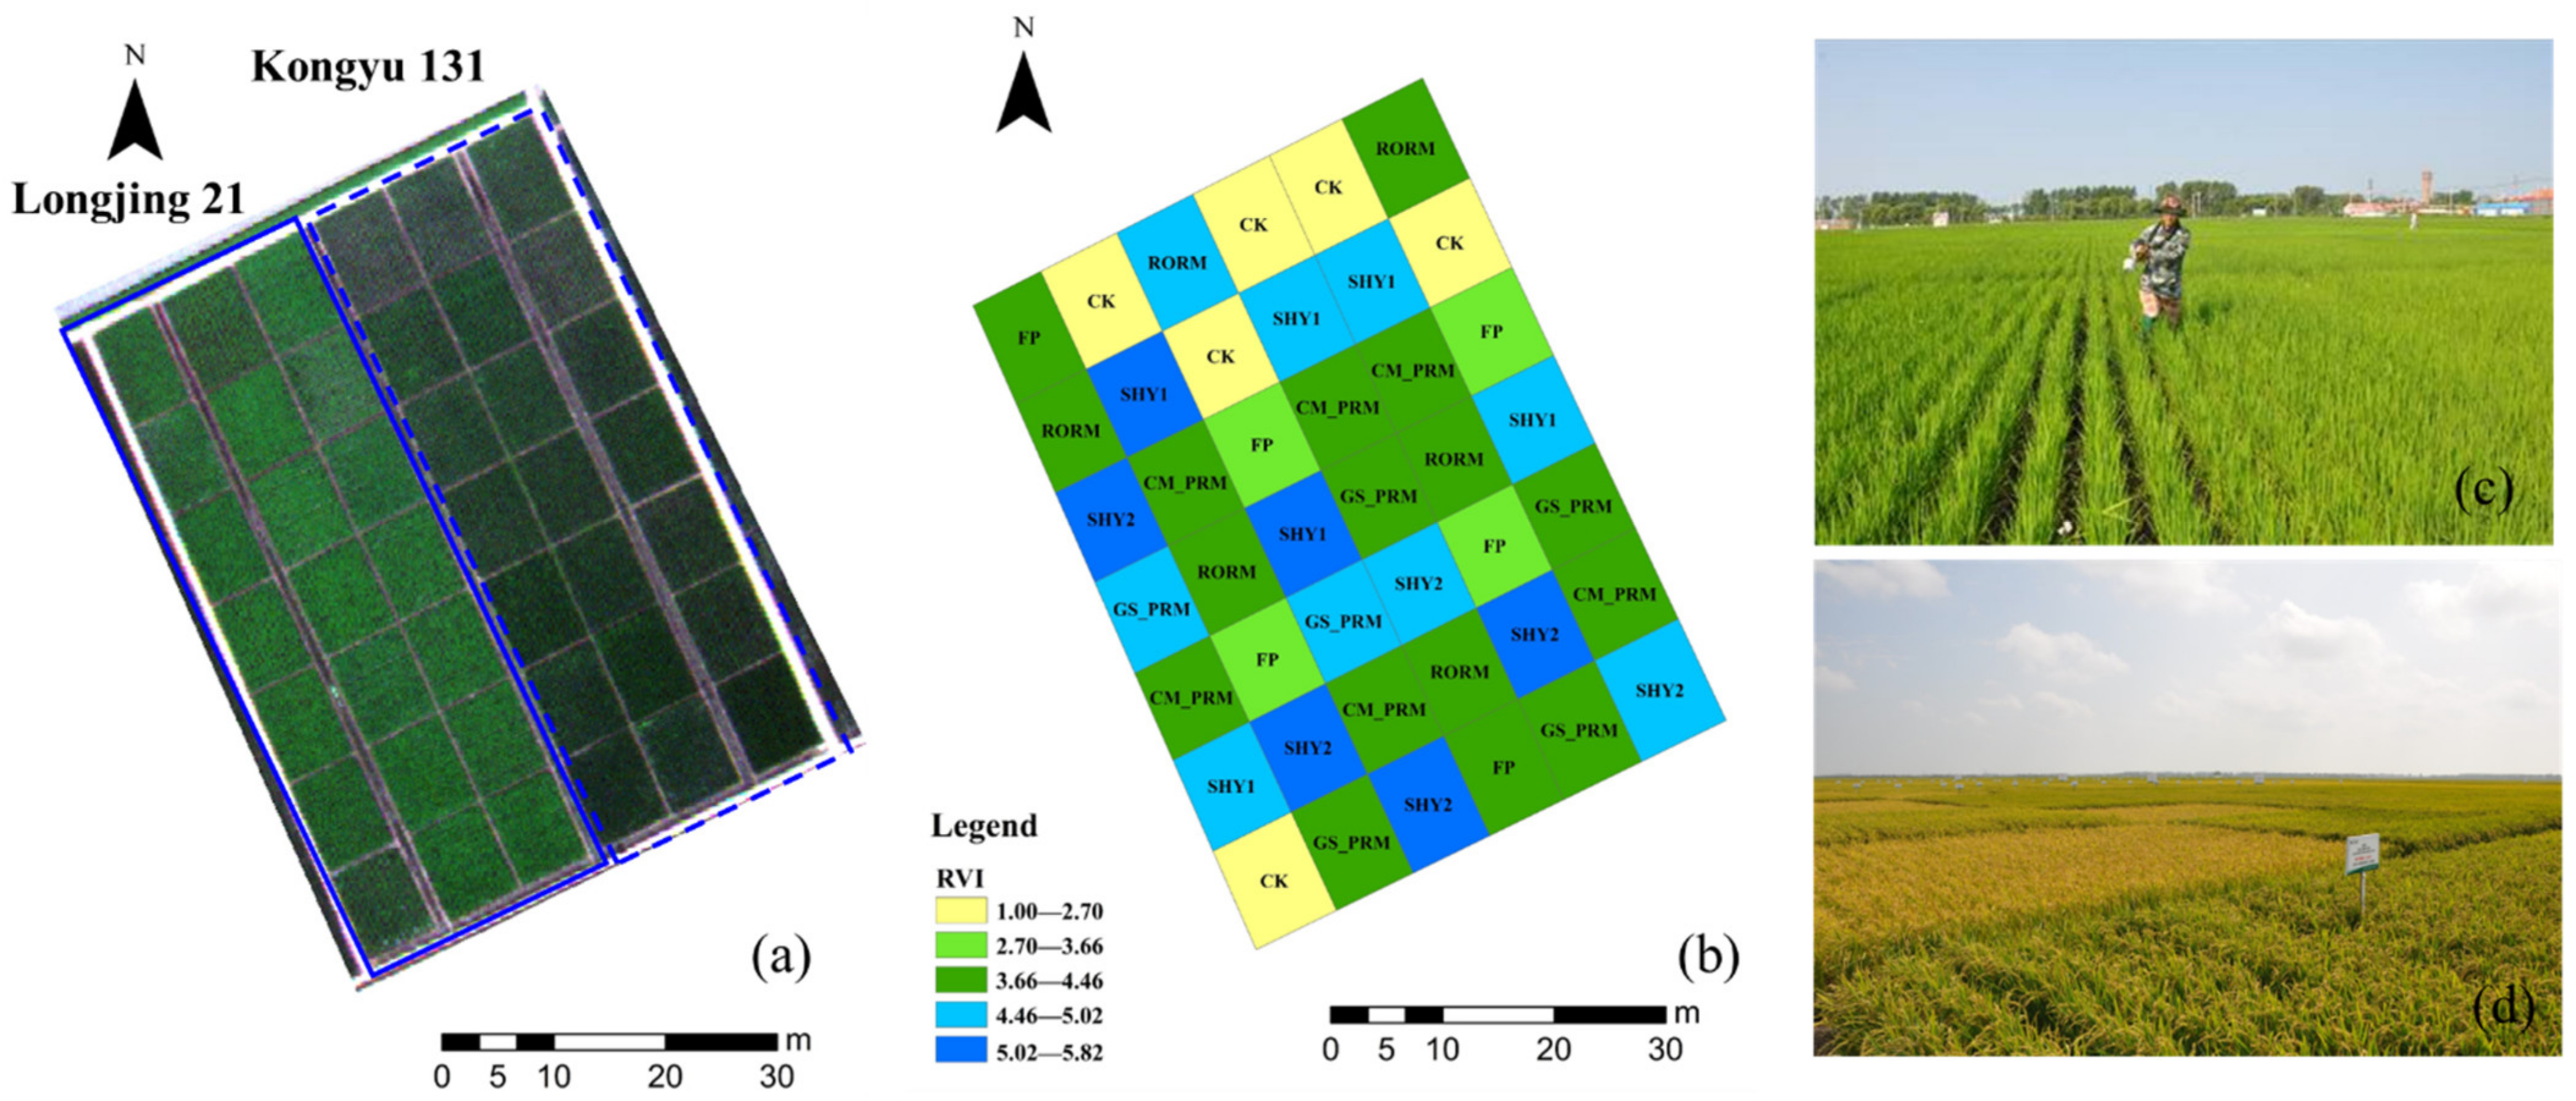
2.1. Study Site

The study site was located in Jiansanjiang on the Sanjiang Plain (47.2°N, 132.8°E) in the northeast part of Heilongjiang Province, northeast China. Two experiments located closely together on the same soil were conducted each season from 2011 to 2013 at Jiansanjiang Experiment Station of China Agricultural University (47°13′58.46″N, 132°38′47.91″E). This research field has been under rice production for more than ten years. The soil type is Albic soil (classified as Mollic Planosols in the FAO–UNESCO system). Organic matter content, pH, total N, Olsen-phosphorus, and available potassium contents of the soil in 0–20 cm measured before rice production in 2011 were 40.5 g kg−1, 6.58, 1.59 g kg−1, 46 mg kg−1, and 192 mg kg−1, respectively.
This area belongs to a cool-temperate sub-humid continental monsoon climate [35]. The main growth period of rice is from May to September. The interannual variation of accumulated temperature and rainfall is significant (Figure 1). The accumulated temperature (≥10 °C) from transplanting to harvest in the experimental period (2011–2013) was 2577 °C, 2820 °C, and 2835 °C. The total rainfall from May to September was 352 mm, 559 mm, and 453 mm in 2011, 2012, and 2013, respectively. The 20-year normal (1991–2010) for these two parameters are 2785 °C and 380 mm, respectively. The distribution of rainfall also varied in these three years. About 60–70% of the total was concentrated from July to September, except for 81% in 2013, which far exceeded the average across 1991 and 2010 (69%). Compared with the 20-year average, 2011, 2012, and 2013 were considered as cool, wet, and warm and late wet weather years, respectively.

2.2. Experimental Design

Two farming system trials were conducted in this study each year in 2011, 2012, and 2013, which could better explain the performance of the complex agricultural systems compared to factorial experiments [36]. One trial used an 11-leaf variety, Kongyu 131 (with maturity days of 127), and the other trial used a 12-leaf variety, Longjing 21 (with maturity days of 133). Each trial was replicated three times (three columns from north to south) and included seven treatments, for a total of 21 rice plots (Figure 2a). Randomized complete block design was used in each of the trials. This study focused on comparing the differences among five treatments including the check, FP, RORM, CM_PRM, and GreenSeeker sensor-based precision rice management (GS_PRM). Two other treatments explored high-yield systems and were not the focus of the current study, therefore, related data are not reported in this paper.
The details of the five treatments are explained below.
(1)
Check (CK). No N fertilizer was applied. Transplanting density was 24 hills m−2 for both varieties, with 4 plants hill−1 and 30 cm × 14 cm for row and hill spacing. Water management was carried out with traditional flood irrigation. Rice was continuously irrigated under flooded conditions.
(2)
Farmer practice (FP). An excessive farmer’s N application rate is an issue, especially in earlier growth stages, resulting in low NUE. According to a local farmer survey and Zhao et al. (2013) [35], 150 kg N ha−1 as total N rate was used in this treatment, split into 40% applied before planting and 60% at the tillering stage. Transplanting densities and water management were the same as check.
(3)
Regional optimum rice management (RORM). The RONR of 110 kg N ha−1 was used as the total N rate, which was applied as 5 splits (basal, tillering, panicle initiation, stem elongation, and heading stage). Transplanting density was increased to 30 cm × 10 cm (30 hills m−2 with 4 plants hill−1) for Kongyu 131, and 30 cm × 12 cm (27 hills m−2 with 6 plants hill−1) for Longjing 21. In addition, the alternate wetting and drying water-saving irrigation management was adopted as reported in [35].
(4)
Chlorophyll meter-based precision rice management (CM_PRM). N fertilizer applied 5 times, similar to RORM, but the second and third topdressing N rates were adjusted by chlorophyll meter-based diagnosis of the rice N status as described by [35]. If the chlorophyll meter reading of the top 2 fully expanded leaves was between 38 and 40, rice N status was optimal. When the meter reading was over 40 or below 38, in-season adjustments of −10 kg N ha−1 or +10 kg N ha−1 were applied based on 15 kg N ha−1 and 20 kg N ha−1 normal rates at the panicle initiation and stem elongation stages, respectively. The remaining nutrient management, transplanting densities, and water management were the same as RORM.
(5)
GreenSeeker sensor-based precision rice management (GS_PRM). Transplanting densities and water management were the same as in RORM and CM_PRM. N fertilizer was applied 4 times. The first three applications were the same as RORM. The fourth application at the stem elongation stage was recommended using GreenSeeker sensor based on the algorithm developed by [16]. In this algorithm, the yield potential with no topdressing N rate (YP0) was estimated using in-season estimate of yield (INSEY) calculated with RVI divided by number of days with growing degree days > 0 from transplanting to sensing. The N response index of harvested yield (RIHarvest) was estimated using RVI of the treatment with sufficient N (from the FP plots) divided by the RVI of the GS_PRM treatment at the stem elongation stage. The yield potential with sufficient topdressing N application (YPN) was estimated as the product of RIHarvest and YP0. The N topdressing rate was estimated as the yield increase (YPN-YP0) divided by the average agronomic N efficiency (26.79 kg kg−1) [16].
Rice seedlings were prepared in a greenhouse in the spring and transplanted when rice had 3~4 leaves in mid-May. Phosphorus fertilizer in the form of Ca(H2PO4)2 was incorporated into the soil before transplanting. Potassium fertilizer (K2SO4) was split into 2 doses: 50% as a basal application before transplanting, and 50% was applied at the stem elongation stage. The N, P, and K application rates for different treatments are listed in Table A1.
By estimating soil water potential using a tensiometer (a sensor of 5 cm length, developed by the Institute of Soil Sciences, Chinese Academy of Sciences), traditional flood irrigation and alternate wetting and drying water-saving irrigation were conducted after transplanting. When the sensor reading was lower than the reference value, supplementary irrigation was added [35].

2.3. Plant Sampling and Measurements

The plot size in the experiments was approximately 7 m × 8 m (56 m2). The Konica SPAD 502 chlorophyll meter (Minolta, Inc., Tokyo, Japan) was used to measure relative chlorophyll concentration in the top 2 fully expanded leaves of 15 plants randomly selected in each plot before the second and third topdressing N application according to the method by [35]. The average value was used to represent a given plot. The GreenSeeker hand-held active canopy reflectance sensor was used in this research to measure canopy reflectance. It features red and near-infrared bands and artificial light sources, making the sensor’s measurements independent of the environmental light conditions. The device uses the embedded software to directly calculate the normalized difference vegetation index (NDVI) and RVI. It generates sensor readings at a rate of 10 readings per second. Sensor measurements were performed 0.5–0.7 m above the rice canopy across each plot, excluding the plants near the plot boundaries. The sensor was carried and walked at a consistent speed and sensor readings were collected from four different rows in the middle of each plot (Figure 2c). The collected index values (NDVI and RVI) were averaged to represent each plot and Figure 2b shows an example of the average RVI values in each plot at stem elongation stage in 2013.
At panicle initiation, heading, and maturity stages, 6 hills (panicle initiation) or 3 hills (heading and maturity) for each plot were randomly selected to account for aboveground biomass. After cleaning with water, all roots were removed. The aboveground biomass samples were oven-dried for 30 min at 105 °C and then at 70 °C until constant weight and then weighed. They were later ground to pass through a 0.5 mm sieve. Plant N concentration was determined using the Kjeldahl-N method. Plant N accumulation was calculated by multiplying aboveground biomass and plant N concentration.
Lodging-related parameters were measured 30 days after rice flowering according to the method by [37]. The 10 largest tillers from 3 hills with an average number of tillers in each plot were randomly selected to measure lodging parameters. After removing all roots of plant samples, the fresh weight per plant, plant height (the length between the base and the panicle tip), internode number, and the lengths of the first (N1), second (N2), third (N3), and fourth (N4) internodes from the top of rice were measured. Because the lower internodes of rice are closely related to stem lodging [38], the breaking strength of N4 internodes and lodging index were measured in this study. The breaking strength was measured using Prostrate Tester Model YYD-1 (Zhejiang Top Cloud-Agri Technology Co., Ltd., Hangzhou, China). The distance (L) between the fulcra of the instrument was set at 5 cm. It was calculated using Equation (1) [39]:
Breaking strength (g cm) = breaking load (kg) × L/4 (cm) × 1000.
The lodging index is often used to evaluate lodging risk [24,32,39,40] and select varieties resistant to lodging [37,41]. The lodging index was calculated using Equation (2) [39]:
Lodging index (%) = stem length (cm) × fresh weight from the breaking
point to the panicle tip (g)/breaking strength × 100.
Rice was harvested at the end of September. At maturity, three 1 m2 areas were randomly identified in each plot and dissected for grain yield determination. Harvest index was calculated as dry grain yield divided by total dry aboveground biomass. The NUE indicators including RE, AE, and PFP were calculated using the following Equations (3)–(5):
RE (%) = (N accumulation − N accumulation at check)/N rate × 100.
AE (kg kg−1) = (Grain yield − Grain yield at check)/N rate.
PFP (kg kg−1) = grain yield/N rate.
After harvest, rice grain quality traits, including brown rice rate, head rice rate, milled rice rate, chalky kernel percentage, chalkiness degree, amylose content, and protein content were measured and evaluated. Five hundred grams of grains from each plot were kept at room temperature for three months to ensure stable grain quality before processing for grain quality analysis [42,43]. Consistent with [43], grain milling and appearance quality analysis methods in this study followed China’s National Standards (GB/T1789-1999 1999). Grain samples of 120 g were taken from each plot, dehulled with a roller sheller to produce brown rice, and polished for milled rice. The milling quality traits included brown rice rate, milled rice rate, and head rice rate, expressed as the percentage of total rice grains. The appearance quality traits included chalky kernel percentage and chalkiness degree. Grains containing 20% or more of white belly, white center, and white back or a combination of these were considered chalky rice. The nutritional quality traits, including grain amylose content and protein content, were analyzed according to the method reported by [42].

2.4. Statistical Analysis

Two-way analysis of variance (ANOVA) was conducted on the data using the SAS version 9.0 software package (SAS Institute, Cary, NC, USA) to test for significant differences among treatments and years. Mean values of aboveground biomass, plant nitrogen accumulation, grain yield, and yield components, NUE, grain quality, and lodging resistance were compared among treatments and years at the 0.05 probability level using the least significant difference (LSD) test (p < 0.05). Graphs were prepared using Microsoft Excel 2016 (Microsoft Cooperation, Redmond, WA, USA).

3. Results

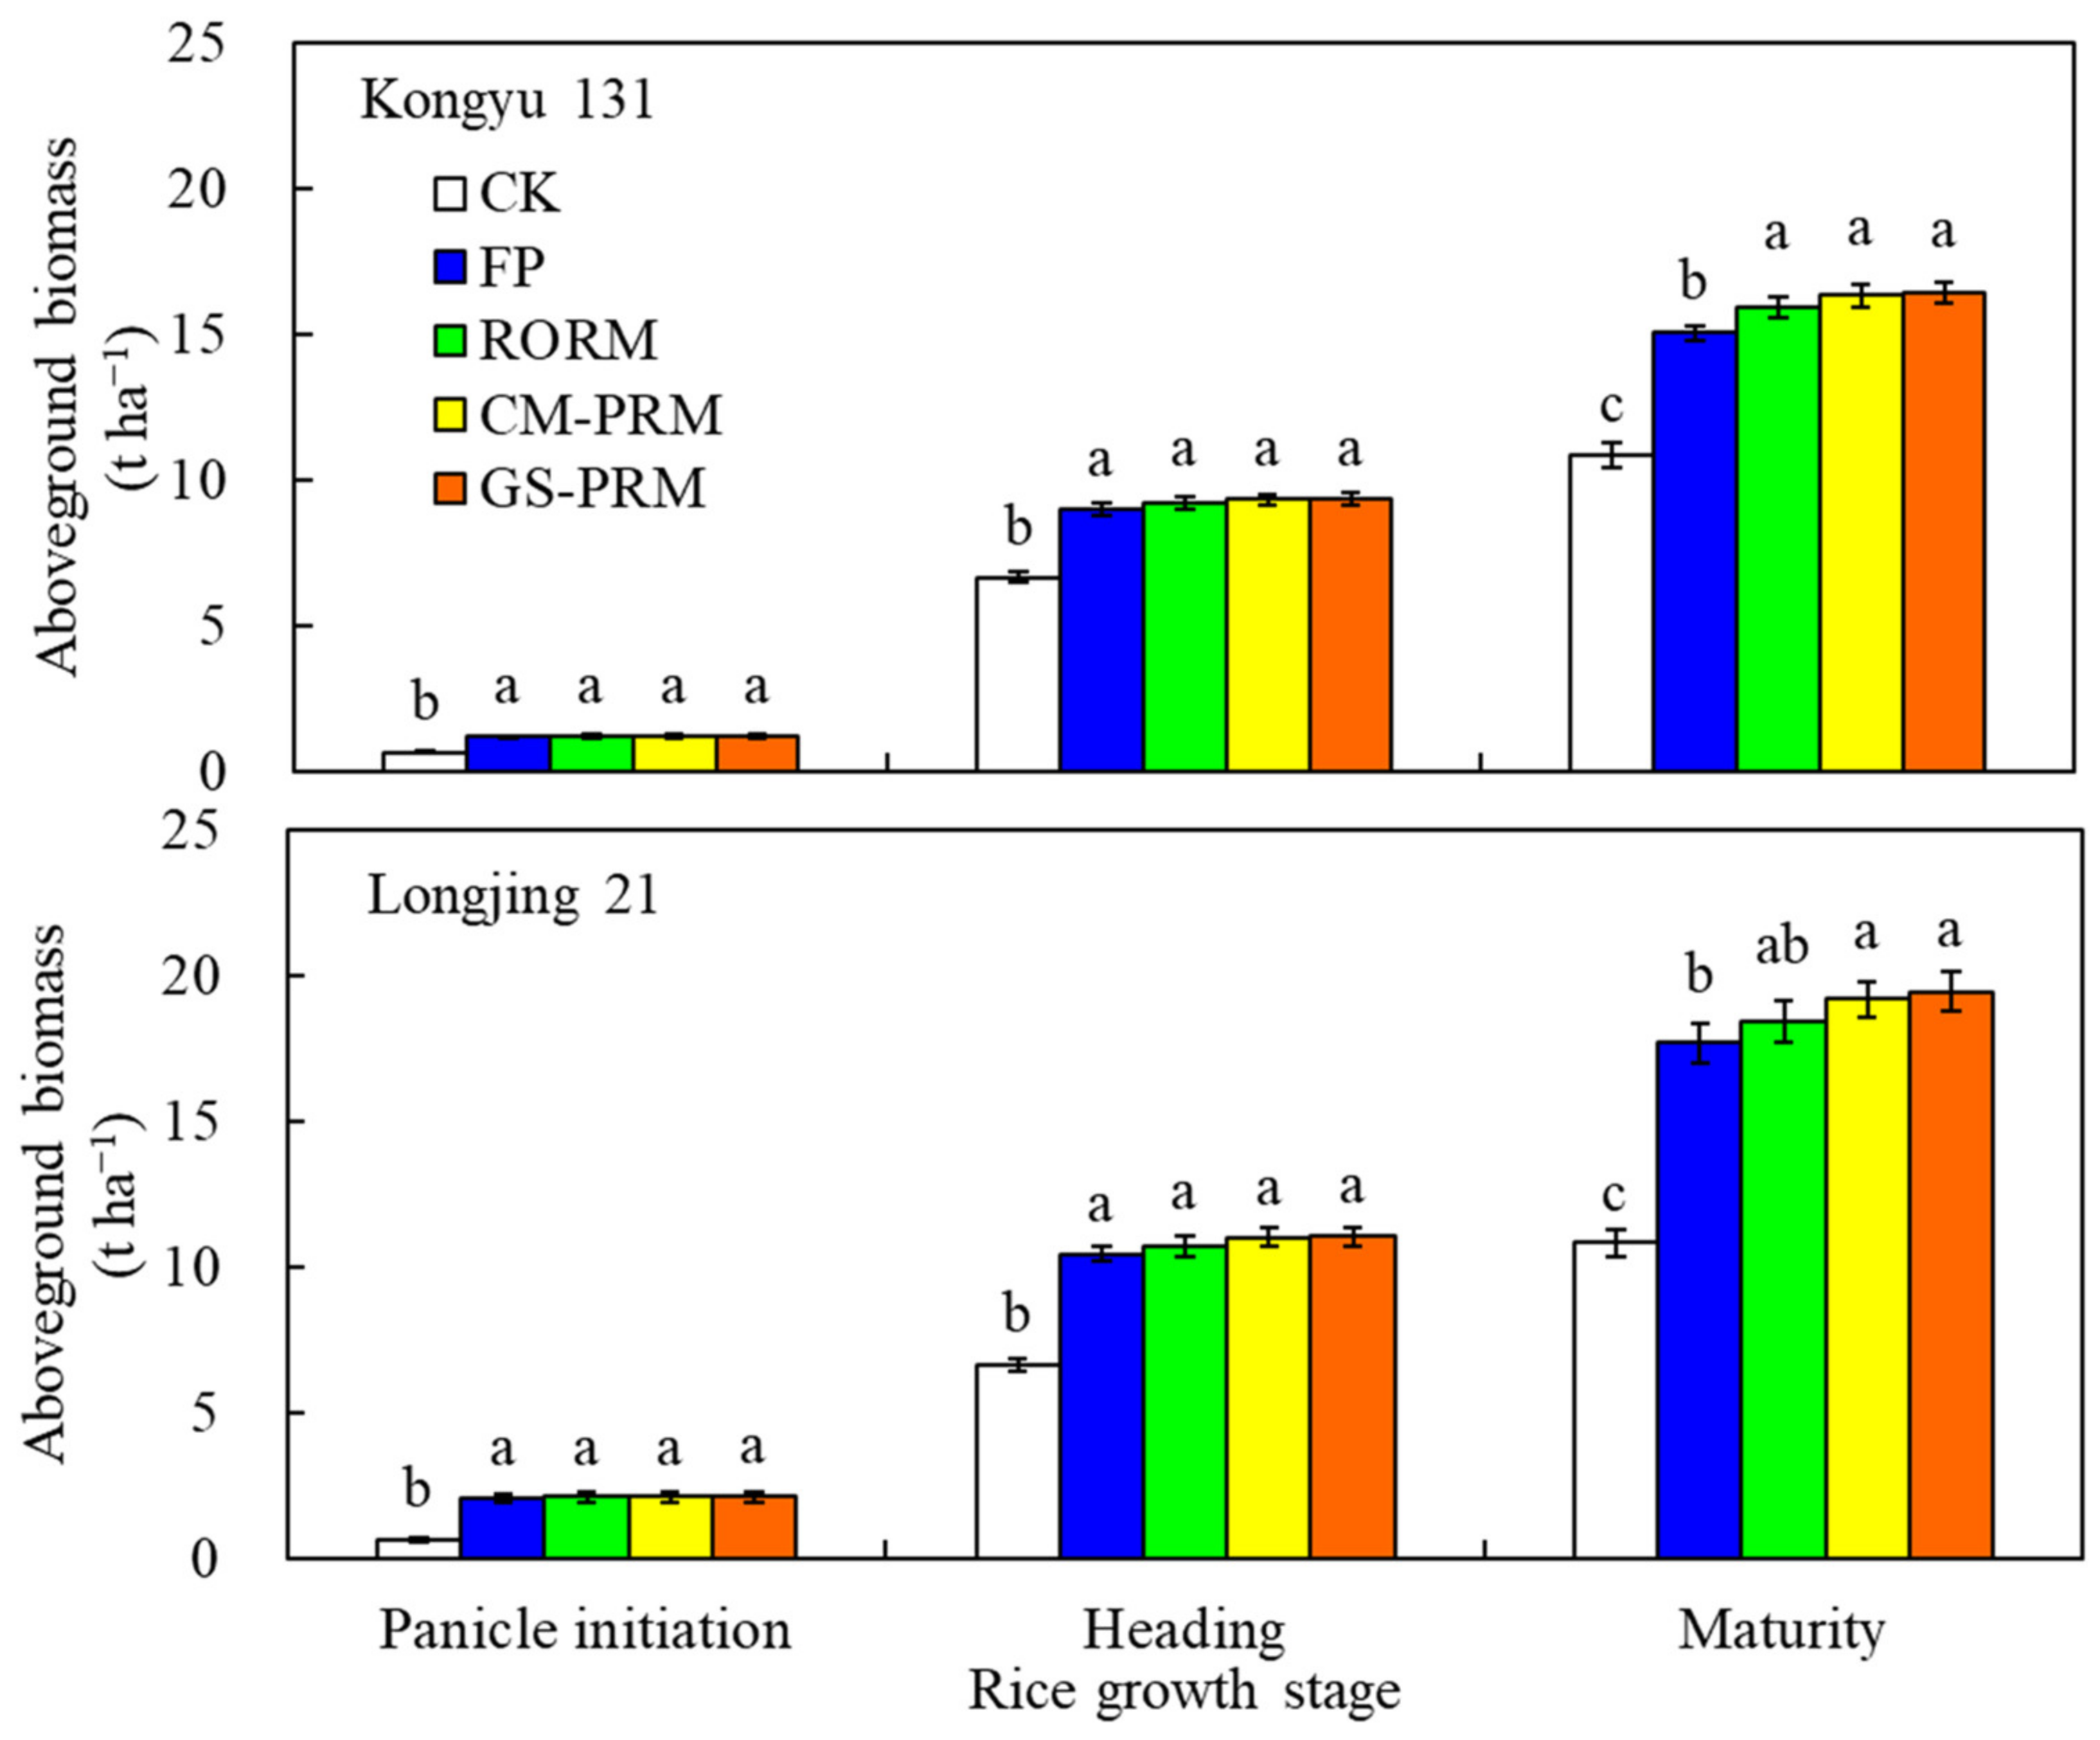
3.1. Aboveground Biomass and Plant Nitrogen Accumulation

The aboveground biomass (dry matter) analyzed across three years was significantly affected by different management systems. The two rice varieties were similarly affected by the tested systems (Figure 3). At the panicle initiation stage and the heading stage, the tested rice management systems did not lead to significant differences, except for the check which produced the lowest aboveground biomass. However, at maturity, the aboveground biomass was highest with CM_PRM and GS_PRM systems, 9% and 8–10% higher than the biomass of Kongyu 131 and Longjing 21 in the FP, respectively. The RORM system produced a similar amount of aboveground biomass as the CM_PRM and GS_PRM systems. It was 6% higher than Kongyu 131 at FP.
The average plant N accumulation across the three years was significantly affected by different management systems (Figure 4). At the panicle initiation stage, plant N accumulation in the FP was the highest across years and varieties with no significant differences between the three integrated rice management systems. At the heading and maturity stages, there was no significant difference between FP and three integrated rice management systems for Kongyu 131. The GS_PRM and CM_PRM systems performed similarly in production of Longjing 21, being 10–12% and 10% better than FP at the heading and maturity stages, respectively.

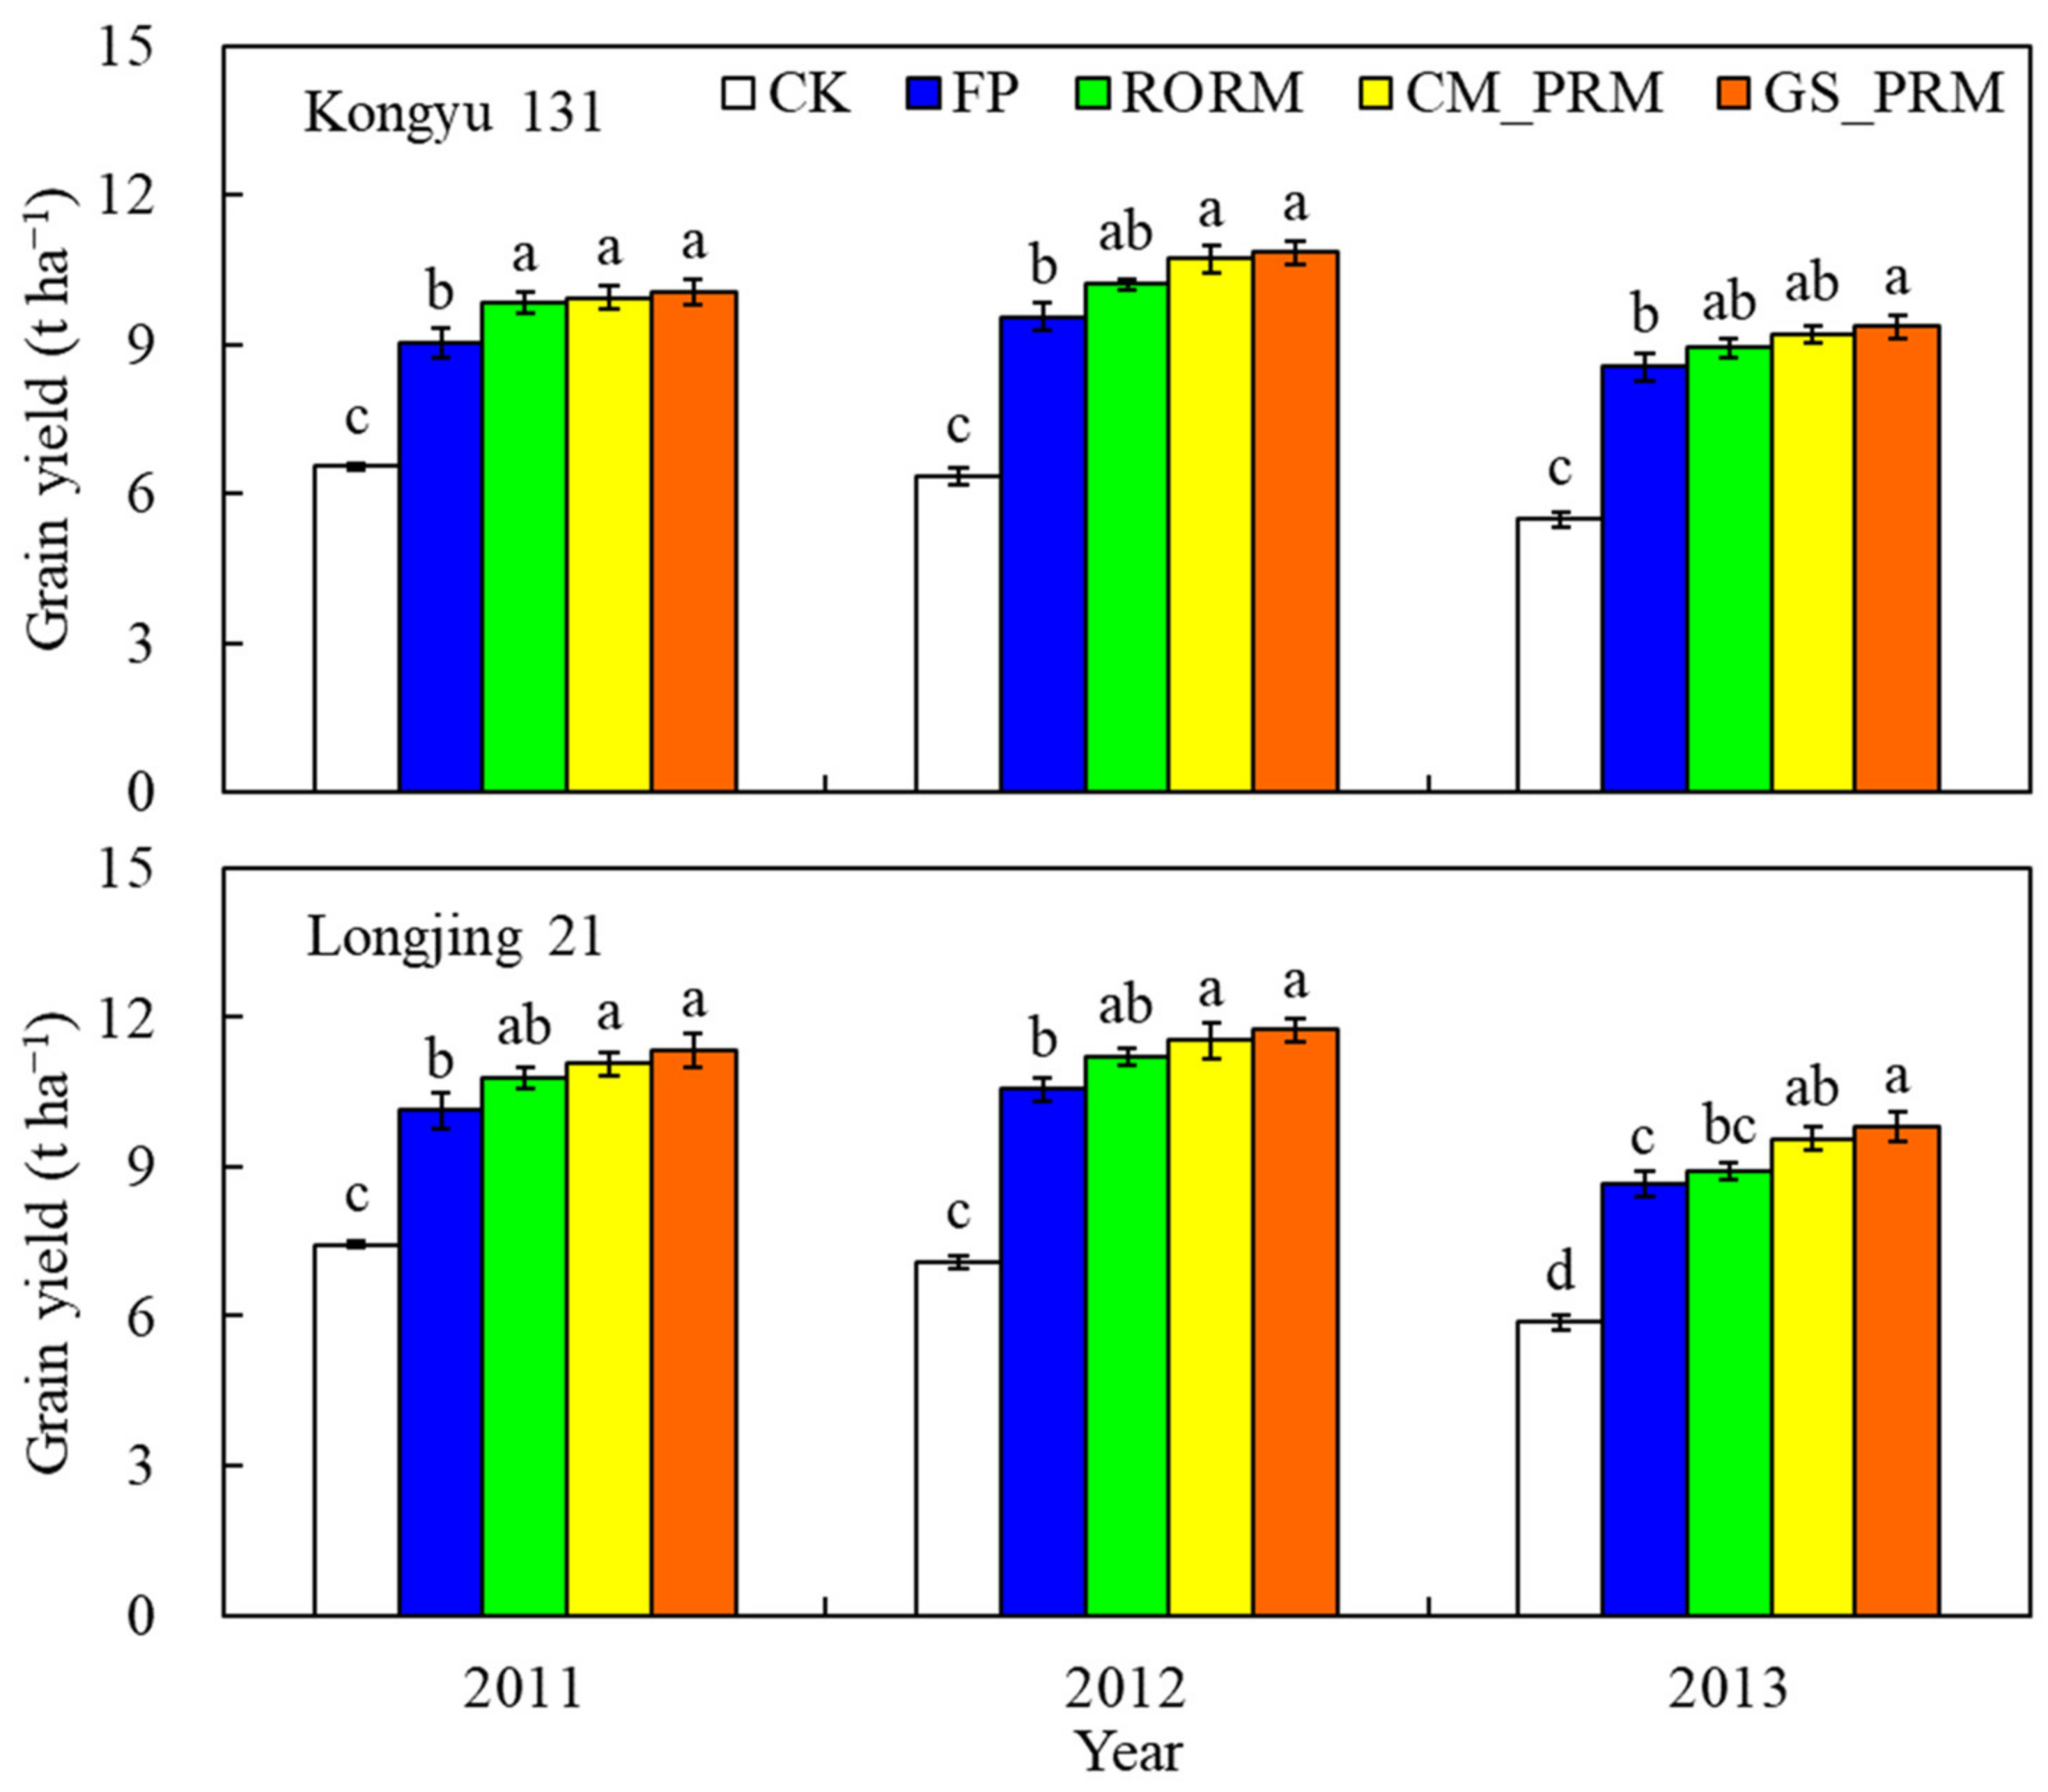
3.2. Grain Yield and Yield Components

Rice yield was significantly influenced by the tested rice management systems, and the two varieties shared the same trend (Figure 5). The GS_PRM system consistently produced the highest yield from 2011 to 2013, with 10.0 t ha−1, 10.8 t ha−1, 9.3 t ha−1 for Kongyu 131, and 11.3 t ha−1, 11.7 t ha−1, 9.8 t ha−1 for Longjing 21. Compared to the FP, the GS_PRM system increased grain yield 9.4–13.5% and 11.3–13.3% for Kongyu 131 and Longjing 21, respectively. The CM_PRM or RORM system produced 8.9–10.7 t ha−1 for Kongyu 131 and 9.6–11.5 t ha−1 for Longjing 21, similarly to the GS_PRM system across the three years. In 2013, the GS_PRM system produced 10.1% higher yield over the RORM system for Longjing 21. The yield in the check treatment across years was the lowest for Kongyu 131 (5.5–6.5 t ha−1) and Longjing 21 (5.9–7.4 t ha−1).
According to the results of Table 1 and Table 2, all grain yield components except harvest index were significantly affected by treatments. In addition, grains per panicle, filled grains, and 1000-grain weight were affected by year or the interaction of treatment and year. The GS_PRM system produced the highest number of panicles per unit area. This system gave 10.5–13.1% and 9.8–14.2% more panicles in Kongyu 131 and Longjing 21, respectively, than FP in the three years. In 2013, the GS_PRM system tested in Longjing 21 produced 7.5% more panicles than the RORM system. In addition, CM_PRM and RORM performed similarly to GS_PRM for other yield components across years and varieties. Regarding grains per panicle, the three integrated rice management systems all yielded more than the FP in 2013 in Kongyu 131. Apart from that, no difference was found in other years or varieties. In the RORM system, the filled grains and 1000-grain weight were significantly higher than in FP in a specific year or variety (except check). Regardless of the year or varieties, the check treatment produced the lowest number of panicles per unit area and grains per panicle but had the highest filled grains and 1000-grain weight.

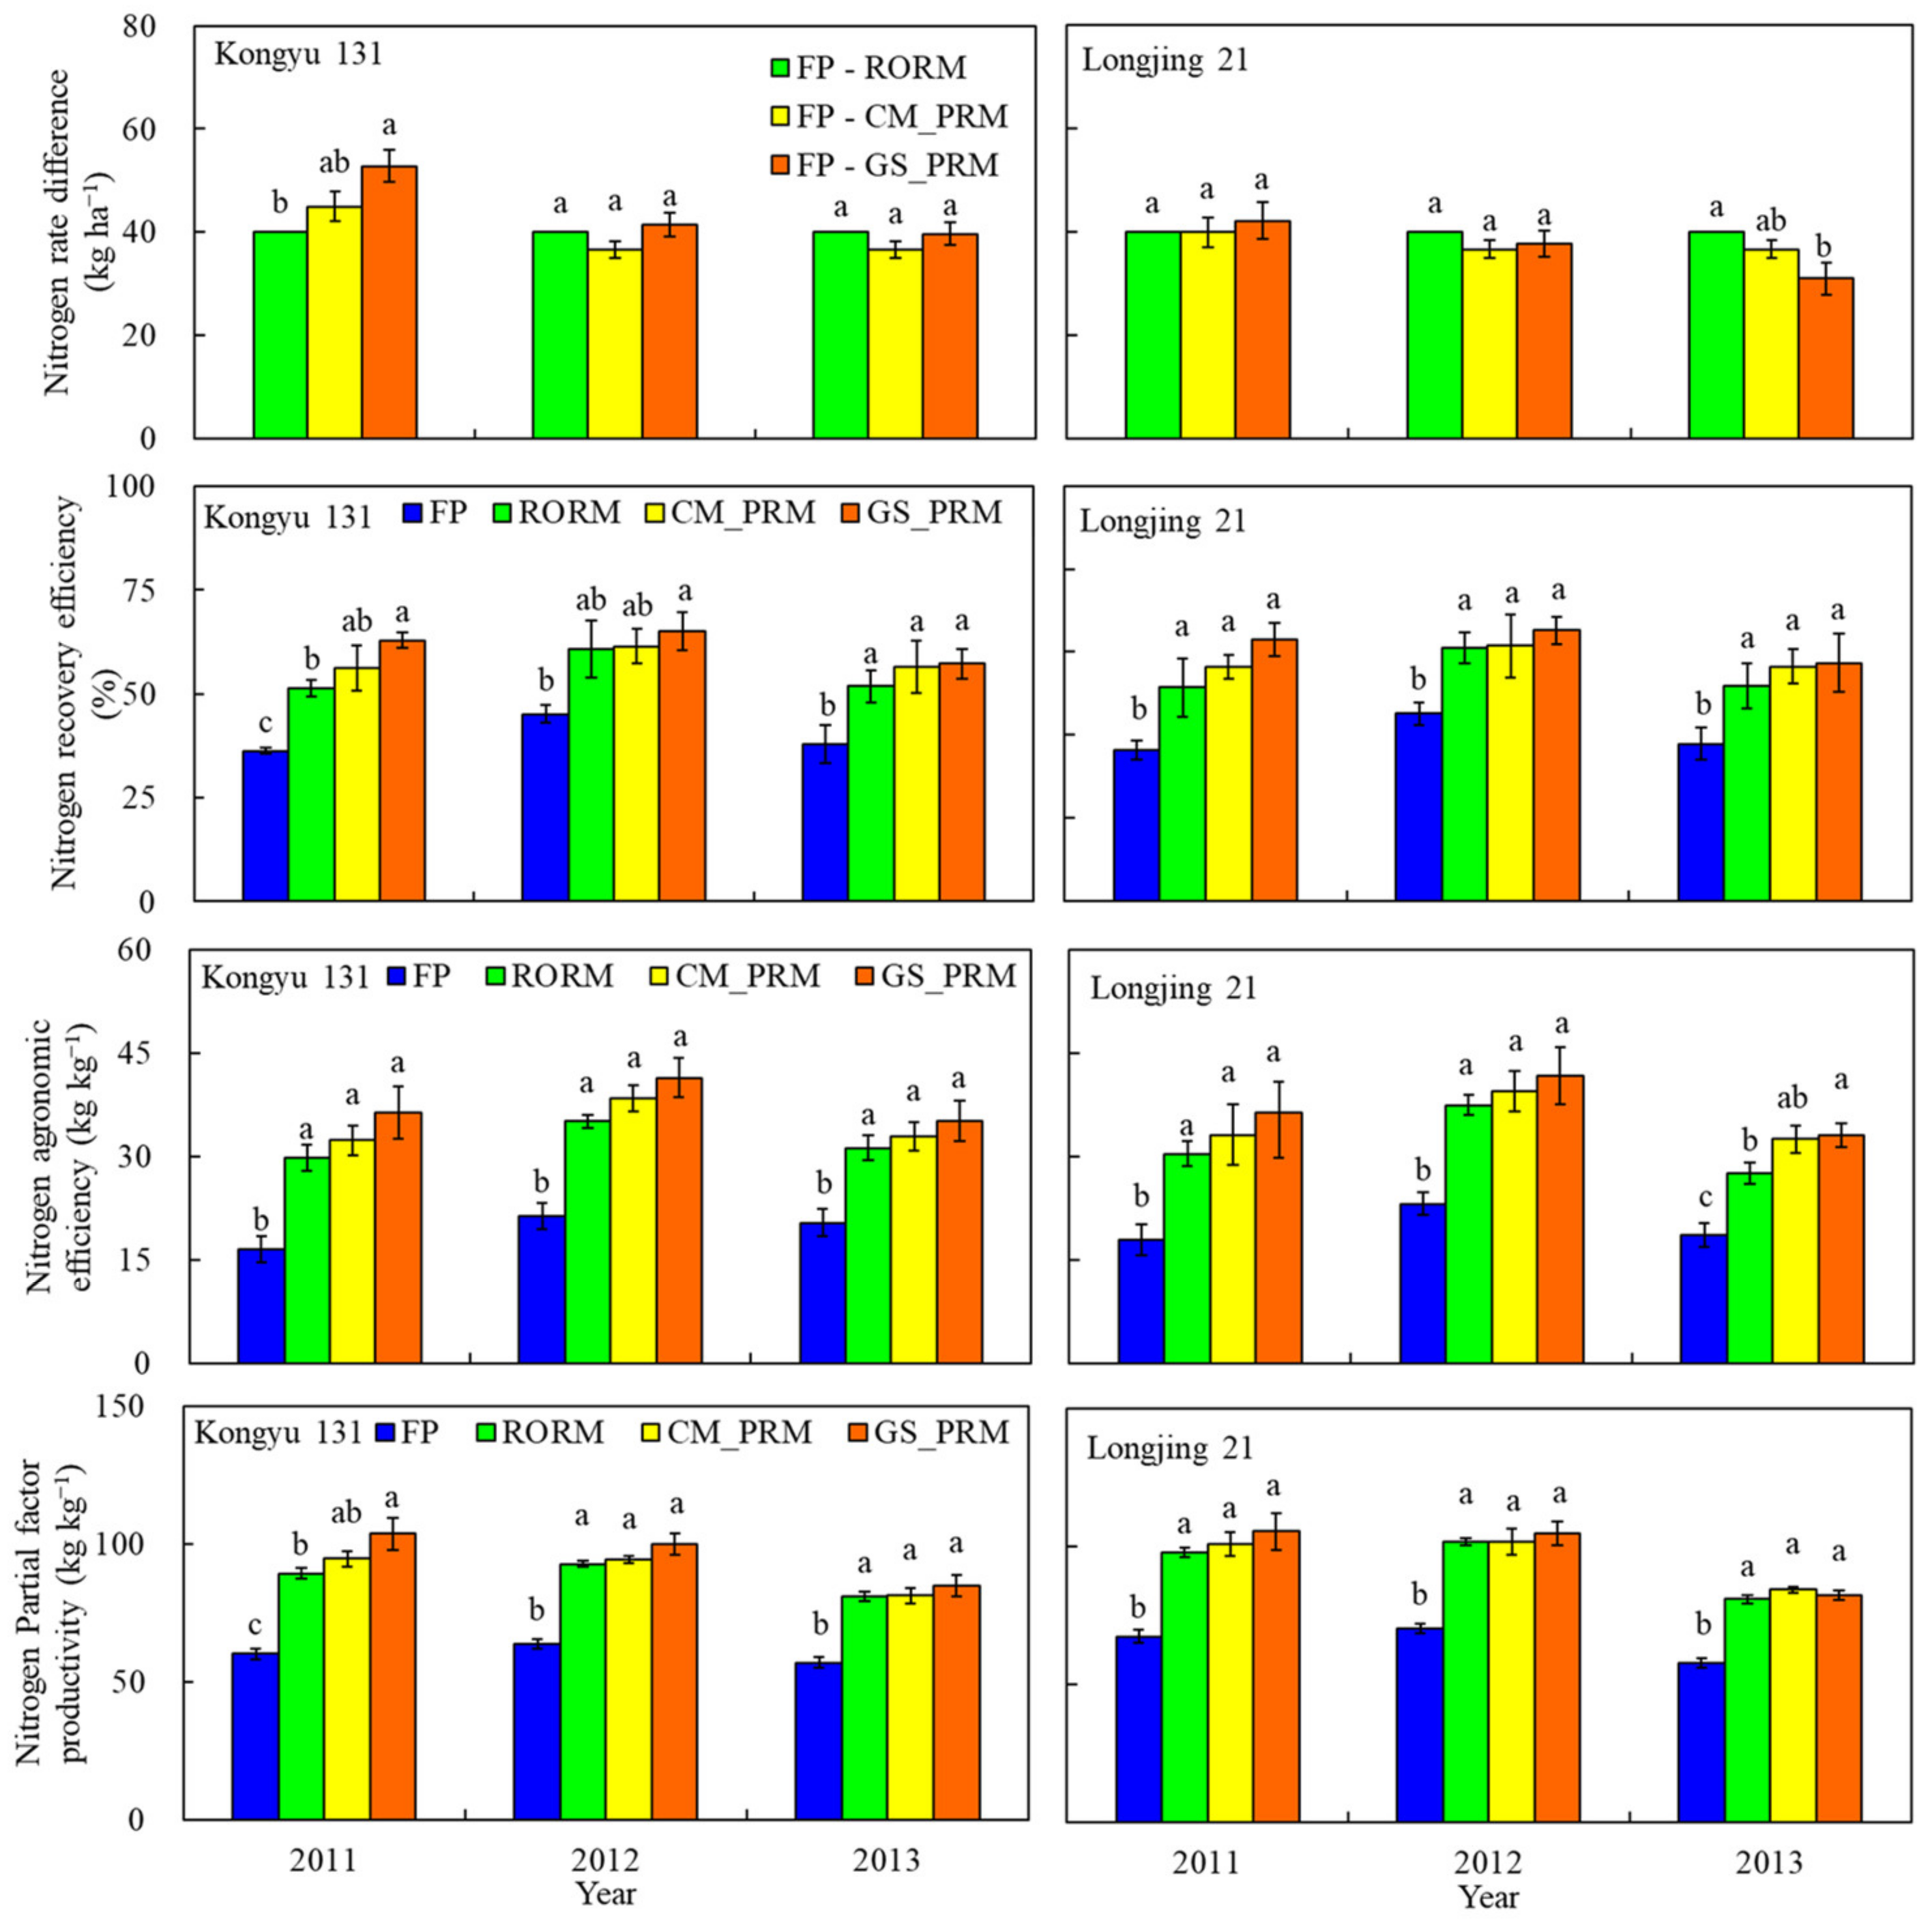
3.3. Nitrogen Use Efficiency

Compared to FP, two sensor-based PRM systems decreased N rates by 24–35% and 24–28% for Kongyu 131 and Longjing 21, respectively (Figure 6). In 2011, the GS_PRM system recommended N rates 12% lower than the RORM system for Kongyu 131. Conversely, in 2013, the GS-PRM system with Longjing 21 increased N rates by 8% over the RORM system. In other cases, the N rates of two sensor-based PRM systems were not significantly different from the RORM system.
All three integrated rice management systems significantly increased N RE, AE, and PFP over FP for both varieties (Figure 5). Across years, the GS_PRM system had the highest values, increasing RE, AE, and PFP over FP by 44–73%, 72–120%, and 49–73% for Kongyu 131 and 68–83%, 80–101%, and 49–56% for Longjing 21, respectively. Compared to the RORM system, the performance of the GS_PRM system differed with years and varieties. In 2011, the GS_PRM system significantly increased RE and PFP by 76% and 50% for Kongyu 131. In 2013, for Longjing 21, the GS_PRM system significantly increased AE by 62%. In other cases, the difference between the GS_PRM system and the RORM system is negligible. Across years and varieties, no significant difference was found between the CM_PRM system and RORM system.

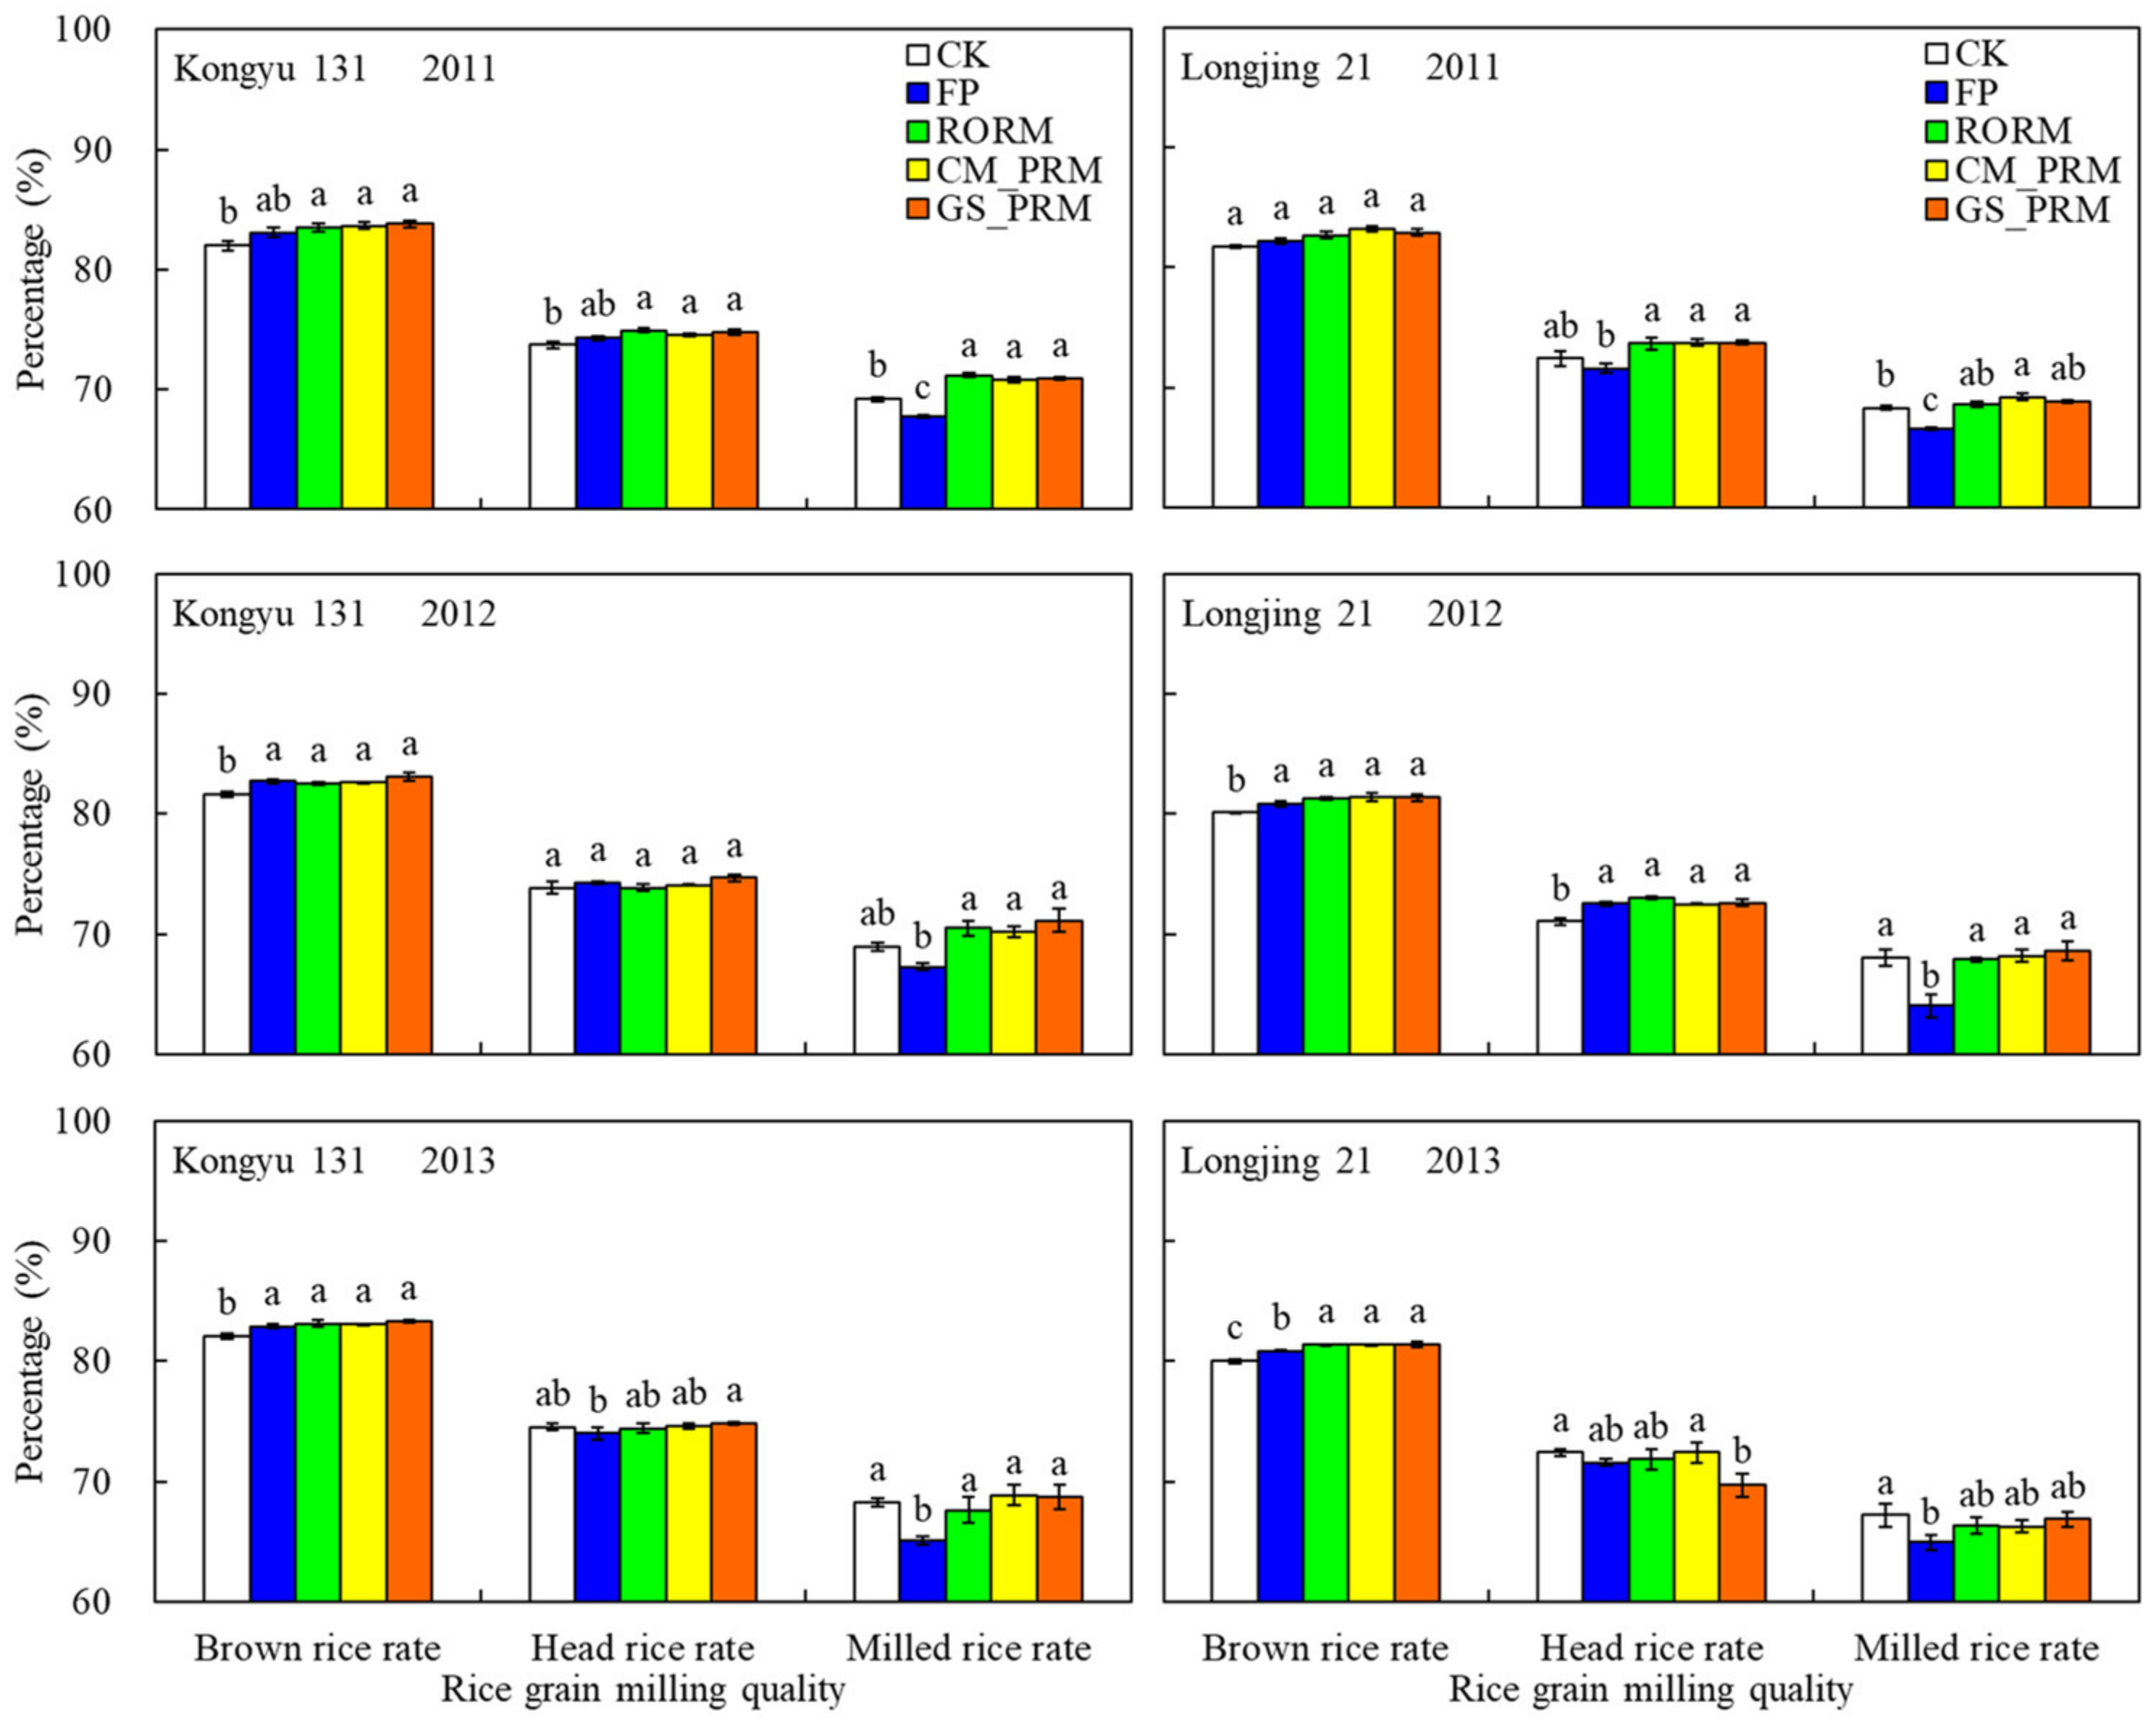
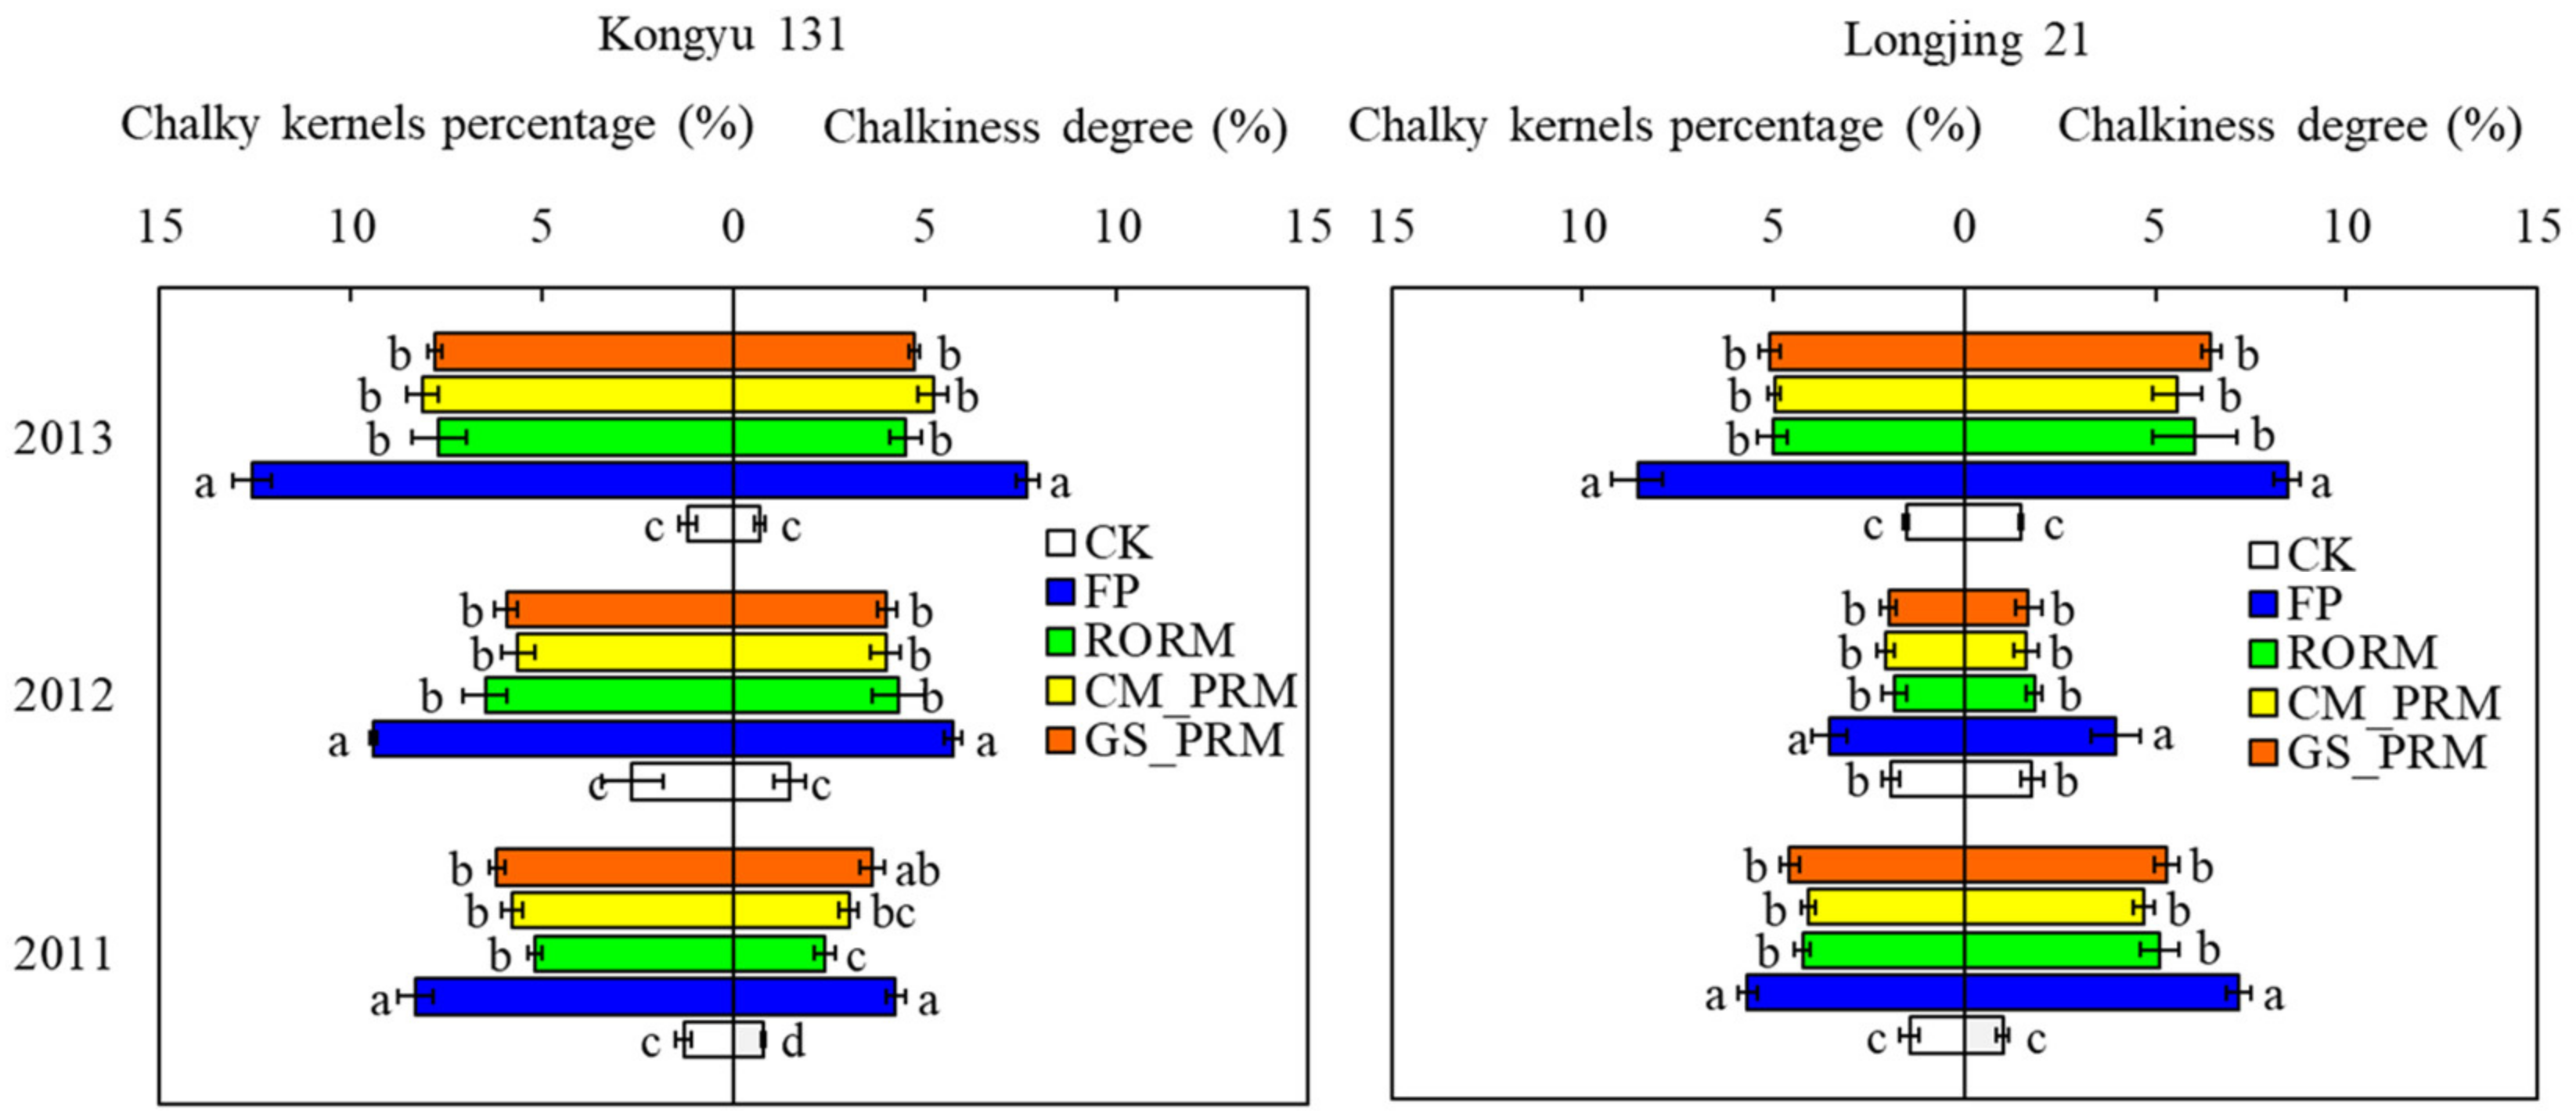
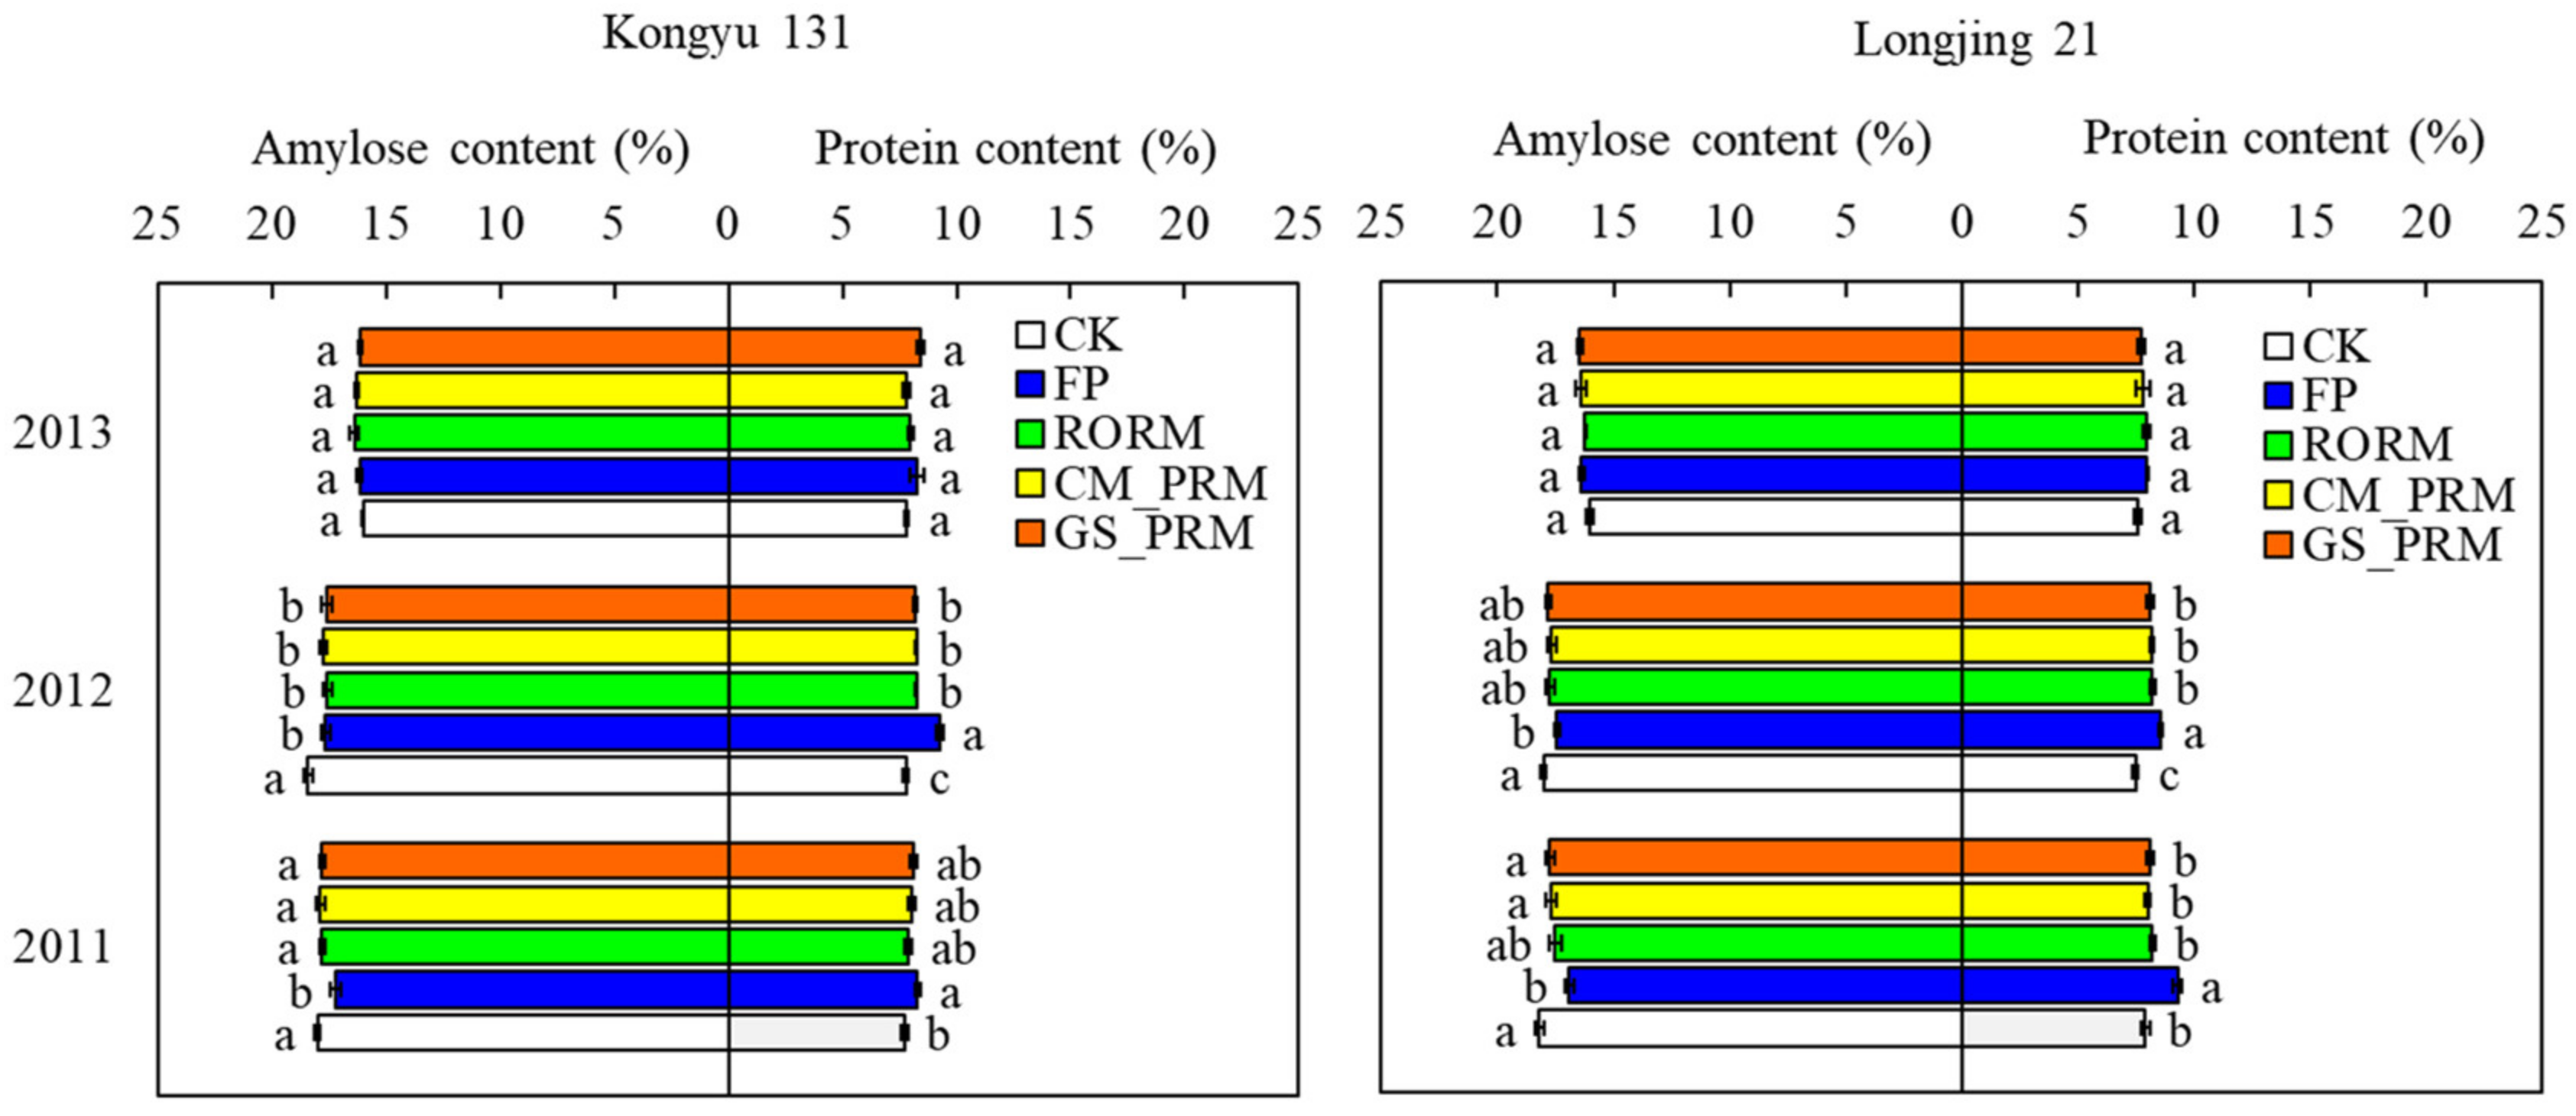
3.4. Rice Grain Quality

There was no significant difference in the rice quality traits between the three integrated rice management systems across three years and two varieties (Figure 7, Figure 8 and Figure 9). However, these three rice management systems contributed to milling quality improvement against the FP, in particular, significantly increased milling rate by 3.9–5.8% for Kongyu 131 across three years, and 3.1–7.1% for Longjing 21 from 2011–2012 (Figure 7).
The three integrated systems had better appearance quality than FP for both varieties (Figure 8). In particular, in 2013, the percentage of chalky rice and chalkiness degree in three integrated management systems decreased against FP by 26–38% and 15–44% for Kongyu 131, 26–38% and 15–44% for Longjing 21, respectively. For nutritional quality, two sensor-based PRM systems for both varieties significantly increased amylose content over FP in 2011 (Figure 9). On the other hand, all three integrated systems significantly decreased protein content in 2011 for Longjing 21 and 2012 for both varieties compared with the FP.

3.5. Lodging Resistance

Lodging resistance parameters were all significantly affected by treatment and year (weather conditions). Additionally, breaking strength was significantly affected by the interaction of treatment and year across two varieties (Table 3 and Table 4). Relative to FP, the three integrated management systems all significantly decreased N4 internode length and plant height and increased breaking strength across the three years for both varieties. The N4 internode length, breaking strength, and fresh plant weight of the GS_PRM and CM_PRM systems were generally similar to the RORM system. However, the plant height of the RORM system was the lowest (except check) across years and varieties. Compared with the FP from 2011–2013, the RORM, CM_PRM, and GS_PRM systems decreased lodging index by 24–26%, 20–23%, and 17–24% for Kongyu 131 and 23–28%, 23–26%, and 21–25% for Longjing 21, respectively. Compared to the RORM system, the lodging index obtained in the GS_PRM system significantly increased by 6–9% from 2011–2012 for Kongyu 131 and by 5% for Longjing 21 in 2011. The GS_PRM system was not significantly different from the CM_PRM system for all lodging-related parameters across years and varieties.

4. Discussion

Pursuing an increase in rice yield has become China’s top priority in ensuring food security for over 1.4 billion inhabitants. New agricultural technologies that do not lead to increased crop yields are less likely to be adopted by farmers. The GS_PRM strategy consistently increased rice grain yield by 0.8–1.3 t ha−1 for Kongyu 131 and 1.2 t ha−1 for Longjing 21 over the FP across years in this study. This increase is very significant for Sanjiang Plain, as rice yield is already relatively high in this region. The average yields of GS_PRM and FP in this study were 10.1 t ha−1 and 9.0 t ha−1 for 11-leaf variety Kongyu 131 and 11.0 t ha−1 and 9.8 t ha−1 for 12-leaf variety Longjing 21. In contrast, the national average rice yield is around 6.7 t ha−1 [44]. The GS_PRM system is not solely an active crop sensor-based N management strategy but an integrated rice management system including optimized transplanting density, irrigation method, and PNM. This system improved yield and positively impacted rice grain quality, NUE, and lodging resistance.

4.1. Yield Increase by Optimizing the Transplanting Density and Water Management

Based on the previous research in this region, optimizing the transplanting density is a crucial strategy to increase rice yield [35,45]. The sink size is generally the primary determinant of rice grain yield [35]. The FP used a transplanting density of 24 hills m−2. In comparison, in the three integrated systems, the transplanting density was increased to 30 hills m−2 and 27 hills m−2 for Kongyu 131 and Longjing 21, respectively. The optimized transplanting density contributed to 7–10% more panicles per unit area for the RORM system than the FP from 2011–2013 for Kongyu 131 (Table 1). This was similar to the result reported by [45] in northeast China. In this study, the GS_PRM system performed significantly better than the FP regardless of the variety or year. The panicle number per unit area of the GS_PRM system was increased by about 11–13% for Kongyu 131 and 10–14% for Longjing 21, which directly contributed to the improved yield.
The alternate wetting and drying irrigation might be another practice to increase production. Norton et al. (2017) found that alternate wetting and drying irrigation practice increased grain yield and aboveground biomass due to significantly more productive tillers [46]. However, the complexity of alternate wetting and drying operation, which is often not easy to apply correctly, might affect grain yield increase. Carrijo et al. (2017) found that the severe alternate wetting and drying (when the soils dried out, with soil water potential beyond −20 kPa) resulted in yield losses of 22.6% over farmer’s practice [47]. Zhao et al. (2013) integrated alternate wetting and drying into high-yield management and PRM systems in northeast China from 2010–2011 and found that this optimized water management improved the rice growth rate over the FP, which led to higher rice yield [35]. Following irrigation operation from [35], the alternate wetting and drying implemented in our study in the GS_PRM system also positively affected rice growth and yield.

4.2. Improving Nitrogen Use Efficiency Based on Precision Nitrogen Management

In the FP, an average of 150 kg N ha−1 was generally applied during the early growth stages without any N application performed after the tillering stage. This strategy may lead to N deficiency at later growth stages and yield loss at maturity [35,45]. Compared with the FP, the RORM system (using 110 kg N ha−1) decreased N application by 27 %, and applied the N fertilizers in five splits at basal, tillering, panicle initiation, stem elongation, and heading stages. This strategy leads to a higher percentage of N accumulation from panicle initiation to the heading stage [35]. The addition of N fertilizer at later growth stages is an essential approach for increasing dry matter (6% over FP obtained in this study for Kongyu 131), which was essential for providing sufficient assimilates to support the high sink potential [45], and decreasing spikelet degeneration in accordance with previous work [48]. At the same time, the RORM system tested in this study increased K application rates and times (two splits) compared with FP. More K fertilizer can improve carbohydrate transportation [49] and positively influence grain filling percentage per panicle [50]. Due to the higher rice yield and less N fertilizer application, RORM increased N RE, AE, and PFP over FP by an average of 47%, 62%, and 44%, respectively (Figure 5). These results are in accordance with previous results of [45].
The RORM system used a fixed set of N management practices optimized for a region across different environmental conditions. For the typical varieties, sites in this region, and normal years, it may be quite optimal. Grain yield in the GS_PRM system was not significantly higher than in RORM, as we found in this study for Kongyu 131. The RORM system was based on 11-leaf varieties and many site-years of field experiments, especially for the typical variety of Kongyu 131 [45]. Moreover, Kongyu 131 is a small–medium panicle size variety with a short growing season and strong tillering ability. It is less responsive to N fertilizers than Longjing 21, a variety characterized by a low tillering ability and large panicle size [51]. However, for some site-years and varieties, the RORM may not be optimal because it is not adjusted for specific site-year conditions. In 2011, the accumulated temperature was the lowest of three years, 208 °C lower than the 20-year average (Figure 1). The low temperature decreased N fertilizer mineralization and N uptake by rice, mainly from transplanting to panicle initiation (May to June). Therefore, large amounts of N from the fertilizer application were still stored in the soil, and the rice N status was surplus. As a result, the recommended N application rate in the GS_PRM system was also significantly lower than RORM with 97 kg N ha−1 for Kongyu 131, which agreed with the recommended N application rate (50~100 kg N ha−1) from the CERES-Rice Crop Model in cool weather years in [52]. In addition, the GS_PRM system increased RE and PFP significantly over RORM by 76% and 50% without yield decrease in 2011. In 2013, lower solar irradiance and frequent precipitation in the period from the heading to maturity affected grain filling, resulting in decreased filled grains and 1000-grain weight and average yield of all treatments, as compared to 2011 and 2012. The accumulated temperature, however, was the highest of three years. That was more beneficial to Longjing 21 than Kongyu 131 because Longjing 21 is a 12-leaf variety and requires a higher accumulated temperature to grow. In 2013, the GS_PRM system recommended higher N rates for improved rice panicle number per unit area than the RORM. It increased grain yield and AE of Longjing 21 by 10.1% and 62%, respectively.
The data used to build CM_PRM were collected from only 15 rice plants per plot. In contrast, the GS sensor data were collected from across the plots to be more representative of the plant growth status. The CM-based strategy adjusted the topdressing N rates by a fixed amount based on plant N status. The GS-based N management strategy estimated the potential yield response to additional N topdressing. It then estimated the amount of N to be applied based on the potential yield response. This strategy considered the weather conditions and indigenous N supply when recommending topdressing N rates at leaf age 10 or 11 (stem elongation stage) by using growing degree days from transplanting to sensing to normalize the NDVI or RVI. Thus, it could better meet the crop N needs than the CM-based approach [16]. In terms of grain yield and N use efficiency, the CM_PRM system showed the same performance for both varieties as the RORM system. However, the GS_PRM system significantly improved yield or N use efficiency over the RORM system for specific variety-year conditions.

4.3. Rice Grain Quality Improvement in Integrated Rice Management Systems

The two PRM systems and the RORM system improved rice grain quality significantly over the FP in this study. These results were consistent with [53]. Optimized nutrient supply and water management in these three integrated rice management systems might be the main factors for the rice grain quality improvement. Nangju and Datta (1970) indicated that increasing the N fertilizer rate improved the milling quality of the chalky varieties [54]. However, the protein content also could be increased, and too much N may reduce rice grain quality. Yang et al. (2007) indicated that grain quality was less responsive to N supply than rice yield [42]. They found better appearance and taste quality in low-N or medium-N treatment [42]. In this study, late fertilizer application and increasing the number of applications also significantly affected rice grain quality compared with FP. The same was observed in the study of [55] performed at the International Rice Research Institute farm, Which indicated that late N fertilizer application increased rice yield with higher milled rice protein, milled rice, and head milled rice rate. Wopereis-Pura et al. (2002) also found that an additional N application of 30 kg N ha−1 at the booting stage improved head milled rice rate and milling recovery and net benefits in the Senegal River valley [56]. In addition, adequate potassium supplementation at the booting stage in these integrated rice management systems contributed to rice quality improvement. Atapattu et al. (2018) found that the maximum KCl rate obtained the best head yield of direct seeded rice [57]. The rice milling quality was improved by appropriate N and K application rather than only N or K application [58].
The current FP in this study region is to irrigate the rice crops with a high water rate at the beginning of the season and maintain the deep water table for a long time to save labor during rice growth. However, a deep water table might lead to poor root growth, which affects the uptake of micro- and trace elements [46] and even leads to crop lodging at the grain filling stage [59], thus leading to reduced rice grain quality. Optimized water management may improve rice milling quality, if it is implemented correctly [60] or when an optimized N management is being used [61,62]. Liu et al. (2008) indicated that alternate wetting and drying irrigation could enhance activities of some enzymes and decrease ethylene production in grains in middle and late grain filling stages, while the situation was reversed under extreme alternate wetting and drying or severe soil drying, which might be the primary physiological mechanism of good quality for optimized water management [60]. Pan et al. (2009) found significant interactions between irrigation regimes and N rates for grain quality [61]. Therefore, they recommended a N rate of 180 kg ha−1 under alternate wetting and drying, giving a higher yield and better grain quality than farmer’s practice.

4.4. Lodging Resistance Increase in Integrated Rice Management Systems

Mahajan et al. (2012) found that suitable water and N management could enhance root systems in deeper soil layers [63]. Compared with traditional irrigation, water-saving irrigation could significantly enhance root length, density, surface area, and dry matter, which may decrease lodging risk [64]. On the other hand, the suitable N rate and the split ratio can influence morphological traits of individual plants, which also reduces lodging risk [39]. Zhang et al. (2014) evaluated the response of lodging resistance characteristics of different rice populations to N fertilization in the high-yield rice management system [65]. They found that plant height, the height of the center of gravity, and internode length increased. In addition, the breaking strength decreased with increasing N rates, which led to an increased lodging index. More importantly, however, potassium fertilization may improve rice stem strength and yield in N-fertilized soils [66]. This study integrated optimized nutrient and water management to improve lodging-resistant morphological traits, with decreasing 1–2 internode length, plant height, and weight and increasing breaking strength. Among the integrated management systems, the lodging index was the lowest in the RORM system, with 87.1–98.6% across years and varieties, followed closely by the CM_PRM system and GS_PRM system. One possible reason was that the higher yield in PRM systems increased the risk of lodging slightly.
The research presented here further improved a previously developed preliminary PRM system of [35] by replacing the chlorophyll meter with an active canopy sensor, GreenSeeker, for PRM. The GS_PRM system described here reduced the number of topdressing N applications compared with the CM_PRM system (Table A1), making it more efficient and practical under the on-farm conditions. Furthermore, this study showed no significant differences between these two PRM strategies in terms of yield, NUE, grain quality, and lodging-related indicators. Therefore, the GS_PRM system can replace the CM_PRM system, with a better performance when compared with FP.
This study was conducted at a research station with limited spatial variability, but there was significant year to year weather variability. The GS-PRM strategy could adjust topdressing N application rates according to rice growth conditions, yield potential, and N needs as affected by the weather conditions in each year. Studies are needed to evaluate the GS_PRM system under diverse on-farm conditions to better demonstrate its advantages and benefits over the RORM system. More studies are also needed to further improve N management by using active sensors with more spectral bands, such as Crop Circle ACS 430 [67] or RapidSCAN CS-45 sensors [5,68], or using satellite [69] and unmanned aerial vehicle-based remote sensing [70] to guide large-scale on-farm applications.

5. Conclusions

This study developed an integrated active canopy sensor-based precision rice management system and compared it to current local FP, a RORM practice recommended by the extension system, and a leaf sensor-based precision rice management system. Due to optimized transplanting density and nutrient rates, the GS_PRM system performed the best of all rice management systems, significantly increasing rice grain yield, NUE, grain quality, and lodging resistance compared to the FP. In the cool weather year of 2011, the GS_PRM system recommended a 12% lower N rate for the 11-leaf rice variety Kongyu 131 than RORM, and at the same time significantly increased N RE and PFP by 76% and 50%, respectively, without inducing yield loss. In the warm weather year of 2013, the developed system recommended an 8% higher N rate than the RORM system for the 12-leaf variety Longjing 21, which improved rice panicle number per unit area and eventually led to increased grain yield and N RE by 10.1% and 62%, respectively. The GS_PRM system performed similarly to the CM_PRM system across three years and varieties, even though it reduced the split applications from five to four and used a canopy sensor rather than a leaf sensor. The RORM system tested in this study also performed well in normal years for both varieties and can potentially be easily adopted by farmers due to its simplicity. More studies are needed to further test the developed GS_PRM system under more diverse on-farm conditions and further improve it using unmanned aerial vehicle or satellite remote sensing technologies for large-scale applications.

Author Contributions

Conceptualization, Y.M.; methodology, H.W., Y.M. and G.Z.; software, H.W. and J.L.; validation, H.W. and Y.M.; formal analysis, J.L. and H.W.; investigation, H.W., L.Z., G.Z. and Q.C.; resources, Y.M.; data curation, J.L. and H.W.; writing—original draft preparation, J.L. and H.W.; writing—review and editing, J.L., Y.M. and K.K.; visualization, J.L.; supervision, Y.M.; project administration, Y.M.; funding acquisition, Y.M., J.L. and K.K. All authors have read and agreed to the published version of the manuscript.

Funding

This research was funded by the National Basic Research Program of China (2015CB150405), Norwegian Ministry of Foreign Affairs (SINOGRAIN II, CHN-17/0019), Doctoral Fund Program of Henan Polytechnic University (B2019-5), Key Scientific Research Projects of Higher Education Institutions in Henan Province (20A210013), and Henan Scientific and Technological Projection (202102110032).

Data Availability Statement

The data presented in this study are available on request from the corresponding author.

Acknowledgments

We would like to thank Yuan Gao, Wen Yang, Huamin Zhu, and Fengyan Liu at the Jiansanjiang Institute of Agricultural Science, Cheng Liu at Qixing Research and Development Center, Duodong Li at Jiansanjiang Seed Management Bureau, Guojun Li at Jiansanjiang Agriculture Bureau, Zujian Zhang from Yangzhou University, and Jianning Shen, Yinun Yao, and Shanyu Huang from China Agricultural University.

Conflicts of Interest

The authors declare no conflict of interest.

Appendix A

Table A1. Fertilizer application rates (kg ha−1) and timing for different rice management systems in the two field experiments for two varieties from 2011–2013.
TreatmentBasal N1st Topdressing2nd Topdressing3rd Topdressing4th TopdressingTotal NTotal P2O5Total K2O
StageN RateStageN RateStageN RateStageN Rate
CK---------03060
FP60Tillering90------1506050
RORM45Tillering20Panicle initiation15Stem elongation20Heading1011050105
CM_PRM45Tillering20Panicle initiation15 *Stem elongation20 *Heading10110 **50105
GS_PRM45Tillering20Panicle initiation15Stem elongation30 **Heading-110 **50105
Note: CK, check treatment; FP, farmer’s practice; RORM, regional optimum rice management; CM_PRM, chlorophyll meter-based precision rice management; GS_PRM, GreenSeeker-based precision rice management. * N topdressing rate and total N rate were adjusted based on the chlorophyll meter diagnosis of rice N status, as described in materials and methods of this study. ** N topdressing rate and total N rate were adjusted based on the algorithms of GreenSeeker described in materials and methods of this study.

References

  1. Yin, Y.; Zhao, R.; Yang, Y.; Meng, Q.; Ying, H.; Cassman, K.G.; Cong, W.; Tian, X.; He, K.; Wang, Y.; et al. A steady-state N balance approach for sustainable smallholder farming. Proc. Natl. Acad. Sci. USA 2021, 118, e2106576118. [Google Scholar] [CrossRef] [PubMed]
  2. Laborde, D.; Martin, W.; Swinnen, J.; Vos, R. COVID-19 risks to global food security. Science 2020, 369, 500–502. [Google Scholar] [CrossRef] [PubMed]
  3. Sishodia, R.P.; Ray, R.L.; Singh, S.K. Applications of remote sensing in precision agriculture: A review. Remote Sens. 2020, 12, 3136. [Google Scholar] [CrossRef]
  4. Singh, J.; Singh, V.; Kaur, S. Precision nitrogen management improves grain yield, nitrogen use efficiency and reduces nitrous oxide emission from soil in spring maize. J. Plant Nutr. 2020, 43, 2311–2321. [Google Scholar] [CrossRef]
  5. Lu, J.; Miao, Y.; Shi, W.; Li, J.; Hu, X.; Chen, Z.; Wang, X.; Kusnierek, K. Developing a proximal active canopy sensor-based precision nitrogen management strategy for high-yielding rice. Remote Sens. 2020, 12, 1440. [Google Scholar] [CrossRef]
  6. Neupane, J.; Guo, W.X. Agronomic basis and strategies for precision water management: A review. Agronomy 2019, 9, 87. [Google Scholar] [CrossRef] [Green Version]
  7. Song, T.; Xu, F.; Yuan, W.; Chen, M.; Hu, Q.; Tian, Y.; Zhang, J.; Xu, W. Combining alternate wetting and drying irrigation with reduced phosphorus fertilizer application reduces water use and promotes phosphorus use efficiency without yield loss in rice plants. Agric. Water Manag. 2019, 223, 105686. [Google Scholar] [CrossRef]
  8. Behmann, J.; Mahlein, A.-K.; Rumpf, T.; Roemer, C.; Pluemer, L. A review of advanced machine learning methods for the detection of biotic stress in precision crop protection. Precis. Agric. 2015, 16, 239–260. [Google Scholar] [CrossRef]
  9. Iost Filho, F.H.; Heldens, W.B.; Kong, Z.; de Lange, E.S. Drones: Innovative technology for use in precision pest management. J. Econ. Entomol. 2020, 113, 1–25. [Google Scholar] [CrossRef] [Green Version]
  10. Shamal, S.A.M.; Alhwaimel, S.A.; Mouazen, A.M. Application of an on-line sensor to map soil packing density for site specific cultivation. Soil Tillage Res. 2016, 162, 78–86. [Google Scholar] [CrossRef] [Green Version]
  11. Mohammadi, F.; Maleki, M.R.; Khodaei, J. Control of variable rate system of a rotary tiller based on real-time measurement of soil surface roughness. Soil Tillage Res. 2022, 215, 105216. [Google Scholar] [CrossRef]
  12. Trevisan, R.G.; Bullock, D.S.; Martin, N.F. Spatial variability of crop responses to agronomic inputs in on-farm precision experimentation. Precis. Agric. 2020, 22, 342–363. [Google Scholar] [CrossRef]
  13. Kerry, R.; Escolà, A. Sensing Approaches for Precision Agriculture; Springer: Cham, Switzerland, 2021. [Google Scholar] [CrossRef]
  14. Heffer, P. Assessment of Fertilizer Use by Crop at the Global Level: 2010–2010/11; International Fertilizer Industry Association: Paris, France, 2013. [Google Scholar]
  15. Peng, S.; Buresh, R.J.; Huang, J.; Zhong, X.; Zou, Y.; Yang, J.; Wang, G.; Liu, Y.; Hu, R.; Tang, Q.; et al. Improving nitrogen fertilization in rice by site-specific N management. A review. Agron. Sustain. Dev. 2010, 30, 649–656. [Google Scholar] [CrossRef]
  16. Yao, Y.; Miao, Y.; Huang, S.; Gao, L.; Ma, X.; Zhao, G.; Jiang, R.; Chen, X.; Zhang, F.; Yu, K.; et al. Active canopy sensor-based precision N management strategy for rice. Agron. Sustain. Dev. 2012, 32, 925–933. [Google Scholar] [CrossRef] [Green Version]
  17. Miao, Y.; Mulla, D.J.; Randall, G.W.; Vetsch, J.A.; Vintila, R. Combining chlorophyll meter readings and high spatial resolution remote sensing images for in-season site-specific nitrogen management of corn. Precis. Agric. 2009, 10, 45–62. [Google Scholar] [CrossRef]
  18. Raun, W.R.; Solie, J.B.; Johnson, G.V.; Stone, M.L.; Mullen, R.W.; Freeman, K.W.; Thomason, W.E.; Lukina, E.V. Improving nitrogen use efficiency in cereal grain production with optical sensing and variable rate application. Agron. J. 2002, 94, 815–820. [Google Scholar] [CrossRef] [Green Version]
  19. Li, F.; Miao, Y.; Zhang, F.; Cui, Z.; Li, R.; Chen, X.; Zhang, H.; Schroder, J.; Raun, W.R.; Jia, L. In-season optical sensing improves nitrogen-use efficiency for winter wheat. Soil Sci. Soc. Am. J. 2009, 73, 1566–1574. [Google Scholar] [CrossRef] [Green Version]
  20. Singh, B.; Sharma, R.K.; Kaur, J.; Jat, M.L.; Martin, K.L.; Singh, Y.; Singh, V.; Chandna, P.; Choudhary, O.P.; Gupta, R.K.; et al. Assessment of the nitrogen management strategy using an optical sensor for irrigated wheat. Agron. Sustain. Dev. 2011, 31, 589–603. [Google Scholar] [CrossRef] [Green Version]
  21. Cao, Q.; Miao, Y.; Li, F.; Gao, X.; Liu, B.; Lu, D.; Chen, X. Developing a new Crop Circle active canopy sensor-based precision nitrogen management strategy for winter wheat in North China Plain. Precis. Agric. 2017, 18, 2–18. [Google Scholar] [CrossRef]
  22. Shaver, T.M.; Khosla, R.; Westfall, D.G. Evaluation of two crop canopy sensors for nitrogen variability determination in irrigated maize. Precis. Agric. 2011, 12, 892–904. [Google Scholar] [CrossRef]
  23. Wang, X.; Miao, Y.; Dong, R.; Chen, Z.; Guan, Y.; Yue, X.; Fang, Z.; Mulla, D.J. Developing active canopy sensor-based precision nitrogen management strategies for maize in Northeast China. Sustainability 2019, 11, 706. [Google Scholar] [CrossRef] [Green Version]
  24. Wang, X.; Miao, Y.; Dong, R.; Zha, H.; Xia, T.; Chen, Z.; Kusnierek, K.; Mi, G.; Sun, H.; Li, M. Machine learning-based in-season nitrogen status diagnosis and sidedress nitrogen recommendation for corn. Eur. J. Agron. 2021, 123, 126193. [Google Scholar] [CrossRef]
  25. Xue, L.; Li, G.; Qin, X.; Yang, L.; Zhang, H. Topdressing nitrogen recommendation for early rice with an active sensor in south China. Precis. Agric. 2014, 15, 95–110. [Google Scholar] [CrossRef]
  26. Cao, Q.; Miao, Y.; Feng, G.; Gao, X.; Li, F.; Liu, B.; Yue, S.; Cheng, S.; Ustin, S.L.; Khosla, R. Active canopy sensing of winter wheat nitrogen status: An evaluation of two sensor systems. Comput. Electron. Agric. 2015, 112, 54–67. [Google Scholar] [CrossRef]
  27. Singh, B.; Singh, V.; Purba, J.; Sharma, R.K.; Jat, M.L.; Singh, Y.; Thind, H.S.; Gupta, R.K.; Chaudhary, O.P.; Chandna, P.; et al. Site-specific fertilizer nitrogen management in irrigated transplanted rice (Oryza sativa) using an optical sensor. Precis. Agric. 2015, 16, 455–475. [Google Scholar] [CrossRef]
  28. Cao, Y.; Yin, B. Effects of integrated high-efficiency practice versus conventional practice on rice yield and N fate. Agric. Ecosyst. Environ. 2015, 202, 1–7. [Google Scholar] [CrossRef]
  29. Miao, Y.; Stewart, B.A.; Zhang, F.S. Long-term experiments for sustaiable nutrient management in China. A review. Agron. Sustain. Dev. 2011, 31, 397–414. [Google Scholar] [CrossRef] [Green Version]
  30. Cao, Q.; Miao, Y.; Guohui, F.; Gao, X.; Liu, B.; Liu, Y.; Li, F.; Khosla, R.; Mulla, D.; Zhang, F. Improving nitrogen use efficiency with minimal environmental risks using an active canopy sensor in a wheat-maize cropping system. Field Crop. Res. 2017, 214, 365–372. [Google Scholar] [CrossRef]
  31. Jat, H.S.; Choudhary, M.; Kakraliya, S.K.; Gora, M.K.; Kakraliya, M.; Kumar, V.; Priyanka; Poonia, T.; McDonald, A.J.; Jat, M.L.; et al. A decade of climate-smart agriculture in major agri-food systems: Earthworm abundance and soil physico-biochemical properties. Agronomy 2022, 12, 658. [Google Scholar] [CrossRef]
  32. Zhang, M.; Liu, L.; Luo, S.; Peng, X.; Li, J. Effects of integrated nutrient management on lodging resistance of rice in cold area. Sci. Agric. Sin. 2010, 43, 4536–4542. (In Chinese) [Google Scholar]
  33. Cao, Q.; Cui, Z.; Chen, X.; Khosla, R.; Dao, T.H.; Miao, Y. Quantifying spatial variability of indigeous nitrogen supply for precision nitrogen management in small scale farming. Precis. Agric. 2012, 13, 45–61. [Google Scholar] [CrossRef]
  34. Xue, Y.; Duan, H.; Liu, L.; Wang, Z.; Yang, J.; Zhang, J. An improved crop management increases grain yield and nitrogen and water use efficiency in rice. Crop Sci. 2013, 53, 271–284. [Google Scholar] [CrossRef]
  35. Zhao, G.; Miao, Y.; Wang, H.; Su, M.; Fan, M.; Zhang, F.; Jiang, R.; Zhang, Z.; Liu, C.; Liu, P. A preliminary precision rice management system for increasing both grain yield and nitrogen use efficiency. Field Crop. Res. 2013, 154, 23–30. [Google Scholar] [CrossRef]
  36. Drinkwater, L.E. Cropping systems research: Reconsidering agricultural experimental approaches. Horttechnology 2002, 12, 355–361. [Google Scholar] [CrossRef] [Green Version]
  37. Islam, M.S.; Peng, S.; Visperas, R.M.; Ereful, N.; Bhuiya, M.S.U.; Julfiquar, A.W. Lodging-related morphological traits of hybrid rice in a tropical irrigated ecosystem. Field Crop. Res. 2007, 101, 240–248. [Google Scholar] [CrossRef]
  38. Kashiwagi, T.; Sasaki, H.; Ishimaru, K. Factors responsible for decreasing sturdiness of the lower part in lodging of rice (Oryza sativa L.). Plant Prod. Sci. 2005, 8, 166–172. [Google Scholar] [CrossRef]
  39. Zhang, W.; Wu, L.; Wu, X.; Ding, Y.; Li, G.; Li, J.; Weng, F.; Liu, Z.; Tang, S.; Ding, C. Lodging resistance of Japonica rice (Oryza Sativa L.): Morphological and anatomical traits due to top-dressing nitrogen application rates. Rice 2016, 9, 31. [Google Scholar] [CrossRef] [Green Version]
  40. Wu, W.; Huang, J.; Cui, K.; Nie, L.; Wang, Q.; Yang, F.; Shah, F.; Yao, F.; Peng, S. Sheath blight reduces stem breaking resistance and increases lodging susceptibility of rice plants. Field Crop. Res. 2012, 128, 101–108. [Google Scholar] [CrossRef]
  41. Zhu, G.; Li, G.; Wang, D.; Yuan, S.; Wang, F. Changes in the lodging-related traits along with rice genetic improvement in China. PLoS ONE 2016, 11, e0160104. [Google Scholar] [CrossRef]
  42. Yang, L.; Wang, Y.; Dong, G.; Gu, H.; Huang, J.; Zhu, J.; Yang, H.; Liu, G.; Han, Y. The impact of free-air CO2 enrichment (FACE) and nitrogen supply on grain quality of rice. Field Crop. Res. 2007, 102, 128–140. [Google Scholar] [CrossRef]
  43. Wei, H.; Zhu, Y.; Qiu, S.; Han, C.; Hu, L.; Xu, D.; Zhou, N.; Xing, Z.; Hu, Y.; Cui, P.; et al. Combined effect of shading time and nitrogen level on grain filling and grain quality in japonica super rice. J. Integr. Agric. 2018, 17, 2405–2417. [Google Scholar] [CrossRef] [Green Version]
  44. Xu, X.; He, P.; Zhao, S.; Qiu, S.; Johnston, A.M.; Zhou, W. Quantification of yield gap and nutrient use efficiency of irrigated rice in China. Field Crop. Res. 2016, 186, 58–65. [Google Scholar] [CrossRef]
  45. Peng, X.; Yang, Y.; Yu, C.; Chen, L.; Zhang, M.; Liu, Z.; Sun, Y.; Luo, S.; Liu, Y. Crop management for increasing rice yield and nitrogen use efficiency in northeast China. Agron. J. 2015, 107, 1682–1690. [Google Scholar] [CrossRef]
  46. Norton, G.J.; Shafaei, M.; Travis, A.J.; Deacon, C.M.; Danku, J.; Pond, D.; Cochrane, N.; Lockhart, K.; Salt, D.; Zhang, H.; et al. Impact of alternate wetting and drying on rice physiology, grain production, and grain quality. Field Crop. Res. 2017, 205, 1–13. [Google Scholar] [CrossRef] [Green Version]
  47. Carrijo, D.R.; Lundy, M.E.; Linquist, B.A. Rice yields and water use under alternate wetting and drying irrigation: A meta-analysis. Field Crop. Res. 2017, 203, 173–180. [Google Scholar] [CrossRef]
  48. Zhang, Z.; Chu, G.; Liu, L.; Wang, Z.; Wang, X.; Zhang, H.; Yang, J.; Zhang, J. Mid-season nitrogen application strategies for rice varieties differing in panicle size. Field Crop. Res. 2013, 150, 9–18. [Google Scholar] [CrossRef]
  49. Dobermann, A.; Witt, C.; Dawe, D.; Abdulrachman, S.; Gines, H.C.; Nagarajan, R.; Satawathananont, S.; Son, T.T.; Tan, P.S.; Wang, G.H.; et al. Site-specific nutrient management for intensive rice cropping systems in Asia. Field Crop. Res. 2002, 74, 37–66. [Google Scholar] [CrossRef]
  50. De Datta, S.; Gomez, K. Changes in Phosphorus and Potassium Responses in Wetland Rice Soils in South-East Asia. In Phosphorus and Potassium in the Tropics; Malaysian Society of Soil Science: Kuala Lumpur, Malaysia, 1982. [Google Scholar]
  51. Tian, Y.; Feng, L.; Zou, H.; Zhang, Z.; Zhu, H.; Miao, Y. Effects of water and nitrogen on growth, development and yield of rice in cold area of Northeast China. Acta Ecol. Sin. 2014, 34, 6864–6871. (In Chinese) [Google Scholar] [CrossRef]
  52. Zhang, J.; Miao, Y.; Batchelor, W.; Lu, J.; Wang, H.; Kang, S. Improving high-latitude rice nitrogen management with the CERES-rice crop model. Agronomy 2018, 8, 263. [Google Scholar] [CrossRef] [Green Version]
  53. Zhang, H.; Hou, D.; Peng, X.; Ma, B.; Shao, S.; Jing, W.; Gu, J.; Liu, L.; Wang, Z.; Liu, Y.; et al. Optimizing integrative cultivation management improves grain quality while increasing yield and nitrogen use efficiency in rice. J. Integr. Agric. 2019, 18, 2716–2731. [Google Scholar] [CrossRef]
  54. Nangju, D.; Datta, S.K.D. Effect of time of harvest and nitrogen level on yield and grain breakage in transplanted rice. Agron. J. 1970, 62, 468–474. [Google Scholar] [CrossRef]
  55. Perez, C.M.; Juliano, B.O.; Liboon, S.P.; Alcantara, J.M.; Cassman, K.G. Effects of late nitrogen fertilizer application on head rice yield, protein content, and grain quality of rice. Cereal Chem. 1996, 73, 556–560. [Google Scholar] [CrossRef]
  56. Wopereis-Pura, M.; Watanabe, H.; Moreira, J.; Wopereis, M.C.S. Effect of late nitrogen application on rice yield, grain quality and profitability in the Senegal River valley. Eur. J. Agron. 2002, 17, 191–198. [Google Scholar] [CrossRef]
  57. Atapattu, A.J.; Prasantha, B.D.R.; Amaratunga, K.S.P.; Marambe, B. Increased rate of potassium fertilizer at the time of heading enhances the quality of direct seeded rice. Chem. Biol. Technol. Agric. 2018, 5, 22. [Google Scholar] [CrossRef]
  58. Valojai, S.T.S.; Niknejad, Y.; Amoli, H.F.; Tari, D.B. Response of rice yield and quality to nano-fertilizers in comparison with conventional fertilizers. J. Plant Nutr. 2021, 44, 1971–1981. [Google Scholar] [CrossRef]
  59. Lal, B.; Gautam, P.; Mohanty, S.; Raja, R.; Tripathi, R.; Shahid, M.; Panda, B.B.; Baig, M.J.; Rath, L.; Bhattacharyya, P.; et al. Combined application of silica and nitrogen alleviates the damage of flooding stress in rice. Crop Pasture Sci. 2015, 66, 679–688. [Google Scholar] [CrossRef]
  60. Liu, K.; Zhang, H.; Zhang, S.; Wang, Z.; Yang, J. Effects of soil moisture and irrigation patterns during grain filling on grain yield and quality of rice and their physiological mechanism. Acta Agron. Sin. 2008, 34, 268–276. (In Chinese) [Google Scholar] [CrossRef]
  61. Pan, S.; Cao, C.; Cai, M.; Wang, J.; Wang, R.; Zhai, J.; Huang, S. Effects of irrigation regime and nitrogen management on grain yield, quality and water productivity in rice. J. Food Agric. Environ. 2009, 7, 559–564. [Google Scholar] [CrossRef]
  62. Kaur, J.; Mahal, S.S.; Kaur, A. Yield and quality evaluation of direct seeded basmati rice (Oryza sativa L.) under different irrigation and nitrogen regimes. Cereal Res. Commun. 2016, 44, 330–340. [Google Scholar] [CrossRef] [Green Version]
  63. Mahajan, G.; Chauhan, B.S.; Timsina, J.; Singh, P.P.; Singh, K. Crop performance and water- and nitrogen-use efficiencies in dry-seeded rice in response to irrigation and fertilizer amounts in northwest India. Field Crop. Res. 2012, 134, 59–70. [Google Scholar] [CrossRef]
  64. Zhang, Y.; Liu, M.; Saiz, G.; Dannenmann, M.; Guo, L.; Tao, Y.; Shi, J.; Zuo, Q.; Butterbach-Bahl, K.; Li, G.; et al. Enhancement of root systems improves productivity and sustainability in water saving ground cover rice production system. Field Crop. Res. 2017, 213, 186–193. [Google Scholar] [CrossRef]
  65. Zhang, J.; Li, G.; Song, Y.; Liu, Z.; Yang, C.; Tang, S.; Zheng, C.; Wang, S.; Ding, Y. Lodging resistance characteristics of high-yielding rice populations. Field Crop. Res. 2014, 161, 64–74. [Google Scholar] [CrossRef]
  66. Zaman, U.; Ahmad, Z.; Farooq, M.; Saeed, S.; Ahmad, M.; Wakeel, A. Potassium fertilization may improve stem strength and yield of basmati rice grown on nitrogen-fertilized soils. Pak. J. Agric. Sci. 2015, 52, 439–445. [Google Scholar]
  67. Cao, Q.; Miao, Y.; Shen, J.; Yu, W.; Yuan, F.; Cheng, S.; Huang, S.; Wang, H.; Yang, W.; Liu, F. Improving in-season estimation of rice yield potential and responsiveness to topdressing nitrogen application with Crop Circle active crop canopy sensor. Precis. Agric. 2016, 17, 136–154. [Google Scholar] [CrossRef]
  68. Lu, J.; Miao, Y.; Shi, W.; Li, J.; Yuan, F. Evaluating different approaches to non-destructive nitrogen status diagnosis of rice using portable RapidSCAN active canopy sensor. Sci. Rep. 2017, 7, 14073. [Google Scholar] [CrossRef]
  69. Huang, S.; Miao, Y.; Yuan, F.; Gnyp, M.; Yao, Y.; Cao, Q.; Wang, H.; Lenzwiedemann, V.; Bareth, G. Potential of RapidEye and WorldView-2 satellite data for improving rice nitrogen status monitoring at different growth stages. Remote Sens. 2017, 9, 227. [Google Scholar] [CrossRef] [Green Version]
  70. Zha, H.; Miao, Y.; Wang, T.; Li, Y.; Zhang, J.; Sun, W.; Feng, Z.; Kusnierek, K. Improving unmanned aerial vehicle remote sensing-based rice nitrogen nutrition index prediction with machine learning. Remote Sens. 2020, 12, 215. [Google Scholar] [CrossRef] [Green Version]
Figure 1. The average daily temperature and monthly rainfall in the 2011–2013 experimental period compared to the 20-year (1991–2010) normal in Jiansanjiang, Heilongjiang Province, China.
Remotesensing 14 02440 g001
Figure 2. An unmanned aerial vehicle remote sensing image showing the field experimental plots (a), ratio vegetation index (RVI) map showing average RVI values in each plot at stem elongation stage in 2013 and corresponding treatments (b), active canopy sensor data collection (c), and rice crop growth close to maturity (d). CK: control; FP: farmer practice; RORM: regional optimum rice management; CM_PRM: chlorophyll meter-based precision rice management; GS_PRM: GreenSeeker sensor-based precision rice management; SHY1: super-high-yield management 1; SHY2: super-high-yield management 2.
Remotesensing 14 02440 g002
Figure 3. The three-year (2011–2013) average of aboveground biomass of two rice varieties, Kongyu 131 (top) and Longjing 21 (bottom), at different growth stages produced in different rice management systems. CK, FP, RORM, CM_PRM, and GS_PRM represent check treatment, farmer’s practice, regional optimum rice management, chlorophyll meter-based precision rice management, and GreenSeeker sensor-based precision rice management, respectively. Different letters indicate significant differences at p < 0.05 level at the same growth stage. The error bars indicate the standard deviations.
Remotesensing 14 02440 g003
Figure 4. The three-year (2011–2013) average of plant nitrogen accumulation of two rice varieties, Kongyu 131 (top) and Longjing 21 (bottom), at different growth stages produced in different rice management systems. CK, FP, RORM, CM_PRM, and GS_PRM represent check, farmer’s practice, regional optimum rice management, chlorophyll meter-based precision rice management, and GreenSeeker sensor-based precision rice management, respectively. Different letters indicate significant differences at p < 0.05 level at the same growth stage. The error bars indicate the standard deviations.
Remotesensing 14 02440 g004
Figure 5. Grain yield in different rice management systems of two rice varieties, Kongyu 131 (top) and Longjing 21 (bottom), from 2011 to 2013. CK, FP, RORM, CM_PRM, and GS_PRM represent check treatment, farmer’s practice, regional optimum rice management, chlorophyll meter-based precision rice management, and GreenSeeker sensor-based precision rice management, respectively. Different letters indicate significant differences at p < 0.05 level in the same year. The error bars indicate the standard deviations.
Remotesensing 14 02440 g005
Figure 6. Nitrogen application rates and nitrogen use efficiency parameters of different rice management systems of two rice varieties, Kongyu 131 (left) and Longjing 21 (right), from 2011–2013. CK, FP, RORM, CM_PRM, and GS_PRM represent check, farmer’s practice, regional optimum rice management, chlorophyll meter-based precision rice management, and GreenSeeker sensor-based precision rice management, respectively. Different letters indicate significant differences at p < 0.05 level in the same year. The error bars indicate standard deviations. There are no error bars for nitrogen rate difference between FP and RORM (FP-RORM), because there was no change in the amount of nitrogen applied in the FP and RORM systems from 2011 to 2013.
Remotesensing 14 02440 g006
Figure 7. The milling quality of different rice management systems of two rice varieties, Kongyu 131 (left) and Longjing 21 (right), from 2011–2013. CK, FP, RORM, CM_PRM, and GS_PRM represent check, farmer’s practice, regional optimum rice management, chlorophyll meter-based precision rice management, and GreenSeeker sensor-based precision rice management, respectively. Different letters indicate significant differences at p < 0.05 level in the same year. The error bars indicate standard deviations.
Remotesensing 14 02440 g007
Figure 8. The appearance quality traits of different rice management systems of two rice varieties, Kongyu 131 (left) and Longjing 21 (right), from 2011–2013. CK, FP, RORM, CM_PRM, and GS_PRM represent check, farmer’s practice, regional optimum rice management, chlorophyll meter-based precision rice management, and GreenSeeker sensor-based precision rice management, respectively. Different letters indicate significant differences at p < 0.05 level in the same year. The error bars indicate standard deviations.
Remotesensing 14 02440 g008
Figure 9. The nutritional quality traits of different rice management systems of two rice varieties, Kongyu 131 (left) and Longjing 21 (right), from 2011–2013. CK, FP, RORM, CM_PRM, and GS_PRM represent check, farmer’s practice, regional optimum rice management, chlorophyll meter-based precision rice management, and GreenSeeker sensor-based precision rice management, respectively. Different letters indicate significant differences at p < 0.05 level in the same year. The error bars indicate standard deviations.
Remotesensing 14 02440 g009
Table 1. Average values ± standard deviations of grain yield components obtained in different rice management systems with rice variety Kongyu 131 from 2011–2013.
YearTreatmentPanicle Number (m−2)Grains/PanicleFilled Grains (%)1000-Grain Weight (g)Harvest Index (%)
2011CK513 ± 6.2 c58.1 ± 0.45 b96.1 ± 0.57 a27.6 ± 0.10 a48.3 ± 2.30 a
FP606 ± 16.3 b68.6 ± 0.72 a89.9 ± 0.86 b26.5 ± 0.15 b51.0 ± 2.34 a
RORM661 ± 12.7 a70.2 ± 0.98 a92.9 ± 1.14 ab26.6 ± 0.15 b52.3 ± 0.92 a
CM_PRM671 ± 16.3 a70.0 ± 0.87 a91.0 ± 1.06 b26.6 ± 0.12 b52.2 ± 2.00 a
GS_PRM680 ± 23.0 a69.7 ± 1.11 a91.6 ± 1.69 b26.7 ± 0.19 b53.0 ± 1.35 a
2012CK510 ± 9.0 c56.6 ± 0.41 b94.0 ± 0.16 a27.7 ± 0.12 a48.5 ± 1.41 a
FP614 ± 18.5 b74.0 ± 0.49 a85.8 ± 1.03 c26.5 ± 0.31 b52.7 ± 1.53 a
RORM677 ± 21.7 a76.5 ± 0.67 a90.9 ± 0.99 ab26.7 ± 0.27 b51.9 ± 1.29 a
CM_PRM687 ± 19.1 a76.0 ± 1.26 a88.8 ± 0.91 bc26.8 ± 0.18 b53.3 ± 1.87 a
GS_PRM694 ± 14.2 a76.2 ± 1.24 a88.0 ± 0.98 bc26.8 ± 0.28 b53.4 ± 1.87 a
2013CK507 ± 6.2 c50.3 ± 0.30 c93.1 ± 0.17 a27.2 ± 0.13 a49.6 ± 0.69 a
FP608 ± 16.0 b67.3 ± 0.72 b85.0 ± 0.81 b25.5 ± 0.27 c51.4 ± 3.30 a
RORM650 ± 15.3 a71.3 ± 0.45 a86.7 ± 0.72 b25.9 ± 0.16 b52.2 ± 0.94 a
CM_PRM665 ± 13.2 a70.7 ± 0.37 a87.3 ± 0.91 b25.8 ± 0.10 bc52.0 ± 2.46 a
GS_PRM672 ± 16.0 a71.3 ± 0.97 a86.6 ± 0.82 b25.7 ± 0.12 bc52.0 ± 2.75 a
Analysis of variance (F)Treatment************NS
YearNS*********NS
Treatment × YearNS***NSNSNS
Note: CK, check treatment; FP, farmer’s practice; RORM, regional optimum rice management; CM_PRM, chlorophyll meter-based precision rice management; GS_PRM, GreenSeeker sensor-based precision rice management. Values followed by different letters are significantly different (p < 0.05) within a column in the same year. *** p < 0.001; NS: p > 0.05.
Table 2. Average values ± standard deviations of grain yield components obtained in different rice management systems with rice variety Longjing 21 from 2011–2013.
YearTreatmentPanicle Number (m−2)Grains/PanicleFilled Grains (%)1000-Grain Weight (g)Harvest Index (%)
2011CK399 ± 16.8 c66.7 ± 0.39 b96.8 ± 0.66 a28.4 ± 0.08 a46.0 ± 1.03 a
FP493 ± 17.9 b82.0 ± 0.91 a89.4 ± 1.01 b26.4 ± 0.16 c45.9 ± 0.49 a
RORM545 ± 11.9 ab83.7 ± 0.57 a90.9 ± 0.68 b26.9 ± 0.19 b46.5 ± 1.14 a
CM_PRM549 ± 23.8 ab82.8 ± 0.95 a91.7 ± 1.10 b26.9 ± 0.19 bc46.9 ± 2.32 a
GS_PRM563 ± 19.6 a83.8 ± 0.77 a92.1 ± 1.02 b26.5 ± 0.16 bc46.9 ± 1.64 a
2012CK405 ± 10.9 c67.7 ± 0.50 b94.7 ± 0.48 a28.4 ± 0.06 a46.8 ± 0.93 a
FP501 ± 14.2 b86.6 ± 0.71 a86.5 ± 1.06 b26.4 ± 0.27 b47.1 ± 2.43 a
RORM537 ± 13.1 ab90.2 ± 1.24 a89.4 ± 0.93 b26.5 ± 0.12 b47.6 ± 0.51 a
CM_PRM566 ± 14.1 a89.9 ± 0.86 a88.5 ± 1.40 b26.4 ± 0.21 b47.6 ± 2.16 a
GS_PRM558 ± 18.1 a88.2 ± 1.55 a87.1 ± 1.06 b26.5 ± 0.10 b48.0 ± 0.78 a
2013CK415 ± 6.3 d61.3 ± 0.19 b92.6 ± 0.31 a27.9 ± 0.10 a48.3 ± 0.30 a
FP488 ± 19.2 c83.3 ± 0.82 a83.2 ± 0.74 b25.7 ± 0.22 b50.8 ± 3.50 a
RORM505 ± 13.5 bc84.7 ± 0.60 a85.0 ± 0.84 b25.8 ± 0.17 b50.6 ± 1.58 a
CM_PRM534 ± 21.3 ab84.7 ± 0.73 a85.1 ± 0.83 b25.8 ± 0.21 b50.3 ± 1.38 a
GS_PRM543 ± 6.9 a85.3 ± 0.96 a84.3 ± 0.56 b25.8 ± 0.23 b51.2 ± 1.64 a
Analysis of variance (F)Treatment************NS
YearNS*********NS
Treatment × YearNS**NSNSNS
Note: CK, check treatment; FP, farmer’s practice; RORM, regional optimum rice management; CM_PRM, chlorophyll meter-based precision rice management; GS_PRM, GreenSeeker sensor-based precision rice management. Values followed by different letters are significantly different (p < 0.05) within a column in the same year. *** p < 0.001; ** p < 0.01; NS: p > 0.05.
Table 3. Lodging resistance parameters (average values ± standard deviations) of different rice management systems for rice variety Kongyu 131 from 2011 to 2013.
YearTreatmentN4 Internode Length (cm)Plant Height
(cm)
Fresh Weight per Plant (g)Breaking Strength
(g cm)
Lodging Index (%)
2011CK10.3 ± 0.15 d70.1 ± 0.30 d4.83 ± 0.21 b774 ± 19.48 a43.8 ± 1.97 d
FP18.2 ± 0.20 a88.2 ± 0.10 a7.13 ± 0.21 a489 ± 4.10 d128.6 ± 2.89 a
RORM16.7 ± 0.17 c84.3 ± 0.40 c6.90 ± 0.20 a614 ± 3.21 b94.8 ± 3.69 c
CM_PRM16.8 ± 0.10 bc84.9 ± 0.20 b7.13 ± 0.15 a609 ± 8.96 bc99.4 ± 2.78 b
GS_PRM16.9 ± 0.17 b84.7 ± 0.32 bc7.03 ± 0.21 a593 ± 10.31 c100.5 ± 2.23 b
2012CK9.7 ± 0.20 c68.8 ± 0.50 d4.80 ± 0.20 c797 ± 8.93 a41.5 ± 2.02 d
FP18.3 ± 0.20 a89.1 ± 0.51 a6.80 ± 0.30 a492 ± 9.96 c123.1 ± 2.70 a
RORM16.8 ± 0.30 b84.7 ± 0.31 c6.20 ± 0.30 b563 ± 7.02 b93.2 ± 3.58 c
CM_PRM16.9 ± 0.26 b86.5 ± 0.25 b6.30 ± 0.30 ab554 ± 9.05 b98.5 ± 5.98 bc
GS_PRM17.1 ± 0.26 b87.0 ± 0.35 b6.40 ± 0.17 ab548 ± 7.97 b101.6 ± 2.24 b
2013CK9.4 ± 0.11 c67.6 ± 0.82 d4.50 ± 0.17 b811 ± 7.10 a37.5 ± 0.74 c
FP17.8 ± 0.46 a87.5 ± 0.72 a6.80 ± 0.17 a502 ± 18.59 c118.6 ± 3.66 a
RORM16.2 ± 0.36 b83.6 ± 0.93 c6.50 ± 0.20 a614 ± 12.39 b88.5 ± 3.51 b
CM_PRM16.5 ± 0.36 b85.3 ± 1.11 b6.70 ± 0.26 a610 ± 11.34 b93.7 ± 3.09 b
GS_PRM16.3 ± 0.26 b84.7 ± 0.97 bc6.60 ± 0.26 a619 ± 11.50 b90.4 ± 3.96 b
Analysis of variance (F)Treatment***************
Year***************
Treatment × YearNS***NS***NS
Note: CK, check treatment; FP, farmer’s practice; RORM, regional optimum rice management; CM_PRM, chlorophyll meter-based precision rice management; GS_PRM, GreenSeeker sensor-based precision rice management. Values followed by different letters are significantly different (p < 0.05) within a column in the same year. *** p < 0.001; NS: p > 0.05.
Table 4. Lodging resistance parameters (average values ± standard deviations) of different rice management systems for rice variety Longjing 21 from 2011 to 2013.
YearTreatmentN4 Internode Length (cm)Plant Height (cm)Fresh Weight per Plant (g)Breaking Strength
(g cm)
Lodging Index (%)
2011CK14.0 ± 0.30 c75.2 ± 0.40 d6.23 ± 0.25 b896 ± 12.12 a52.4 ± 3.10 d
FP22.2 ± 0.30 a96.5 ± 0.66 a9.03 ± 0.15 a670 ± 6.55 c130.1 ± 2.24 a
RORM20.3 ± 0.20 b92.1 ± 1.89 c9.03 ± 0.25 a887 ± 6.55 ab93.9 ± 3.83 c
CM_PRM20.4 ± 0.25 b93.8 ± 0.26 bc9.10 ± 0.26 a883 ± 6.75 b96.7 ± 2.34 bc
GS_PRM20.3 ± 0.21 b94.2 ± 0.46 b9.20 ± 0.20 a878 ± 8.36 b98.7 ± 0.77 b
2012CK12.6 ± 0.26 d75.4 ± 0.96 d6.50 ± 0.30 b926 ± 7.10 a52.9 ± 2.94 c
FP22.0 ± 0.20 a97.7 ± 0.59 a9.00 ± 0.35 a685 ± 5.85 d128.4 ± 4.67 a
RORM19.6 ± 0.30 c93.2 ± 0.87 c8.90 ± 0.26 a842 ± 25.51 c98.6 ± 4.59 b
CM_PRM20.2 ± 0.36 b94.2 ± 0.62 bc9.00 ± 0.20 a858 ± 9.40 bc98.8 ± 1.65 b
GS_PRM19.8 ± 0.36 bc95.0 ± 1.32 b9.20 ± 0.26 a861 ± 13.09 b101.5 ± 3.61 b
2013CK12.4 ± 0.30 c73.4 ± 0.78 d5.60 ± 0.26 b948 ± 14.03 a43.4 ± 1.75 c
FP21.4 ± 0.62 a95.6 ± 0.80 a8.70 ± 0.30 a692 ± 10.31 c120.3 ± 5.95 a
RORM19.7 ± 0.26 b92.3 ± 0.67 c8.50 ± 0.26 a901 ± 9.66 b87.1 ± 3.38 b
CM_PRM20.0 ± 0.53 b93.5 ± 1.15 bc8.60 ± 0.30 a910 ± 11.85 b88.4 ± 3.37 b
GS_PRM20.1 ± 0.30 b94.1 ± 0.89 b8.70 ± 0.26 a907 ± 11.48 b90.3 ± 2.45 b
Analysis of variance (F)Treatment***************
Year***************
Treatment × Year*NSNS***NS
Note: CK, check treatment; FP, farmer’s practice; RORM, regional optimum rice management; CM_PRM, chlorophyll meter-based precision rice management; GS_PRM, GreenSeeker sensor-based precision rice management. Values followed by different letters are significantly different (p < 0.05) within a column in the same year. *** p < 0.001; * p < 0.05; NS: p > 0.05.
Publisher’s Note: MDPI stays neutral with regard to jurisdictional claims in published maps and institutional affiliations.

