
Rescaling-Assisted Super-Resolution for Medium-Low Resolution Remote Sensing Ship Detection


1
College of Electronic Science and Technology, National University of Defense Technology, Changsha 410073, China
2
Unit 32032 of PLA, Beijing 100094, China
*
Author to whom correspondence should be addressed.
Remote Sens. 2022, 14(11), 2566; https://doi.org/10.3390/rs14112566
Submission received: 27 March 2022
/
Revised: 23 May 2022
/
Accepted: 23 May 2022
/
Published: 27 May 2022
(This article belongs to the Topic Big Data and Artificial Intelligence)
Abstract
:Medium-low resolution (M-LR) remote sensing ship detection is a challenging problem due to the small target sizes and insufficient appearance information. Although image super resolution (SR) has become a popular solution in recent years, the ability of image SR is limited since much information is lost in input images. Inspired by the powerful information embedding ability of the encoder in image rescaling, in this paper, we introduce image rescaling to guide the training of image SR. Specifically, we add an adaption module before the SR network, and use the pre-trained rescaling network to guide the optimization of the adaption module. In this way, more information is embedded in the adapted M-LR images, and the subsequent SR module can utilize more information to achieve better performance. Extensive experimental results demonstrate the effectiveness of our method on image SR. More importantly, our method can be used as a pre-processing approach to improve the detection performance.
1. Introduction
Medium-low resolution (M-LR) remote sensing images (with the ground sample distance (GSD) larger than 10 m/pixel) play an important role in marine monitoring [1], rescuing [2] and management [3]. Meanwhile, ship detection is a significant component of remote sensing image interpretation. However, the lower resolution means the ship targets have smaller sizes and less appearance information, and this introduces challenges for ship detection task in M-LR images. With the ability of recovering image detail information, image super-resolution (SR) has become a popular solution for small object detection in recent years [4,5,6,7,8]. However, the ability of image SR is limited since it is an ill-posed problem and much information is lost in input images. In this paper, we propose a rescaling assisted image SR method (RASR) to better recover the lost information, and thus improve the performance of image SR and ship detection.
Image rescaling tries to learn an invertible down-sampling encoder, and the original images can be recovered greatly by using the corresponding up-sampling decoder. Different from image SR, image rescaling considers image down-sampling and up-sampling as a dual problem, and jointly optimizes them to minimize the lost information during the down-sampling process. Compared to only a decoder (i.e., an SR model), image rescaling can preserve more information during the down-sampling process, and thus achieves a better restoration performance. Inspired by the powerful information embedding ability of the rescaling encoder, we introduce image rescaling to assist the image SR process. Specifically, we add an adaption module before the SR network, and use the pre-trained rescaling network to guide the optimization of the adaption module. In this way, more information is embedded in the adapted M-LR images and transferred to the SR module. Consequently, our rescaling assisted image SR method (named RASR) can achieve better SR performance. Furtherly, we take RASR as a pre-processing approach, and develop RASR-Det to improve the detection performance on M-LR images.
In summary, the contributions of our work are as follows:
- Inspired by the powerful information embedding ability of the encoder in image rescaling, we propose a rescaling assisted image SR method to better restore the lost information in M-LR images.
- We conduct extensive ablation studies to investigate the effectiveness of RASR. Moreover, we compare our RASR with several SR methods on three public datasets. Comparative results demonstrate the competitive performance of our method.
- Taking RASR as a pre-processing approach, we develop RASR-Det to improve the ship detection performance on M-LR images. Experimental results demonstrate the effectiveness of our RASR-Det in handling the M-LR remote sensing ship detection problem.
2. Related Works
2.1. Image Super Resolution
Image super-resolution (SR) aims at reconstructing a high-resolution (HR) image from one or multiple low-resolution observations. Recently, deep learning has been successfully applied to image SR and has achieved continuously improving performance. Readers can refer to recent surveys [9,10] for a comprehensive overview of image SR. Here, we review several major works in the literature. Dong et al. [11] proposed the first CNN-based single image SR method to reconstruct HR images by using a three-layer CNN. Kim et al. [12] proposed a deeper network named VDSR to improve the reconstruction accuracy. Zhang et al. [13] combined residual connection [14] with dense connection [15], and proposed residual dense network (i.e., RDN) to fully exploit hierarchical feature representations for image SR. Li et al. [16] proposed a multiscale residual network to fully exploit the hierarchical feature representation for image super-resolution. Wang et al. [17] explored the sparsity prior in image SR and used sparse convolutions to achieve accurate and efficient image SR. Subsequently, Wang et al. [18] proposed a degradation-aware network and achieved image SR with arbitrary blur kernels and noise levels. Although these SR methods have shown their effectiveness, the ability of image SR is limited since much information is lost in input degradation images.
2.2. Image Rescaling
Image Rescaling is usually used to fit the displays of various resolutions and save the storage. Kim et al. [19] proposed an auto-encoder-based framework that enables joint learning of the down-scaling network and the up-scaling network to maximize the restoration performance. Sun et al. [20] proposed a learned image downscaling method based on content adaptive resampler with consideration of the up-scaling process. Xiao et al. [21] proposed an invertible rescaling net that can produce visually-pleasing low-resolution images and meanwhile capture the distribution of the lost information using a latent variable following a specified distribution in the down-scaling process. In this paper, we introduce an image rescaling method to assist image SR in recovering more detail information.
2.3. SR-Based Detectors
In recent years, image SR has become a popular solution in remote sensing small object detection tasks. Dong et al. [4] proposed a second-order multi-scale SR network to make full use of the multi-scale information, and demonstrated its effectiveness on object classification. Rabbi et al. [5] proposed an edge-enhanced SR generative adversarial network (EESRGAN), and combined it with Faster-RCNN [22] and SSD [23] in an end-to-end manner to improve the detection accuracy. Courtrai et al. [6] tailored a GAN-based SR network with a detection network to improve the performance of both image SR and object detection. Wang et al. [7] designed a feature-driven loss function to make the SR network more suitable for the detection task. Noh et al. [8] enhanced the features of small regions of interest using the feature-level SR technique, and thus improved the detection performance. Zou et al. [24] fed both the super-solved images and the intermediate features to detection network to improve the detection performance. He et al. [25] introduced feature distillation to fully exploit the information in ground-truth HR images to handle M-LR ship detection. Similarly to some SR-based detectors [4,5], we use our proposed RASR as a pre-processing approach, and develop RASR-Det to further improve the performance of the M-LR ship detection task.
3. Methodology
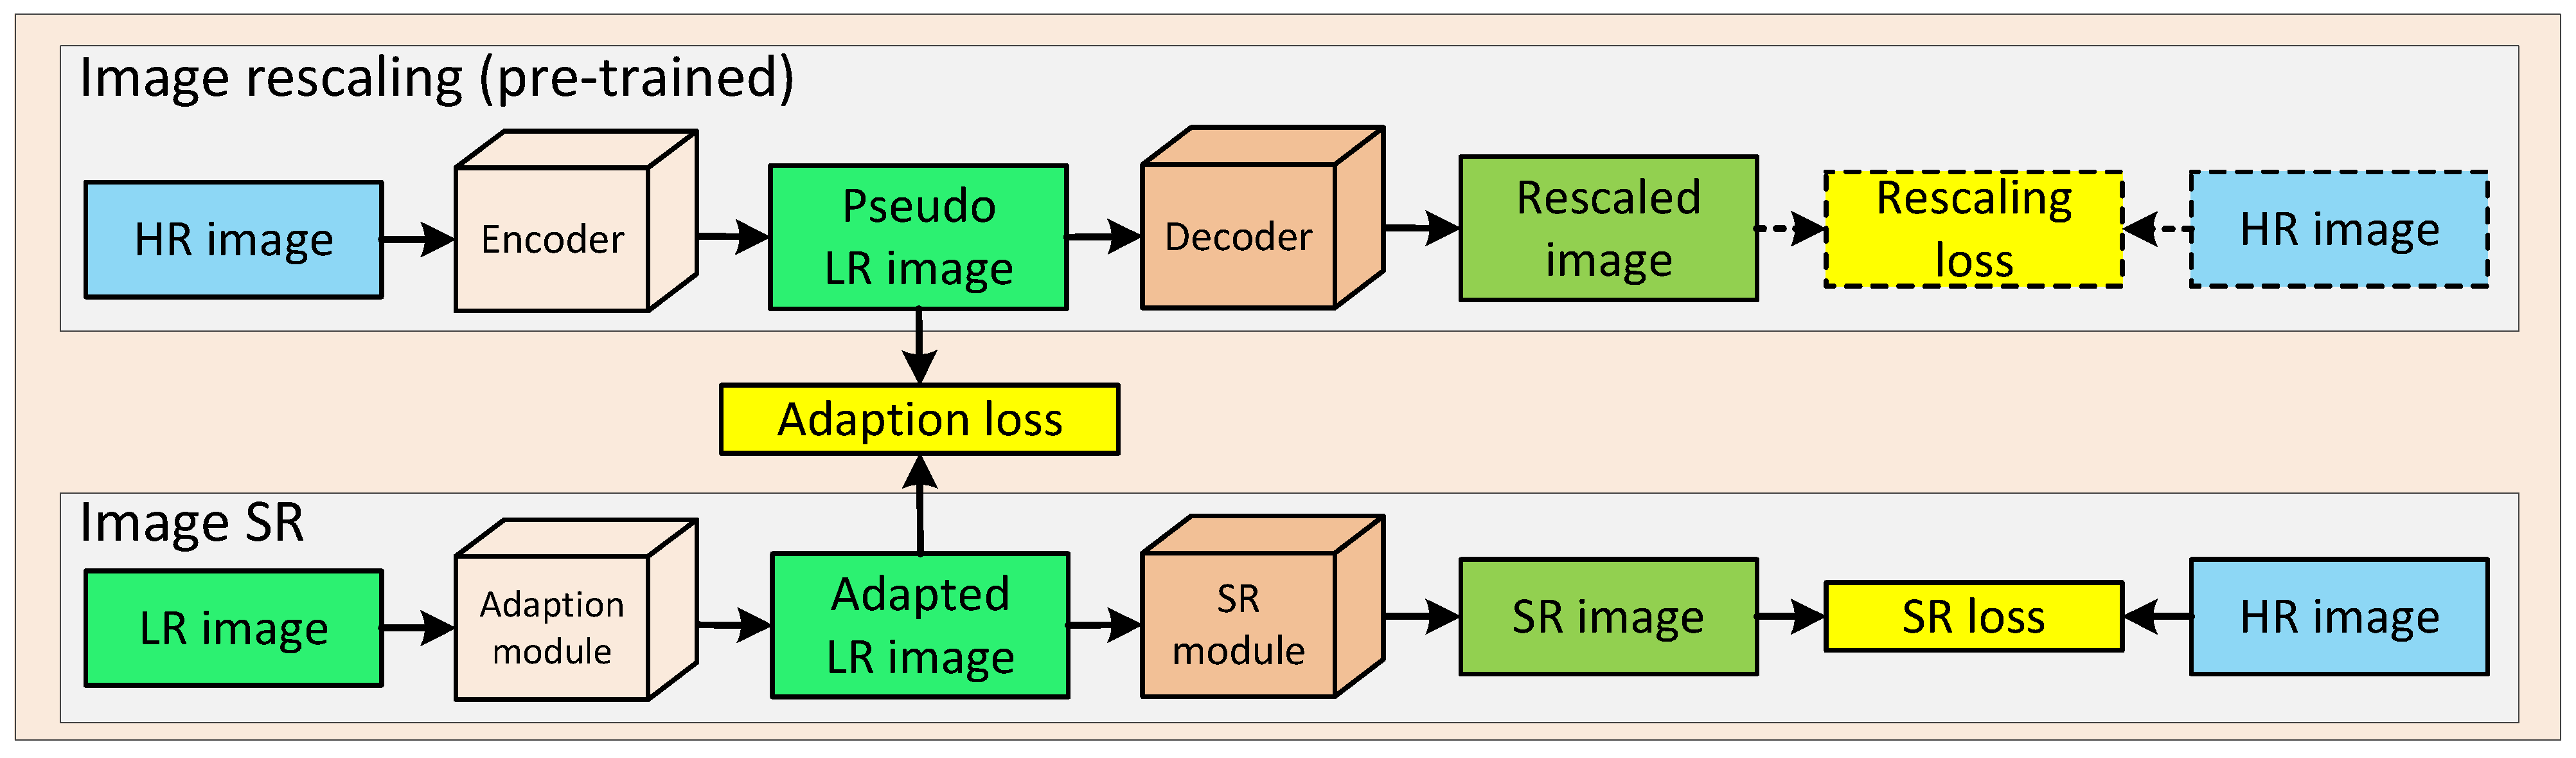
In this section, we introduce our proposed RASR method in detail. As shown in Figure 1, our method consists of two parts, including image rescaling and image SR. Image rescaling uses an encoder and a decoder to perform down-sampling and up-sampling operations, respectively. We name the down-sampled images as pseudo LR images, since they carry more information that is beneficial to image SR than the original M-LR images. Image SR consists of an image adaption module and an SR module, and the output of the two modules are adapted images and SR images, respectively. In our method, image rescaling is pre-trained first to generate informative pseudo LR images, and thus, to guide the training of image SR. The pre-training of image rescaling is under the supervision of a rescaling loss between rescaled images and HR images. Then, image rescaling guides the adaption module through a specific adaption loss between the pseudo LR images and the adapted images, and thus the adaption module can learn to transform the original LR images to a more informative version (i.e., adapted images). In this way, the subsequent SR module can utilize more information and achieves better performance. In the following subsections, we introduce the structure of each module in detail.
3.1. Image Rescaling
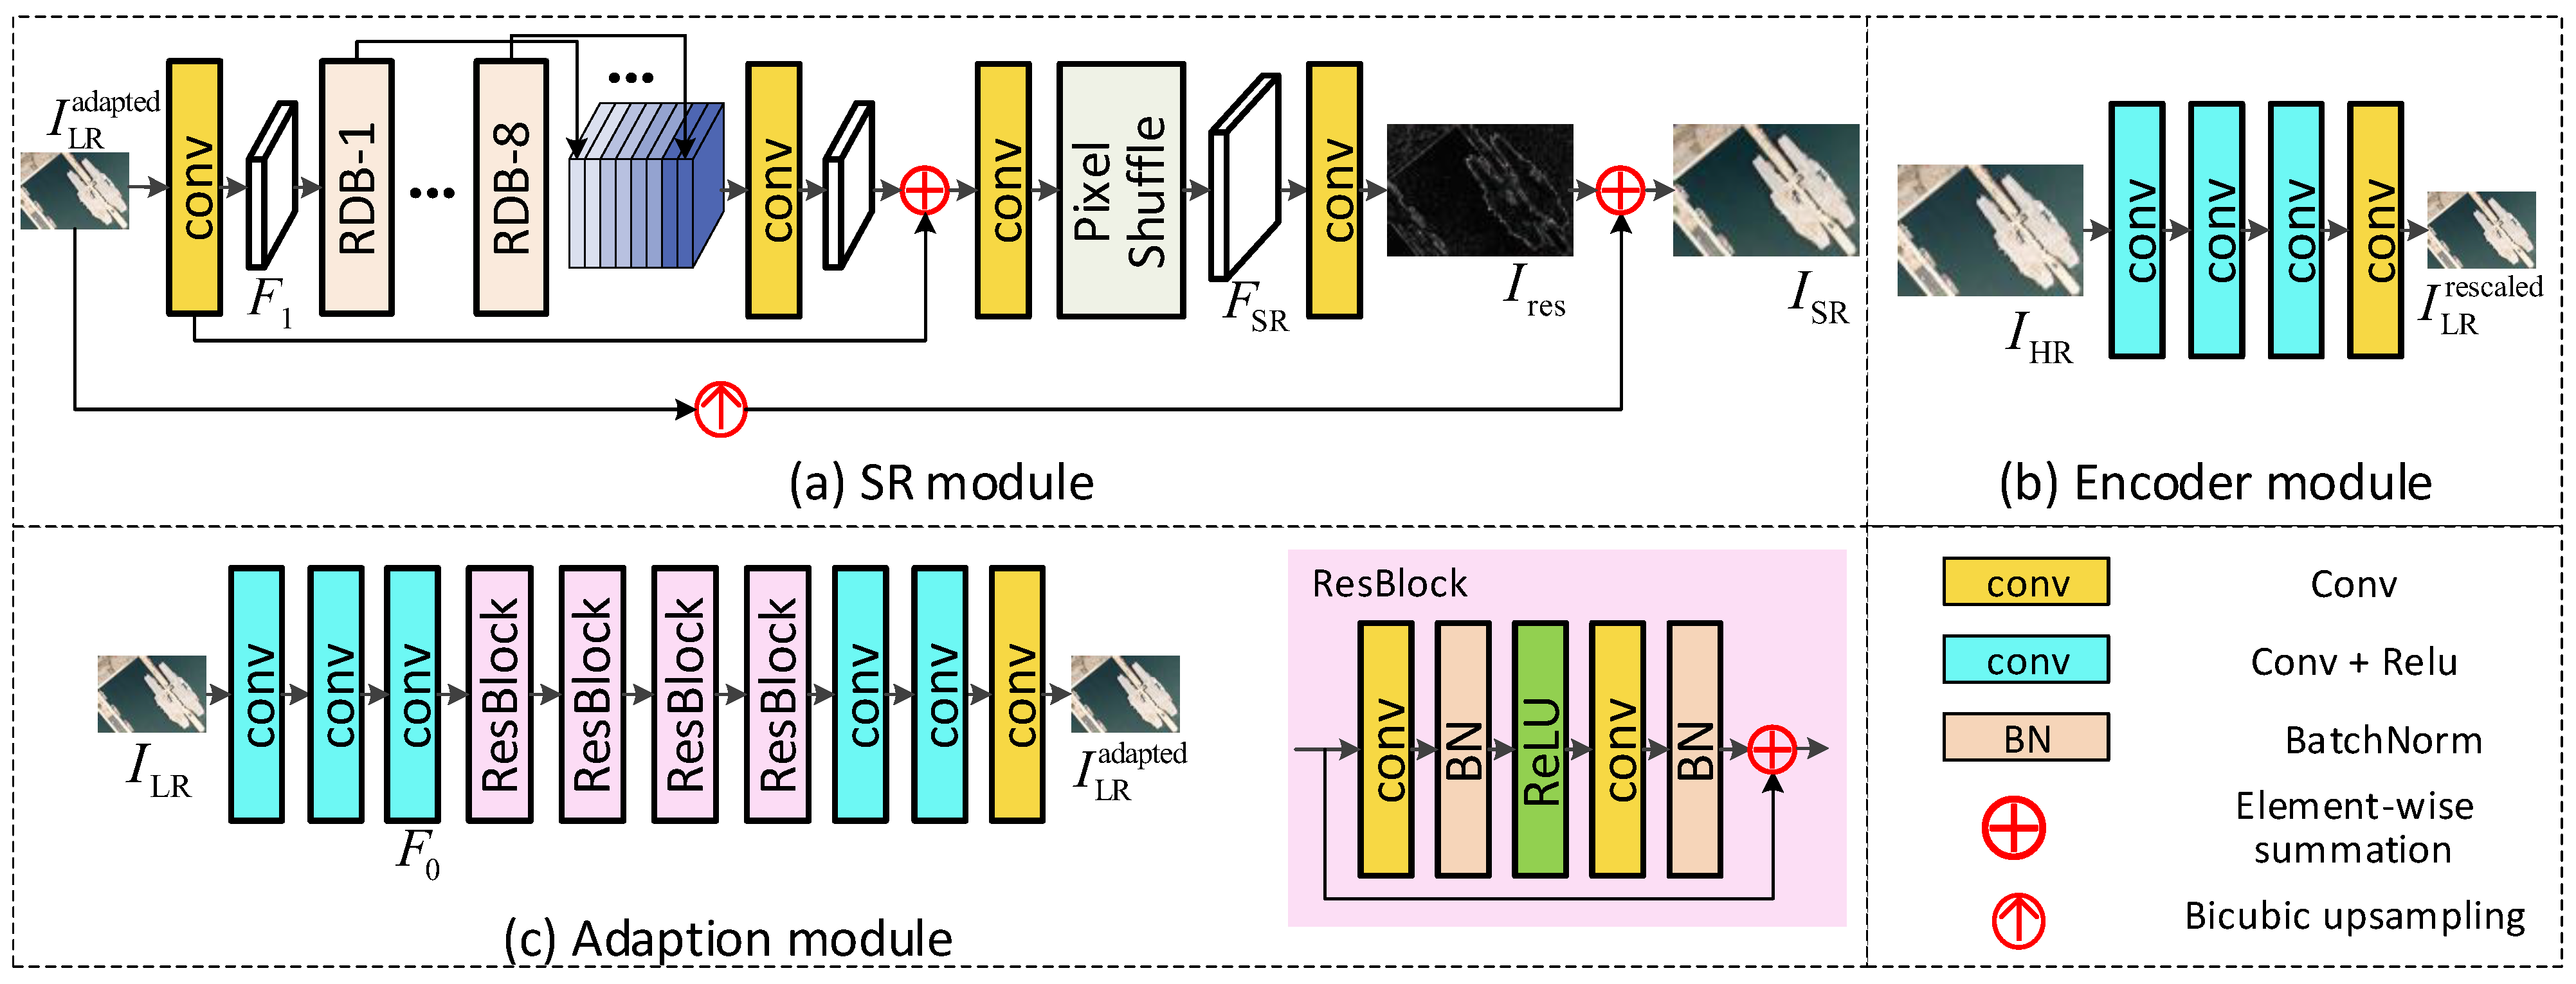
Image rescaling takes an HR image as its input and produces an intermediate pseudo LR image and a rescaled image , where H and W represent the height and width of the input M-LR image (i.e., ), and denotes the upscaling factor. We followed [26] to develop our encoder module. Specifically, as shown in Figure 2b, the encoder module consists of four convolution layers. All the convolution layers in our encoder have a stride of 1 except for the second one (which has a stride ). The kernel sizes of the first two and the last two convolutions are 5 × 5 and 3 × 3, respectively. The decoder module has the same architecture as the SR module (as shown in Figure 2a), which will be introduced in the following subsections.
3.2. Rescaling Assisted Image SR
Since image rescaling is an invertible dual problem, the intermediate pseudo LR images have more detail information and can be used to guide the training of image SR. Specifically, we add an adaption module before the SR module to transfer an original M-LR image to an informative one, and then the SR module takes the adapted M-LR image instead as input to perform image SR. The details of the adaption and SR modules are as follows.
Adaption Module. As shown in Figure 2c, the adaption module consists of six convolutions and four residual blocks. Specifically, the input image is first fed to three 3 × 3 convolutions to generate initial feature . Then, is fed to residual blocks for deep feature extraction, and the extracted features are then fed to three 3 × 3 convolutions to produce the adapted LR image (i.e., ). The structure of the residual block is shown in Figure 2c. Note that we use PReLU [27] as the non-linear layer.
SR Module. As shown in Figure 2a, the SR module takes the adapted image as input, and generates the super-resolved image . Specifically, the input image is first fed to a 3 × 3 convolution and eight residual dense blocks (RDBs) to generate initial feature and eight deep features. Then, the extracted deep features are concatenated and fed to a 3 × 3 convolution for global feature fusion. After that, the fused feature is added with the initial feature and fed to a sub-pixel layer [28] to generate residual feature . Finally, the residual feature is fed to a 3 × 3 convolution to produce residual image , and the final output image is the pixel sum of and the up-sampling version of .
3.3. Loss Function
The training process of our RASR consists of two stages: the pre-training of image rescaling and the training of RASR.
In the first stage, we pre-train the image rescaling part with a rescaling loss, which can be defined as Equation (1), where represents the L1 distance (i.e., ) between output rescaled image and HR image .
In the second stage, we use the generated pseudo LR images from image rescaling to guide the training of RASR method. The loss function of our RASR is defined as:
where and represent the SR loss and adaption loss, respectively. is a hyper-parameter to balance the SR loss and adaption loss, and is empirically set to 0.1 in our implementation. In our method, is the L1 distance between the ground-truth image and the super-resolved image ; is the L1 distance between the pseudo LR image and the adapted LR image .
4. Experiments
In this section, we first introduce the datasets and implementation details, then conduct ablation studies to validate the effectiveness of RASR for bothimage SR and ship detection. Moreover, we compare RASR with several SR methods to investigate the superiority of RASR. Finally, we use RASR as a pre-processing approach and choose Faster-RCNN as the detector to develop RASR-Faster-RCNN, and compare it with several state-of-the-art detection methods.
4.1. Datasets and Implementation Details
4.1.1. Datasets
- HRSC2016: HRSC2016 is a public ship dataset in remote sensing images, and contains 436 images for training, 181 images for validation and 438 images for test. In our experiment, we use both the train and validation dataset for training and use the test dataset for test. The GSD of the HRSC2016 dataset is between 0.4 and 2 m/pixel, and the image sizes are between 300 × 300 pixels and 1500 × 900 pixels. As most image sizes are about 1000 × 600, we resized original images to 800 × 512 as the ground-truth HR images.
- DOTA: DOTA is a large-scale dataset used for multi-class object detection in remote sensing images. The sizes of images are between 800 × 800 and 4000 × 4000 pixels. Objects in the dataset have various proportions, directions and shapes. In our experiment, the large-scale images are cropped to patches of 512 × 512 pixels for training and validation. For the ship detection task, we discarded patches without ship targets and retained 4163 patches for training and 1411 patches for test.
- NWPU VHR-10: NWPU VHR-10 dataset is a multi-class object detection dataset with GSD smaller than 2 m/pixel. We performed the same operations as in DOTA dataset to generate training and validation samples. The image sizes are from 533 × 358 to 1728 × 1028 pixels. In our experiment, we cropped the original images into patches of 512 × 512 pixels and discarded patches without ship targets. Our customized NWPU VHR-10 dataset contains 249 images for training and 52 images for test.
In our experiments, the aforementioned images (patches) were used as the ground-truth HR images, and their bicubicly down-sampled versions were used as the M-LR images. Note that since the aligned HR images of real LR images are unavailable, here we use bicubical down-sampling technology to produce aligned HR and LR image pairs for the training of image SR. Although bicubical down-sampling is a rather simpler degradation model than the real scenery, many researches have proved that a model can achieve promising SR performance on real LR images when it can achieve promising SR performance on bicubicly down-sampled images. Moreover, our method can also be used to super-resolve real LR images if the degradation model can be well formulated.
4.1.2. Implementation Details
We implement our RASR and RASR-Det using PyTorch 1.11.0 with an Nvidia RTX 2080Ti GPU.
The training of RASR. We trained the RASR following a two stage pipeline. In the first stage, we pre-trained the image rescaling network. During training, we randomly cropped the ground-truth HR images into patches of size 256 × 256 pixels, and performed random flipping for data augmentation. The image rescaling was trained with an L1 loss between the rescaled images and original HR images. The batch size was set to 16 and the learning rate was set to . The rescaling model was optimized using the Adam method [32], and the training was stopped after iterations. In the second stage, we loaded the pre-trained rescaling model, and trained our RASR network with the guide of SR loss and adaption loss. The training settings are the same as the first stage, but the total training iterations was .
The training of Detector. All the detectors in our method are implemented by using the MMDetection [33] framework. When training the detector, the learning rate was initially set to and decreased by a factor of 0.1 when the epoch was 14 and 20. The total number of training epochs was 24, and the batch size was set to 4. We chose SGD [34] as the optimizer. We performed the following data augmentations for all detectors: random flipping, random rotation, random color transformation, random brightness and contrast transformation. Other hyper-parameter settings, such as anchor scales and anchor ratios, are set as the default settings in MMDetection. Furthermore, in our experiments, we can use the training dataset for training, and use the test dataset for performance evaluation.
4.1.3. Evaluation Metrics
Image quality evaluation. We use the Peak Signal-to-Noise Ratio (PSNR) and Structure Similarity Index Measure (SSIM) to measure the quality of super-resolved images. Given a ground-truth image (signed as ) and its corresponding super-resolved image (signed as ), the PSNR value is:
where indicates the mean squared error between and . The SSIM value is:
where and are the mean and variance of image , respectively; and are the mean and variance of image , respectively. is the covariance between and . and are two constants. PSNR and SSIM are calculated in RGB channel space, and we use the average value on three channels as the final results. The SSIM value is between 0 and 1, and higher PSNR and SSIM scores indicate better image SR performance.
In our experiments, we use the average PSNR and SSIM values of whole images on specific datasets to represent the quality of super-resolved images.
Detection performance evaluation. For detection performance evaluation, we followed [33] to use the average precision () as the quantitative metric with the Intersection over Union () being set to 0.5 (i.e., ). We further analyze on ship targets of different sizes: for small targets, for medium targets and for large targets. We use COCO division standard to divide the datasets. Small and large targets means objects with areas smaller than 32 × 32 pixels and larger than 96 × 96 pixels, respectively. Medium targets means the other objects (areas between 32 × 32 and 96 × 96 pixels.)
4.2. Ablation Study
In this section, we conduct extensive ablation studies on the HRSC2016 [29], DOTA [30] and NWPU VHR-10 [31] datasets to validate the effectiveness of our proposed RASR for both image SR and ship detection tasks.
4.2.1. Effectiveness of RASR for Image SR
To validate the effectiveness of our proposed RASR for SR problem, we compare three SR variants: bicubic up-sampling, our SR module and the proposed RASR method. The quantitative evaluation results of image quality achieved by different variants are shown in Table 1. Here, we use the Bicubic down-sampling approach and Bicubic + Gaussian blur degradation approach to generate LR images.
We first validate our method on Bicubic down-sampling degradation. On the HRSC2016 datasets, the PSNR value achieved by RASR is 0.89 and 0.13 dB higher than Bicubic up-sampling and SR module, respectively. Similarly, the SSIM value of our RASR is 0.699, and is also higher than the results of two variants. That is because, with the assistance of image rescaling, the SR module in our RASR can acquire more information from the adapted LR images, and thus improve the SR performance. We also verify the effectiveness of our method on the DOTA and NWPU VHR-10 datasets. Specifically, on the DOTA dataset, the PSNR and SSIM of RASR is 26.31 dB and 0.718, and are higher than the bicubic up-sampling (25.89 dB and 0.672) and SR module (26.12 dB and 0.698). On the NWPU VHR-10 dataset, the PSNR and SSIM of RASR is 30.72 dB and 0.870, and are higher than the bicubic up-sampling (30.18 dB and 0.861) and the SR module (30.48 dB and 0.857). The above results demonstrate the effectiveness of our RASR method.
Then, we extend our ablation experiments on more complex scenarios. Specifically, besides bicubicly down-sampling operation, we add Gaussian blur to original HR images when generating LR images. The sizes of Gaussian kernel are set to 21 × 21, and sigma is set to 8. In this way, LR images are more difficult to be super-resolved. The results are shown in Table 1. It can be observed that the PSNR and SSIM values of different variants on Bicubic + Gaussian blur down-sampling degradation are lower than the bicubic down-sampling degradation. That is because, Bicubic + Gaussian blur degradation lead to more severe information lost in the LR images. Furthermore, on Bicubic + Gaussian blur degradation, PSNR and SSIM values of different variants (i.e., Bicubic, SR module and our RASR) are gradually increasing, which demonstrates the effectiveness and generality of our method.
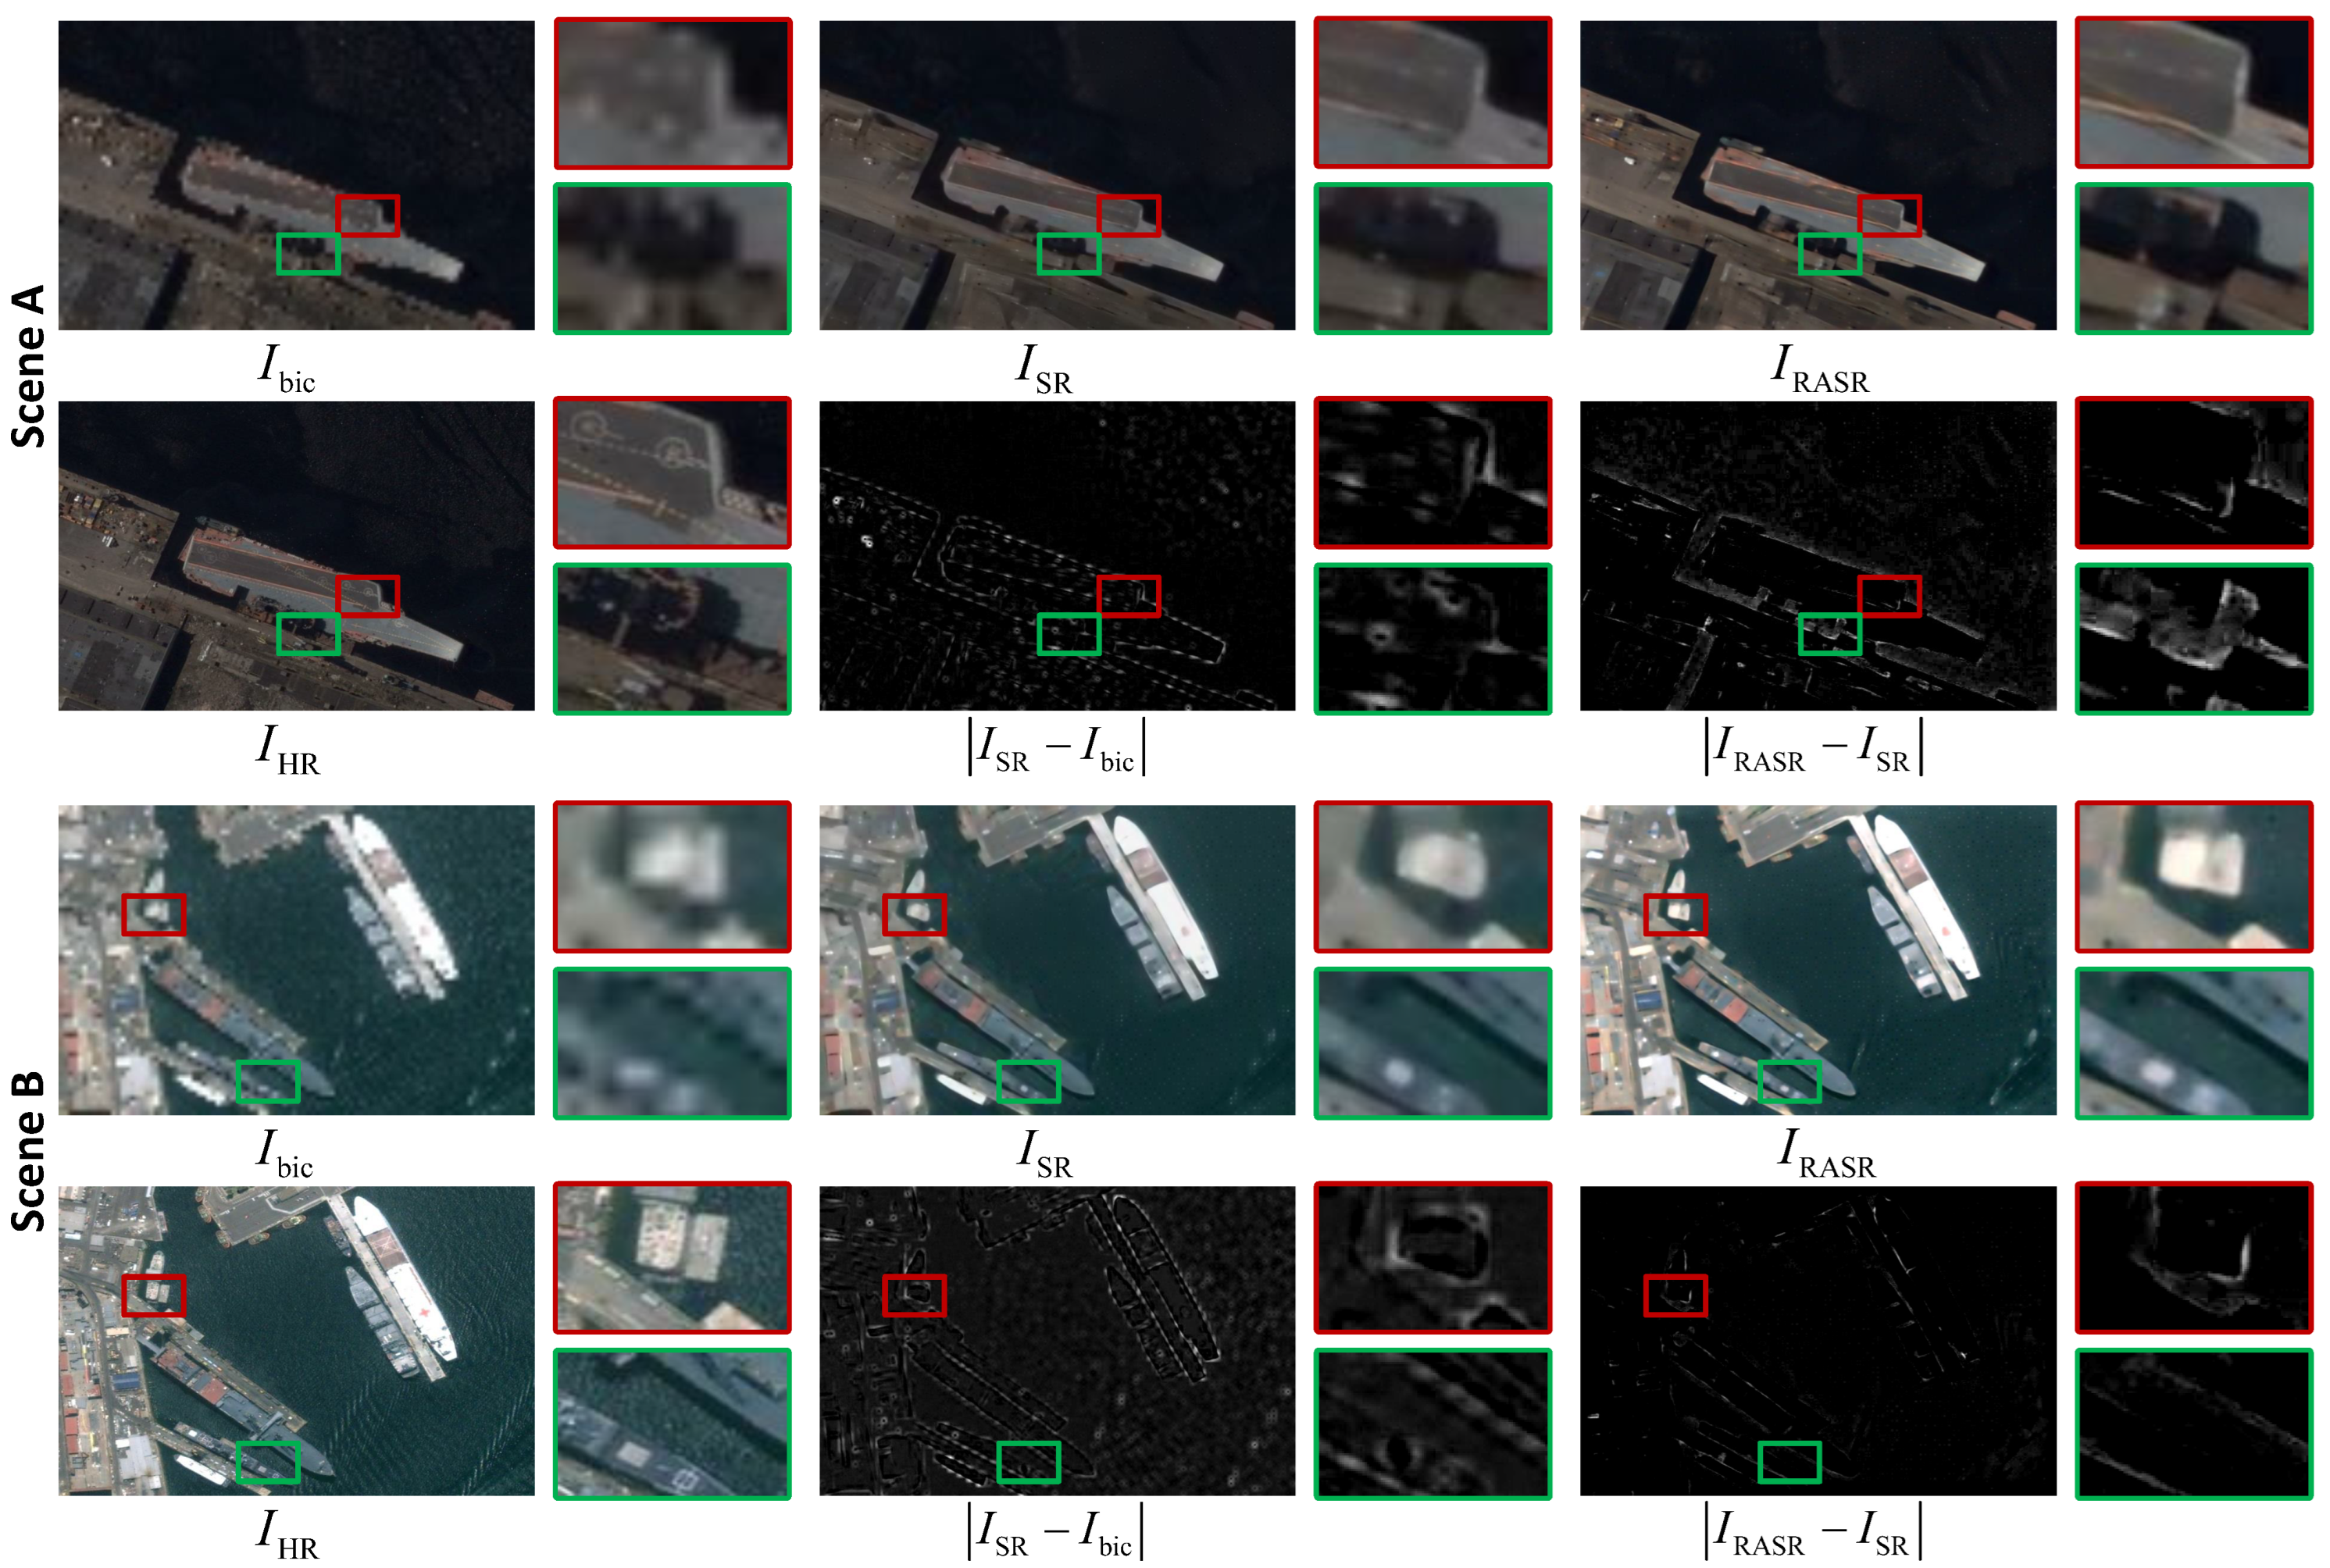
Figure 3 shows the visualization results of the original HR images and the restored images by different variants, where , , and mean HR image, bicubic up-sampling image, output of SR module and output of the proposed RASR. Taking bicubic up-sampling image as baseline, we show the residual image between bicubic up-sampling image and the output of SR module (i.e., ). It can be observed that the major differences between the SR image and bicubicly up-sampled image are located at the edges. Moreover, we show the residual image between the output of RASR and SR module (i.e., ). The differences are still at the edges. That is, the SR module can super-resolve detail information in edges and our RASR can further restore these edge detail information with the assistance of image rescaling.
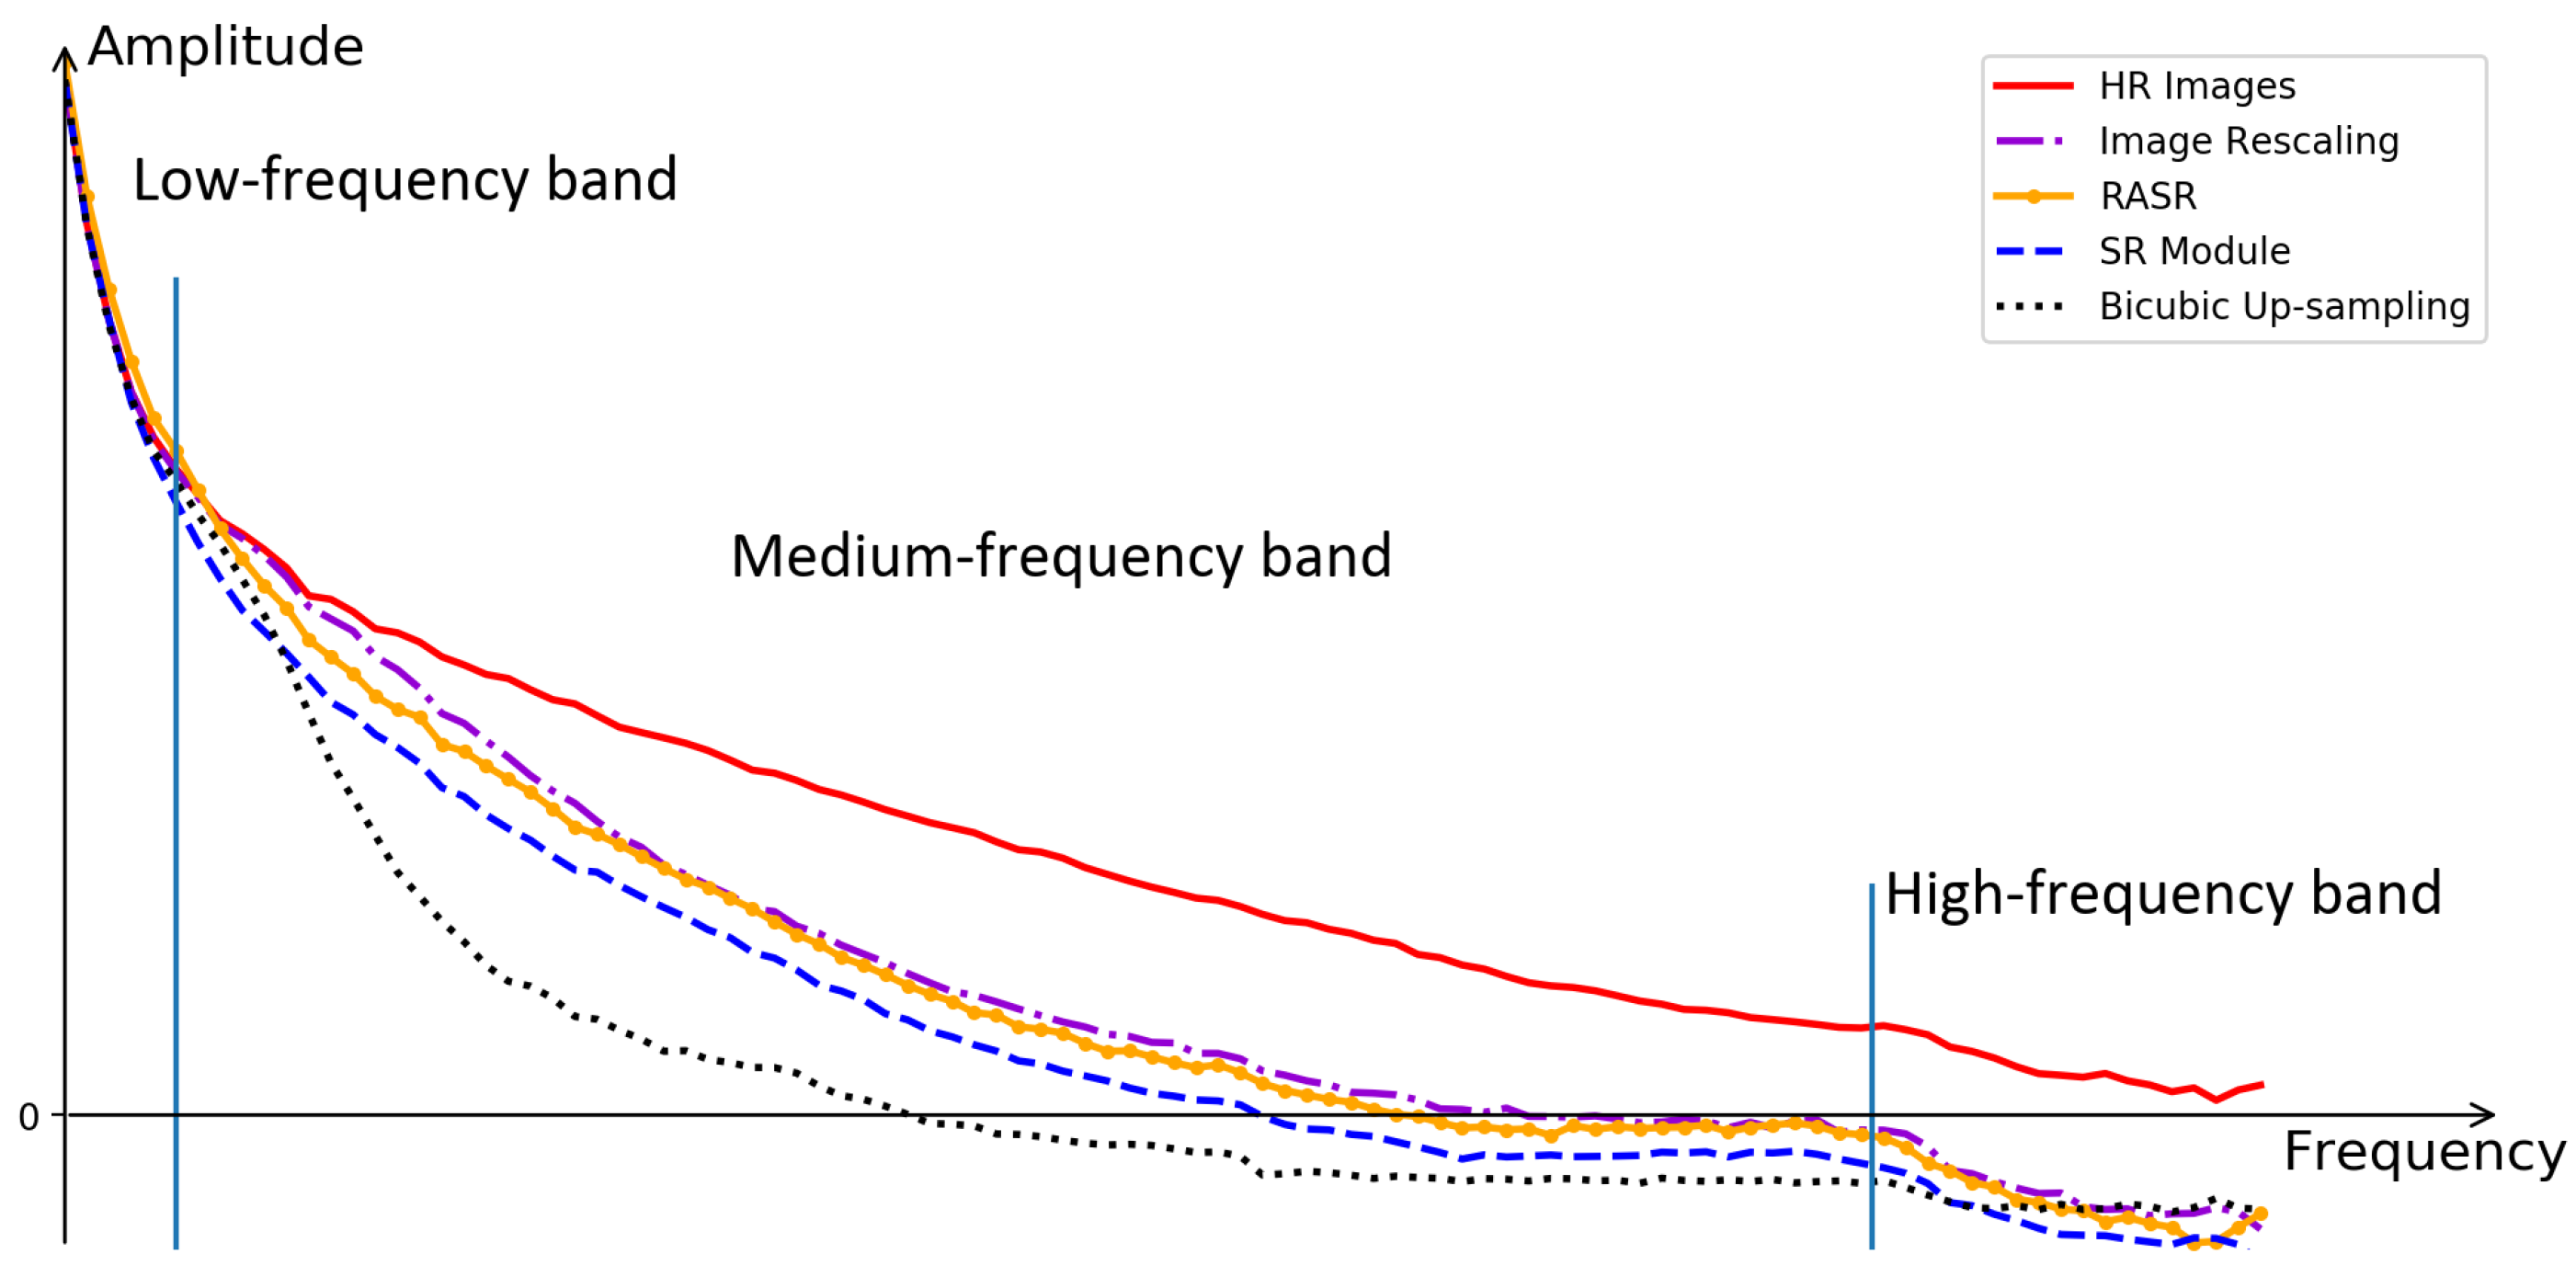
To qualitatively illustrate the assistance of image rescaling to image SR, we provide the amplitude-frequency curves of original HR images, outputs of RASR and its variants. We use Fast Fourier Transform to acquire the frequency images. Specifically, we first transfer an RGB image to gray version, then we compute the 2-dimensional Discrete Fourier Transform of the gray image and shift zero-frequency terms to the center of the frequency domain, finally we use the decadic logarithm of frequency amplitude to generate the frequency image. Since the frequency map is symmetrical around the center, we can group it according to the distance between its elements and its center uniformly. We use the pixel distance between each group and the image center as the abscissa value, and use the summation of all amplitude values in each group as the ordinate values to generate the amplitude-frequency graph. Note that we use the decadic logarithm of amplitude to narrow the range of frequency values, and thus show the difference between curves more clearly. As shown in Figure 4, the frequency can be divided into low, medium and high frequency bands. Information in the low-frequency band is rarely lost, and different SR methods contribute to restoring the information in the medium-frequency band. From Figure 4 we can find that the outputs of image rescaling is closer to HR images than the outputs of SR module. That is because pseudo M-LR images in image rescaling has more beneficial information than original M-LR images. With the assistance of image rescaling, the amplitude-frequency curve of RASR is beyond the curve of the SR module and is closer to that of image rescaling. Although RASR can restore partial information in the medium-frequency band, information in the high-frequency band is hard to be restored due to the irreversible information lost in image degradation. Moreover, there are still spaces to investigate more innovative SR methods since there are still distances between the curve of HR images and RASR outputs in the medium-frequency band.
4.2.2. Effectiveness of RASR for Ship Detection
To demonstrate the effectiveness of our proposed RASR method for ship detection, we use the outputs of different RASR variants as the inputs of detector, and choose Faster-RCNN (with ResNet50 as backbone) and FCOS (with ResNet101 as backbone) to detect ship targets. The detection performance is shown in Table 2. Consistent with Section 4.2.1, we validate on Bicubic and Bicubic + Gaussian blur down-sampling metrics, separately.
We first validate the effectiveness of our method on Bicubic down-sampling degradation. When taking Faster-RCNN as the evaluation detector, on the HRSC2016 dataset, directly using bicubically up-sampled images achieves the lowest detection accuracy. When the SR module is introduced, the value is significantly improved from 0.788 to 0.838. This demonstrates that image SR can provide more useful appearance information than the bicubic up-sampling operation. Furthermore, using the outputs of RASR to detect ship targets can further improve the detection performance, and achieves 0.859 in terms of . That is because, the adaption module can transform the original LR images to informative ones with the guide of image rescaling, and more information is embedded in the outputs of RASR and transferred to the detection network. Note that using the outputs of RASR cannot achieve good performance as HR images (i.e., 0.894) due to the information lost. Similarly, when taking FCOS as the evaluation detector, on HRSC2016 dataset, directly using bicubic up-sampling images achieves 0.478 in terms of . When the SR module is introduced, the value is improved to 0.626. Using the outputs of RASR to detect ship targets can further improve the detection performance to 0.735.
We extend our ablation studies on the DOTA and NWPU VHR-10 datasets. With the bicubicly up-sampled images as input, Faster-RCNN achieves 0.633 and 0.861 in terms of on DOTA and NWPU VHR-10 datasets, respectively. When the outputs of the SR module are fed to the detector, the detection accuracy improves to 0.655 and 0.875 on DOTA and NWPU VHR-10 datasets, respectively. It can be observed that the detection performance can be further improved when the outputs of RASR are used, but is still inferior to the results on HR images. The detection results of FCOS are consistent with Faster-RCNN on the DOTA and NWPU VHR-10 datasets. FCOS achieves 0.513 and 0.822 when taking bicubicly up-sampled images as inputs on DOTA and NWPU VHR-10 datasets, respectively. When the SR module is introduced, the values are improved to 0.597 and 0.852 on DOTA and NWPU VHR-10 datasets, respectively. Using the outputs of RASR to detect ship targets can further improve the detection performance to 0.695 and 0.898 on two datasets, respectively. These consistent results on two detectors and three datasets validate the effectiveness of our RASR method on the ship detection task.
Furthermore, we validate the effectiveness of our method on Bicubic + Gaussian blur down-sampling degradation. It can be observed form Table 2 that two evaluation detectors with RASR results as inputs both achieve better detection performance than with Bicubic and SR module results as inputs. Take Faster-RCNN as an evaluation detector example, our SR module achieves 0.876 in terms of , and is 0.091 better than the Bicubic method, and our RASR achieves 0.008 improvements over the SR module. For DOTA and NWPU VHR-10 datasets, Faster-RCNN on RASR results also achieves 0.008 and 0.030 improvements as compared to the results of the SR module, respectively. This demonstrates the effectiveness and generality of our method on more complex scenarios.
We further show the detection performance on targets with different sizes, as shown in Table 3. Note that here we use Faster-RCNN with ResNet50 as the backbone to validate the influence of our method for targets with different scales. Furthermore, we use bicubic as the down-sampling approach to generate the LR images. It can be observed that the performance improvement on small targets is the largest. Taking the DOTA dataset as an example, compared with using the outputs of SR module, using the outputs of RASR can achieve a 0.086 improvement on small ships, 0.065 improvement on medium targets and 0.053 improvement on large targets, respectively. For the HRSC2016 dataset, Faster-RCNN achieves 0.052, 0.021 and 0.027 improvements in terms of , and when using RASR as pre-processing compared to using the SR module. Moreover, the improvement on small targets is still higher than medium and large targets, respectively. That is because there is more information lost for smaller targets than larger ones. Thus, the recovered detail information using our RASR is more beneficial for small target detection.
4.3. Comparison to the State-of-the-Art Methods
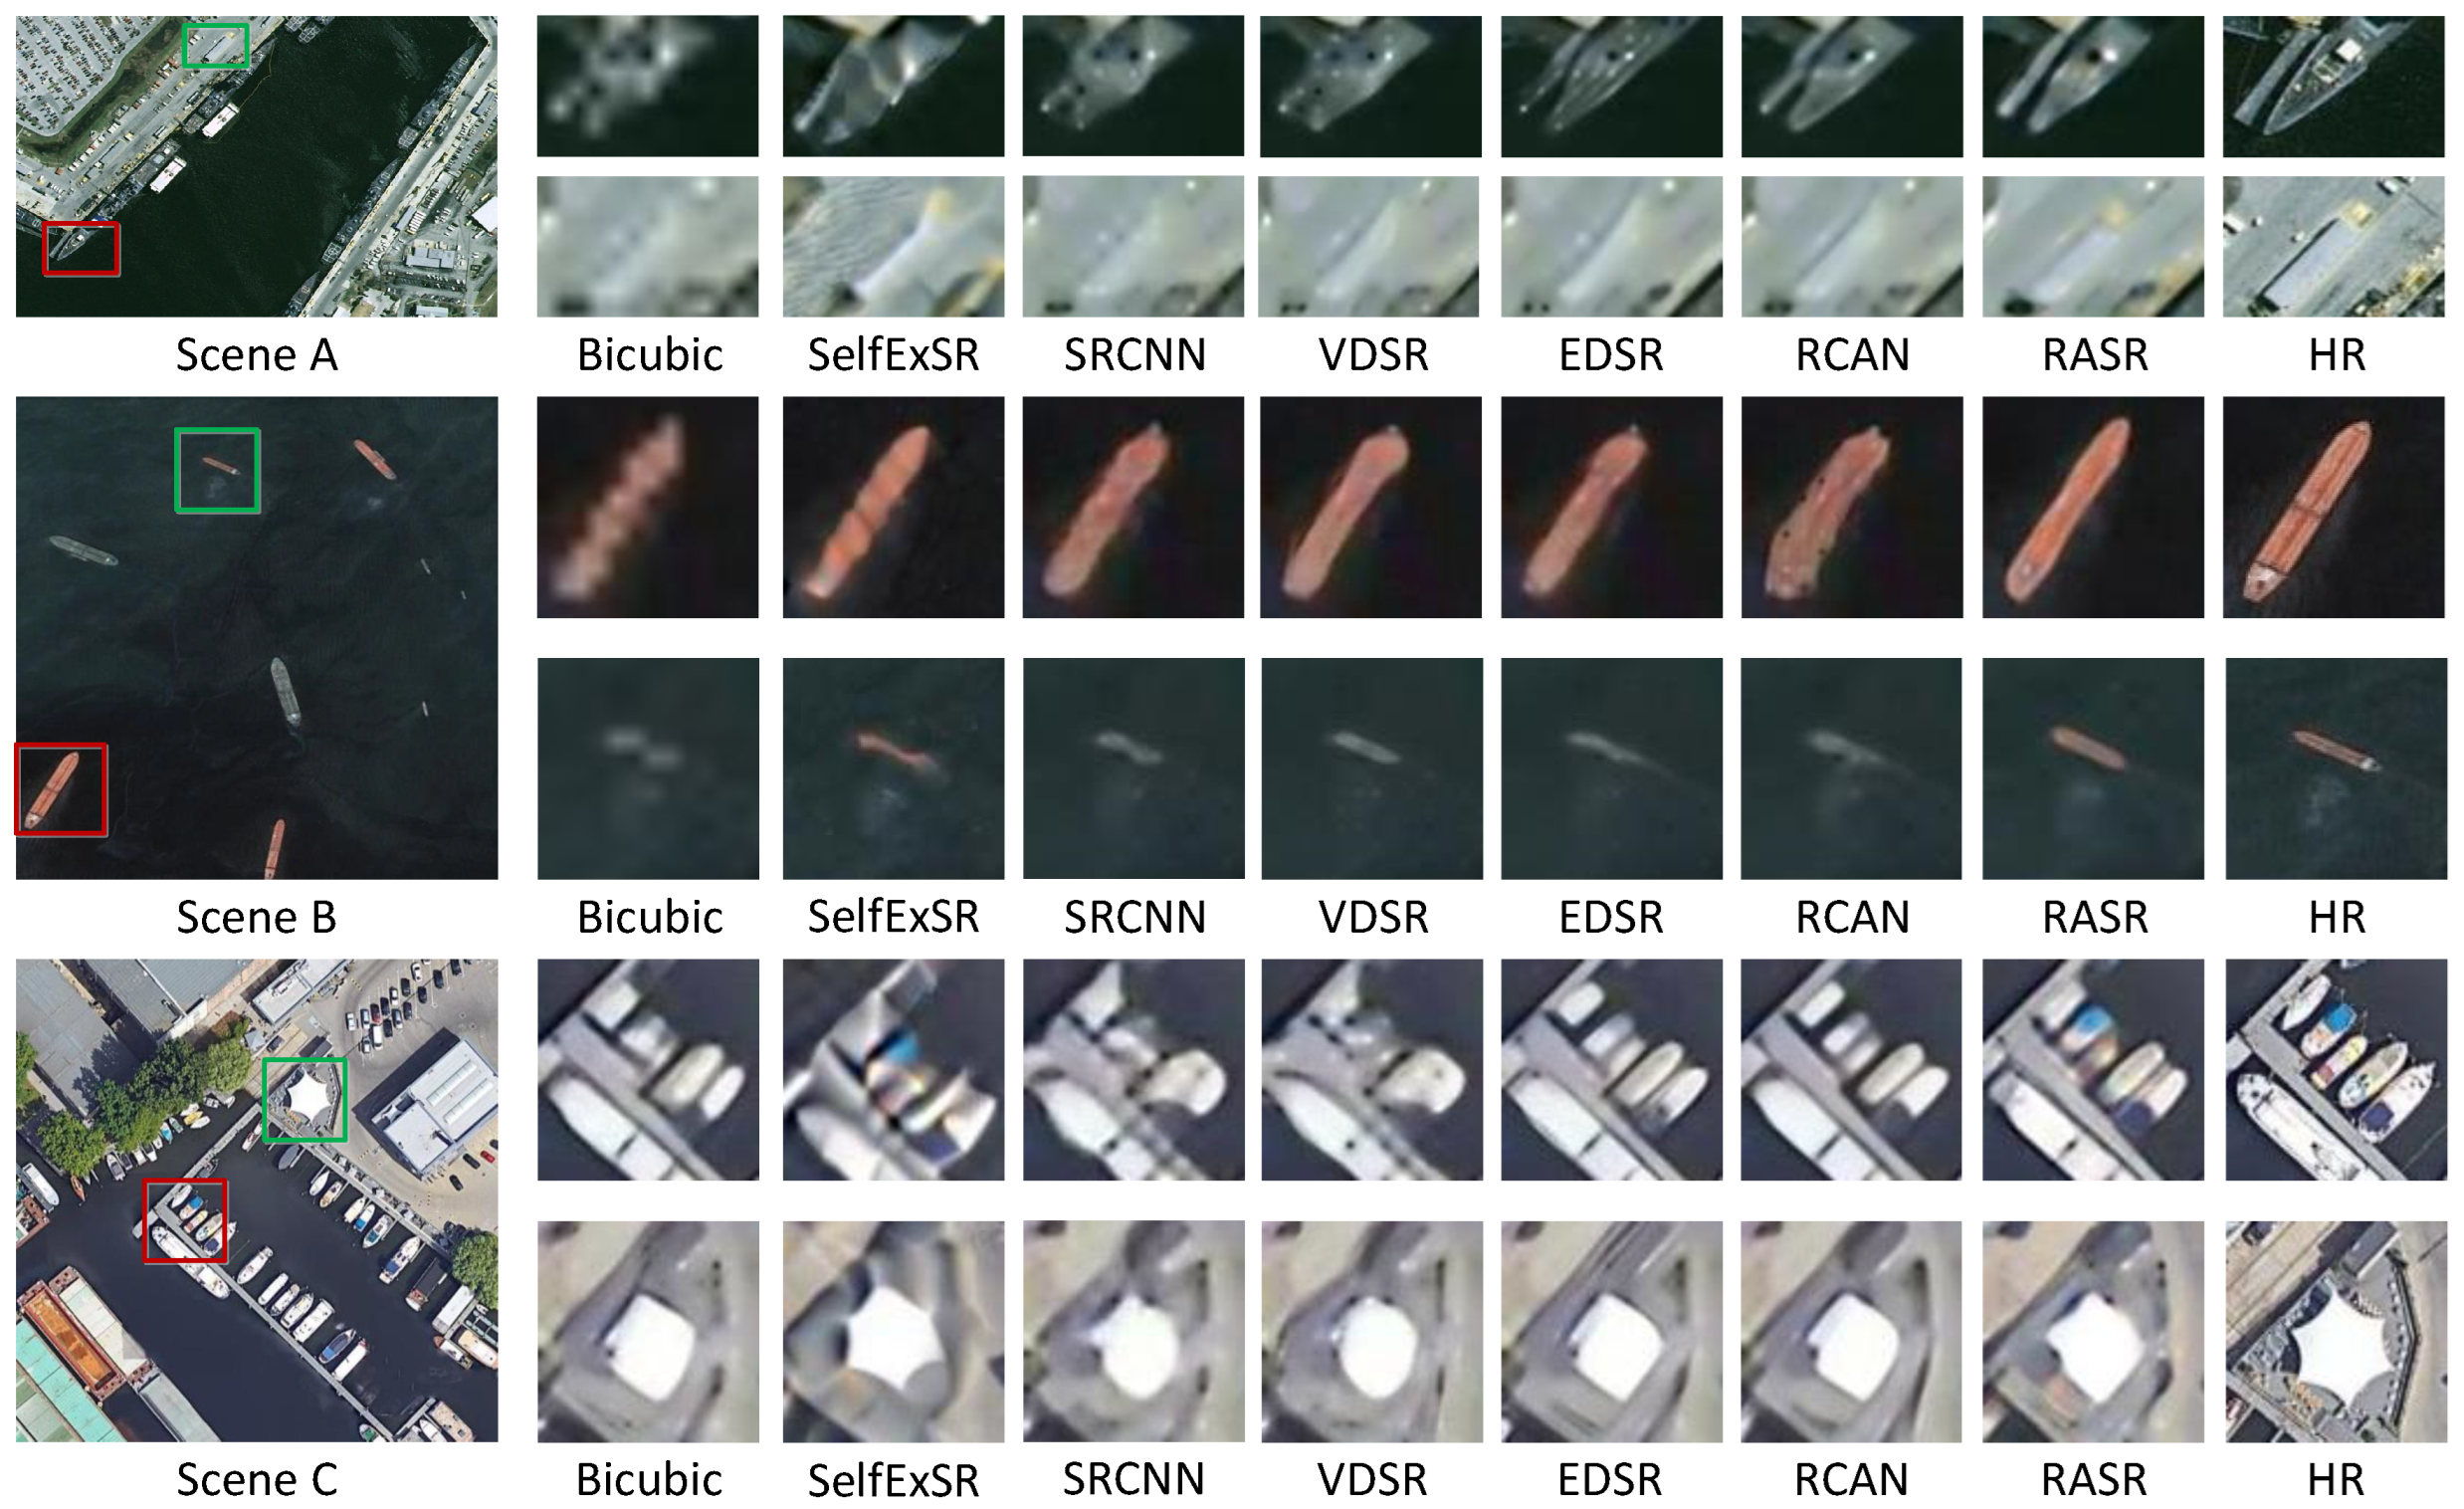
We compare our RASR with several state-of-the-art SR models (SelfExSR [35], SRCNN [11], VDSR [12], EDSR [36] and RCAN [37]) on three public remote sensing datasets to investigate the superiority of our method on SR task. Then, we use RASR as a pre-processing approach and choose Faster-RCNN as detector to develop RASR-Faster-RCNN. We compare RASR-Faster-RCNN with four state-of-the-art detection methods: GFL [38], Reppoints [39], HTC [40] and DetectoRS [41]. Note that we use the bicubicly up-sampled images as the inputs of the compared detectors to ensure the identical input sizes of different detectors.
4.3.1. Comparison with SR Methods
We compare our RASR to several competitive SR methods in terms of the number of parameters, SSIM and PSNR on three datasets. Among these competitive SR methods, SelfExSR is based on non-machine learning, and others are based on CNN. Comparative results are shown in Table 4. It can be observed that SelfExSR consumes the most inference time, since it need more iterations to achieve comparable results. Furthermore, our RASR outperforms SelfExSR, SRCNN and VDSR on all three datasets. Compared with EDSR, our RASR has fewer parematers and faster inference speed, and is superior to EDSR except for the PSNR score on the DOTA dataset. Furthermore, with only one sixth of parameters, our RASR achieves more competitive SR performance than RCAN. The inference speed of RASR is also faster than RCAN. Although SRCNN and VDSR take fewer time to super-solve images, the SR quality is not as good as our RASR method. These experimental results demonstrate the superiority of the proposed RASR.
Figure 5 shows the qualitative results achieved by different SR methods. The selected scenes are from the three datasets, respectively. Scene A is from the HRSC2016 dataset, and it can be observed that bicubic up-sampling, SelfExSR, SRCNN and VDSR can not recover the shape of bow and cannot distinguish bow and port areas. Although EDSR and RCAN can recover the bow, the contrast between bow and background is lower than RASR. That is because, RASR can better restore the detail information at the edge areas due to the assistance of image rescaling. Furthermore, the super-resolved results of SelfExSR have more visual artifacts, that is because the limited SR ability of SelfExSR on lager scale factor (the scale factor is 8 in our experiments). Scene B is from the NWPU VHR-10 dataset, it can be found that RASR can better recover the shape information (as shown in the red bounding box in scene B) and color information (as shown in the green bounding box in scene B) of ship targets. In fact, there is more detail information embedded and transferred to the SR module in our RASR method. Scene C is from the DOTA dataset, and the ships in this scene are tiny and clustered. In this scene, EDSR, RCAN and RASR can generate SR images with distinguished ship instances, but only RASR can further preserve the shape and color information. Furthermore, the hexagonal star architecture in scene C brings a challenge for image SR, since much corner information is lost in the degraded images. SRCNN, VDSR, RDSR, RCAN restore the hexagonal star to quadrilateral or oval by mistake. In contrast, SelfExSR and our RASR can recover the six corners of the architecture. However, due to the strong visual artifacts, the suer-resolved ability of SelfExSR is inferior to RASR. Note that, our RASR cannot recover the complete hexagonal star due to the information lost. It is worth noting that the super-resolved results of SelfExSR have more visual artifacts, that is because the limited SR ability of SelfExSR on lager scale factor (the scale factor is 8 in our experiments, and the max factor is 4 in SelfExSR). These result images on different datasets demonstrate the effectiveness and superiority of our method.
4.3.2. Comparison with Detection Methods
Comparative results achieved by RASR-Faster-RCNN and other methods are shown in Table 5. Compared to original Faster-RCNN, our RASR-Faster-RCNN achieves 0.053, 0.086 and 0.031 improvements in terms of on the HRSC2016, DOTA and NWPU VHR-10 datasets, respectively. The significant improvements are at a low cost: about 2.50 MB parameters for image pre-processing approach. It can be observed that our RASR-Faster-RCNN achieves the best detection performance on three datasets. Note that HTC and DetectoRS are developed based on Faster-RCNN and have more parameters, and their performance is better than the original Faster-RCNN. However, compared to RASR-Faster-RCNN, HTC and DetectoRS are less competitive due to the missing details in the input bicubicly up-sampled images. In contrast, our RASR-Faster-RCNN uses RASR as the pre-processing and takes the super-resolved images as the input of Faster-RCNN, and thus achieves better detection performance.
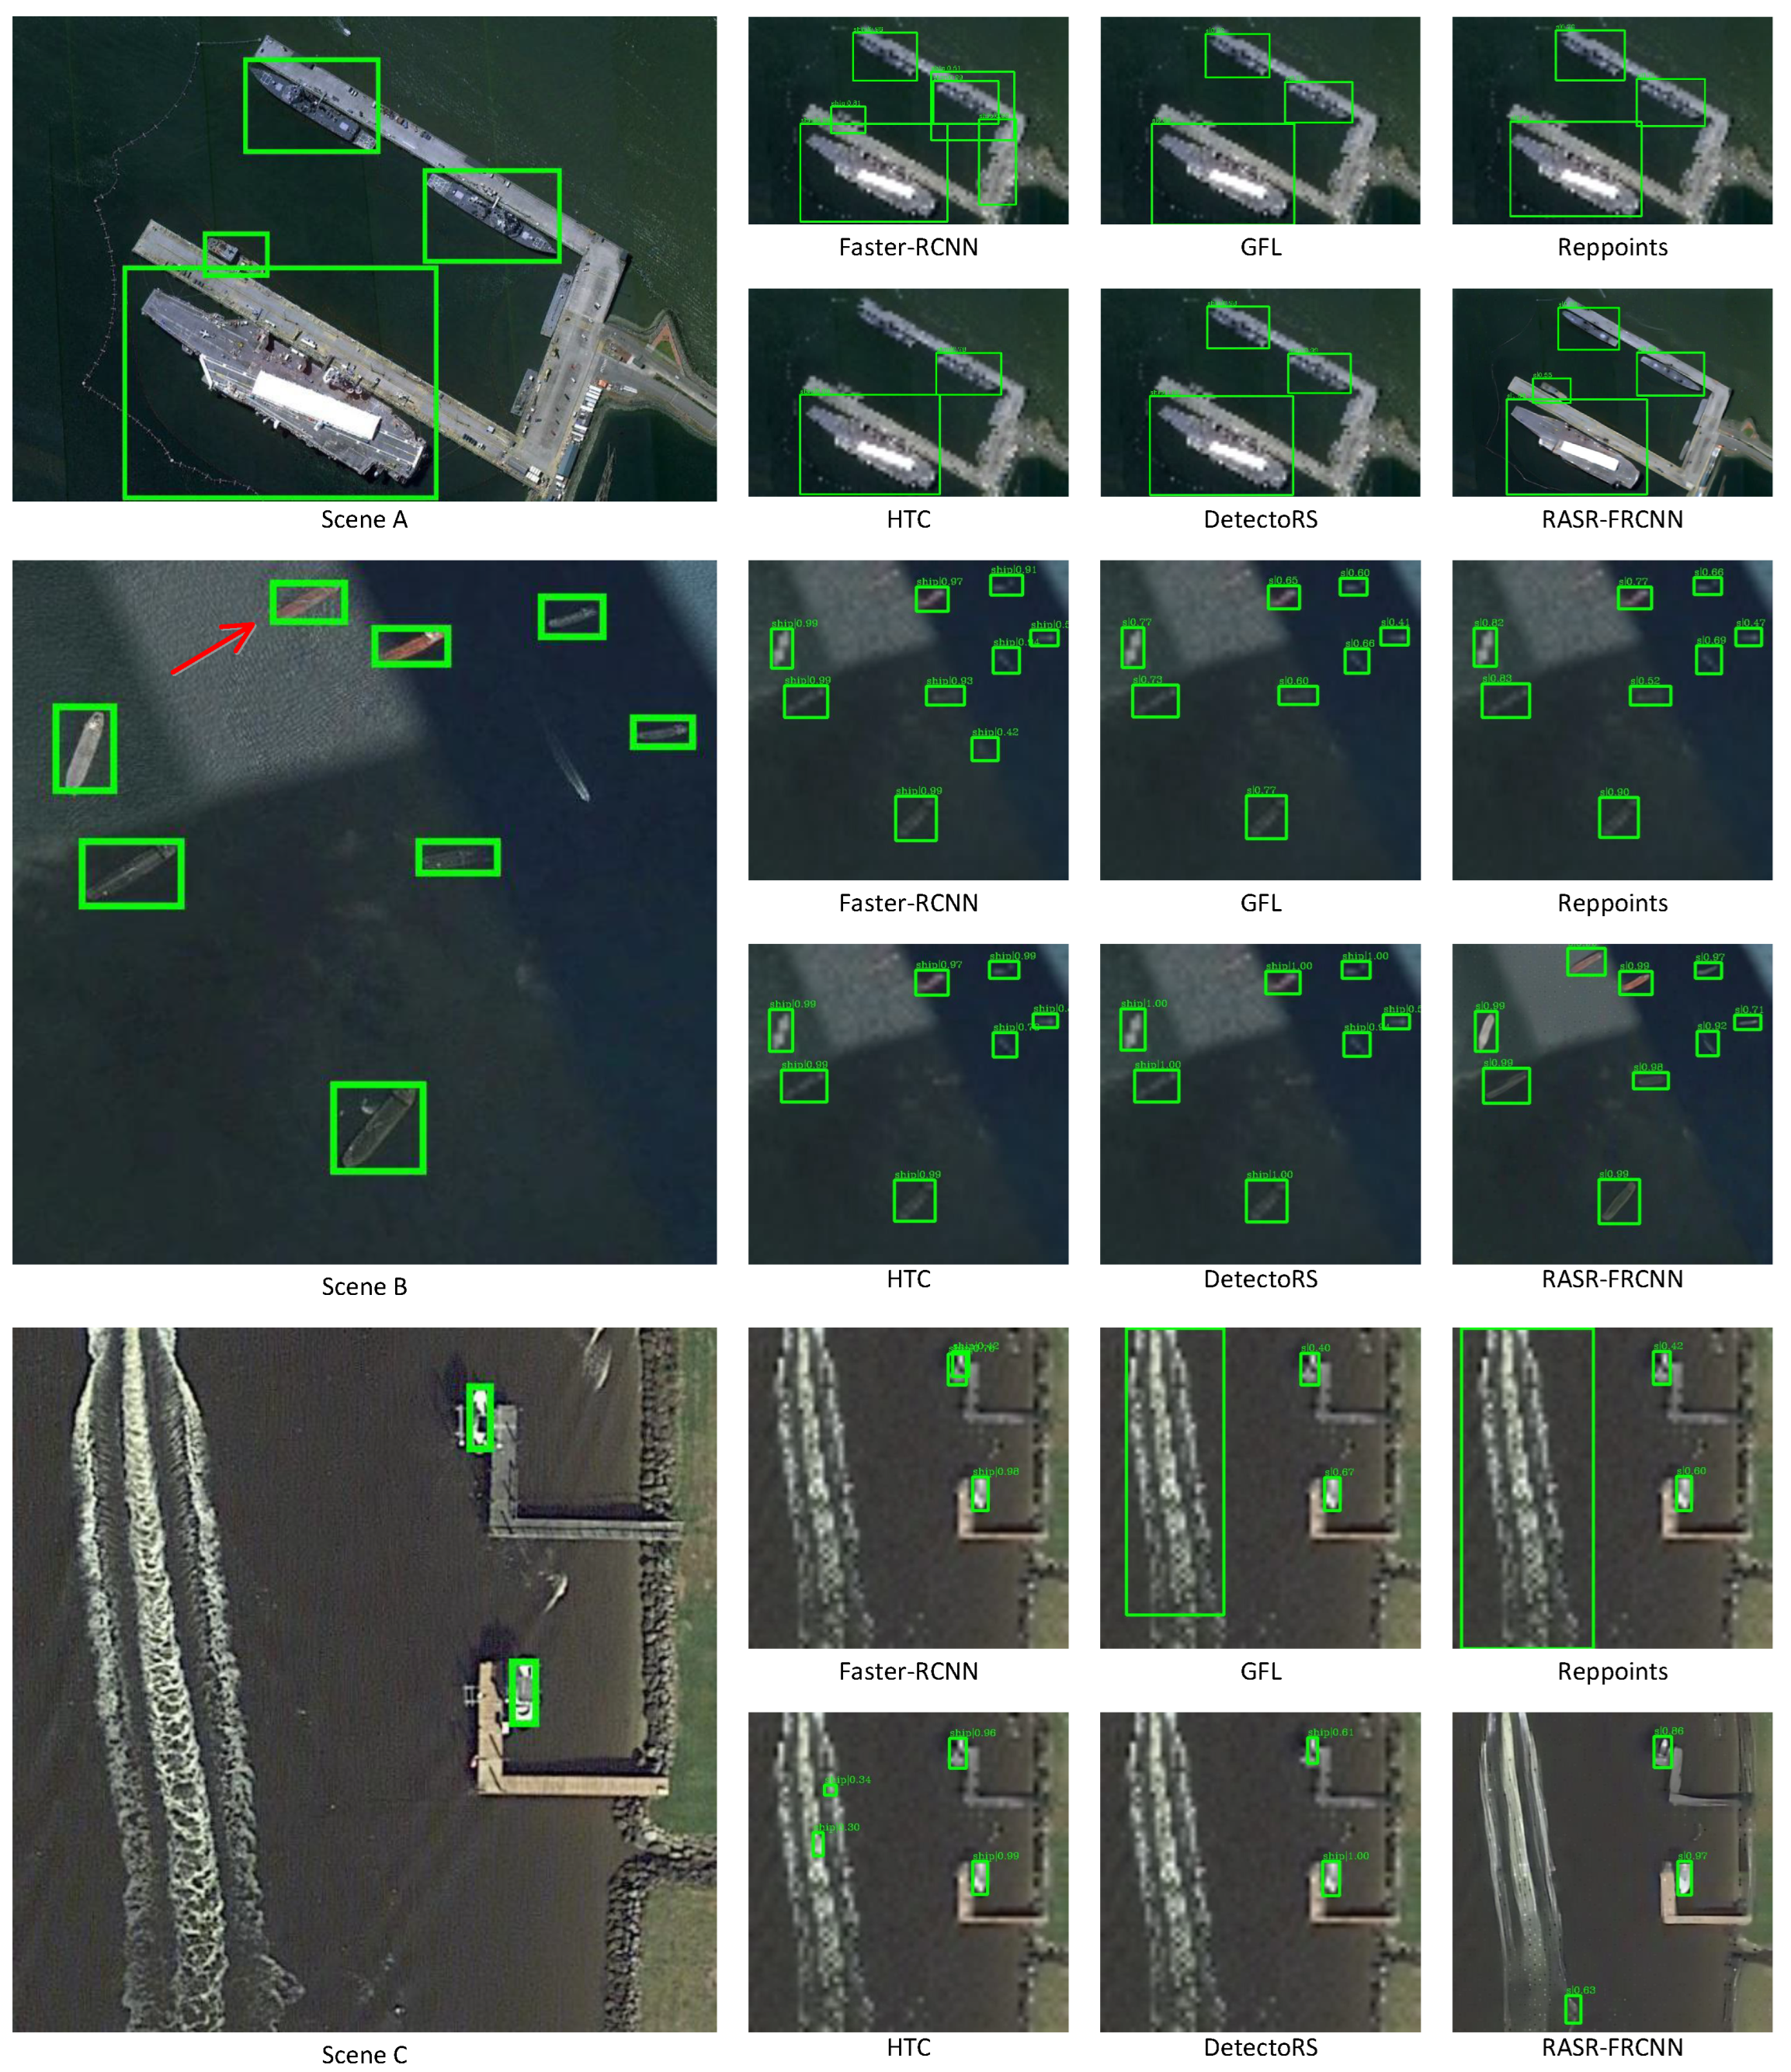
Figure 6 shows the detection results achieved by different methods on three scenes. Scene A is from HRSC2016, and the ship targets have various scales. It can be observed that GFL, Reppoints, HTC and DetectoRS cannot successfully detect the smallest ship. Although Faster-RCNN can detect the smallest ship, there are extra false alarms detected by mistake. Our RASR-Faster-RCNN can successfully detect the tiny ship, since the pre-processing RASR can restore more detail information, and thus improve the detection accuracy. Scene B is from the NWPU VHR-10 dataset, in which the shadow and reflection make some ships (indicated by red arrow) have lower contrast, and introduce challenges to the detection task. All the comparative detectors cannot detect the ship due to the lost information in the bicubicly up-sampled images. However, our RASR-Faster-RCNN can successfully detect these targets with the assistance of RASR. However, when handling some extremely challenging scenes, our method will produce some false alarms due to the similar detail structure. For example, in scene C (from the DOTA dataset), the big trace produces many areas that have similar detail structures with tiny ships, and thus leads to many false alarms. GFL, Reppoints, HTC and our RASR all generate some false alarms. Only detectoRS can successfully detect ships in this scene accurately. In the future, we will improve the performance of our method on these challenging scenes.
5. Conclusions
In this paper, we propose an image rescaling assisted SR method RASR to super-resolve remote sensing images more effectively. In our method, more detail information can be embedded and transferred to the SR process, and thus enhance the SR performance. Extensive ablation studies and visualizations have demonstrated the effectiveness of our RASR method for both image SR and ship detection. Moreover, we take RASR as a pre-processing approach to the detection network, and develop RASR-Det to further improve the detection performance on medium-low resolution remote sensing ship detection. Note that, although our method could recover some texture information, it may hallucinate fake textures and brings some false alarms. In the future, we would continue to work on this challenge.
Author Contributions
H.Z. determined the research direction and modified the article expression; S.H. conceived the innovative ideas, and designed the RASR framework, conducted experiments and completed the first version of manuscript. X.C. helped to modify the conception, and revised the manuscript and provided suggestions in expression. L.S., J.W., S.L. and J.L. checked out the article’s writing and helped to build datasets. All authors have read and agreed to the published version of the manuscript.
Funding
This work was supported by the National Natural Science Foundation of China under Grant 62071474.
Data Availability Statement
Not applicable.
Conflicts of Interest
The authors declare no conflict of interest.
Abbreviations
The following abbreviations are used in this manuscript:
| M-LR | Medium-low resolution |
| GSD | Ground sample distance |
| SR | Super-resolution |
| RASR | Rescaling assisted super-resolution |
| RASR-Det | Detection framework with RASR as a pre-processing approach |
| HR | High resolution |
| CNN | Convolution neutral network |
| VDSR | Very deep super-resolution network |
| RDN | Residual dense network |
| EESRGAN | Edge-enhanced super-resolution generative adversarial network |
| Faster-RCNN | Method in paper ”Faster-RCNN: Towards real-time object detection |
| with region proposal networks” | |
| FCOS | Fully Convolutional One-Stage Object Detection |
| ResNet50 | Deep residual network with 50 convolution and fully connection layers |
| ResNet101 | Deep residual network with 101 convolution and fully connection layers |
| GAN | Generative adversarial network |
| RDB | Residual dense block |
| HRSC2016 | High resolution ship collections 2016 |
| DOTA | A Large-scale Dataset for Object Detection in Aerial Images |
| NWPU VHR-10 | A challenging 10-class geospatial object detection dataset |
| SGD | Stochastic gradient descent |
| MMDetection | Open MMLab Detection Toolbox and Benchmark |
| PSNR | Peak signal-to-noise ratio |
| SSIM | Structural similarity |
| MSE | Mean squared error |
| RGB | Red-green-blue |
| AP | Average precision |
| IoU | Intersection over union |
| Average precision with intersection over union being 0.50 | |
| Average precision for small targets | |
| Average precision for medium targets | |
| Average precision for large targets | |
| COCO | Microsoft COCO: Common Objects in Context |
| dB | Decibel |
| SRCNN | Super-Resolution Convolutional Neural Network |
| EDSR | Enhanced deep residual super-resolution network |
| RCAN | Residual channel attention network |
| RASR-Faster-RCNN | Detection method integrating RASR and Faster-RCNN |
| GFL | Generalized focal loss |
| Reppoints | Point Set Representation for object detection |
| HTC | Hybrid task cascade for instance segmentation |
| DetectoRS | Detecting objects with recursive feature pyramid and |
| switchable atrous convolution | |
| MB | Million bytes |
References
- Zhang, X.; Wang, G.; Zhu, P.; Zhang, T.; Li, C.; Jiao, L. GRS-Det: An anchor-free rotation ship detector based on Gaussian-mask in remote sensing images. IEEE Trans. Geosci. Remote. Sens. 2020, 59, 3518–3531. [Google Scholar] [CrossRef]
- Yu, Y.; Yang, X.; Li, J.; Gao, X. A cascade rotated anchor-aided detector for ship detection in remote sensing images. IEEE Trans. Geosci. Remote. Sens. 2020, 60, 1–14. [Google Scholar] [CrossRef]
- Li, L.; Zhou, Z.; Wang, B.; Miao, L.; Zong, H. A novel CNN-based method for accurate ship detection in HR optical remote sensing images via rotated bounding box. IEEE Trans. Geosci. Remote. Sens. 2020, 59, 686–699. [Google Scholar] [CrossRef]
- Dong, X.; Wang, L.; Sun, X.; Jia, X.; Gao, L.; Zhang, B. Remote Sensing Image Super-Resolution Using Second-Order Multi-Scale Networks. IEEE Trans. Geosci. Remote. Sens. 2020, 59, 3473–3485. [Google Scholar] [CrossRef]
- Rabbi, J.; Ray, N.; Schubert, M.; Chowdhury, S.; Chao, D. Small-Object Detection in Remote Sensing Images with End-to-End Edge-Enhanced GAN and Object Detector Network. Remote Sens. 2020, 12, 1432. [Google Scholar] [CrossRef]
- Courtrai, L.; Pham, M.; Lefèvre, S. Small Object Detection in Remote Sensing Images Based on Super-Resolution with Auxiliary Generative Adversarial Networks. Remote Sens. 2020, 12, 3152. [Google Scholar] [CrossRef]
- Wang, B.; Lu, T.; Zhang, Y. Feature-Driven Super-Resolution for Object Detection. In Proceedings of the IEEE CRC, Wuhan, China, 16–18 October 2020; pp. 211–215. [Google Scholar]
- Noh, J.; Bae, W.; Lee, W.; Seo, J.; Kim, G. Better to follow, follow to be better: Towards precise supervision of feature super-resolution for small object detection. In Proceedings of the IEEE ICCV, Seoul, Korea, 27 October–2 November 2019; pp. 9725–9734. [Google Scholar]
- Wang, Z.; Chen, J.; Hoi, S.C. Deep learning for image super-resolution: A survey. IEEE Trans. Pattern Anal. Mach. Intell. 2020, 43, 3365–3387. [Google Scholar] [CrossRef] [PubMed] [Green Version]
- Li, J.; Pei, Z.; Zeng, T. From Beginner to Master: A Survey for Deep Learning-based Single-Image Super-Resolution. arXiv 2021, arXiv:2109.14335. [Google Scholar]
- Dong, C.; Loy, C.C.; He, K.; Tang, X. Learning a deep convolutional network for image super-resolution. In Proceedings of the ECCV, Zurich, Switzerland, 6–12 September 2014; Springer: Berlin/Heidelberg, Germany, 2014; pp. 184–199. [Google Scholar]
- Kim, J.; Kwon Lee, J.; Mu Lee, K. Accurate image super-resolution using very deep convolutional networks. In Proceedings of the IEEE CVPR, Las Vegas, NV, USA, 27–30 June 2016; pp. 1646–1654. [Google Scholar]
- Zhang, Y.; Tian, Y.; Kong, Y.; Zhong, B.; Fu, Y. Residual dense network for image super-resolution. arXiv 2018, arXiv:1802.08797v2. [Google Scholar]
- He, K.; Zhang, X.; Ren, S.; Sun, J. Deep residual learning for image recognition. In Proceedings of the IEEE CVPR, Las Vegas, NV, USA, 27–30 June 2016; pp. 770–778. [Google Scholar]
- Huang, G.; Liu, Z.; Van Der Maaten, L.; Weinberger, K.Q. Densely connected convolutional networks. In Proceedings of the IEEE CVPR, Honolulu, HI, USA, 21–26 July 2017; pp. 4700–4708. [Google Scholar]
- Li, J.; Fang, F.; Mei, K.; Zhang, G. Multi-scale residual network for image super-resolution. In Proceedings of the ECCV, Munich, Germany, 8–14 September 2018; pp. 517–532. [Google Scholar]
- Wang, L.; Dong, X.; Wang, Y.; Ying, X.; Lin, Z.; An, W.; Guo, Y. Exploring Sparsity in Image Super-Resolution for Efficient Inference. In Proceedings of the IEEE CVPR, Nashville, TN, USA, 20–25 June 2021; pp. 4917–4926. [Google Scholar]
- Wang, L.; Wang, Y.; Dong, X.; Xu, Q.; Yang, J.; An, W.; Guo, Y. Unsupervised Degradation Representation Learning for Blind Super-Resolution. In Proceedings of the IEEE CVPR, Nashville, TN, USA, 20–25 June 2021; pp. 10581–10590. [Google Scholar]
- Kim, H.; Choi, M.; Lim, B.; Lee, K.M. Task-aware image downscaling. In Proceedings of the ECCV, Munich, Germany, 8–14 September 2018; pp. 399–414. [Google Scholar]
- Sun, W.; Chen, Z. Learned image downscaling for upscaling using content adaptive resampler. IEEE Trans. Image Process. 2020, 29, 4027–4040. [Google Scholar] [CrossRef] [PubMed] [Green Version]
- Xiao, M.; Zheng, S.; Liu, C.; Wang, Y.; He, D.; Ke, G.; Bian, J.; Lin, Z.; Liu, T.Y. Invertible image rescaling. In Proceedings of the ECCV, Glasgow, UK, 23–28 August 2020; Springer: Berlin/Heidelberg, Germany, 2020; pp. 126–144. [Google Scholar]
- Ren, S.; He, K.; Girshick, R.; Sun, J. Faster R-CNN: Towards real-time object detection with region proposal networks. IEEE Trans. Pattern Anal. Mach. Intell. 2016, 39, 1137–1149. [Google Scholar] [CrossRef] [PubMed] [Green Version]
- Liu, W.; Anguelov, D.; Erhan, D.; Szegedy, C.; Reed, S.; Fu, C.Y.; Berg, A.C. SSD: Single shot multibox detector. In Proceedings of the ECCV, Amsterdam, The Netherlands, 11–14 October 2016; Springer: Berlin/Heidelberg, Germany, 2016; pp. 21–37. [Google Scholar]
- Zou, H.; He, S.; Wang, Y.; Li, R.; Cheng, F.; Cao, X. Ship detection based on medium-low resolution remote sensing data and super-resolved feature representation. Remote Sens. Lett. 2022, 13, 323–333. [Google Scholar] [CrossRef]
- He, S.; Zou, H.; Wang, Y.; Li, R.; Cheng, F.; Cao, X.; Li, M. Enhancing Mid–Low-Resolution Ship Detection With High-Resolution Feature Distillation. IEEE Geosci. Remote. Sens. Lett. 2021, 19, 1–5. [Google Scholar] [CrossRef]
- Lee, W.; Lee, J.; Kim, D.; Ham, B. Learning with privileged information for efficient image super-resolution. In Proceedings of the ECCV, Virtual, 15 August 2020; Springer: Berlin/Heidelberg, Germany, 2020; pp. 465–482. [Google Scholar]
- He, K.; Zhang, X.; Ren, S.; Sun, J. Delving deep into rectifiers: Surpassing human-level performance on imagenet classification. In Proceedings of the IEEE ICCV, Santiago, Chile, 7–13 December 2015; pp. 1026–1034. [Google Scholar]
- Shi, W.; Caballero, J.; Huszár, F.; Totz, J.; Aitken, A.P.; Bishop, R.; Rueckert, D.; Wang, Z. Real-time single image and video super-resolution using an efficient sub-pixel convolutional neural network. In Proceedings of the IEEE CVPR, Las Vegas, NV, USA, 27–30 June 2016; pp. 1874–1883. [Google Scholar]
- Liu, Z.; Yuan, L.; Weng, L.; Yang, Y. A High Resolution Optical Satellite Image Dataset for Ship Recognition and Some New Baselines. In Proceedings of the International Conference on Pattern Recognition Applications and Methods, Porto, Portugal, 24–26 February 2017; Volume 2, pp. 324–331. [Google Scholar]
- Xia, G.S.; Bai, X.; Ding, J.; Zhu, Z.; Belongie, S.; Luo, J.; Datcu, M.; Pelillo, M.; Zhang, L. DOTA: A large-scale dataset for object detection in aerial images. In Proceedings of the IEEE CVPR, Salt Lake City, UT, USA, 18–22 June 2018; pp. 3974–3983. [Google Scholar]
- Cheng, G.; Han, J.; Zhou, P.; Guo, L. Multi-class geospatial object detection and geographic image classification based on collection of part detectors. J. Photogramm. Remote. Sens. 2014, 98, 119–132. [Google Scholar] [CrossRef]
- Kingma, D.P.; Ba, J. Adam: A method for stochastic optimization. arXiv 2014, arXiv:1412.6980. [Google Scholar]
- Everingham, M.; Winn, J. The pascal visual object classes challenge 2012 (VOC2012) development kit. Pattern Anal. Stat. Model. Comput. Learn. Tech. Rep 2011, 8, 5. [Google Scholar]
- Tian, Z.; Shen, C.; Chen, H.; He, T. Fcos: Fully convolutional one-stage object detection. In Proceedings of the IEEE ICCV, Seoul, Korea, 27 October–2 November 2019; pp. 9627–9636. [Google Scholar]
- Huang, J.B.; Singh, A.; Ahuja, N. Single Image Super-resolution from Transformed Self-Exemplars. In Proceedings of the Proceedings of the IEEE Conference on Computer Vision and Pattern Recognition, Boston, MA, USA, 7–12 June 2015; pp. 5197–5206. [Google Scholar]
- Lim, B.; Son, S.; Kim, H.; Nah, S.; Mu Lee, K. Enhanced deep residual networks for single image super-resolution. In Proceedings of the IEEE CVPRW, Honolulu, HI, USA, 21–26 July 2017; pp. 136–144. [Google Scholar]
- Zhang, Y.; Li, K.; Li, K.; Wang, L.; Zhong, B.; Fu, Y. Image super-resolution using very deep residual channel attention networks. In Proceedings of the ECCV, Munich, Germany, 8–14 September 2018; pp. 286–301. [Google Scholar]
- Li, X.; Wang, W.; Wu, L.; Chen, S.; Hu, X.; Li, J.; Tang, J.; Yang, J. Generalized Focal Loss: Learning Qualified and Distributed Bounding Boxes for Dense Object Detection. arXiv 2020, arXiv:2006.04388. [Google Scholar]
- Yang, Z.; Liu, S.; Hu, H.; Wang, L.; Lin, S. Reppoints: Point set representation for object detection. In Proceedings of the IEEE ICCV, Seoul, Korea, 27 October–2 November 2019; pp. 9657–9666. [Google Scholar]
- Chen, K.; Pang, J.; Wang, J.; Xiong, Y.; Li, X.; Sun, S.; Feng, W.; Liu, Z.; Shi, J.; Ouyang, W.; et al. Hybrid task cascade for instance segmentation. In Proceedings of the IEEE CVPR, Long Beach, CA, USA, 15–20 June 2019; pp. 4974–4983. [Google Scholar]
- Qiao, S.; Chen, L.C.; Yuille, A. Detectors: Detecting objects with recursive feature pyramid and switchable atrous convolution. In Proceedings of the IEEE CVPR, Nashville, TN, USA, 20–25 June 2021; pp. 10213–10224. [Google Scholar]
Figure 1.
An overview of our proposed RSAR method.

Figure 2.
The structure of each module in our proposed method.

Figure 3.
Visualizations of the original HR image () and the super-resolved images using different SR methods: bicubicly up-sampling (), SR module () and RASR method (). Furthermore, the absolute difference of , and is visualized.
Figure 3.
Visualizations of the original HR image () and the super-resolved images using different SR methods: bicubicly up-sampling (), SR module () and RASR method (). Furthermore, the absolute difference of , and is visualized.

Figure 4.
Amplitude–frequency curves of original HR images and the output images of RASR and its variants.
Figure 4.
Amplitude–frequency curves of original HR images and the output images of RASR and its variants.

Figure 5.
Visual results achieved by different SR methods.

Figure 6.
Qualitative results achieved by different methods on three example scenes. We use green bounding boxes to mark the ground-truth labels and detection results.
Figure 6.
Qualitative results achieved by different methods on three example scenes. We use green bounding boxes to mark the ground-truth labels and detection results.


Table 1.
Quantitative evaluation results of image quality achieved by different variants of our proposed RASR. We use SSIM and PSNR as the evaluation indices.
Table 1.
Quantitative evaluation results of image quality achieved by different variants of our proposed RASR. We use SSIM and PSNR as the evaluation indices.
| Down-Sampling Metrics | Datasets | Bicubic | SR | RASR | |||
|---|---|---|---|---|---|---|---|
| SSIM | PSNR | SSIM | PSNR | SSIM | PSNR | ||
| Bicubic | HRSC2016 [29] | 0.659 | 23.55 | 0.687 | 24.31 | 0.698 | 24.44 |
| DOTA [30] | 0.672 | 25.89 | 0.698 | 26.12 | 0.718 | 26.31 | |
| NWPU VHR-10 [31] | 0.856 | 30.18 | 0.857 | 30.48 | 0.870 | 30.72 | |
| Bicubic + Gaussian Blur | HRSC2016 [29] | 0.627 | 22.65 | 0.664 | 23.42 | 0.697 | 24.25 |
| DOTA [30] | 0.642 | 24.21 | 0.654 | 25.32 | 0.694 | 25.02 | |
| NWPU VHR-10 [31] | 0.841 | 28.71 | 0.838 | 29.57 | 0.856 | 30.38 | |
Table 2.
Quantitative evaluation results of detection performance achieved by different variants of our proposed RASR. We use Faster-RCNN (with ResNet50 as backbone) and FCOS (with ResNet101 as backbone) as the evaluation detectors, and use as the evaluation indices. Note that, the improvement of RASR compared to SR module is shown in the table.
| Down-Sampling Metrics | Detector | Inputs | Datasets | ||
|---|---|---|---|---|---|
| HRSC2016 [29] | DOTA [30] | NWPU VHR-10 [31] | |||
| Bicubic | Faster-RCNN [22] | Bicubic | 0.788 | 0.633 | 0.861 |
| SR | 0.838 | 0.655 | 0.875 | ||
| RASR | 0.859 (0.021↑) | 0.746 (0.091↑) | 0.894 (0.019↑) | ||
| HR images | 0.894 | 0.847 | 0.921 | ||
| FCOS [34] | Bicubic | 0.478 | 0.513 | 0.822 | |
| SR | 0.626 | 0.597 | 0.852 | ||
| RASR | 0.735 (0.109↑) | 0.695 (0.098↑) | 0.898 (0.046↑) | ||
| HR images | 0.839 | 0.792 | 0.892 | ||
| Bicubic + Gaussian Blur | Faster-RCNN [22] | Bicubic | 0.785 | 0.675 | 0.856 |
| SR | 0.876 | 0.772 | 0.877 | ||
| RASR | 0.884 (0.008↑) | 0.780 (0.008↑) | 0.907 (0.030↑) | ||
| HR images | 0.894 | 0.847 | 0.921 | ||
| FCOS [34] | Bicubic | 0.149 | 0.521 | 0.807 | |
| SR | 0.772 | 0.715 | 0.852 | ||
| RASR | 0.780 (0.008↑) | 0.716 (0.001↑) | 0.898 (0.046↑) | ||
| HR images | 0.839 | 0.792 | 0.892 | ||
Table 3.
Quantitative evaluation results of detection performance achieved by different variants of our proposed RASR. We use Faster-RCNN (with ResNet50 as backbone) as the evaluation detector, and use , , and as the evaluation indices. Note that, since there is no large ship on NWPU VHR-10 dataset, the on this dataset is −1.
| Dataset | Inputs | Evaluation Indices | |||
|---|---|---|---|---|---|
| HRSC2016 [29] | Bicubic | 0.788 | 0.016 | 0.817 | 0.865 |
| SR | 0.838 | 0.050 | 0.863 | 0.891 | |
| RASR | 0.859 (0.021↑) | 0.102 (0.052↑) | 0.884 (0.021↑) | 0.918 (0.027↑) | |
| HR Images | 0.894 | 0.399 | 0.925 | 0.917 | |
| DOTA [30] | Bicubic | 0.633 | 0.631 | 0.739 | 0.258 |
| SR | 0.655 | 0.647 | 0.755 | 0.285 | |
| RASR | 0.746 (0.091↑) | 0.733 (0.086↑) | 0.820 (0.065↑) | 0.338 (0.053↑) | |
| HR Images | 0.847 | 0.842 | 0.892 | 0.460 | |
| NWPU VHR-10 [31] | Bicubic | 0.861 | 0.036 | 0.896 | −1 |
| SR | 0.875 | 0.011 | 0.910 | −1 | |
| RASR | 0.894 (0.019↑) | 0.162 (0.151↑) | 0.913 (0.003↑) | −1 | |
| HR Images | 0.921 | 0.230 | 0.946 | −1 | |
Table 4.
Comparisons of the number of parameters (#Param.), SSIM score and PSNR score for different SR methods on HRSC2016, DOTA and NWPU VHR-10 datasets. The best results are in bold faces, and the second results are ubderlined. Note that, the Time is the average processing time per image of each method on the DOTA validation dataset.
| Method | #Param. | Time | HRSC2016 | DOTA | NWPU VHR-10 | |||
|---|---|---|---|---|---|---|---|---|
| SSIM | PSNR | SSIM | PSNR | SSIM | PSNR | |||
| SelfExSR [35] | None | 37.878 s | 0.670 | 24.09 | 0.625 | 24.64 | 0.856 | 30.48 |
| RCAN [37] | 15.66 M | 69.746 ms | 0.689 | 24.30 | 0.704 | 26.63 | 0.861 | 30.29 |
| SRCNN [11] | 0.12 M | 15.944 ms | 0.672 | 23.82 | 0.682 | 26.06 | 0.861 | 30.59 |
| EDSR [36] | 39.17 M | 42.114 ms | 0.683 | 24.01 | 0.701 | 26.51 | 0.863 | 30.62 |
| VDSR [12] | 0.67 M | 29.978 ms | 0.677 | 23.92 | 0.686 | 23.11 | 0.863 | 30.71 |
| RASR | 2.50 M | 38.626 ms | 0.698 | 24.10 | 0.718 | 26.31 | 0.870 | 30.72 |
Table 5.
Quantitative results (i.e., mAP50) achieved by different methods (based on ResNet101) on the HRSC2016, DOTA and NWPU VHR-10 datasets. Our RASR-Faster-RCNN achieves state-of-the-art detection performance. The best results are in bold faces.
Table 5.
Quantitative results (i.e., mAP50) achieved by different methods (based on ResNet101) on the HRSC2016, DOTA and NWPU VHR-10 datasets. Our RASR-Faster-RCNN achieves state-of-the-art detection performance. The best results are in bold faces.
| Method | Datasets | ||
|---|---|---|---|
| HRSC2016 [29] | DOTA [30] | NWPU VHR-10 [31] | |
| GFL [38] | 0.826 | 0.575 | 0.856 |
| Reppoints [39] | 0.792 | 0.592 | 0.875 |
| HTC [40] | 0.634 | 0.668 | 0.863 |
| DetectoRS [41] | 0.860 | 0.677 | 0.808 |
| Faster-RCNN [22] | 0.820 | 0.651 | 0.853 |
| RASR-Faster-RCNN | 0.873 | 0.737 | 0.884 |
Publisher’s Note: MDPI stays neutral with regard to jurisdictional claims in published maps and institutional affiliations. |
© 2022 by the authors. Licensee MDPI, Basel, Switzerland. This article is an open access article distributed under the terms and conditions of the Creative Commons Attribution (CC BY) license (https://creativecommons.org/licenses/by/4.0/).
Share and Cite
MDPI and ACS Style
Zou, H.; He, S.; Cao, X.; Sun, L.; Wei, J.; Liu, S.; Liu, J. Rescaling-Assisted Super-Resolution for Medium-Low Resolution Remote Sensing Ship Detection. Remote Sens. 2022, 14, 2566. https://doi.org/10.3390/rs14112566
AMA Style
Zou H, He S, Cao X, Sun L, Wei J, Liu S, Liu J. Rescaling-Assisted Super-Resolution for Medium-Low Resolution Remote Sensing Ship Detection. Remote Sensing. 2022; 14(11):2566. https://doi.org/10.3390/rs14112566
Chicago/Turabian StyleZou, Huanxin, Shitian He, Xu Cao, Li Sun, Juan Wei, Shuo Liu, and Jian Liu. 2022. "Rescaling-Assisted Super-Resolution for Medium-Low Resolution Remote Sensing Ship Detection" Remote Sensing 14, no. 11: 2566. https://doi.org/10.3390/rs14112566
Note that from the first issue of 2016, this journal uses article numbers instead of page numbers. See further details here.