Article

Synchronization, Decoupling, and Regime Shift of Urban Thermal Conditions in Xi’an, an Ancient City in China under Rapid Expansion

1
National Engineering Laboratory for Applied Technology of Forestry & Ecology in South China, Central South University of Forestry and Technology (CSUFT), Changsha 410004, China
2
College of Life Science and Technology, Central South University of Forestry and Technology (CSUFT), Changsha 410004, China
3
Key Laboratory for Earth Surface Processes of the Ministry of Education, College of Urban and Environmental Sciences, Peking University, Beijing 100871, China
4
Key Laboratory of Tropical Atmosphere-Ocean System, Ministry of Education, School of Atmospheric Sciences, Sun Yat-sen University, Guangzhou 510275, China
5
Southern Marine Science and Engineering Guangdong Laboratory, Zhuhai 519000, China
6
Department of Earth & Environmental Science, Xi’an Jiaotong University, Xi’an 710049, China
*
Author to whom correspondence should be addressed.
Remote Sens. 2022, 14(11), 2586; https://doi.org/10.3390/rs14112586
Submission received: 26 April 2022 / Revised: 21 May 2022 / Accepted: 24 May 2022 / Published: 27 May 2022
(This article belongs to the Section Urban Remote Sensing)

Abstract

:
Urbanization has profound impacts on economic development and environmental quality. Some of the serious consequences of urbanization are the changes in the thermal environment, which directly affect the greater environment and quality of life. Although many studies have been performed on urban heat islands, few have specifically examined the thermal evolution of rapidly expanding ancient cities and the impacts of urbanization on the thermal environments of important heritage sites. In this study, we analyzed the temporal and spatial patterns of the thermal environment quantified as the surface urban heat island (SUHI) and land surface temperature (LST) values from 2000 to 2018 in Xi’an, an ancient city with rich cultural heritage in China. Specifically, we analyzed the temporal evolution of the thermal environments of the functional zones and heritage sites and explore their coupling relationships with the overall temperature of the study area using a statistical analysis approach. Furthermore, we revealed time-sensitive changes in temperature regimes using the newly proposed double temperature curve approach (DTCA). The results showed that the heat island phenomenon has been intensifying in Xi’an, as evidenced by the summer daytime mean SUHI values being greater than 7 °C continuously since 2010 and the increased frequency of high-intensity SUHI effects. Extreme heat conditions were more frequent in the old urban area (built-up and in existence before 2000) than in the new urban area, while SUHI values in the new area deteriorated more rapidly. The changes in temperature in the functional zones were strongly synchronized with the overall temperature changes in Xi’an, and the temperature differences increased linearly with the overall temperature. The LST values in the four major historical heritage sites investigated in this study were 2–8 °C higher than the background temperature and were decoupled from background temperature changes. From the DTCA, we found the time periods of the thermal environment regime changes for each functional zone or heritage site, which were largely the result of policy guidance. Regional synchronization, site decoupling, and regime shifts in LST suggest opportunities for regional planning and urban landscape optimization to reduce adverse effects of urbanization on the urban environment, particularly in cities with rich historical heritage sites.

1. Introduction

Urbanization is accelerating around the world. According to The Trends of World Urbanization released by the United Nations Department of Economic and social Affairs (UNDESA) in 2018, the global urbanization rate is expected to reach 68% by 2050, and nearly 90% of all globalization will happen in Asia and Africa [1]. As a country with one of the fastest urbanization rates in the world, China’s urbanization rate exceeded 60% at the end of 2019 [2,3]. The expansion of urban construction land, the population, and urban space leads to increases in artificial surfaces and decreases in natural surfaces [4,5]. Subsequently, the “urban heat island (UHI) effect” is formed, which introduces higher temperatures in the urban area than its surroundings [6,7,8]. The high intensity of the UHI effect has resulted in many negative impacts, such as impairing air quality, increasing energy and water consumption, and affecting the physical and mental health of urban residents [9,10,11].
In the process of urbanization, natural landscapes are transformed into a series of built-up areas such as buildings, roads, and parking lots. Changes in land surface temperature are related to the land use and land cover characteristics, which lead to strong heterogeneity in the urban area [12,13]. Changes in the spatial patterns of the urban heat island phenomenon during the process of urbanization have been identified at different spatial scales, including for individual cities, urban agglomerations, and countries [14,15,16,17,18]. However, the heat island effect is a phenomenon not only of high spatial heterogeneity but also of high temporal variability [12]. Most previous studies were based on data acquired at a few points in time, while few studies have analyzed the changes in time series to examine how the land use and land cover evolution caused by continuous rapid urbanization affects temperature trends [19,20,21]. It is necessary to clarify the temperature and SUHI changes in continuous time series to identify the periods and reasons for the temperature changes in different locations, and further to take targeted measures to reduce the adverse effects of the deterioration of the urban thermal environment [22]. Therefore, more research needs to focus on the characteristic evolution of heat islands over time [23].
Cities are not homogeneous but instead are highly heterogeneous, which is reflected in the differences in population and the composition of the urban landscape in different regions, resulting in uneven spatial distributions of temperature [24]. Therefore, research on the urban thermal environment should focus on the temperature differences between different regions, not just between urban and rural areas [24]. The establishment of functional areas is a form of modern urban development. Such areas reflect the characteristics of the city [25]. Different functional zones play different roles due to the different development strategies, meaning the resulting ecological effects are also different [26,27,28,29,30]. Some studies have analyzed the impacts of urbanization on thermal conditions by dividing the urban areas according to their functions, such as commercial districts, entertainment areas, and industrial parks [24,30,31,32,33], which is certainly valuable for exploring the various mechanisms operating in these functional areas. On the other hand, government agencies also formulate urbanization development strategies and guidelines over larger spatial scales [34,35], and few studies have investigated how the temperatures change in these larger regions in continuous time series as urbanization progresses. Providing information about the temporal changes in temperature in different functional zones and the changes associated with the background climate can help urban planners and managers rationalize their landscaping and regional planning approaches to improve the efficiency of urban thermal management [36]. Therefore, more research should analyze the responses of the thermal environment in urban functional zones to urban development.
The cultural value of preserving ancient sites has been recognized and is cherished by governments globally, allowing tourists from all over the world to understand the development of human civilization [37,38,39]. Under the influence of climate changes, such as temperature and humidity changes, cultural heritage sites will be potentially exposed to various unknown risks, posing new challenges to their protection [40]. Studies have been conducted to understand the potential damage of climate change to cultural heritage in different countries [41,42,43,44]. The continuously deteriorating thermal environment poses a challenge to the protection of cultural relics [40]. However, few studies analyze the temperature changes in the sites area during urbanization, as well as their relationship with the overall temperature of the city, which is necessary to provide support for the formulation of site protection strategies.
In this study, we analyzed the SUHI effects in Xi’an, a famous ancient city in China, from 2000 to 2018 using Moderate-Resolution Imaging Spectroradiometer (MODIS) land surface temperature (LST) products in conjunction with land use and land cover data provided by the Resource and Environment Science and Data Center (http://www.resdc.cn) (accessed on 5 March 2020). We analyzed the changes in the thermal environments in functional zones and relic sites in the time series and studied their coupling relationships with overall temperature changes in the whole study area. Combined with the existing techniques and statistical methods, we developed a new approach to examine the synchronization, decoupling, and regime shifts (and timing) of urban thermal conditions. The purposes of this study were to: (1) explore the temporal evolution of urban heat island intensity and surface temperature values in functional zones; (2) analyze the temperature changes in functional zones or relic sites area with changes to the overall temperature of the city; (3) detect the time periods when the temperature regimes of functional zones or relic sites changed compared with the overall temperature regime of the city using the new proposed method.
Specifically, the paper is organized in the following way. We first calculate the urban heat island intensity and analyze the temporal changes. We then propose a new approach, along with existing techniques and statistical methods, to examine the synchronization, decoupling, and regime shifts (timing and magnitude) of thermal conditions of the city and the areas of interest (main functional zones and relic sites area). Limitations and opportunities are discussed at the end.

2. Materials and Methods
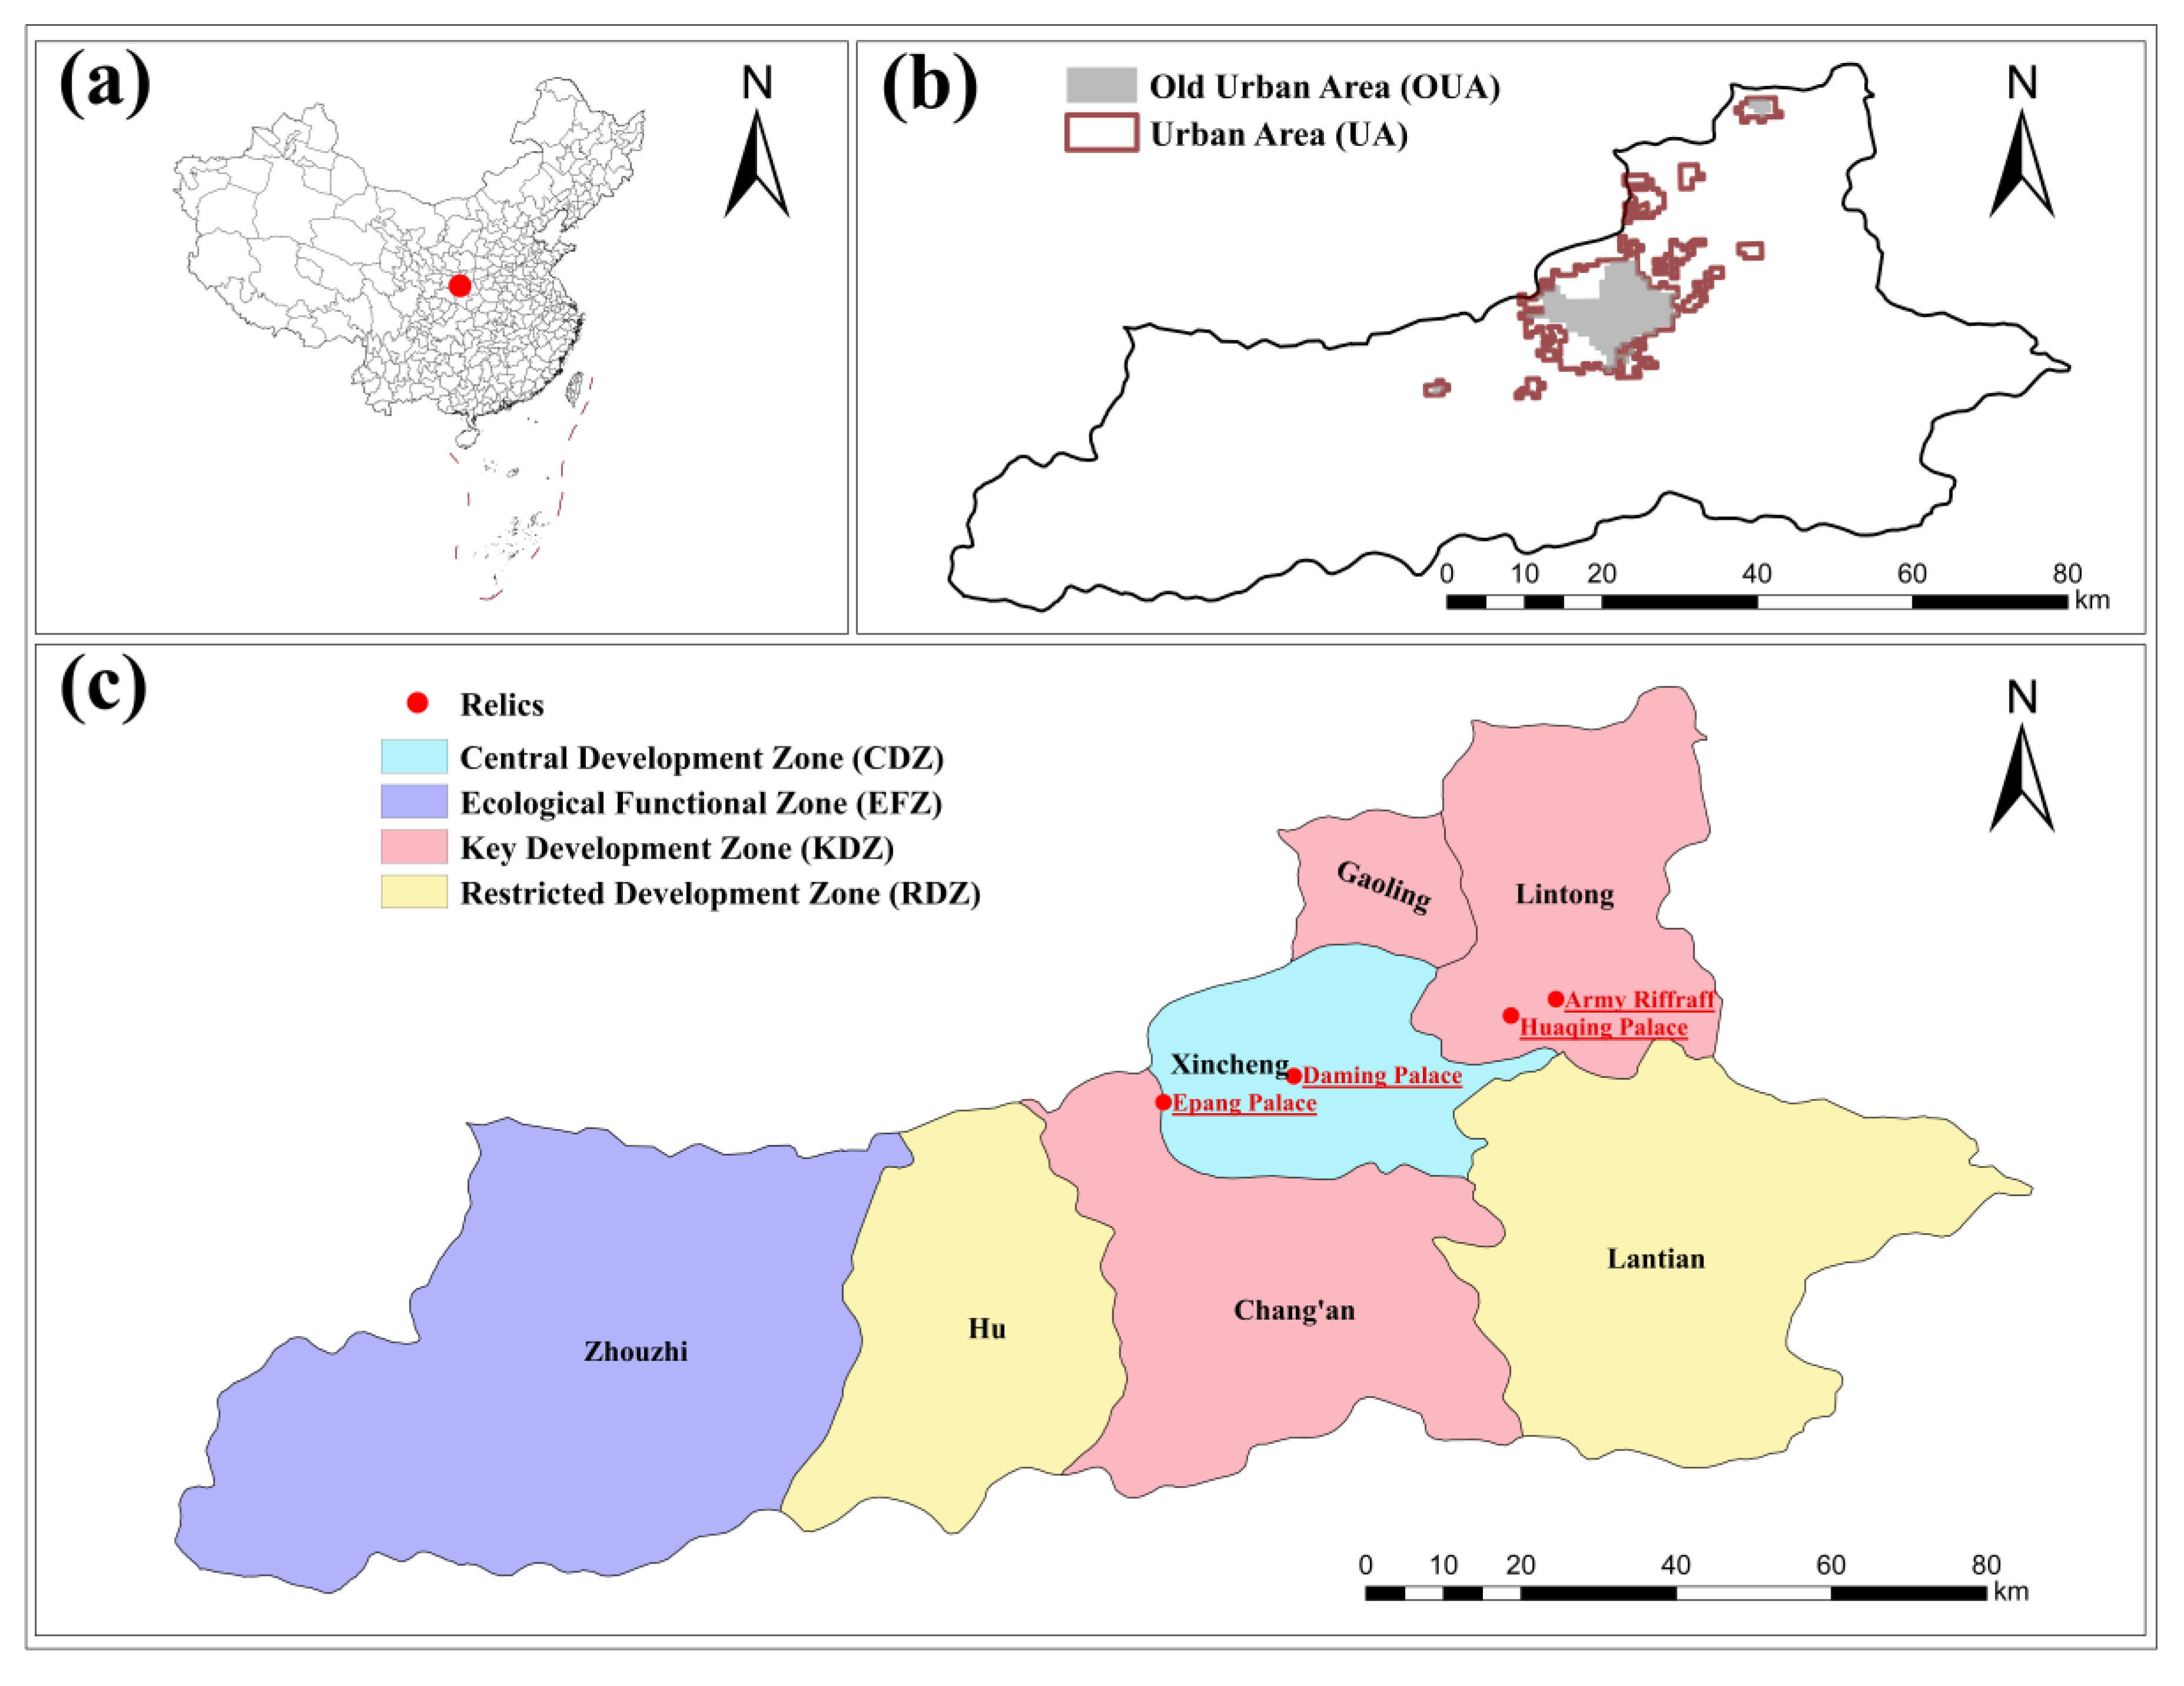
2.1. Study Area

Xi’an (33°65′–34°75′N, 107°67′–109°82′E), the capital of Shaanxi Province, is an important central city in Western China. It is located in the Guanzhong Plain, a broad basin surrounded by the Qinling Mountains to the south and the Loess Plateau to the north. As one of the important birthplaces of Chinese civilization and the Chinese nation, more than a dozen dynasties established their capitals here. There are 72 imperial tombs and the ruins of four major capitals. The cultural relics here are well preserved. Xi’an is characterized by a temperate continental climate. The annual average temperature in Xi’an is about 13.0~13.7 °C and annual precipitation is approximately 552~719 mm [45]. According to the administrative division, Xi’an is divided into 7 districts (Chang’An, Xincheng, Gaoling, Hu, Lantian, Lintong, and Zhouzhi) (Figure 1). According to the urban plan, Xi’an can be divided into four functional zones: (1) The central development zone (CDZ), dominated by plains, containing 78% of the total population and 91% of the total GDP, including Xincheng District. The vegetation coverage rate in this area is 1.8%, artificial surfaces account for 64.1% of the total area, and farmland accounts for 32.6%. (2) The key development zone (KDZ), which is the area containing the technology industry, universities, and educational institutions, including Chang’an, Lintong, and Gaoling Districts. The vegetation coverage rate in this area is 26.6%, artificial surfaces account for 16.2% of the total area, and farmland accounts for 56.6%. (3) The restricted development zone (RDZ), a transitional functional zone between the economic development and ecological protection zones, including Hu and Lantian Districts. The vegetation coverage rate in this area is 57.9%, artificial surfaces account for 5.3% of the total area, and farmland accounts for 36.7%. (4) The ecological functional zone (EFZ), which plays a significant role in sustainable development, including Zhouzhi District. The vegetation coverage rate in this area is 75.3%, artificial surfaces account for 3.8% of the total area, and farmland accounts for 20.7%.
Xi’an has undergone rapid urbanization, coupled with its rich historical sites, making it an ideal city for our study. In this study, we selected four relics or historical heritage sites (i.e., Army Riffraff, Huaqing Palace, Epang Palace, and Daming Palace) to analyze the changes in the thermal environment of the relics and their surroundings. The Terracotta Army and Huaqing Palace are located in Lintong District (belonging to the KDZ), covering areas of 0.01912 and 0.003 square kilometers, respectively, while Daming Palace and Epang Palace are located in Xincheng District (belonging to CDZ), covering areas of 3.2 and 2.3 square kilometers, respectively.

2.2. Retrieval and Quantification of Land Surface Temperature Data

The LST data from July 2000 to September 2018 provided by the MODIS Land Surface Temperature L3 product MOD11A2 Version 6 with a spatial resolution of 1 km (https:\\lpdaac.usgs.gov\\products\\mod11a2v006\\) (accessed on 18 February 2020) were used in this study. The maximum LST values during the daytime and nighttime for each summer (July to September) from 2000 to 2018 at the pixel level were calculated in Google Earth Engine (GEE) to eliminate the influence of cloud cover on image quality [46,47]. They were categorized as low (less than the first quartile), sub-low (between the first and second quartiles), sub-high (between the second and third quartiles), and high (between the third and fourth quartiles) for the entire study period. The Lorenz curve is commonly used to describe the inequality in the distribution of income among social classes or other population units [48]. In this study, a spatial Lorenz curve was used to show the spatial heterogeneity in distribution and the variation in area with daytime temperatures higher than 35 °C in Xi’an.

2.3. Identification of Urban Area and Calculation of Landscape Pattern Index and SUHI Values

Night light data are indicators of human activity, such as the population density, economic activity, energy use, and CO2 emissions, and have been widely used in urban mapping [49,50,51,52]. In this study, we used DMSP/OLS (https://www.ngdc.noaa.gov/eog/dmsp/) (accessed on 18 February 2020) and VIIRS (https://www.ngdc.noaa.gov/eog/viirs/) (accessed on 18 February 2020) night light data to define the boundaries in 2000 and 2015, respectively.
Combined with nighttime light data, we used land use data with a 1 km resolution provided by the Resource and Environment Science and Data Center (http://www.resdc.cn) (accessed on 5 March 2020) to extract urban areas. Specifically, the urban areas in this study were defined as the impervious surfaces where the night light index values were higher than 35 and 150, respectively, following [53]. This method can be used to estimate the spatial extent of urbanization and can be consistently applied over large areas for intercomparison across different urban settings. It has been widely used in urban area extraction [51,54]. The urban areas extracted in 2000 and 2015 were defined as the old urban area (OUA) and urban area (UA), respectively. The new urban area (NUA) was derived by removing OUA from UA. The rest of the study area except the UA was defined as the rural area.
A surface urban heat island, a manifestation of the urban thermal environment, is defined as the LST difference between urban and rural areas [55,56,57]. In this study, the mean LST in the rural area was calculated. SUHI values were calculated as the LST differences between each pixel in the urban area and the mean value in the rural area. The SUHI quartiles were categorized as low (less than the first quartile), sub-low (between the first and second quantiles), sub-high (between the second and third quartiles), and high (between the third and fourth quartiles). The mean SUHI values during the nighttime and daytime each year were calculated in this study to analyze the changes in heat island intensity over the years. In order to show the spatial distribution of SUHI, mean SUHI, maximum SUHI, and coefficient of variation values over the years, these were calculated at the pixel level.
Different landscapes have different abilities to reflect and absorb solar energy, while different landscape patterns also greatly influence the land surface temperature [58]. In this study, we used the 2000, 2005, 2010, 2015, and 2018 land use data at 1 km resolution provided by the Resource and Environmental Science and Data Center to calculate the landscape pattern index values. Pearson’s correlation analysis was used to investigate the effects of the landscape pattern on the urban thermal environment. In this study, AI (aggregation index), LPI (largest patch index), LSI (landscape shape index), AREA_MN (mean patch area), and PLAND (percentage of landscape) values of green space, water, and impervious surfaces [2,59] were selected as the landscape pattern indexes and calculated for each 3 km × 3 km grid using Fragstats 3.3 with 8 cell neighborhoods [60]. AI indicates the degree of aggregation. It equals the number of similar adjacencies divided by the theoretical maximum possible number of similar adjacencies for that class. LPI is a dominance measure that represents the proportion of the largest patch in a given land type occupying the entire landscape area. AREAMN is the average area of specific landscape patches within an analysis unit. PLAND represents the percentage of the total patch area of a given land type within a given area.

2.4. Trend Analysis

A trend analysis was used to investigate the temporal SUHI trends. Linear regression models and the Mann–Kendall method were used at each pixel, with the SUHI as the dependent variable and year as the independent variable [61]. The slopes of the regression lines and the Mann–Kendall method results were named as SUHI_trend and SUHI_M-K trend, respectively, and their differences from zero were tested at α = 0.05 to examine whether the variable changed significantly over time. For example, a positive SUHI_trend_day with p < 0.05 means that SUHI during the daytime at a specific pixel increased significantly from 2000 to 2018.

2.5. Double Temperature Curve Approach (DTCA)

For each function area and heritage site area, we obtained the annual average temperature and then calculated the LST difference using the city-wide average LST for the year. We first analyzed the relationship between this difference and the average temperature of the city. Then, a double temperature curve approach (DTCA) was proposed to reveal the time-sensitive changes in temperature regimes. The horizontal axis of the curve represents the cumulative mean LST of the whole study area, while the vertical axis represents the cumulative LST difference for a functional zone or a heritage site area. Then, the breakpoint and its standard deviation were automatically obtained from the piecewise regression using the “segmented” package in R, which was used to determine the period when the temperature of each functional zone deviated from the overall temperature of the city. If the thermal environments in both the different zones or site areas and the whole study area are well coupled without regime changes, the double temperature curve should form a straight line. A non-straight line would indicate a temperature regime shift in the zone or at the site area relative to the whole area. More graphic details are given in the results section.

3. Results

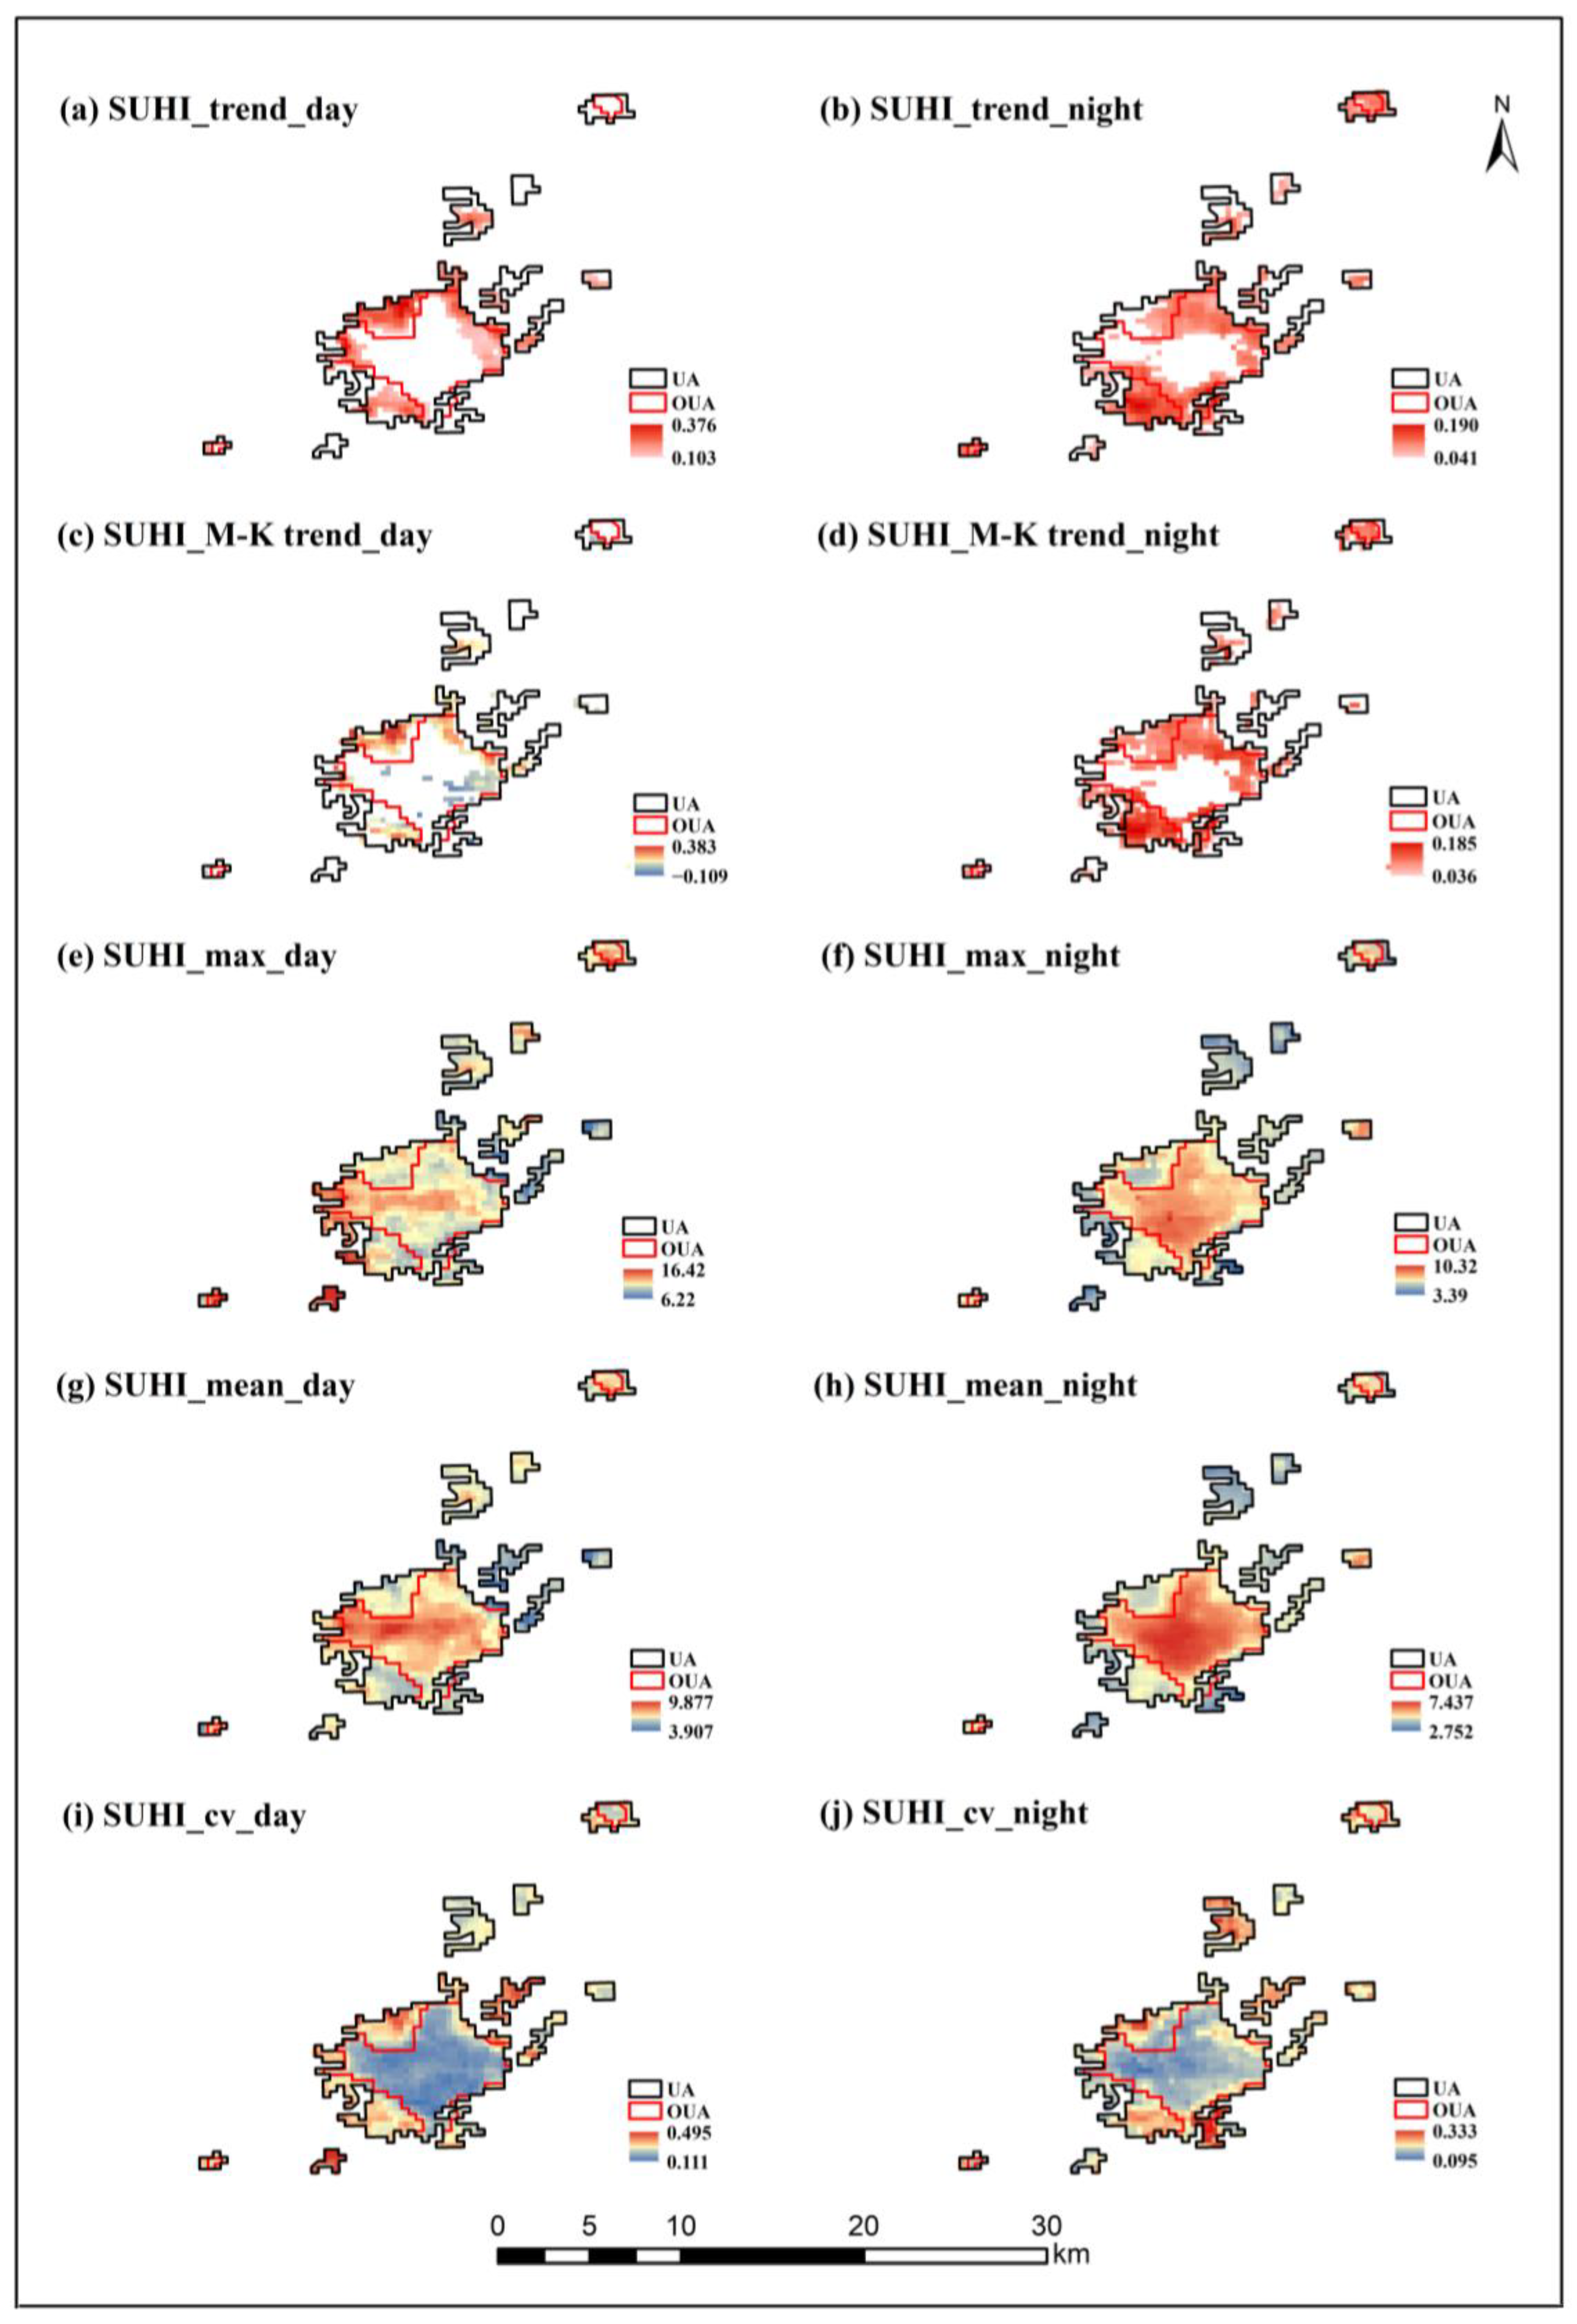
3.1. Spatiotemporal Changes in Urban Thermal Environments

The thermal environment in urban areas (UA) changed from 2000 to 2018, as shown by the increases in SUHI values during daytime and nighttime (Figure 2). The SUHI overall was lower at nighttime compared with the daytime. The mean SUHI values varied more during the daytime compared with the nighttime across the years, particularly from 2000 to 2014.
The heat island phenomenon was more intense in the OUA (old urban area) than NUA (new urban area), although the latter intensified more rapidly (Figure 3). From 2000 to 2014, areas with SUHI values higher than the “sub-low” value accounted for less than 25% of the new urban area, while these SUHI levels accounted for more than 50% in the old urban area (Figure A1). Since 2016, SUHI values in the urban area have increased sharply, which was more pronounced in new urban area, shown by the proportion of new urban areas with SUHI values higher than “sub-low” increasing more. Compared with the old urban area, the area with increased heat island intensity accounted for a larger proportion in the new urban area (Figure 3a–d). The heat island during night showed greater increases in area than during the day. The heat island intensity in the old urban area was higher than that in the new urban area, as shown by the maximum and mean SUHI values (Figure 3e–h). In addition, the heat island intensity of the old urban area had lower coefficients of variation (CV) and remained higher than that of the new urban area (Figure 3i,j). In other words, the temporal trends and maximum, mean, and CV values of the SUHI all showed that the SUHI in the old urban area was sustained, with no trend changes and a low CV during the study period, while the SUHI in the new area increased rapidly.

3.2. LST Variations across Functional Zones

The temperature structures and compositions of LST categories in each functional zone changed with time (Figure 4). The CDZ had the highest temperature values, followed by the KDZ and RDZ, while the EFZ had the lowest temperature values. During the daytime, the temperatures across almost all of the CDZ were continuously at “sub-high” and “high” levels, except in 2003, 2007, and 2009, which was mainly caused by abundant and frequent precipitation (Figure 4b). For example, in the summer of 2007, there were 23 extreme precipitation events; that is, precipitation events with a daily precipitation volume greater than 50 mm. This frequency was higher than the average. Almost 75% of the KDZ had “sub-high” or “high” temperatures, except in 2003, 2007, and 2009, while the temperatures in RDZ were generally lower (Figure 4c,d). In the EFZ, the area with temperatures higher than the “sub-high” level accounted for less than 25% of the total area (Figure 4e). In colder years, such as 2003, 2010, and 2011, the temperatures in the EFC were all lower than the “sub-high” level. At night, in the CDZ, the proportion of the area with temperatures higher than the “sub-high” level was greater than 25% (Figure 4g). Since 2012, the proportion of the area with “high” temperatures has continuously been greater than 75% in the CDZ. The proportion of the area in the KDZ with “high” temperatures sharply increased in 2012 (Figure 4h). On the whole, the temperature conditions worsened at night, with larger areas experiencing “high” temperatures, especially in the CDZ and KDZ. The “high” temperature distributions in the RDZ and EFZ were relatively stable before 2012, then the distribution ranges became significantly larger (Figure 4i,j). In addition, the extreme high temperatures in various areas at night in 2017 were due to the heat wave that year.
On the whole, the distributions of the area with relatively high temperatures in the four functional zones became more imbalanced over the years and the areas with relatively high temperatures were increasingly concentrated in the CDZ and KDZ, as shown by the Lorenz curves moving farther away from the standard line over time (Figure 5). When the slope corresponding to the functional zone is greater than 1, this means that the percentage of the high-temperature area of the zone out of the total high-temperature area is greater than the percentage of the zone in the entire area, while the thermal environment of the functional zone is more severe, such as in the CDZ and KDZ. Figure 6 shows that the slopes in the CDZ were the largest and much higher than 1, the slope of the standard line, meaning that the thermal environment in the CDZ is the most serious. The proportion of high temperature areas in the RDZ are comparatively reasonable, with a slope of nearly 1. For Ethe FZ, the ratio of its high-temperature area to the total high-temperature area becomes smaller each year, and the slope is always less than 1.
The temperature differences between the functional zones increased as the overall temperature of the city rose, while the temperature difference during the daytime was greater than that at night (Figure 6a,b). The temperature difference between CDZ and the whole city was about 5 °C; with the increase in overall temperature, the temperature difference increased as well. In the KDZ, for every 1 °C increase in the overall temperature, the temperature differences between the KDZ and the overall temperatures during the day and night increased by 0.31 °C and 0.12 °C, respectively, as shown by the slopes of their relationships (Table A1). The mean temperature in the RDZ (restricted development zone) was the closest to the mean temperature of the whole city, the temperature difference was close to zero. The temperature in the EFZ (ecological functional zone) was lower than that of the whole city. For every 1 °C increase in overall temperature, the temperature differences between the EFZ and the whole city decreased significantly by 0.36 °C and 0.21 °C during the day and night, respectively.
The double temperature curves clearly showed that the relationships between the cumulative average temperature in the study area and the cumulative temperature differences between the CDZ, EFZ and study area changed during the study period (Figure 6c,d). Specifically, the change periods of the CDZ and RDZ were 2010–2012 and 2006–2010, respectively; that is, after the period, the trend for warming in the CDZ and RDZ was stronger than before. For the EFZ, the period of change was 2007–2009, and the trend of EFZ cooling has been stronger since then. At night, the average temperature for the cumulative study area and the temperature difference between the CDZ and study area increased during 2004 to 2005. The warming trend of the RDZ occurred between 2011 and 2013, and the cooling trend of the EFZ occurred between 2012 and 2013. Temperatures in the KDZ were well synchronized with the average temperature during the study period, without any indication of temporal shifts.

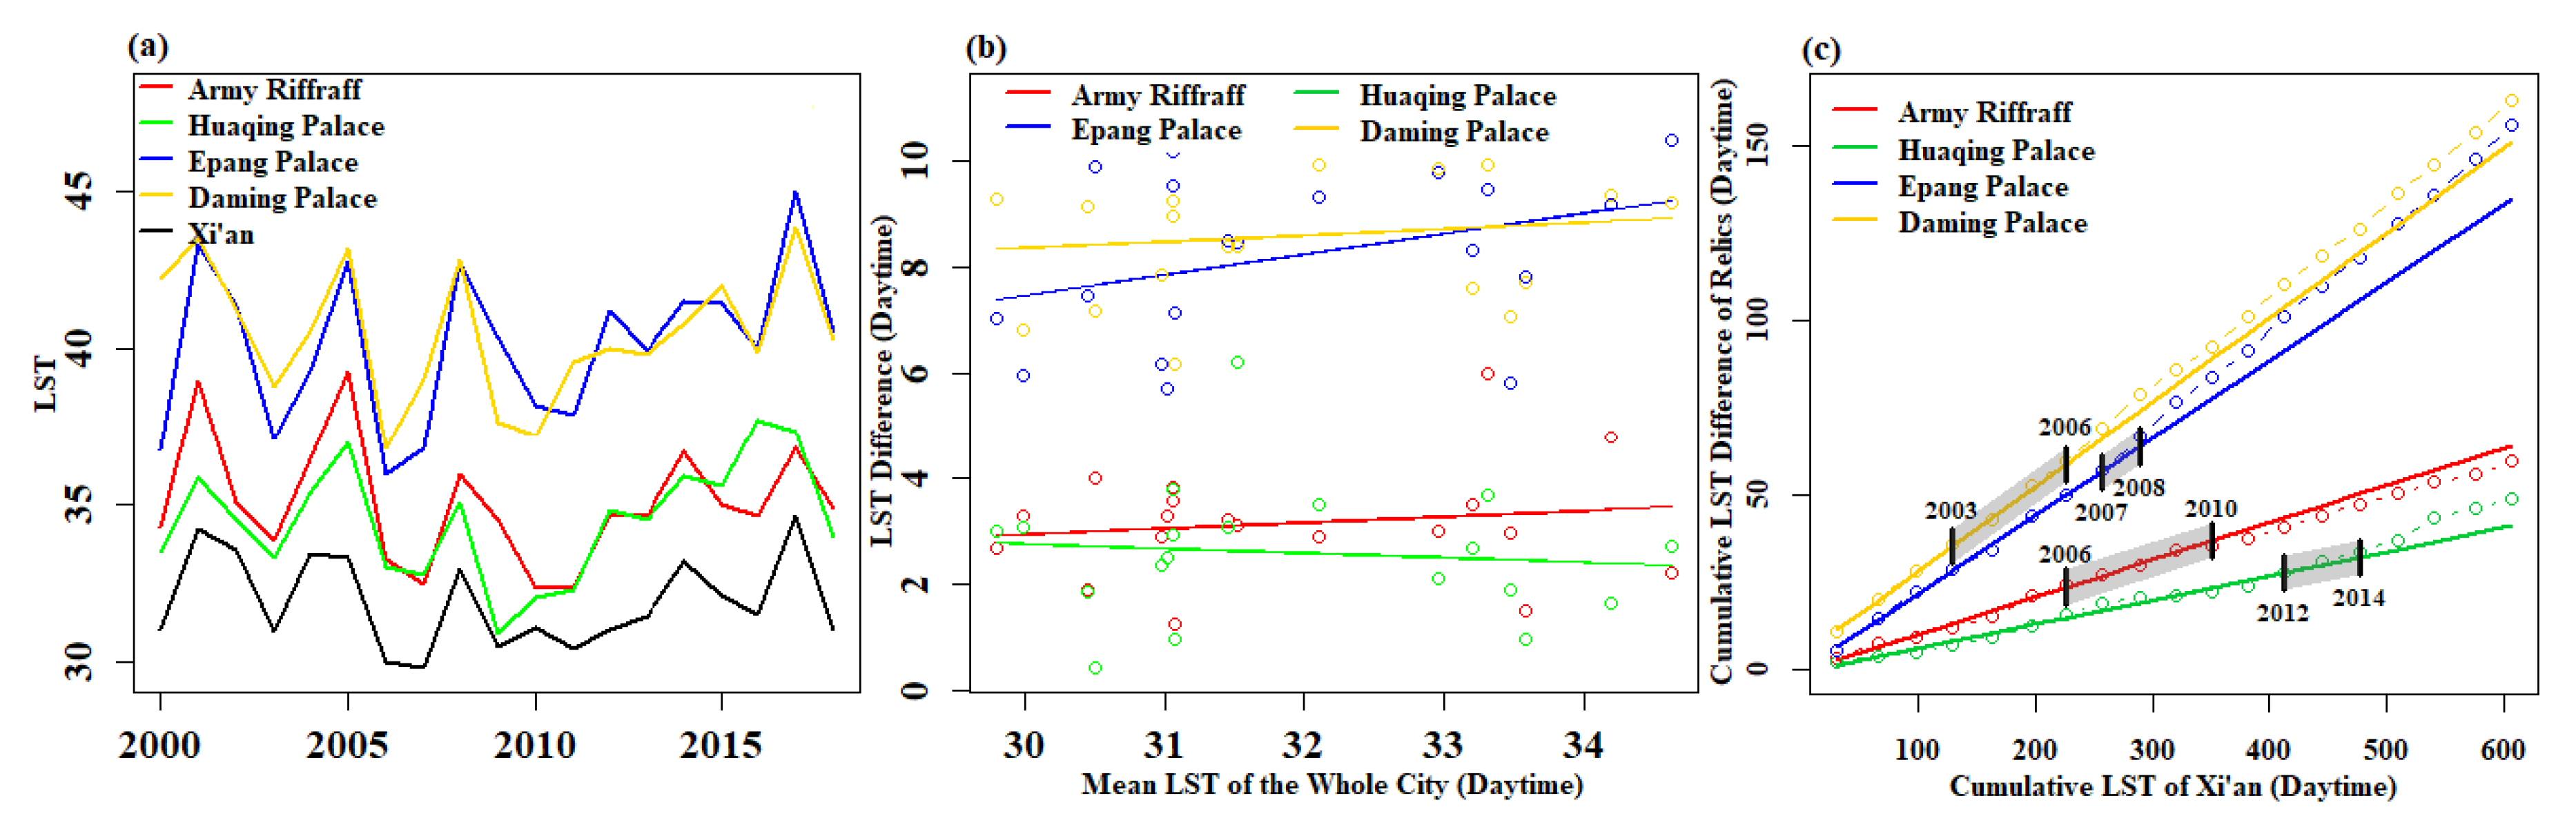
3.3. Changes in Thermal Environment of Relics in the Process of Urban Development

The temperature in Epang Palace was the highest, followed by Daming Palace, the Army Riffraff, and Huaqing Palace (Figure 7a). The temperature differences between the Daming Palace, Epang Palace, and the whole city were the largest at about 8 °C, followed by the Army Riffraff at about 3 °C, while the temperature difference between Huaqing Palace and the whole city was the smallest at about 2 °C (Figure 7b). The temperatures at these sites area were decoupled from the changes in citywide average temperatures as the regression slopes between the temperature differences and the average were not significantly different from zero (Table A1). In other words, the temperature differences were not sensitive to the background temperature.
The double temperature curves showed that temperatures at the four heritage sites increased gradually over time compared with the citywide average temperature (Figure 7c). For the Army Riffraff and Huaqing Palace, the systematic deviations from the citywide average temperature started in 2006 and 2012, respectively. In Daming Palace, the deviation process started in 2003, while that at Epang Palace appeared in 2007; that is, after these periods, the temperature differences between these sites and the study area increased. The annual average temperature difference at each site changed significantly before and after the given site-specific years. For Daming Palace, the average annual temperature difference was about 7.65 °C before 2003. Since 2006, the average annual temperature difference increased by 0.33 °C to about 7.98 °C. For Epang Palace, the average annual temperature difference before 2007 was about 6.92 °C, which increased to 9.55 °C during the subsequent period. For the Terracotta Warriors, the average annual temperature difference before 2006 was about 4.25 °C, then after 2010 it decreased to 3.5 °C. For Huaqing Palace, the average annual temperature difference before 2012 was about 3.56 °C, which then increased by about 1.68 °C.

3.4. Correlation of Landscape with Thermal Environment

The results of the correlation analysis show that both during day and night, green space has the greatest impact on temperature, followed by impervious surfaces, shown by the higher absolute values of the correlation coefficients of green space compared with the other two (Table 1). In addition, the green space is always negatively correlated with temperature, while the impervious surfaces are always positively correlated with temperature. For green space, its effect on temperature at night is less than that during the day, which is the opposite of the impervious surfaces. For the same land type, PLAND has the greatest impact, followed by LPI and AREA_MN. It can be concluded that the more concentrated the green space, the larger the patch area, the simpler the shape, and the better the cooling effect. The more dispersed the impervious surfaces and the smaller the patch area, the less the effect on the temperature.

4. Discussion

4.1. Statistical vs. Double Temperature Curve Analysis

In this study, we proposed the double temperature curve approach (DTCA) to analyze the timing and magnitude of relative changes in temperature in an area in reference to another area. Differing from the conventional statistical analysis on temporal changes of individual trends (Figure 6a,b and Figure 7b), the DTCA compares two paired trends together (Figure 6c,d and Figure 7c). Consequently, the DTCA, an addition to the conventional trend analysis, is able to reveal whether the relationship between the two concurrent temporal trends remains stable or not. A changed relationship suggests that the temporal trend for one entity has deviated from the other and usually indicates systematic changes in one or both of the individual trends. The DTCA is similar to the double mass curve approach that has been frequently used in hydrology to detect systematic shifts in relationships between hydrologic processes, such as precipitation and water yield [62,63,64]. Together with the statistical analysis, the DTCA is capable of identifying systematic shifts in the temperature relationship between two entities.
The statistical analysis in this study shows strong synchronization of the temperature changes in the functional zones with those in Xi’an (Figure 6a,b) and decoupled temperature changes at the four heritage sites from those in Xi’an (Figure 7b). The statistical relationship between the temperatures in functional zones and Xi’an reveals a spectrum of LST synchronization between functional zones and Xi’an, ranging from subdued (i.e., lower temperature increase rate than the average for Xi’an, such as the EFZ) to enhanced zonal warming (i.e., higher temperature increase rate than the average for Xi’an, such as the CDZ). Similar temperature synchronization trends have also been observed in a few studies [22,65]. Surprisingly, contrary to the regional temperature synchronization, the temperature differences between the relics and the whole city had no significant relationship with the changes in overall temperature, meaning they were decoupled. Although the temperatures in the historical sites were consistently higher than the overall or background temperature of the study area, their LST differences with the overall background temperature did not vary but rather remained relatively stable for site-specific values.
On top of these statistical results, the DTCA further reveals that some systematic shifts have taken place in the temperature relationships between these functional zones and the entirety of Xi’an (Figure 6c,d). In fact, it has been getting hotter since 2010 (i.e., CDZ), although the temperature increases have been more subdued since 2007 (i.e., EFZ). The DTCA results from the heritage sites were even more surprising, as the thermal environments at all four sites area have actually been deteriorating starting from site-specific years (Figure 7c). This time-sensitive information is critical for the formulation of proper management plans for the heritage sites, but could not be revealed by the traditional regression analysis. The DTCA and associated findings strongly highlight the importance of and need for continuous long-term studies on the changes in urban thermal environments.

4.2. Importance of Studying Temporal Changes

Several studies have indicated that long-term series studies can explain features that short-term studies cannot reveal [12,66,67]. First, the pronounced interannual variability rates in the SUHI, which varied from 5 to 9 °C and 4 to 6.5 °C during the daytime and nighttime, respectively (Figure 2), could not be adequately manifested in the short term. A sudden rise or drop in temperature in a single year is likely to be the result of heat waves or extreme weather, which greatly interfere when studying the impacts of urban developments on the urban thermal environment [12,19]. Therefore, the overall increasing trends for the SUHI can be very different if only a few years are analyzed, given the large interannual variability. Furthermore, some important but time-specific characteristics of SUHI/LST phenomena during the study period (e.g., the sudden low SUHI in 2003 and sudden high SUHI in 2005) cannot be found (Figure A1). In this study, the research on the continuous time series from 2000 to 2018 avoided contingency results for selected time periods or data. Other studies also reported that the study of continuous time series can intuitively discover which years are hotter than others and analyze whether such thermal phenomena are caused by anthropogenic or natural climate influences [19,21,68].
The importance of time series research is not only reflected in correctly revealing the trends or interannual variability, but also in portraying the SUHI/LST structure (e.g., area fractions of high, medium, and low SUHI/LST values). The temperature structure of the entire study area is constantly changing over time [32,69]. Using SUHI/LST values collected during the whole study period and classifying the LST/SUHI data into thermal environment levels or quantiles can vividly depict the structural evolution of temperature regimes over time (Figure A1 and Figure 4), which calls for long-term data. The quantile classification using data from the entire study period provides a unified framework for comparative analyses of multi-year data to correctly reflect the inter-annual differences and trends and to avoid the interference of climatic extremes. According to the Lorenz curves, it can be seen that the equilibrium degrees of the high temperature distributions in each functional zone show obvious differences over time as well (Figure 5). This phenomenon cannot be reflected in short-term research [70]. The results of research over a year or a several years will inevitably be accidental and cannot reflect the overall trends for surface temperature changes over time, making continuous time series research necessary [12,28].

4.3. Urban Development Zoning and Thermal Environment Changes

By studying how the temperature differences between each functional zone and the study area change with the overall temperature, this study found that as the overall temperature rises, the temperature difference gradually increases. This is consistent with many studies showing that urbanization enhances the urban heat island effect [65,68,71], which means that changes in the urban thermal environment are closely related to urban development. Urban functional zones are the basic units of urban planning, which are defined as areas with similar social and economic functions [36]. Urban thermal environments are strongly affected by the division of urban functional zones, the expansion of impervious surfaces, and the landscape composition [24,32,33,72]. Different functional zones have different development directions [25]. The CDZ, the key area for the city’s economic development, is dominated by plains, containing 78% of the total population. It contains the most developed transportation network and the most abundant development resources in the city and accounts for 91% of the total GDP. As a functional transition area between the ecological functional zone and the economic development zone, the restricted development zone (RDZ) is relatively fragile ecologically and worthy of protection. The mountainous EFZ is the mostly sparsely populated area, accounting for only 4% of the total population, with a focus on water conservation and urban ecological protection, providing ecological support for the sustainable development of the city; consequently, this area is cooler than the rest of the city [73,74].
Under the functional zoning approach, the temperatures in the CDZ and KDZ were the highest, followed by the RDZ and EFZ (Figure 4). As the overall temperatures increased, the temperature differences between the hot zones (such as the CDZ and KDZ) and the cold zones (such as the EFZ) expanded. Therefore, improving the thermal environment in Xi’an can be achieved by transforming the landscape patterns of the hotter zones such as the CDZ and KDZ, as shown by the strong impacts on landscape features, and strengthening the protection of the colder zones such as the EFZ, supporting previous findings [24,31,32]. In the case of heatwaves similar to those in 2011 and 2017, the vulnerable populations in the hot zones, such as the elderly and children, may be moved temporarily to the colder zones [75], because the temperature difference between the hot and cold zones can be at least 10 °C.
From the DTCA, we found periods of change in the thermal environments of each functional zone, which we believe were the result of the policy guidance in each zone. The policy approaches in these zones differ, which makes the development strategies for the functional zones different and further leads to different changes in their thermal environments [24,76]. In the same functional zone, the results of the DTCA during the night and day are different, which may be due to the different effects of various influencing factors and urban characteristics on LST values during the day and night [77,78,79,80]. Specifically, since 2010, reconstruction of the CDZ’s old city has accelerated; large-scale urban villages have been demolished; and a road network around the new administrative center, railway passenger stations, university towns, and industrial parks has been constructed. Changes in industrial locations have a significant impact on the spatial distribution of the urban thermal environment [81]. Since 2006, the RDZ has been vigorously developing in industrial areas, with large-scale road network and industrial park construction projects being carried out, which are considered to be the main driving forces of urban high temperature [81]. The priority of the ecological policy was changed from “sustain economic growth and poverty reduction” to “sustainable development and a green economy” [82]. Since 2007, the EFZ has focused on ecological and environmental protection, promoting tourism development. Effective ecological protection has enhanced the regional forest coverage rate and tree quality, playing a key role in the regional thermal environment [83,84].

4.4. Temperature Decoupling and the Management of Relics

Cultural relics are important for human cultural exchange and inheritance [37,38]. Although the exact consequences of SUHI differences in the order of those observed relevant to relic preservation is currently unknown, more research and precautious measurements for protection should be considered. Many studies have shown that climate change is a major threat to the protection of cultural relics [40,43,85]. Understanding the thermal environmental changes of the relics is critical in order to find adequate protection measures to avoid drastic thermal changes, as elevated temperatures pose challenges to the protection of the relics and the comfort of tourists [40,42]. Therefore, future research should investigate the temperature changes for all relics in the city, which could provide a basis for site-specific protection and management.
This study found that the temperatures at the relic sites were decoupled from the average temperature in Xi’an. In other words, there was no correlation between the temperatures at relic sites and the overall temperature, and the temperatures at the different relic sites were consistently higher than the mean temperature for the entire study area (Figure 7). Traditional ancient building materials have large thermal inertia, strong heat absorption and heat storage capabilities [86,87]. In addition, the old site area is generally characterized by low building heights and relatively open spaces, leading to the absorption of more solar radiation [88]. At the same time, with the rapid development of modern urbanization, the sites have been slowly surrounded by built-up areas that block the near-surface air advection and reduce wind speeds. These factors together mean the sites are isolated from the city as a whole [87,89], leading to the decoupling of their thermal environment from the overall thermal environment of the city.
From the DTCA results, we found that the thermal environment of each site deteriorated during site-specific periods. These changes might be related to site-specific management and innovation activities. For example, in 2006, a large cemetery was discovered in the Army Riffraff area of Xi’an, which is the “second largest tomb in China” that has been unearthed so far. From 2002 to 2007, the archaeological team started the archaeological work on the Epang Palace site. Subsequent renovations, the construction of the archaeological museum, and the use of temperature control equipment inside the museum have had adverse effects on the thermal environment [38,90,91]. Around 2012, the scenic spots in the Huaqing Palace were successively reconstructed, and the area was continuously expanded. The Daming Palace area is located at the junction of the north and south of Xi’an. In 2003, the urban development center of the city began to move north, which accelerated the erosion and destruction of the area. In order to protect the cultural heritage, a masonry restoration and protection project was carried out, which was completed in 2005. The deterioration of the thermal environments in the four relic sites area detected in our study suggest that it is necessary to investigate whether the thermal conditions of all important relics have changed not only in Xi’an, but also in other places, in addition to understanding their driving forces and the consequences of these changes in the management and protection of this cultural heritage. Amelioration strategies and procedures should be put in place accordingly by local management authorities to avoid or reverse the deterioration of the thermal environments.
The decoupling of the temperature differences between relics and the city has important guiding significance for the control of the temperatures of the relic sites. Many studies have found that the thermal environment can be improved by changing the internal landscape pattern [2,72,92,93]. This study shows that green space has a significant negative correlation with temperature. Xi’an has a dry climate and few water bodies, which makes green space a key component of the regional cooling [94,95]. We found that a higher percentage of green space, a larger green patch area, and a more concentrated green patch can lead to a better cooling effect, consistent with previous studies [2,96]. Therefore, the internal high temperature can be alleviated by increasing the concentration and proportion of green space in the heritage park and reducing the LSI (landscape shape index) of the internal landscape. It should be noted that in terms of mitigating the temperature by changing the landscape configuration, there is a city-dependent optimal efficiency threshold [53,97,98]. To achieve the cooling effect most efficiently, further research is needed in Xi’an.

4.5. Limitations and Opportunities

MODIS data have been widely used in studying urban thermal environments, especially in terms of the temporal changes, due to the high temporal resolution (day) and large coverage area [45,99]. In contrast, remote sensing data at higher spatial resolutions usually have a low coverage area over time, presenting challenges in detecting temporal changes in temperature because of the limited number of valid data points [100,101,102]. Nevertheless, MODIS data might be too coarse (pixel size 1 km2) to accurately reflect the temporal changes at the historical sites smaller than 1 km2 (e.g., the Terracotta Army and Huaqing Palace). Temperature changes detected in the small relic sites in our study should represent temperature changes in the 1 km2 areas surrounding the relics, meaning they should only be regarded as a warning sign of likely temperature changes at the relic sites. More detailed investigations should be conducted using high-resolution remote sensing data or ground-based measurements to verify the presence of temperature changes at the warning sites. In essence, the approach presented in this study provides an effective tool for screening out the relics that might have experienced temperature changes among the many historical sites in large cities, providing essential information to relevant management agencies for further investigation and adaptive management. In this study, the thermal environments of different regions were analyzed based on the administrative division of the city. Future research can consider more factors for regional divisions, such as building height, building density, and landscape distribution [103]. In addition, changes in land cover, including changes in cover types and landscape patterns, affect temperature [58,92]. Further research can analyze the impacts of land cover changes on the urban thermal environment, which would require more comprehensive and higher resolution land use data.

5. Conclusions

In this study, we proposed the double temperature curve approach (DTCA) to detect the timing and magnitude of thermal environment changes in one region or site in reference to another. The DTCA is capable of revealing whether systematic changes in one or both of the individual temperature trends have occurred. After applying the DTCA to four relics in Xi’an, we found systematic shifts in temperature trends at these sites compared with the overall temperature trend in Xi’an, which raised alarms to the relevant management agencies in the city. The DTCA approach can readily be applied in multi-city and cross-year studies to detect changes in the spatial and temporal dynamics of the urban thermal environment. In additional to proposing a new approach, this study also analyzed the relationships between the thermal environments of different regions and sites (e.g., functional zones and relic sites) and the overall thermal environment of the city. We found that the temperature differences between the functional zones and the city gradually increased with the increase in the overall temperature of the city. In addition, the temperatures at the relic sites were decoupled from the background temperature changes.

Author Contributions

S.L. designed the research. S.L. and R.G. performed the research. Y.S., S.Z., W.Y., Y.L. and Y.W. contributed to the writing of the paper. All authors have read and agreed to the published version of the manuscript.

Funding

This work was supported by research grants from the National Natural Science Foundation of China (U20A2089 and 41971152) and Hunan Innovative Talent Program (2019RS1062) to S.L.

Data Availability Statement

Not applicable.

Conflicts of Interest

The authors declare no conflict of interest.

Appendix A

Table A1. Slope and intercept values of the fitting lines of LST differences and mean LST values of the whole study area. Note: * represents p < 0.05.
SlopeIntercept
DaytimeCDZ0.23−1.31
KDZ0.31 *−7.20 *
RDZ−0.020.11
EFZ−0.36 *7.74 *
NighttimeCDZ0.36 *−3.51
KDZ0.12 *−0.97
RDZ−0.01−0.16
EFZ−0.21 *2.19 *
RelicsArmy Riffraff0.11−0.42
Huaqing Palace−0.095.32
Epang Palace0.38−4.05
Daming Palace0.124.79
Figure A1. Annual changes in cumulative percentages of daytime SUHI in old and new urban areas (a,b) and nighttime SUHI in old and new urban areas (c,d) from 2000 to 2018.
Remotesensing 14 02586 g0a1

References

  1. Ritchie, H.; Roser, M. Urbanization. In Our World in Data; Global Change Data Lab: Oxford, UK, 2018. [Google Scholar]
  2. Guo, L.; Liu, R.; Men, C.; Wang, Q.; Miao, Y.; Zhang, Y. Quantifying and simulating landscape composition and pattern impacts on land surface temperature: A decadal study of the rapidly urbanizing city of Beijing, China. Sci. Total Envion. 2019, 654, 430–440. [Google Scholar] [CrossRef] [PubMed]
  3. Duan, L.; Liu, Z.; Yu, W.; Chen, W.; Jin, D.; Sun, S.; Dai, R. Trend of Urbanization rate in china various regions. In Proceedings of the IOP Conference Series: Earth and Environmental Science, Moscow, Russia, 27 May–6 June 2019; p. 012008. [Google Scholar]
  4. Lo, C.P.; Quattrochi, D.A.; Luvall, J.C. Application of high-resolution thermal infrared remote sensing and GIS to assess the urban heat island effect. Int. J. Remote Sens. 1997, 18, 287–304. [Google Scholar] [CrossRef] [Green Version]
  5. Liang, L.; Wang, Z.; Li, J. The effect of urbanization on environmental pollution in rapidly developing urban agglomerations. J. Clean. Prod. 2019, 237, 117649. [Google Scholar] [CrossRef]
  6. Oke, T.R. The energetic basis of the urban heat island. Q. J. R. Meteorol. Soc. 1982, 108, 1–24. [Google Scholar] [CrossRef]
  7. Oke, T.R. The urban energy balance. Prog. Phys. Geogr. 1988, 12, 471–508. [Google Scholar] [CrossRef]
  8. Gunawardena, K.R.; Wells, M.J.; Kershaw, T. Utilising green and bluespace to mitigate urban heat island intensity. Sci. Total Environ. 2017, 584, 1040–1055. [Google Scholar] [CrossRef]
  9. Churkina, G.; Kuik, F.; Bonn, B.; Lauer, A.; Grote, R.d.; Tomiak, K.; Butler, T.M. Effect of VOC emissions from vegetation on air quality in Berlin during a heatwave. Environ. Sci. Technol. 2017, 51, 6120–6130. [Google Scholar] [CrossRef] [Green Version]
  10. Santamouris, M.; Kolokotsa, D. On the impact of urban overheating and extreme climatic conditions on housing, energy, comfort and environmental quality of vulnerable population in Europe. Energy Build. 2015, 98, 125–133. [Google Scholar] [CrossRef]
  11. Shahmohamadi, P.; Che-Ani, A.; Etessam, I.; Maulud, K.; Tawil, N. Healthy environment: The need to mitigate urban heat island effects on human health. Procedia. Eng. 2011, 20, 61–70. [Google Scholar] [CrossRef] [Green Version]
  12. Weng, Q.; Fu, P. Modeling annual parameters of clear-sky land surface temperature variations and evaluating the impact of cloud cover using time series of Landsat TIR data. Remote Sens. Environ. 2014, 140, 267–278. [Google Scholar] [CrossRef]
  13. Xian, G.; Crane, M. An analysis of urban thermal characteristics and associated land cover in Tampa Bay and Las Vegas using Landsat satellite data. Remote Sens. Environ. 2006, 104, 147–156. [Google Scholar] [CrossRef]
  14. Li, J.-j.; Wang, X.-r.; Wang, X.-j.; Ma, W.-c.; Zhang, H. Remote sensing evaluation of urban heat island and its spatial pattern of the Shanghai metropolitan area, China. Ecol. Complex. 2009, 6, 413–420. [Google Scholar] [CrossRef]
  15. Yadav, N.; Sharma, C. Spatial variations of intra-city urban heat island in megacity Delhi. Sustain. Cities Soc. 2018, 37, 298–306. [Google Scholar] [CrossRef]
  16. Chakraborty, T.; Hsu, A.; Manya, D.; Sheriff, G. A spatially explicit surface urban heat island database for the United States: Characterization, uncertainties, and possible applications. ISPRS J. Photogramm. Remote Sens. 2020, 168, 74–88. [Google Scholar] [CrossRef]
  17. Zhou, D.; Bonafoni, S.; Zhang, L.; Wang, R. Remote sensing of the urban heat island effect in a highly populated urban agglomeration area in East China. Sci. Total Environ. 2018, 628, 415–429. [Google Scholar] [CrossRef] [PubMed]
  18. Zhou, D.; Zhao, S.; Zhang, L.; Sun, G.; Liu, Y. The footprint of urban heat island effect in China. Sci. Rep. 2015, 5, 11160. [Google Scholar] [CrossRef]
  19. Yao, R.; Wang, L.; Huang, X.; Zhang, W.; Li, J.; Niu, Z. Interannual variations in surface urban heat island intensity and associated drivers in China. J. Environ. Manag. 2018, 222, 86–94. [Google Scholar] [CrossRef]
  20. Sun, R.; Chen, L. Effects of green space dynamics on urban heat islands: Mitigation and diversification. Ecosyst. Serv. 2017, 23, 38–46. [Google Scholar] [CrossRef]
  21. Wang, C.; Myint, S.W.; Wang, Z.; Song, J. Spatio-temporal modeling of the urban heat island in the Phoenix metropolitan area: Land use change implications. Remote Sens. 2016, 8, 185. [Google Scholar] [CrossRef] [Green Version]
  22. Wang, J.; Zhou, W.; Wang, J. Time-Series Analysis Reveals Intensified Urban Heat Island Effects but without Significant Urban Warming. Remote Sens. 2019, 11, 2229. [Google Scholar] [CrossRef] [Green Version]
  23. Zhou, D.; Xiao, J.; Bonafoni, S.; Berger, C.; Deilami, K.; Zhou, Y.; Frolking, S.; Yao, R.; Qiao, Z.; Sobrino, J.A. Satellite Remote Sensing of Surface Urban Heat Islands: Progress, Challenges, and Perspectives. Remote Sens. 2019, 11, 48. [Google Scholar] [CrossRef] [Green Version]
  24. Feng, Y.; Du, S.; Myint, S.W.; Shu, M. Do Urban Functional Zones Affect Land Surface Temperature Differently? A Case Study of Beijing, China. Remote Sens. 2019, 11, 1802. [Google Scholar] [CrossRef] [Green Version]
  25. Hu, T.; Yang, J.; Li, X.; Gong, P. Mapping urban land use by using landsat images and open social data. Remote Sens. 2016, 8, 151. [Google Scholar] [CrossRef]
  26. Batty, M. The size, scale, and shape of cities. Science 2008, 319, 769–771. [Google Scholar] [CrossRef] [Green Version]
  27. Li, C.; Liu, M.; Hu, Y.; Shi, T.; Qu, X.; Walter, M.T. Effects of urbanization on direct runoff characteristics in urban functional zones. Sci. Total Environ. 2018, 643, 301–311. [Google Scholar] [CrossRef]
  28. Wu, J. Urban ecology and sustainability: The state-of-the-science and future directions. Landsc. Urban Plan. 2014, 125, 209–221. [Google Scholar] [CrossRef]
  29. Xu, S.; Qing, L.; Han, L.; Liu, M.; Peng, Y.; Shen, L. A New Remote Sensing Images and Point-of-Interest Fused (RPF) Model for Sensing Urban Functional Regions. Remote Sens. 2020, 12, 1032. [Google Scholar] [CrossRef] [Green Version]
  30. Zhou, W.; Ming, D.; Lv, X.; Zhou, K.; Bao, H.; Hong, Z. SO–CNN based urban functional zone fine division with VHR remote sensing image. Remote Sens. Environ. 2020, 236, 111458. [Google Scholar] [CrossRef]
  31. Huang, X.; Wang, Y. Investigating the effects of 3D urban morphology on the surface urban heat island effect in urban functional zones by using high-resolution remote sensing data: A case study of Wuhan, Central China. ISPRS J. Photogramm. Remote Sens. 2019, 152, 119–131. [Google Scholar] [CrossRef]
  32. Li, T.; Cao, J.; Xu, M.; Wu, Q.; Yao, L. The influence of urban spatial pattern on land surface temperature for different functional zones. Landsc. Ecol. Eng. 2020, 16, 249–262. [Google Scholar] [CrossRef]
  33. Yao, L.; Xu, Y.; Zhang, B. Effect of urban function and landscape structure on the urban heat island phenomenon in Beijing, China. Landsc. Ecol. Eng. 2019, 15, 379–390. [Google Scholar] [CrossRef]
  34. De Jong, M.; Yu, C.; Joss, S.; Wennersten, R.; Yu, L.; Zhang, X.; Ma, X. Eco city development in China: Addressing the policy implementation challenge. J. Clean. Prod. 2016, 134, 31–41. [Google Scholar] [CrossRef]
  35. Liu, M.; Liu, S.; Ning, Y.; Zhu, Y.; Valbuena, R.; Guo, R.; Li, Y.; Tang, W.; Mo, D.; Rosa, I.M.D.; et al. Co-Evolution of Emerging Multi-Cities: Rates, Patterns and Driving Policies Revealed by Continuous Change Detection and Classification of Landsat Data. Remote Sens. 2020, 12, 2905. [Google Scholar] [CrossRef]
  36. Sun, R.; Lü, Y.; Chen, L.; Yang, L.; Chen, A. Assessing the stability of annual temperatures for different urban functional zones. Build. Environ. 2013, 65, 90–98. [Google Scholar] [CrossRef]
  37. Agelakopoulou, T.; Metaxa, E.; Karagianni Ch, S.; Roubani-Kalantzopoulou, F. Air pollution effect of SO2 and/or aliphatic hydrocarbons on marble statues in Archaeological Museums. J. Hazard. Mater. 2009, 169, 182–189. [Google Scholar] [CrossRef]
  38. Luo, X.; Gu, Z.; Li, T.; Meng, X.; Ma, T.; Yu, C. Environmental control strategies for the in situ preservation of unearthed relics in archaeology museums. J. Cult. Herit. 2015, 16, 790–797. [Google Scholar] [CrossRef]
  39. Niknami, K.A. Iran: Archaeological heritage in crisis. J. Cult. Herit. 2005, 6, 345–350. [Google Scholar] [CrossRef]
  40. Sabbioni, C.; Cassar, M.; Brimblecombe, P.; Lefevre, R.-A. Vulnerability of cultural heritage to climate change. EUR-OPA Major Hazards Agreem. Counc. Eur. Novemb. 2008, 11, 112. [Google Scholar]
  41. Grossi, C.M.; Brimblecombe, P.; Harris, I. Predicting long term freeze-thaw risks on Europe built heritage and archaeological sites in a changing climate. Sci. Total Envion. 2007, 377, 273–281. [Google Scholar] [CrossRef]
  42. Richards, J.; Bailey, R.; Mayaud, J.; Viles, H.; Guo, Q.; Wang, X. Deterioration risk of dryland earthen heritage sites facing future climatic uncertainty. Sci. Rep. 2020, 10, 16419. [Google Scholar] [CrossRef]
  43. Sardella, A.; Palazzi, E.; von Hardenberg, J.; Del Grande, C.; De Nuntiis, P.; Sabbioni, C.; Bonazza, A. Risk Mapping for the Sustainable Protection of Cultural Heritage in Extreme Changing Environments. Atmosphere 2020, 11, 700. [Google Scholar] [CrossRef]
  44. Sesana, E.; Gagnon, A.S.; Bonazza, A.; Hughes, J.J. An integrated approach for assessing the vulnerability of World Heritage Sites to climate change impacts. J. Cult. Herit. 2020, 41, 211–224. [Google Scholar] [CrossRef]
  45. Yao, R.; Wang, L.; Huang, X.; Niu, Y.; Chen, Y.; Niu, Z. The influence of different data and method on estimating the surface urban heat island intensity. Ecol. Indic. 2018, 89, 45–55. [Google Scholar] [CrossRef]
  46. Holben, B.N. Characteristics of maximum-value composite images from temporal AVHRR data. Int. J. Remote Sens. 2007, 7, 1417–1434. [Google Scholar] [CrossRef]
  47. Karabulut, M. An examination of relationships between vegetation and rainfall using maximum value composite AVHRR-NDVI data. Turk. J. Bot. 2003, 27, 93–101. [Google Scholar]
  48. Lucky, L.A.; Sam, A.D. Poverty and income inequality in Nigeria: An illustration of Lorenz curve from NBS survey. Am. Econ. Soc. Rev. 2018, 2, 80–92. [Google Scholar] [CrossRef]
  49. Yue, W.; Qiu, S.; Xu, H.; Xu, L.; Zhang, L. Polycentric urban development and urban thermal environment: A case of Hangzhou, China. Landsc. Urban Plan. 2019, 189, 58–70. [Google Scholar] [CrossRef]
  50. Xie, Y.; Weng, Q. Updating urban extents with nighttime light imagery by using an object-based thresholding method. Remote Sens. Environ. 2016, 187, 1–13. [Google Scholar] [CrossRef]
  51. Zhou, Y.; Smith, S.J.; Elvidge, C.D.; Zhao, K.; Thomson, A.; Imhoff, M. A cluster-based method to map urban area from DMSP/OLS nightlights. Remote Sens. Environ. 2014, 147, 173–185. [Google Scholar] [CrossRef]
  52. Zhou, Y.; Smith, S.J.; Zhao, K.; Imhoff, M.; Thomson, A.; Bond-Lamberty, B.; Asrar, G.R.; Zhang, X.; He, C.; Elvidge, C.D. A global map of urban extent from nightlights. Environ. Res. Lett. 2015, 10, 054011. [Google Scholar] [CrossRef]
  53. Peng, J.; Liu, Q.; Xu, Z.; Lyu, D.; Du, Y.; Qiao, R.; Wu, J. How to effectively mitigate urban heat island effect? A perspective of waterbody patch size threshold. Landsc. Urban Plan. 2020, 202, 103873. [Google Scholar] [CrossRef]
  54. Zhang, P.; Imhoff, M.L.; Wolfe, R.E.; Bounoua, L. Characterizing urban heat islands of global settlements using MODIS and nighttime lights products. Can. J. Remote Sens. 2010, 36, 185–196. [Google Scholar] [CrossRef] [Green Version]
  55. Zhou, D.; Zhao, S.; Liu, S.; Zhang, L.; Zhu, C. Surface urban heat island in China’s 32 major cities: Spatial patterns and drivers. Remote Sens. Environ. 2014, 152, 51–61. [Google Scholar] [CrossRef]
  56. Li, H.; Zhou, Y.; Li, X.; Meng, L.; Wang, X.; Wu, S.; Sodoudi, S. A new method to quantify surface urban heat island intensity. Sci. Total Envion. 2018, 624, 262–272. [Google Scholar] [CrossRef] [PubMed]
  57. Costanzini, S.; Despini, F.; Beltrami, L.; Fabbi, S.; Muscio, A.; Teggi, S. Identification of SUHI in Urban Areas by Remote Sensing Data and Mitigation Hypothesis through Solar Reflective Materials. Atmosphere 2021, 13, 70. [Google Scholar] [CrossRef]
  58. Kardinal Jusuf, S.; Wong, N.H.; Hagen, E.; Anggoro, R.; Hong, Y. The influence of land use on the urban heat island in Singapore. Habitat Int. 2007, 31, 232–242. [Google Scholar] [CrossRef]
  59. Yue, W.; Liu, X.; Zhou, Y.; Liu, Y. Impacts of urban configuration on urban heat island: An empirical study in China mega-cities. Sci. Total Environ. 2019, 671, 1036–1046. [Google Scholar] [CrossRef]
  60. McGarigal, K. FRAGSTATS: Spatial Pattern Analysis Program for Quantifying Landscape Structure; US Department of Agriculture, Forest Service, Pacific Northwest Research Station: Corvallis, OR, USA, 1995; Volume 351.
  61. Basarir, A.; Arman, H.; Hussein, S.; Murad, A.; Aldahan, A.; Al-Abri, M.A. Trend detection in annual temperature and precipitation using Mann–Kendall test—A case study to assess climate change in Abu Dhabi, United Arab Emirates. In International Sustainable Buildings Symposium; Springer: Berlin/Heidelberg, Germany, 2017; pp. 3–12. [Google Scholar]
  62. Pirnia, A.; Golshan, M.; Darabi, H.; Adamowski, J.; Rozbeh, S. Using the Mann–Kendall test and double mass curve method to explore stream flow changes in response to climate and human activities. J. Water Clim. Change 2019, 10, 725–742. [Google Scholar] [CrossRef]
  63. Hu, C.; Wang, Y.; Guan, J.; Shi, Z. The causes of runoff variation based on double cumulative curve analysis method. J. Water Resour. Res. 2012, 1, 204–210. [Google Scholar] [CrossRef]
  64. Klemeš, V. Storage mass-curve analysis in a systems-analytic perspective. Water Resour. Res. 1979, 15, 359–370. [Google Scholar] [CrossRef]
  65. Peng, J.; Xie, P.; Liu, Y.; Ma, J. Urban thermal environment dynamics and associated landscape pattern factors: A case study in the Beijing metropolitan region. Remote Sens. Environ. 2016, 173, 145–155. [Google Scholar] [CrossRef]
  66. Weng, Q.; Fu, P. Modeling diurnal land temperature cycles over Los Angeles using downscaled GOES imagery. ISPRS J. Photogramm. Remote Sens. 2014, 97, 78–88. [Google Scholar] [CrossRef]
  67. Huang, F.; Zhan, W.; Voogt, J.; Hu, L.; Wang, Z.; Quan, J.; Ju, W.; Guo, Z. Temporal upscaling of surface urban heat island by incorporating an annual temperature cycle model: A tale of two cities. Remote Sens. Environ. 2016, 186, 1–12. [Google Scholar] [CrossRef]
  68. Zhou, D.; Zhang, L.; Hao, L.; Sun, G.; Liu, Y.; Zhu, C. Spatiotemporal trends of urban heat island effect along the urban development intensity gradient in China. Sci. Total Envion. 2016, 544, 617–626. [Google Scholar] [CrossRef]
  69. Chapman, S.; Watson, J.E.; Salazar, A.; Thatcher, M.; McAlpine, C.A. The impact of urbanization and climate change on urban temperatures: A systematic review. Landsc. Ecol. 2017, 32, 1921–1935. [Google Scholar] [CrossRef]
  70. Yao, R.; Wang, L.; Huang, X.; Niu, Z.; Liu, F.; Wang, Q. Temporal trends of surface urban heat islands and associated determinants in major Chinese cities. Sci. Total Envion. 2017, 609, 742–754. [Google Scholar] [CrossRef]
  71. Zhou, X.; Chen, H. Impact of urbanization-related land use land cover changes and urban morphology changes on the urban heat island phenomenon. Sci. Total Envion. 2018, 635, 1467–1476. [Google Scholar] [CrossRef]
  72. Shi, Y.; Liu, S.; Yan, W.; Zhao, S.; Ning, Y.; Peng, X.; Chen, W.; Chen, L.; Hu, X.; Fu, B. Influence of landscape features on urban land surface temperature: Scale and neighborhood effects. Sci. Total Environ. 2021, 771, 145381. [Google Scholar] [CrossRef]
  73. Zhang, J.; Kang, L.; Li, H.; Ballesteros-Pérez, P.; Skitmore, M.; Zuo, J. The impact of environmental regulations on urban Green innovation efficiency: The case of Xi’an. Sustain. Cities Soc. 2020, 102123. [Google Scholar] [CrossRef]
  74. Hou, L.; Wu, F.; Xie, X. The spatial characteristics and relationships between landscape pattern and ecosystem service value along an urban-rural gradient in Xi’an city, China. Ecol. Indic. 2020, 108, 105720. [Google Scholar] [CrossRef]
  75. Cheng, J.; Xu, Z.; Bambrick, H.; Su, H.; Tong, S.; Hu, W. Heatwave and elderly mortality: An evaluation of death burden and health costs considering short-term mortality displacement. Envion. Int. 2018, 115, 334–342. [Google Scholar] [CrossRef] [PubMed]
  76. Change, I.P.O.C. Climate change 2007: Impacts, adaptation and vulnerability. Genebra Suíça 2001, 14, 452. [Google Scholar]
  77. Logan, T.M.; Zaitchik, B.; Guikema, S.; Nisbet, A. Night and day: The influence and relative importance of urban characteristics on remotely sensed land surface temperature. Remote Sens. Environ. 2020, 247, 111861. [Google Scholar] [CrossRef]
  78. Sobstyl, J.M.; Emig, T.; Qomi, M.J.A.; Ulm, F.J.; Pellenq, R.J. Role of City Texture in Urban Heat Islands at Nighttime. Phys. Rev. Lett. 2018, 120, 108701. [Google Scholar] [CrossRef] [Green Version]
  79. Wicki, A.; Parlow, E. Multiple Regression Analysis for Unmixing of Surface Temperature Data in an Urban Environment. Remote Sens. 2017, 9, 684. [Google Scholar] [CrossRef] [Green Version]
  80. Chun, B.; Guhathakurta, S. Daytime and nighttime urban heat islands statistical models for Atlanta. Environ. Plan. B Urban Anal. City Sci. 2016, 44, 308–327. [Google Scholar] [CrossRef]
  81. Corumluoglu, O.; Asri, I. The effect of urban heat island on Izmir’s city ecosystem and climate. Environ. Sci. Pollut. Res. 2015, 22, 3202–3211. [Google Scholar] [CrossRef]
  82. Hao, Y.; Yang, D.; Yin, J.; Chen, X.; Bao, A.; Wu, M.; Zhang, X. The Effects of Ecological Policy of Kyrgyzstan Based on Data Envelope Analysis. Sustainability 2019, 11, 1922. [Google Scholar] [CrossRef] [Green Version]
  83. Duncan, J.; Boruff, B.; Saunders, A.; Sun, Q.; Hurley, J.; Amati, M. Turning down the heat: An enhanced understanding of the relationship between urban vegetation and surface temperature at the city scale. Sci. Total Environ. 2019, 656, 118–128. [Google Scholar] [CrossRef]
  84. Melaas, E.K.; Wang, J.A.; Miller, D.L.; Friedl, M.A. Interactions between urban vegetation and surface urban heat islands: A case study in the Boston metropolitan region. Environ. Res. Lett. 2016, 11, 054020. [Google Scholar] [CrossRef] [Green Version]
  85. Li, L.; Shao, M.; Wang, S.; Li, Z. Preservation of earthen heritage sites on the Silk Road, northwest China from the impact of the environment. Environ. Earth Sci. 2010, 64, 1625–1639. [Google Scholar] [CrossRef]
  86. Verbeke, S.; Audenaert, A. Thermal inertia in buildings: A review of impacts across climate and building use. Renew. Sustain. Energy Rev. 2018, 82, 2300–2318. [Google Scholar] [CrossRef]
  87. Grinzato, E.; Bison, P.G.; Marinetti, S. Monitoring of ancient buildings by the thermal method. J. Cult. Herit. 2002, 3, 21–29. [Google Scholar] [CrossRef]
  88. Jia, J.; Zheng, Q.; Gao, H.; Sun, H. Research of Ancient Architectures in Jin-Fen Area Based on GIS&BIM Technology. J. Phys. Conf. Ser. 2017, 842, 012035. [Google Scholar] [CrossRef]
  89. Cacace, M.; Scheck-Wenderoth, M. Modeling the thermal field and the impact of salt structures in the North East German Basin. In Proceedings of the World Geothermal Congress, Bali, Indonesia, 25–30 April 2010; p. 1540. [Google Scholar]
  90. Luo, X.; Gu, Z.; Tian, W.; Xia, Y.; Ma, T. Experimental study of a local ventilation strategy to protect semi-exposed relics in a site museum. Energy Build. 2018, 159, 558–571. [Google Scholar] [CrossRef]
  91. Swarnali, C.; Qazi Shamima, A.; Lala Shourav, D.; Dhaka, C.; Mohammad, M.R. Effect of variation in air conditioner temperature on peak expiratory flow rate of air conditioner users. World J. Adv. Res. Rev. 2021, 11, 151–156. [Google Scholar] [CrossRef]
  92. Liu, F.; Zhang, X.; Murayama, Y.; Morimoto, T. Impacts of Land Cover/Use on the Urban Thermal Environment: A Comparative Study of 10 Megacities in China. Remote Sens. 2020, 12, 307. [Google Scholar] [CrossRef] [Green Version]
  93. Zhou, W.; Wang, J.; Cadenasso, M.L. Effects of the spatial configuration of trees on urban heat mitigation: A comparative study. Remote Sens. Environ. 2017, 195, 1–12. [Google Scholar] [CrossRef]
  94. Li, M.; Zhou, Z. Positive and negative ecosystem services evaluation and its spatial pattern analysis on urban landscape: A case study of Xi’an City. Acta Geogr. Sin. 2016, 71, 1125–1230. [Google Scholar]
  95. Wang, S.; Jiang, Y.; Xu, Y.; Zhang, L.; Li, X.; Zhu, L. Sustainability of Historical Heritage: The Conservation of the Xi’an City Wall. Sustainability 2019, 11, 740. [Google Scholar] [CrossRef] [Green Version]
  96. Osborne, P.E.; Alvares-Sanches, T. Quantifying how landscape composition and configuration affect urban land surface temperatures using machine learning and neutral landscapes. Comput. Environ. Urban Syst. 2019, 76, 80–90. [Google Scholar] [CrossRef]
  97. Yu, Z.; Xu, S.; Zhang, Y.; Jorgensen, G.; Vejre, H. Strong contributions of local background climate to the cooling effect of urban green vegetation. Sci. Rep. 2018, 8, 6798. [Google Scholar] [CrossRef] [PubMed]
  98. Wu, C.; Li, J.; Wang, C.; Song, C.; Chen, Y.; Finka, M.; La Rosa, D. Understanding the relationship between urban blue infrastructure and land surface temperature. Sci. Total Envion. 2019, 694, 133742. [Google Scholar] [CrossRef] [PubMed]
  99. Schwarz, N.; Lautenbach, S.; Seppelt, R. Exploring indicators for quantifying surface urban heat islands of European cities with MODIS land surface temperatures. Remote Sens. Environ. 2011, 115, 3175–3186. [Google Scholar] [CrossRef]
  100. Irons, J.R.; Dwyer, J.L.; Barsi, J.A. The next Landsat satellite: The Landsat data continuity mission. Remote Sens. Environ. 2012, 122, 11–21. [Google Scholar] [CrossRef] [Green Version]
  101. Loveland, T.R.; Dwyer, J.L. Landsat: Building a strong future. Remote Sens. Environ. 2012, 122, 22–29. [Google Scholar] [CrossRef]
  102. Wulder, M.A.; Masek, J.G.; Cohen, W.B.; Loveland, T.R.; Woodcock, C.E. Opening the archive: How free data has enabled the science and monitoring promise of Landsat. Remote Sens. Environ. 2012, 122, 2–10. [Google Scholar] [CrossRef]
  103. Stewart, I.D.; Oke, T.R. Local climate zones for urban temperature studies. Bull. Am. Meteorol. Soc. 2012, 93, 1879–1900. [Google Scholar] [CrossRef]
Figure 1. Location of Xi’an city, China (a). Locations of the urban area and old urban area (b). Locations of Xi’an’s four functional zones and four relics (c).
Remotesensing 14 02586 g001
Figure 2. The mean SUHI values in urban area (UA) during the daytime and nighttime from 2000 to 2018.
Remotesensing 14 02586 g002
Figure 3. The spatial distribution of SUHI_trend (a,b), SUHI_M-K trend (c,d), max (e,f), mean (g,h), and CV (i,j) values of the SUHI during daytime and nighttime in urban areas, including the new urban area (NUA) and the old urban area (OUA). The SUHI_trend plots only show the pixels that underwent significant changes, while red indicates a positive trend.
Remotesensing 14 02586 g003
Figure 4. The cumulative percentages of areas in different land surface temperature categories (low (less than the first quartile), sub-low (between the first and second quantiles), sub-high (between the second and third quartiles), and high (between the third and fourth quartiles)) in the four functional districts and the whole city during the daytime and nighttime from 2000 to 2018, respectively.
Remotesensing 14 02586 g004
Figure 5. Spatial Lorenz curves of Xi’an’s four functional zones in 2000, 2005, 2010, 2015, and 2018. The standard line indicates an equal distribution of areas with relatively high temperature proportions in each district. The closer the spatial Lorenz curve is to the standard line, the more equally distributed the area is with relatively high temperatures. On the contrary, a departure from the standard line represents inequality in the area with a relatively large temperature distribution.
Remotesensing 14 02586 g005
Figure 6. The relationship between LST differences (between each functional zone and Xi’an) and the mean LST for Xi’an (a,b) and double temperature curves in cumulative values of LST differences and mean LST values for Xi’an (c,d) during daytime and nighttime. The grey area represents the 95% confidence range of the breakpoint.
Remotesensing 14 02586 g006
Figure 7. The mean LST values of different relics (a). The relationships between LST differences between different sites and the whole city with the mean LST for Xi’an (b). Double temperature curves for cumulative values of LST differences and the mean LST of Xi’an (c). The grey area represents the 95% confidence range of the breakpoint.
Remotesensing 14 02586 g007
Table 1. Coefficients from the correlation analysis, with the AI, LPI, LSI, AREA_MN, and PLAND values of different land types as the predictors and LST_day/LST_night ratio as the response variable. Note: * represents p < 0.05.
20002005201020152018
DayAI_green space−0.521 *−0.548 *−0.564 *−0.566 *−0.561 *
AI_water0.050.084 *−0.083 *0.0530.089 *
AI_impervious surface0.039 *−0.0180.0230.128 *0.208 *
AREA_MN_green space−0.703 *−0.73 *−0.724 *−0.736 *−0.723 *
AREA_MN_water0.025−0.039−0.123 *−0.037−0.044
AREA_MN_impervious surface0.318 *0.137 *0.075 *0.368 *0.549 *
LPI_green space−0.732 *−0.79 *−0.767 *−0.786 *−0.776 *
LPI_water0.011−0.045−0.148 *−0.043−0.055
LPI_impervious surface0.319 *0.162 *0.084 *0.402 *0.573 *
LSI_green space0.457 *0.411 *0.467 *0.443 *0.436 *
LSI_water−0.148 *−0.154 *0.006−0.04−0.119 *
LSI_impervious surface0.033 *0.175 *0.057 *0.034 *−0.074 *
PLAND_green space−0.745 *−0.821 *−0.786 *−0.811 *−0.804 *
PLAND_water−0.001−0.046−0.15 *−0.041−0.057
PLAND_impervious surface0.324 *0.188 *0.093 *0.421 *0.588 *
NightAI_green space−0.462 *−0.46 *−0.484 *−0.45 *−0.481 *
AI_water0.188 *0.17 *0.159 *0.064 *0.191 *
AI_impervious surface0.076 *0.116 *0.123 *0.15 *0.222 *
AREA_MN_green space−0.641 *−0.631 *−0.648 *−0.611 *−0.63 *
AREA_MN_water0.188 *0.147 *0.159 *0.091 *0.162 *
AREA_MN_impervious surface0.418 *0.518 *0.456 *0.341 *0.605 *
LPI_green space−0.673 *−0.669 *−0.687 *−0.637 *−0.669 *
LPI_water0.191 *0.148 *0.165 *0.076 *0.182 *
LPI_impervious surface0.443 *0.537 *0.477 *0.354 *0.627 *
LSI_green space0.376 *0.363 *0.376 *0.381 *0.376 *
LSI_water−0.184 *−0.176 *−0.154 *−0.045−0.14 *
LSI_impervious surface0.069 *−0.0010.017−0.071 *−0.084 *
PLAND_green space−0.688 *−0.688 *−0.707 *−0.65 *−0.689 *
PLAND_water0.198 *0.156 *0.173 *0.075 *0.19 *
PLAND_impervious surface0.46 *0.55 *0.492 *0.358 *0.643 *
Publisher’s Note: MDPI stays neutral with regard to jurisdictional claims in published maps and institutional affiliations.

