Article

Comparison of the Effects of Regional and Global Dust Storms on the Composition of the Ionized Species of the Martian Upper Atmosphere Using MAVEN

1
Department of Physics, King Fahd University of Petroleum and Minerals, Dhahran 31261, Saudi Arabia
2
Center of Research Excellence in Renewable Energy (CORERE), King Fahd University of Petroleum and Minerals, Dhahran 31261, Saudi Arabia
3
Center for Space Physics, Boston University, Boston, MA 02215, USA
4
Space Science and Engineering Division, Southwest Research Institute, San Antonio, TX 78238, USA
5
Department of Physics and Astronomy, University of Texas at San Antonio, San Antonio, TX 78249, USA
*
Author to whom correspondence should be addressed.
Remote Sens. 2022, 14(11), 2594; https://doi.org/10.3390/rs14112594
Submission received: 24 March 2022 / Revised: 16 May 2022 / Accepted: 23 May 2022 / Published: 28 May 2022
(This article belongs to the Special Issue Mars Remote Sensing)

Abstract

:
The densities of three ion species in the Martian upper atmosphere were compared during the MY33 and MY34 Martian regional and global dust storms (RDS 2016 and GDS 2018, respectively) using data from the neutral gas and ion mass spectrometer of the Mars atmosphere and volatile evolution mission. The trends of the ion species and their relative abundances in altitudes compared to some neutral species were examined from 10 September–4 October 2016 and 27 May–18 June 2018, at altitudes of 160–240 km. Both RDS 2016 and GDS 2018 caused variations in the ion species abundance of the upper atmosphere at their onsets in 18–21 September 2016 and 5–8 June 2018 respectively. The densities of O2+, CO2+, and O+ increased during RDS 2016. Meanwhile, O2+ and O+ densities decreased and CO2+ density increased during GDS 2018. Ion species’ relative abundances indicate that during RDS 2016, the increase in O2+ density may be caused by the increase of CO2+ or O+ densities rather than the increase of O or CO2 densities. Meanwhile, the decrease in O2+ density during GDS 2018 may be caused by the decrease of O or O+ densities rather than the decrease in CO2+ or CO2 densities.

Graphical Abstract

1. Introduction

A number of external and internal dynamical processes can affect the physical and chemical characteristics of the Martian atmosphere. For example, solar forcing is one of the major sources of external dynamics that disturbs the Martian atmosphere, where ultraviolet (UV) solar photons are absorbed in the upper atmosphere, causing heating and ionization of the neutral atmosphere [1]. In the thermosphere, the relative abundance of light species increases with altitude due to the combined effects of photochemistry and molecular diffusion. The energy absorbed from UV breaks up molecules and elements in the thermosphere resulting in increasing the abundances of light species through photodissociation. Diffusion then separates atoms and molecules by mass, where light species tend to diffuse to higher altitudes [2].
Meanwhile, dust storms, which frequently occur on Mars, are important internal dynamics that affect the Martian atmosphere composition and characteristics. Even though Mars has a thin atmosphere compared to that of Earth, Martian winds frequently generate strong dust storms. Dust storms that frequently occur in the Martian lower atmosphere can cause vibrant variability in the atmospheric density and dynamic interactions of the planet’s atmospheric layers [3]. Spacecraft such as Mars Global Surveyor (MGS), Mars Pathfinder, Vikings 1 and 2, and Mariner 9, provided extensive observations of dust activities on Mars. Most of these dust storms tend to occur in areas of high thermal gradients between solar longitudes (Ls) 180–360° [4,5] around the periphery south polar cap at the planet’s southern hemisphere. Dust storms usually occur during the end of the spring and the beginning of the summer season, where seasonal heating of the ground and the atmosphere generate convection currents to lift dust from the surface, while winds develop due to large temperature contrasts from the higher ice-covered areas and the rest of the planet. These winds are a possible inducive source to dust storms, which are generally categorized into local (<2000 km range), regional (>2000 km range), and planet-encircling global dust storms (GDS). Local, regional, and global dust storms can strongly affect the physical and chemical properties of the Martian atmosphere [6,7]. Dust storms on Mars could significantly load large amounts of dust in the troposphere and lower mesosphere [8,9]. Observations suggest that storm-induced forcing of the thermosphere from lower atmospheric altitudes can cause an abrupt increase in atmospheric density, followed by a gradual post-storm decrease [3,10,11]. This forcing subsequently affects the atmospheric temperatures and circulation patterns [12]. Regional storms occasionally grow and coalesce into larger atmospheric circulation patterns that can cover the entire planet [13], while others die out. A near-surface wind mechanism is necessary to initially move particles by fluid drag. However, due to the rarity of such events, the evolution of the near surface to higher altitude atmospheric thermal states and circulation during the onset, expansion, maturity, and decay phases of a GDS have not been thoroughly characterized.
Dust storms can affect atmospheric processes, species composition, as well as the absorption and emission of solar photons in the Martian atmosphere [14]. Characteristics of the Martian atmospheric layers are intimately linked, making it necessary to account fully for the lower atmosphere when studying the dynamics of the upper atmosphere [14]. On Mars, weather phenomena such as dust storms, turbulence, thermal tides, and wind circulations are more common within tropospheric altitudes (around 0–40 km) as surface heating and atmospheric temperature mostly drive them [1,13,14,15,16]; however, thermal tides and wind circulation can also be prominent at all atmospheric layers [17]. The temperature of the thermosphere (around 100–250 km) is mainly affected by extreme ultraviolet (EUV) and soft X-ray (SXR) solar photons heating [18] where some of the thermosphere energy can be transported downwards and radiated back to space [18].
A GDS could have a significant impact on the planet’s atmospheric composition and characteristics because of its effects of dust loading and subsequent circulation. Dust particles loading in the atmosphere affect atmospheric temperature by increasing radiation scattering and absorption, which could lead to atmospheric expansion during the dust storm [19]. Reflecting this radiation forcing by dust, the abundances and vertical distribution of some neutral and ion species in the atmosphere abruptly change during the storm [19,20,21]. Additionally, sand and dust particles pose a risk on the performance of the Mars exploration rovers such as Opportunity (MER), Curiosity (MSL), and Mars 2020, as they can cause attenuation of radio waves through absorption and scattering.
Several mathematical models and simulations [8,22] showed that dust storms can change atmospheric dynamics through the scattering and the absorption of solar radiation, which eventually result in atmospheric expansion associated with enhanced heating by the dust particles suspended in the atmosphere, thereby indirectly affecting atmospheric density. Computational models [23] show that the atmospheric density increased by around 2–3 times during the MY25 and MY28 (MY: Mars Year) dust events. This increase in density was also associated with a large temperature gradient between polar regions and the −60–60° latitudes [24].
As such, atmospheric dynamics can directly/indirectly affect the spatial distribution of neutral and ion species in the thermosphere. For example, CO2 molecules, the heaviest species in the Martian atmosphere, dominate the lower altitudes of the thermosphere, while lighter species like neutral atomic O dominate higher altitudes. The depletion of atomic O through reactions with other atomic species and its production through CO2 photodissociation and dissociative recombination of O2+ control its abundance in thermosphere [2]. The spatial distribution of neutral species in the thermosphere also affects the production of ion species in the ionosphere as disparate photoionization cross sections of neutral species affect the frequency of chemical reactions. Moreover, this spatial distribution shapes the thermal structure of the thermosphere and its heat conduction down to the mesosphere [1]. Consequently, particles abundances and their spatial distribution in the Martian upper atmosphere affect the rates of upward flux of escaping atmospheric species from Mars.
The MY33 regional dust storm (RDS 2016) (Figure 1a) had typical characteristics of a Martian dust season [20] with peaks observed around 21 September 2016 (Ls = 226°) and 20 February 2017 (Ls = 320°). A recognizable growth in the southern wind amplitude and temperature was observed in the southern mid-to-high altitudes during the highest dust-loading periods [25].
The MY34 global dust storm (GDS 2018) (Figure 1b) onset was around 8 June 2018 (Ls = 189.5°) and lasted for few months [26,27]. The storm had led to the expansion of the thermosphere by few kilometers [13]. The atmospheric conditions and the development of the GDS 2018 is described in [27], where the initial outbreak of the storm started around 30 May 2018 with a dusty region with an area of around 1.7 × 10⁵ km2 observed at the Acidalia Planitia (12°W and 35°N). By 31 May 2018 dust plumes were widely transported and covered a larger region of around 5.1 × 10⁵ km2 but the storm was still localized around the Acidalia Planitia. One 1 June 2018 a new dust plume started west of the original storm and expanded towards the west and towards the south of the original storm during 2–5 June 2018. More dusty regions developed during 6–7 June 2018, which created a local dust storm that developed into a regional dust storm on 8 June 2018. That regional dust storm has expanded into a global dust storm around 17 June 2018. A significant upsurge in atmospheric temperature was observed with around 20 K (morning and evening; all latitudes) and around 45 K (evening; southern latitudes) [13,28,29]. This increase in atmospheric temperature resulted in a latitudinal temperature variability and a fluctuation of the upper atmosphere circulation dynamics, which may have affected atmospheric species density on the dust storm onset [7].
Understanding the role of dust in driving variations in the Martian upper atmosphere is important for several reasons. Among these, first is the safety of future missions to explore the planet and optimize the use of aerobraking. Second is the verification and enhancement of mathematical and computational models of the Martian upper atmosphere; these can then be used to accurately simulate the coupling between lower and upper atmospheric density trends. Third, the dynamics of the upper and lower Martian atmosphere are strongly linked [30]; understanding the upper atmosphere would thus yield information about the lower atmosphere.
This study analyzes the effects of RDS 2016 and GDS 2018 dust storms on the abundances of three ion species (CO2+, O2+, and O+) in the Martian thermosphere using the Mars atmosphere and volatile evolution (MAVEN) mission [31] data. MAVEN neutral gas and ion mass spectrometer (NGIMS) data were examined pre- and during the two dust events. Data regarding the ion species abundance were analyzed in the inbound orbit from 240–160 km from 10 September–4 October 2016 (MY33) and 27 May–18 June 2018 (MY34).
Figure 1. Distribution of dust versus latitude and solar longitude as measured using the 9.3-µm vertical column opacity normalized to 610 Pa during (a) RDS 2016 and (b) GDS 2018. Gridded infrared absorption retrievals of the column dust optical depth (CDOD) by the Mars Climate Sounder (MCS) aboard the Mars Reconnaissance Orbiter Spacecraft [32] were used to produce the plot. Data are available at [33].
Remotesensing 14 02594 g001

2. Materials and Methods

The exposure of Mars to frequent internal and external extreme events could lead to abrupt variability and degradation of its atmosphere by enhancing particles’ escape flux [19,21,30,34]. Earlier works [4,35,36] showed that large dust storms have large effects on the Martian thermosphere and ionosphere through thermal expansion and changing atmospheric species’ chemical composition. However, the effect of dust storms’ sizes on the abundance of the ion species in the Martian atmosphere has not been rigorously investigated.
In a recent study [34] MAVEN/NGIMS data has been used to investigate how the GDS 2018 affected the abundance of six neutral species in the Martian upper atmosphere. NGIMS is a mass spectrometer on board of MAVEN, where ions of specific mass to charge (m/z) ratio can hit a detector through a quadruple mass filter [37]. MAVEN measures the density of ions (for example O2+, CO2+, O+, CO+, and N2+), neutral species (for example CO2, CO, O, Ar, and N2), and isotope ratios (for example 18O/16O, 13C/12C, and 15N/14N) from around 120–240 km in the upper Martian atmosphere. We used MAVEN/NGIMS observations to examine the effects of dust storms on the abundances of ion species in the upper atmosphere. The densities of three ion species were examined during the growth phases of the regional RDS 2016 and global GDS 2018 dust storms. These observations provide a comparison between the effects of limited-scale regional and large-scale global dust storms on the structure of the Martian atmosphere.
MAVEN has been continuously observing the properties and dynamics of the Martian upper atmosphere since 16 November 2014. The spacecraft takes about 4.5 h to make one complete high elliptical orbit (apoapsis and periapsis are around 6200 km and around 150 km above the surface respectively) around Mars. This high orbital eccentricity along with the planet’s rotation beneath the spacecraft allow MAVEN to observe in situ neutral and plasma data from the lower boundaries of the thermosphere up to the ionosphere and the solar wind regions at all latitudes and longitudes [31].
In this work, we focused on the analysis of upper atmospheric data into three categories: (1) trends of three ion species densities at different altitudes and days; (2) the fraction of each ion species density with respect to two neutral species at different altitudes and days; and (3) the density of each ion species at heights of 170, 180, and 190 km for different days. The measurements of the three ion species were collected before and during RDS 2016 and GDS 2018. The three ion species considered in this study are O2+, CO2+, and O+ and the two neutral species considered are CO2 and CO.
It is important to note that the calculations of the CO density from the NGIMS data are challenging because CO2 fragments into CO inside the spectrometer and because N2 has the same mass as CO. Thus, there are two substantial sources of signal at m/z = 28 in addition to that due to atmospheric CO. For N2, we have an excellent proxy channel to use, but this is not the case for CO. It has also been reported in [38] that the NGIMS team is currently assessing the calibration of CO density values to make it consistent among different versions of the data products. As most of the CO-related findings in this study involve relative changes rather than absolute values of the CO density, we can assume that CO trends analyzed in this work are reliable.
In order to inspect the statistical significance of the results, we also performed a statistical probability (p-value) analysis on the data before and during the RDS 2016 and GDS 2018 dust events onset. The p-value designates how likely it is that the difference between data points occurred by coincidence and not as result of the dust storm. A small p-value indicates that the result was unlikely to have occurred by chance alone. These results are called statistically significant. We tested the two following null hypotheses:
H01: variations in CO2+, O2+, and O+ during RDS 2016 and GDS 2018 dust storms are not caused by the dust storm (i.e., dust storms have no effect on the variability of ion species). Meanwhile, H02: variations in CO2+, O2+, and O+ are not affected by the strength of dust. That is, even if dust storms have an effect on the variability of ion species, the scale of the storm in terms of amount of dust loading and the spatial distribution of the dust has no effect on the variability of ion species.

3. Results and Discussion

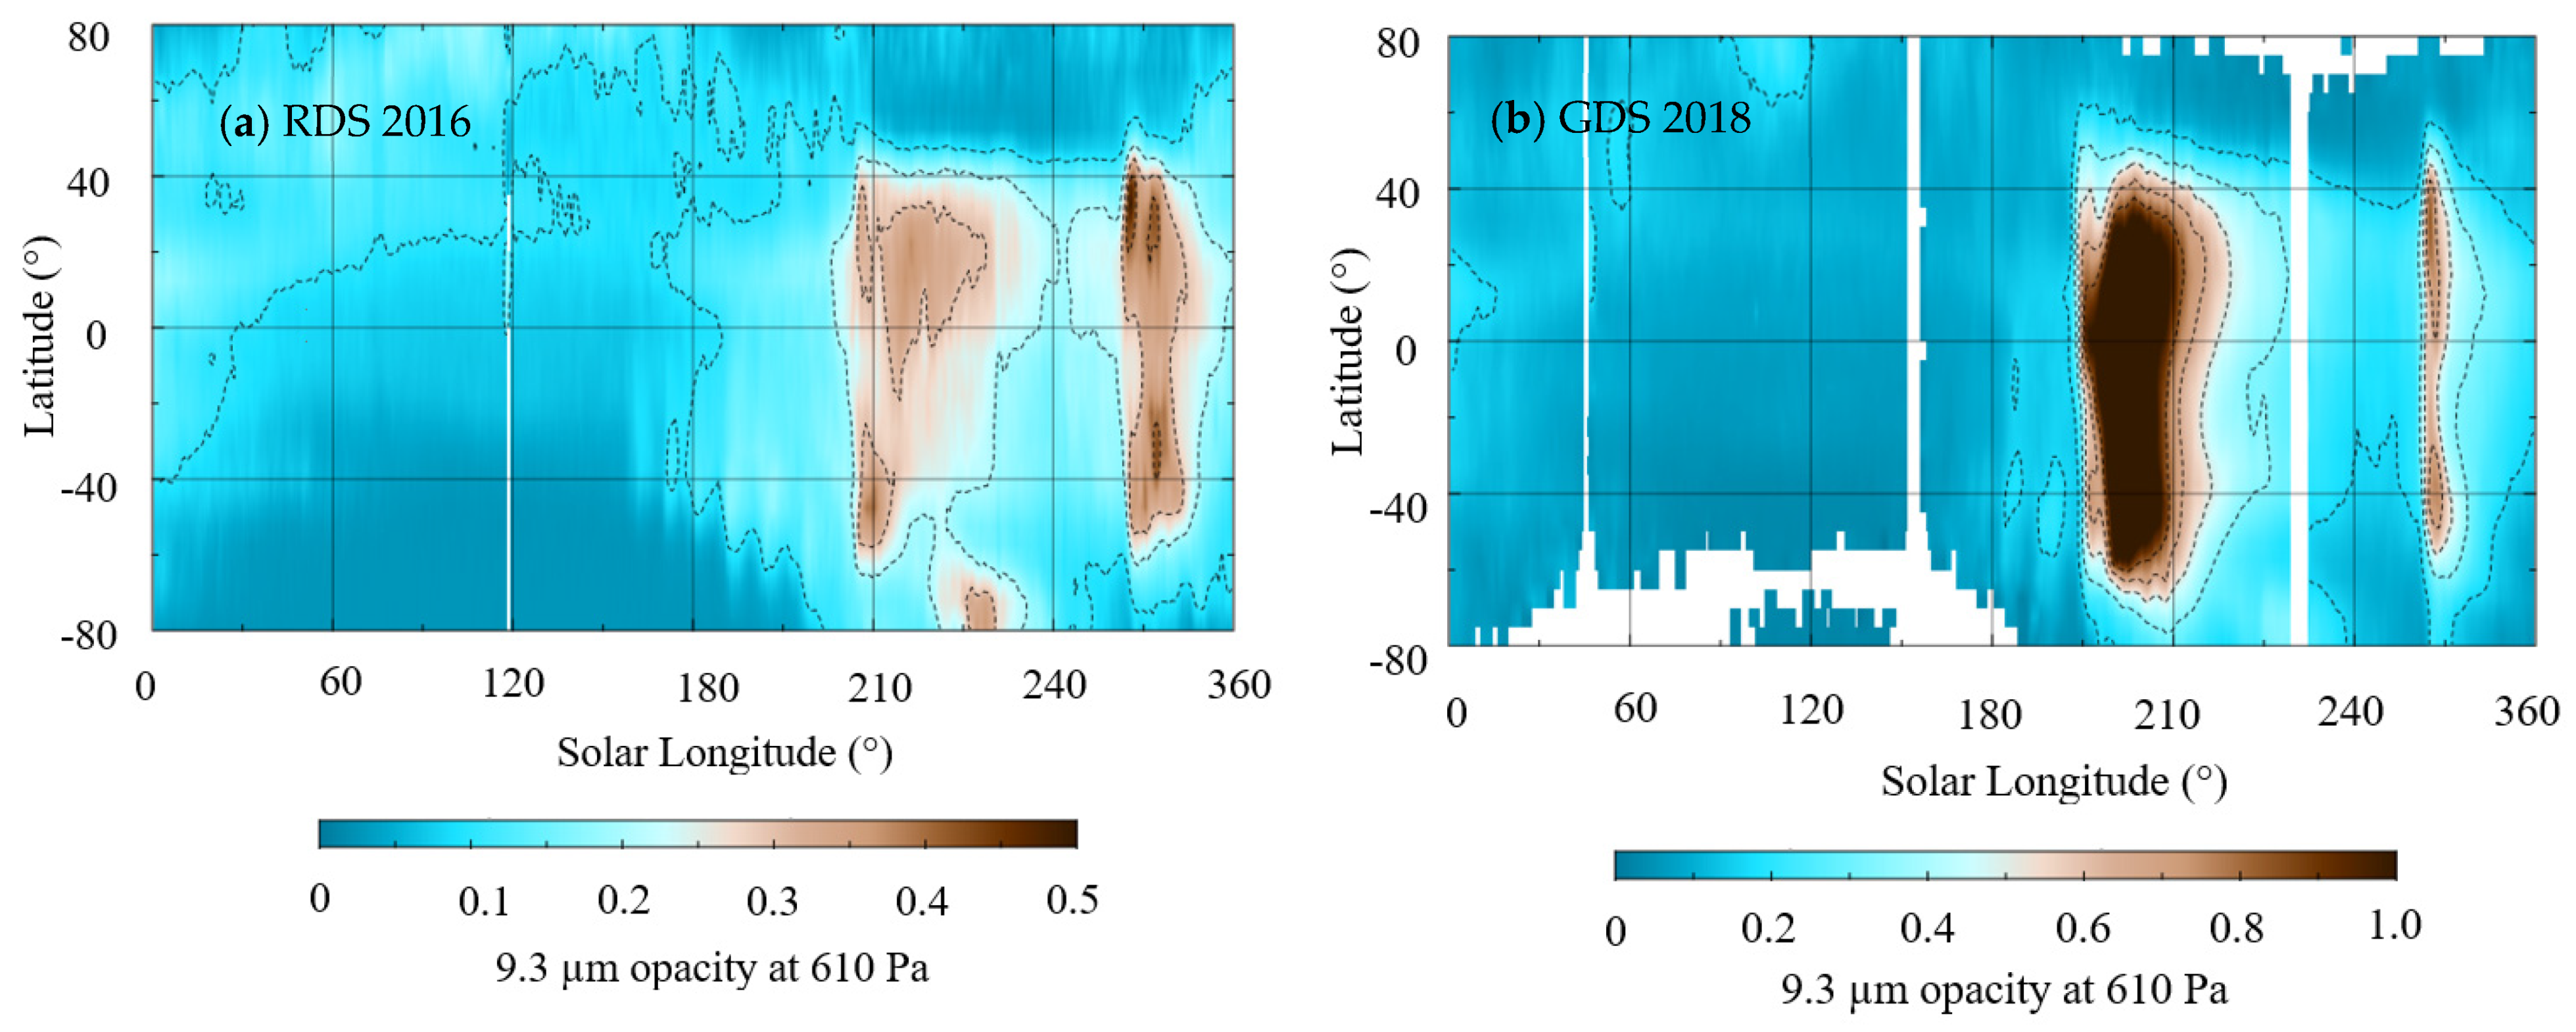
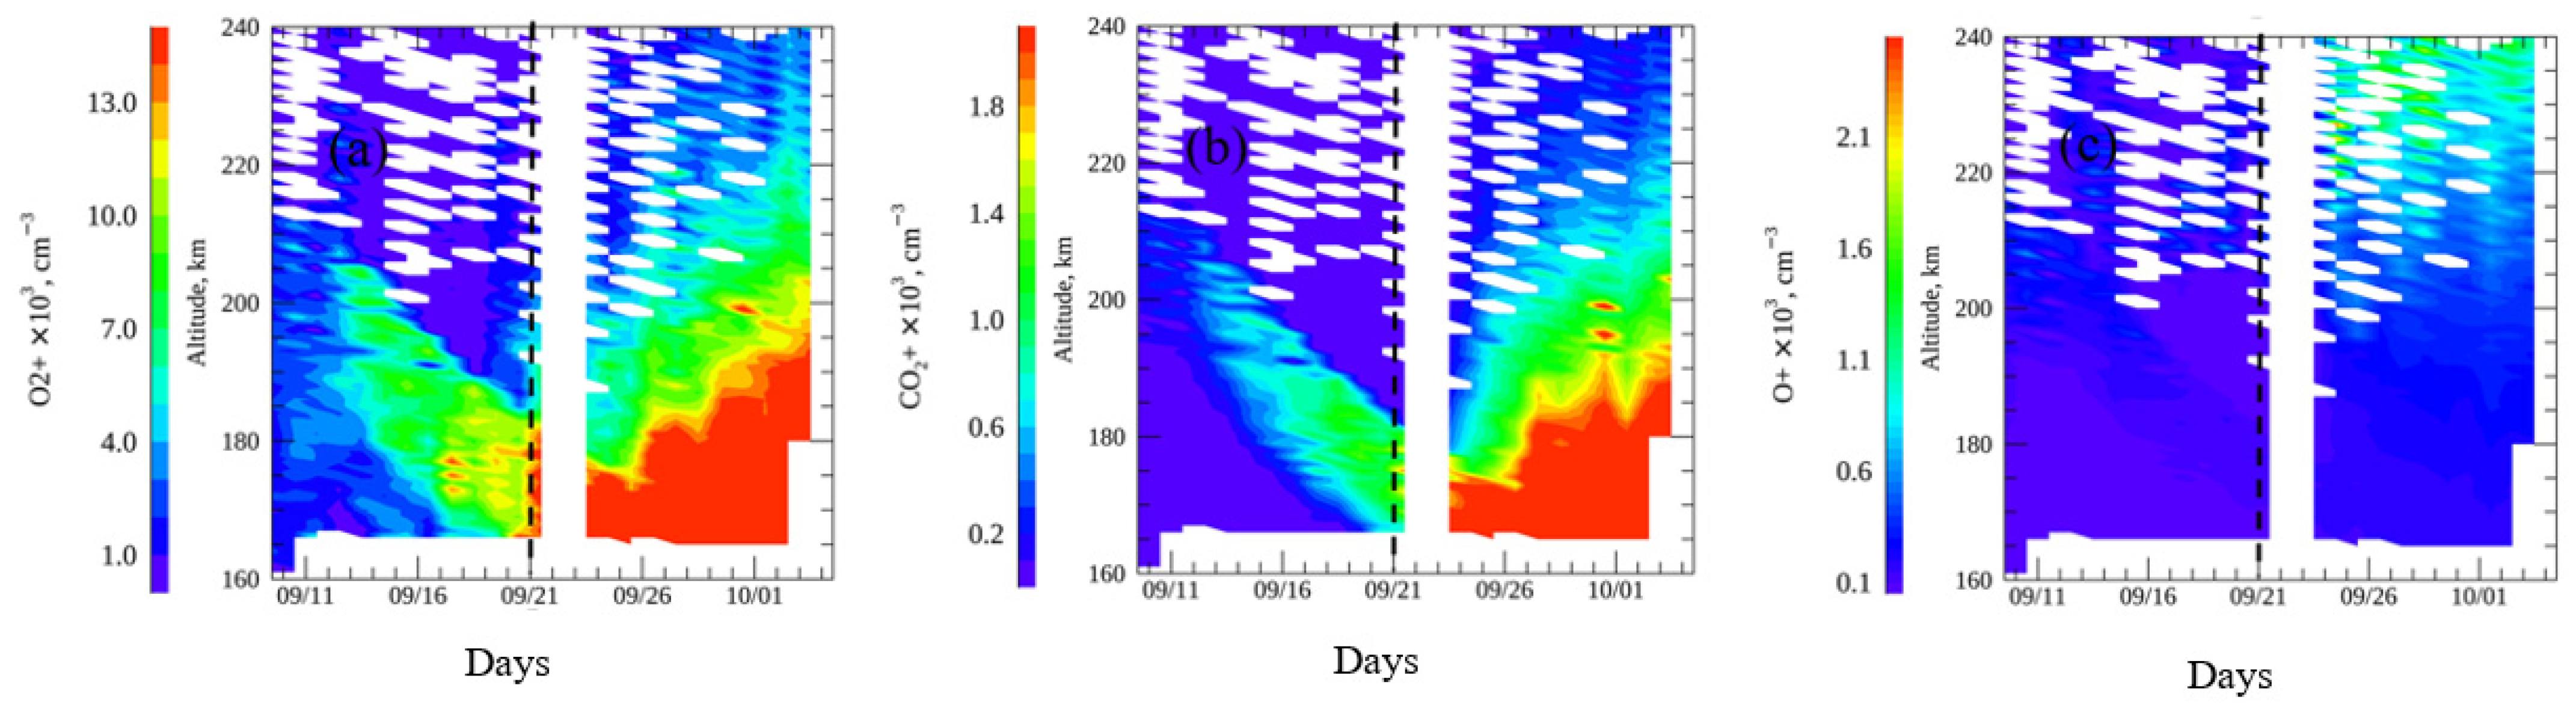
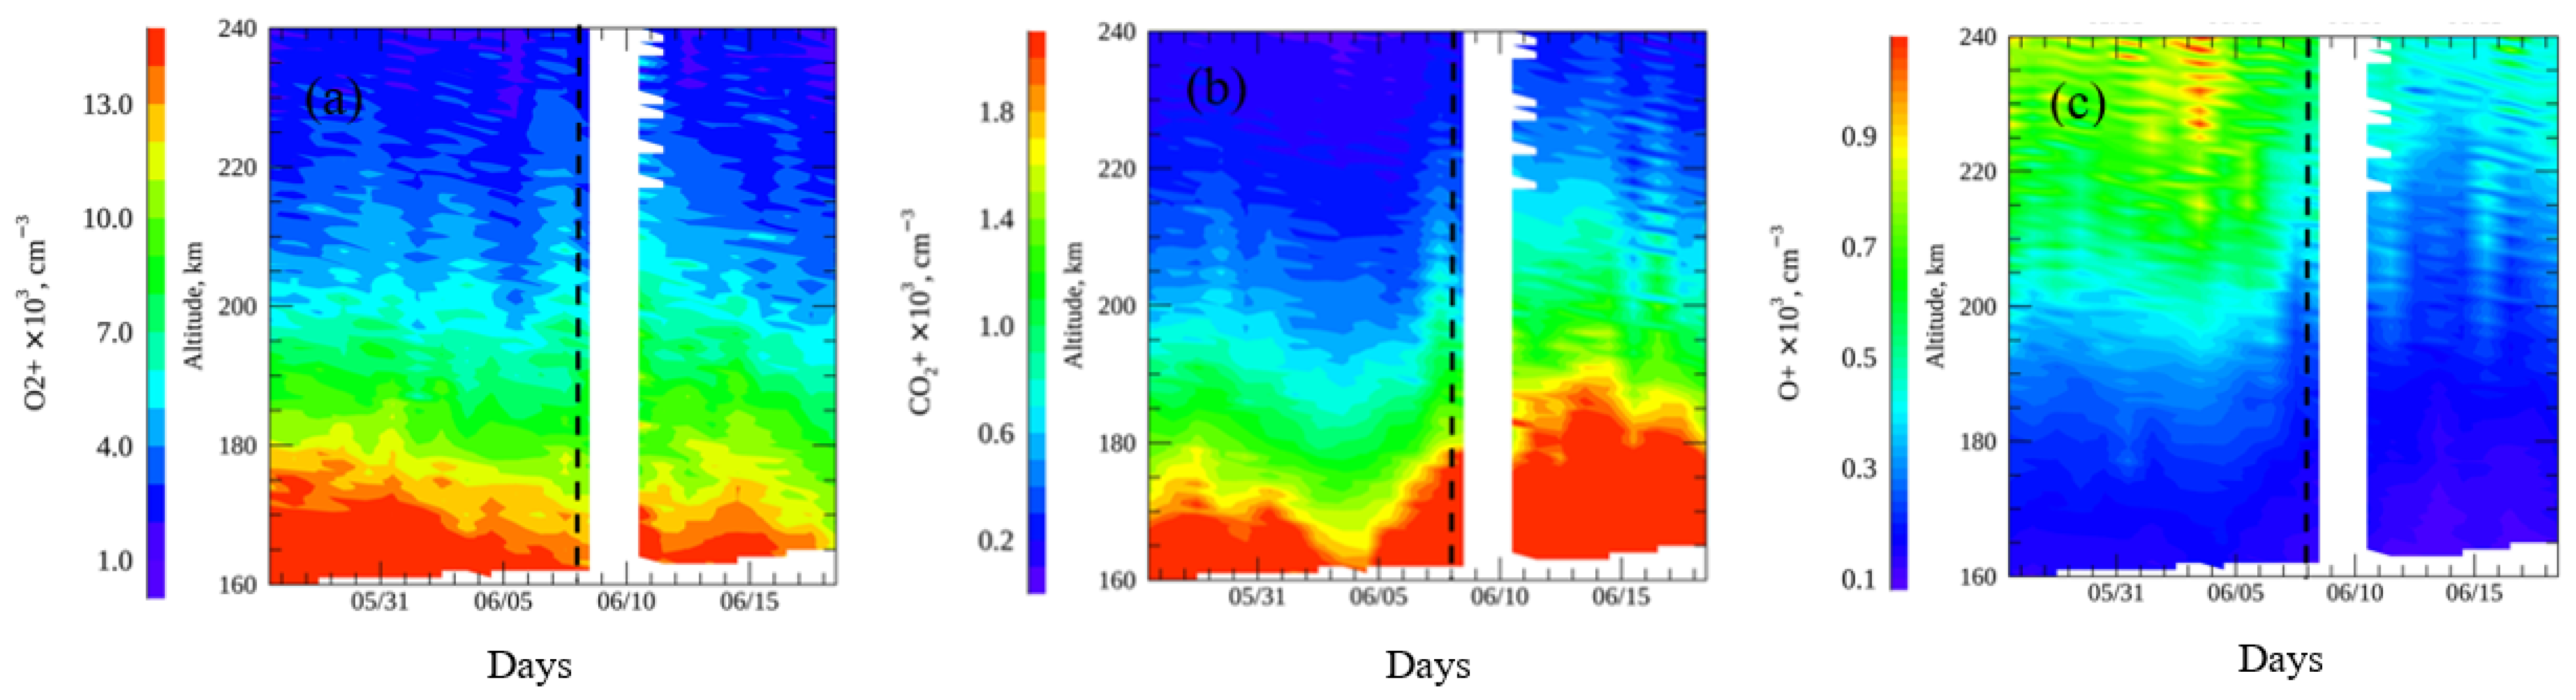
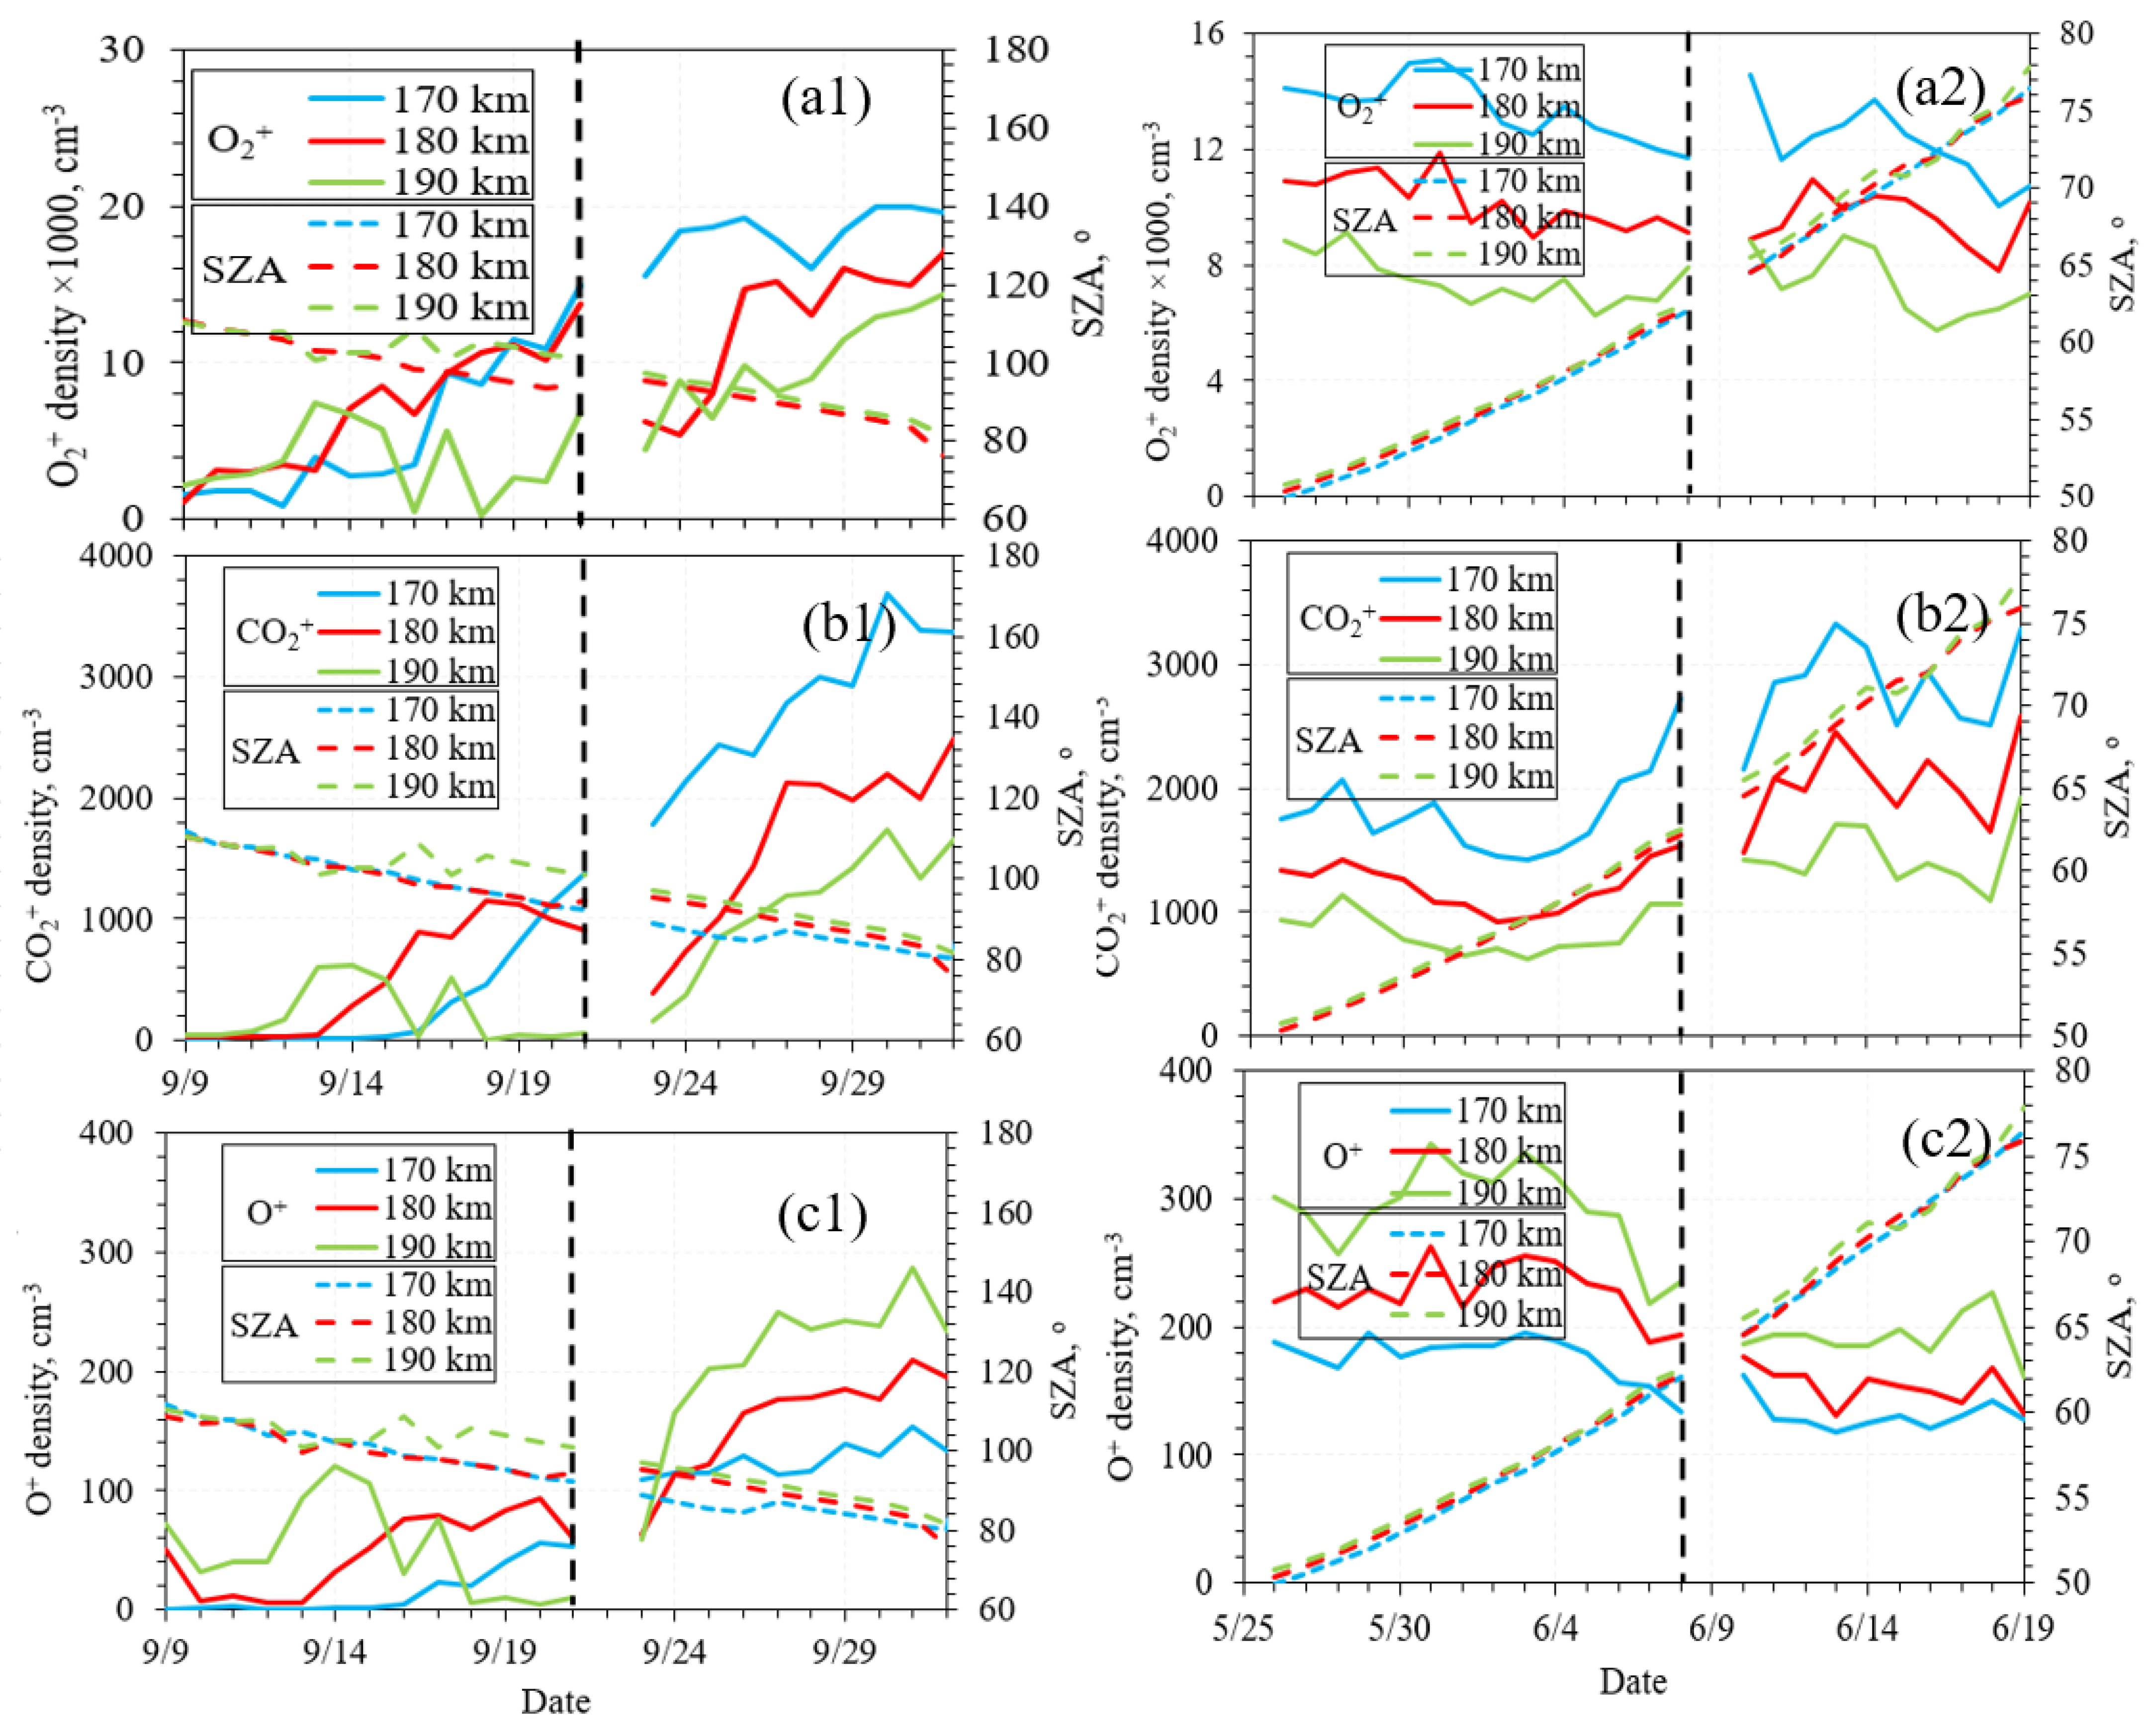
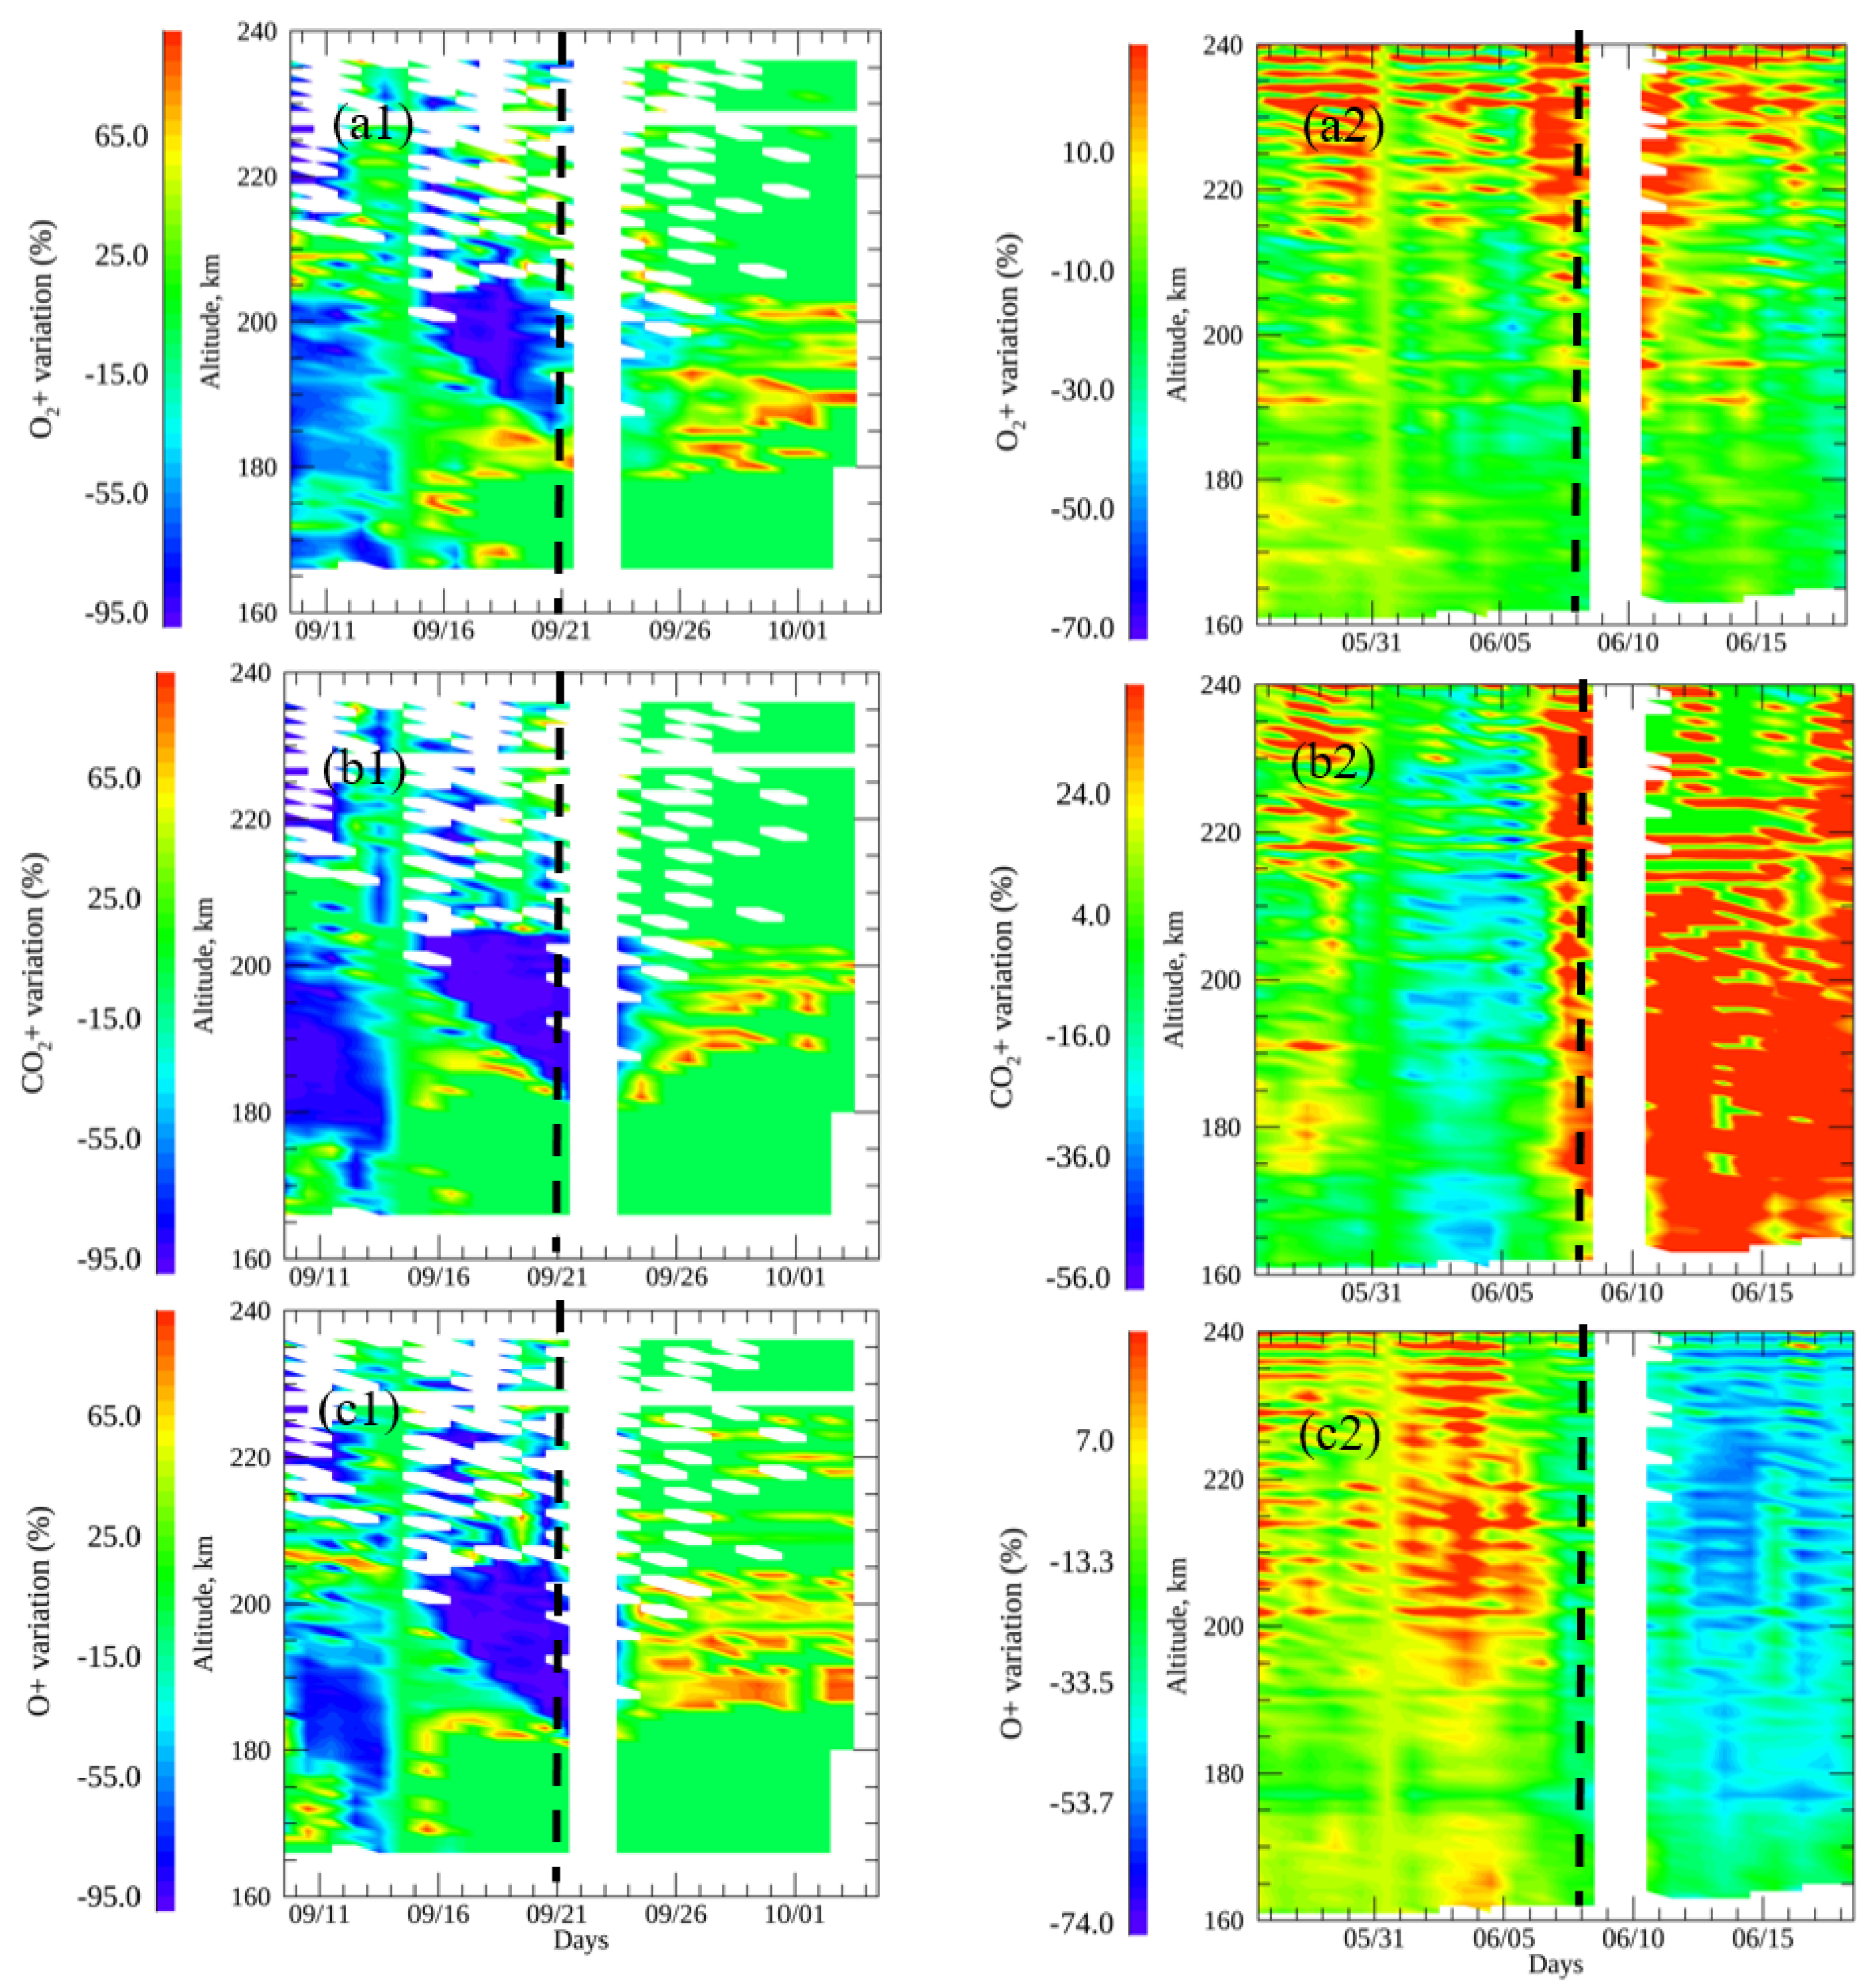
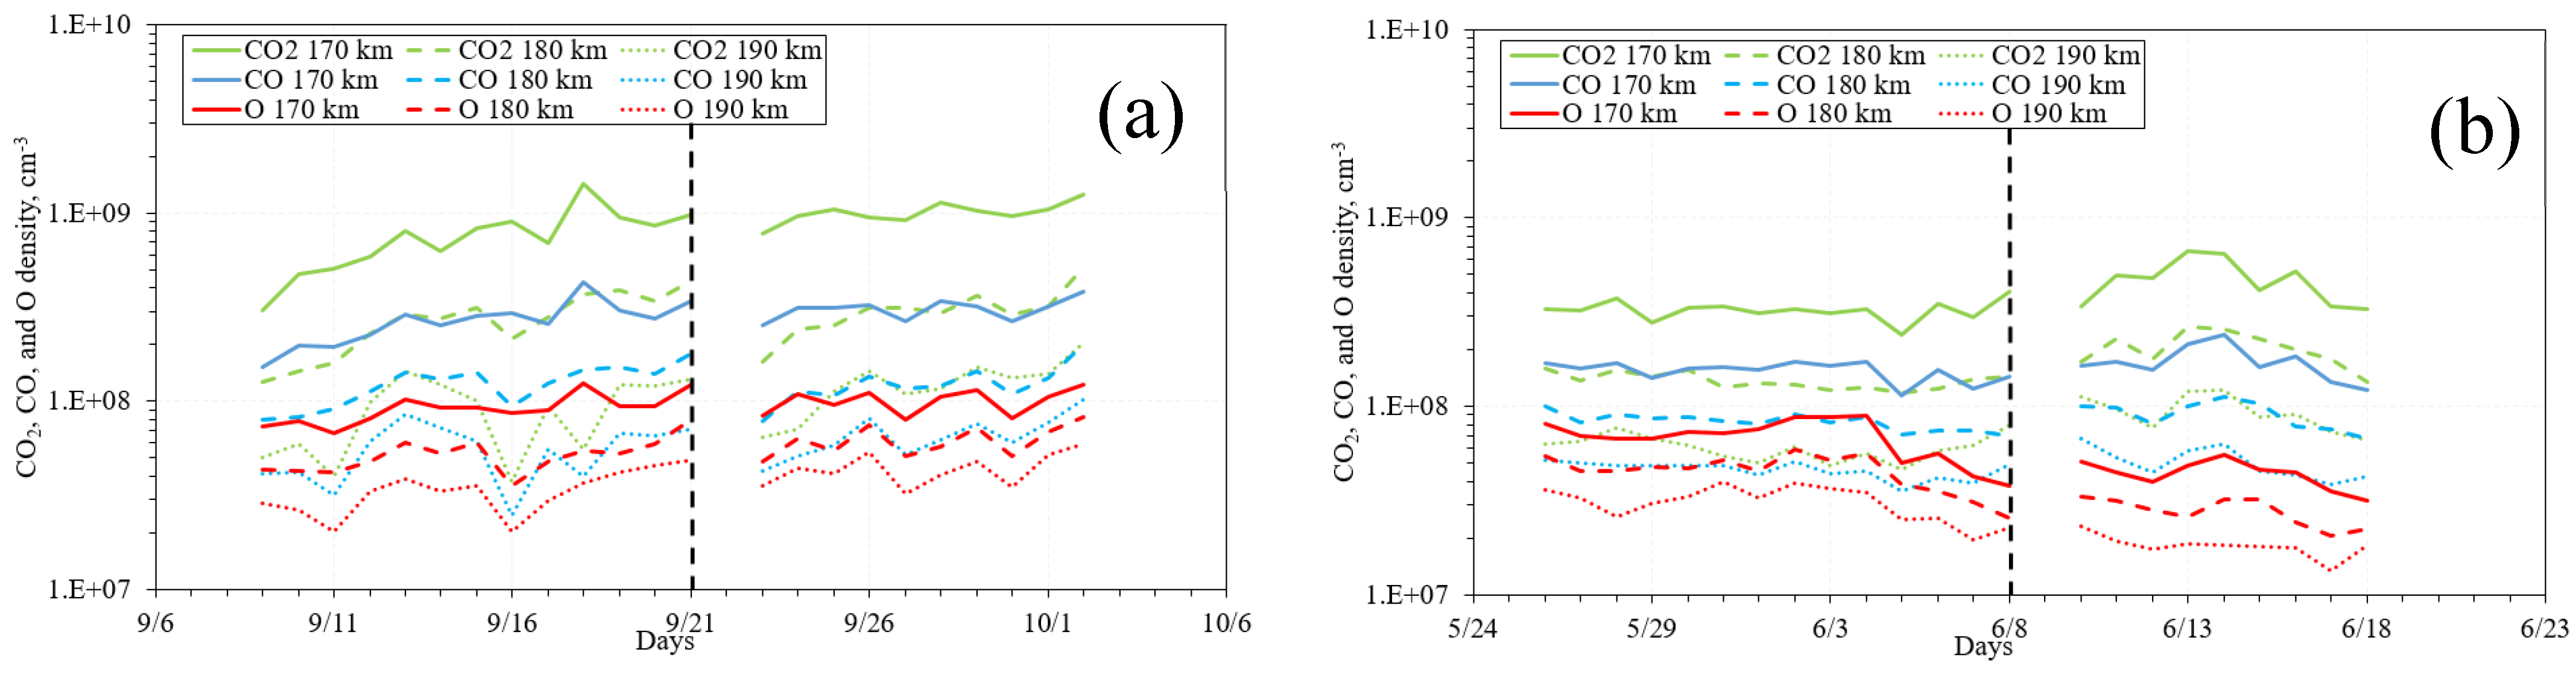
3.1. Trends of Ion Species

The profiles of the MAVEN/NGIMS ion species were acquired for altitudes 160–240 km during 9 September–2 October 2016 (Ls = 220–235°) and 27 May–18 June 2018 (Ls = 182–195°) to cover the periods before the storm, at the beginning, and then the growth of RDS 2016 and GDS 2018 (Figure 2 and Figure 3) respectively. The aforementioned altitudes and date ranges guarantee MAVEN collects continuous data for at least 40 km per orbit. O2+, CO2+, and O+ NGIMS data are not available for 22–24 September 2016, 9 June 2018, and most of 10 June 2018.
During RDS 2016 dust storm, it can be observed that the O2+, CO2+ and O+ densities from 24 September–4 October 2016 (during the storm) increased by around 50%, 25%, and 15% respectively compared to from 9 September–21 October (pre-storm) at altitudes of 170–190 km (Figure 2a–c).
During the GDS 2018 dust storm, it can be observed that the O2+ density from 11 June–18 June 2018 (during the storm) did not significantly change from 160–165 km, while it decreased by around 11% from 170–185 km compared to from 27 May–9 June 2018 (pre-storm) (Figure 3a). Meanwhile, CO2+ density decreased around June 5 few days before the storm onset then increased by around 42% at altitudes 165–185 km (Figure 3b). This increase could be attributed to the decrease of O densities around the same date (Figure 3d in [38]), where O abundances play a major role in affecting the CO2+ densities through the reaction CO2+ + O → O2+ + CO [39]. Also, the O+ density decreased by around 16% during the storm. The decrease in O+ densities above 200 km at the storm onset is quite pronounced, even more so than at 190 km (Figure 3c).
The RDS 2016 and GDS 2018 differently affected the densities of similar ion species. Specifically, O2+ density increased post the RDS 2016 onset, while it almost stayed the same post the GDS 2018 onset. Meanwhile, both storms increased the CO2+ density post the storm onset. A likely cause may be that each storm expanded the Martian atmosphere differently and they may have also differently affected the density of neutral species that generates ions. The difference could also be attributed to the difference in solar zenith angle (SZA) acquired by MAVEN during the two storms.
To ensure that the variabilities in ion species abundances observed in Figure 2 and Figure 3 are caused by dust storms and not instigated by SZA, the changes in SZA were examined (Figure 4).
From 9 September–2 October 2016, the SZA changed from 75–112° at latitudes 40–27°S at altitudes of 170, 180, and 190 km (Figure 4(a1–c1)). From 26 May–18 June 2018, the SZA changed from 49–78° at latitudes 28–7°S and altitudes of 170, 180, and 190 km (Figure 4(a2–c2)). It can also be observed that during the RDS 2016 dust storm (Figure 4(a1–c1)) the variability in O2+, CO2+, and O+ from 21 September (storm onset) to 27 September happened with a change of about 5° of SZA (around 87–92°). Meanwhile, during the 2018 dust storm (Figure 4(a2–c2)), it can be observed that the variability in O2+, CO2+, and O + from 8 June (storm onset) until 14 June happened with a change of around 8° of SZA (around 62–70°). Small variation in ion species densities can become significant over time with SZA variations. Over short periods (1–6 days), due to the small-observed gradual changes in SZA values, the variations in ion species densities because of solar illumination variability are likely very small. This makes any sudden changes in ion species densities because of dust storms observable against the small variations in density related to changes in SZA.
It is interesting to observe the low O2+, CO2+, and O+ densities prior to the RDS 2016 storm onset compared to their densities prior to the GDS 2018 storm onset. It is difficult to determine whether the low density associated with RDS 2016 is attributed to most of the observations between 9–17 September being on the night side or due to the effect of the storm.
The V-shaped structure in Figure 2a,b is partially due to the SZA changes shown on Figure 4, where SZA crosses the terminator from night to day right around dust storm onset. That adds some complexity to interpreting the observations before the storm onset; however, the effect of RDS 2016 is clear in increasing O2+ and CO2+ densities just after the storm onset where SZA changes take place during the dayside. For the GDS 2018 storm, SZA is comfortably on the dayside around 65 degrees during the storm onset, which makes the interpretation easier.
Ion densities presented in Figure 2 and Figure 3 could have hidden variations at upper altitudes, where ion densities are much lower compared to lower altitudes. For example, it is difficult to determine the variations in O2+, CO2+, and O+ densities above 190 km using Figure 2 and Figure 3. To better visualize the vertical variation in ion densities, we calculate the percentage change of each ion compared to its pre-storm density. In Figure 5, 13 September 2016 and 31 May 2018 are assumed to represent the RDS 2016 and GDS 2018 pre-storm densities respectively. Densities of ion species are compared prior to and during dust storms to examine how storms could affect the percentage of their density variability, where the density variation percentage of species X between two dates D1 (YYYY-MM-DD) and D2 (YYYY-MM-DD) is defined as:
d e n s i t y a t d a t e D 2 d e n s i t y a t d a t e D 1 d e n s i t y a t d a t e D 1 × 100
For the RDS 2016 event, Figure 5(a1–c1) show that changes in O2+, CO2+, and O+ densities are observed between 170–200 km from 16–20 September (pre-storm) and from 21 September–2 October 2016 (during the storm), where changes are more significant at altitudes larger than 180 km.
From 16–20 September 2016 densities of the three ion species decreased by around 55% (altitudes 190–200 km) compared to 13 September 2016. After the storm onset, the density of three ion species increased by around 10–65% compared to their densities on 13 September 2016 (pre-storm density). No significant changes in the ion densities were observed below 170 km either pre- or post the storm onset. This could be attributed to a small expansion in the atmosphere during the storm.
For the GDS 2018 event, Figure 5(a2–c2) show that O2+ slightly decreased by around 10% compared to pre-storm conditions (31 May 2018). Meanwhile, CO2+ increased by around 44% (altitudes 160–200 km), and O+ decreased by around 35% (altitudes 170–200 km) from 11–18 June.
The abundances of CO2+ and O affect the production of O2+ and CO in the atmosphere as indicated by the ionospheric reaction CO2+ + O → O2+ + CO [39].
Figure 2b, Figure 4(b1) and Figure 5(b1) show the increase of CO2+ density during the RDS 2016 regional dust storm. Figure 6 shows that no significant changes in the CO or O production are observed during the storm. This indicates that the increase in O2+ (Figure 2a, Figure 4(a1) and Figure 5(a1)) can be attributed to the increase of CO2+ density and not to the increase of O density during the storm.
Figure 3b, Figure 4(b2) and Figure 5(b2) show the increase of CO2+ density during the GDS 2018 global dust storm. This indicates that the decrease in O2+ (Figure 3a, Figure 4(a2) and Figure 5(a2)) and CO (Figure 5d in [34]) production is attributed to the decrease of O density (Figure 5c in [34]) rather than the decrease in CO2+ density during the storm.
Below around 240 km, O+ ions mainly react with CO2 to produce O2+ ions through the reaction ([35]) O+ + CO2 → O2+ + CO.
Figure 2c, Figure 4(c1) and Figure 5(c1) show an increase of O+ density during the RDS 2016 regional dust storm.
Figure 6 shows that no significant changes in the CO2 and CO densities were observed during the storm. This indicates that the increase in O2+ (Figure 2a, Figure 4(a1) and Figure 5(a1)) can also be attributed to the increase of O+ density and not to the increase of CO2 density during the storm.
Figure 3c, Figure 4(c2) and Figure 5(c2) show a decrease of O+ density during the GDS 2018 global dust storm.
The density of CO2 increased during the storm (Figure 5a in [34]), which indicates that the decrease in O2+ (Figure 3a, Figure 4(a2) and Figure 5(a2)) and CO (Figure 5b in [34]) densities are attributed to the decrease of O+ density rather than the decrease in CO2 density during the storm.
These results indicate that the RDS 2016 and GDS 2018 mostly caused the O2+, CO2+, and O+ variability near the storms’ onsets and during the storms. The ionic species trend pre-RDS 2016 storm onset could be caused by SZA as MAVEN crossed the terminator during the storm onset.

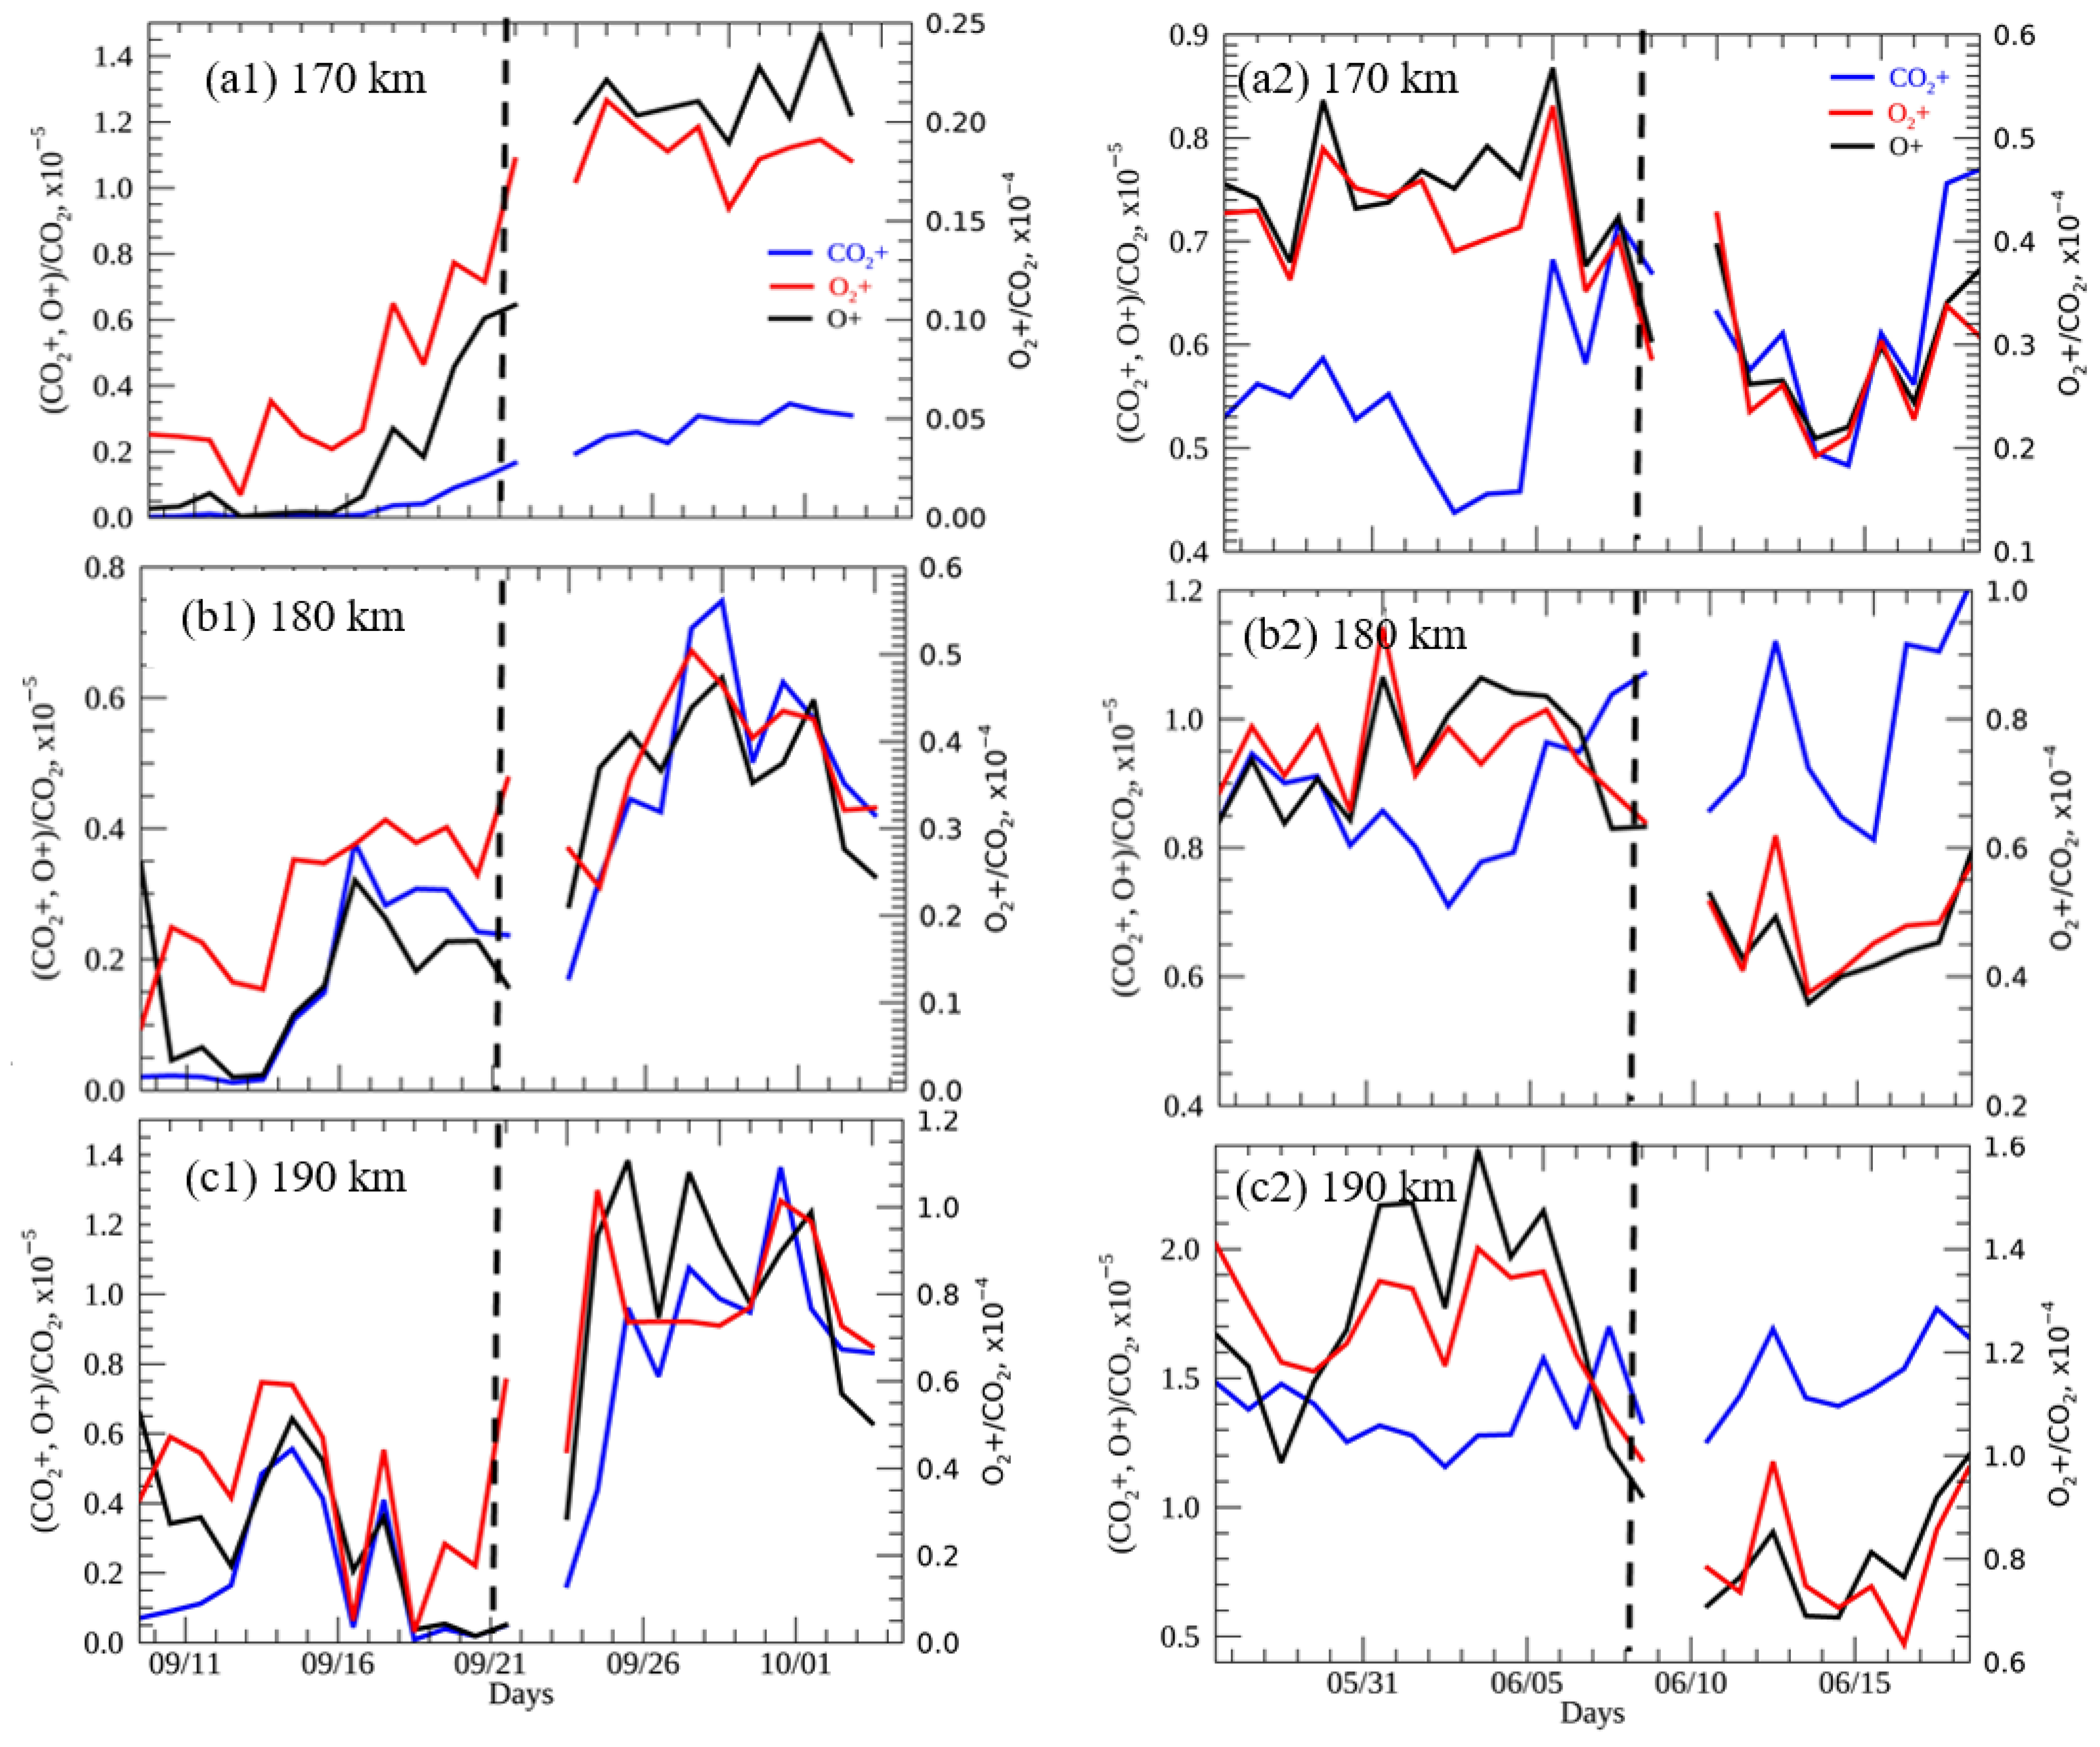
3.2. Ion Species Fraction

The density of each ion species compared to the density of some neutral species (CO and CO2) ((density of ion species X/density of a neutral species) × 100) is calculated during the RDS 2016 and GDS 2018 dust storms at different altitudes. Table 1 and Table 2, Figure 7 and Figure 8 show the variation of O2+, O+, CO2+ compared to CO and CO2 from 9 September–2 October 2016 (RDS 2016) and 27 May–18 Jun 2018 (GDS 2018) respectively at altitudes 170, 180, and 190 km.
During the RDS 2016 regional dust storm, the O2+/CO, CO2+/CO, O+/CO, O2+/CO2, CO2+/CO2, and O+/CO2 increased during the storm compared to before the storm at altitudes of 170, 180, and 190 km. This increase is attributed to the increase of O2+, CO2+, and O+ as the densities of CO2 and CO did not significantly change from 9 September to 4 October 2016 (Figure 6).
During the GDS 2018 global dust storm, the O2+/CO, O+/CO, O2+/CO2, and O+/CO2 decreased during the storm compared to before the storm, while CO2+/CO increased during the storm and CO2+/CO2 did not significantly change during the storm at altitudes 170, 180, and 190 km.
The CO and CO2 densities were observed to increase during the GDS 2018 (Figure 6b in [34]) dust storm; thereby, the decrease of O2+/CO, O+/CO and O2+/CO2, O+/CO2 ratios could be attributed to the increase of CO and CO2 densities respectively, or to the decrease of O2+ and O+ production during the storm. Meanwhile, the increase in CO2+/CO ratio can be attributed to the increase of CO2+ densities during the storm. Additionally, the stability in CO2+/CO ratio can be attributed to the increase of CO2+ and CO2 densities during the storm.
Before and during the storm, O2+, O+, and CO2+ ratios to CO and CO2 increased with altitude, which can be attributed to the increase of ionization rates with altitude.
The above results indicate that during the RDS 2016 regional dust storm, the variability of the three ionic species compared to CO and CO2 was caused by the changes in O2+, CO2+, and O+ densities and not the changes of the CO and CO2 densities. Meanwhile, during the GDS 2018 storm, the variability was caused by the changes of O2+, O+, CO2+ and CO2 densities.

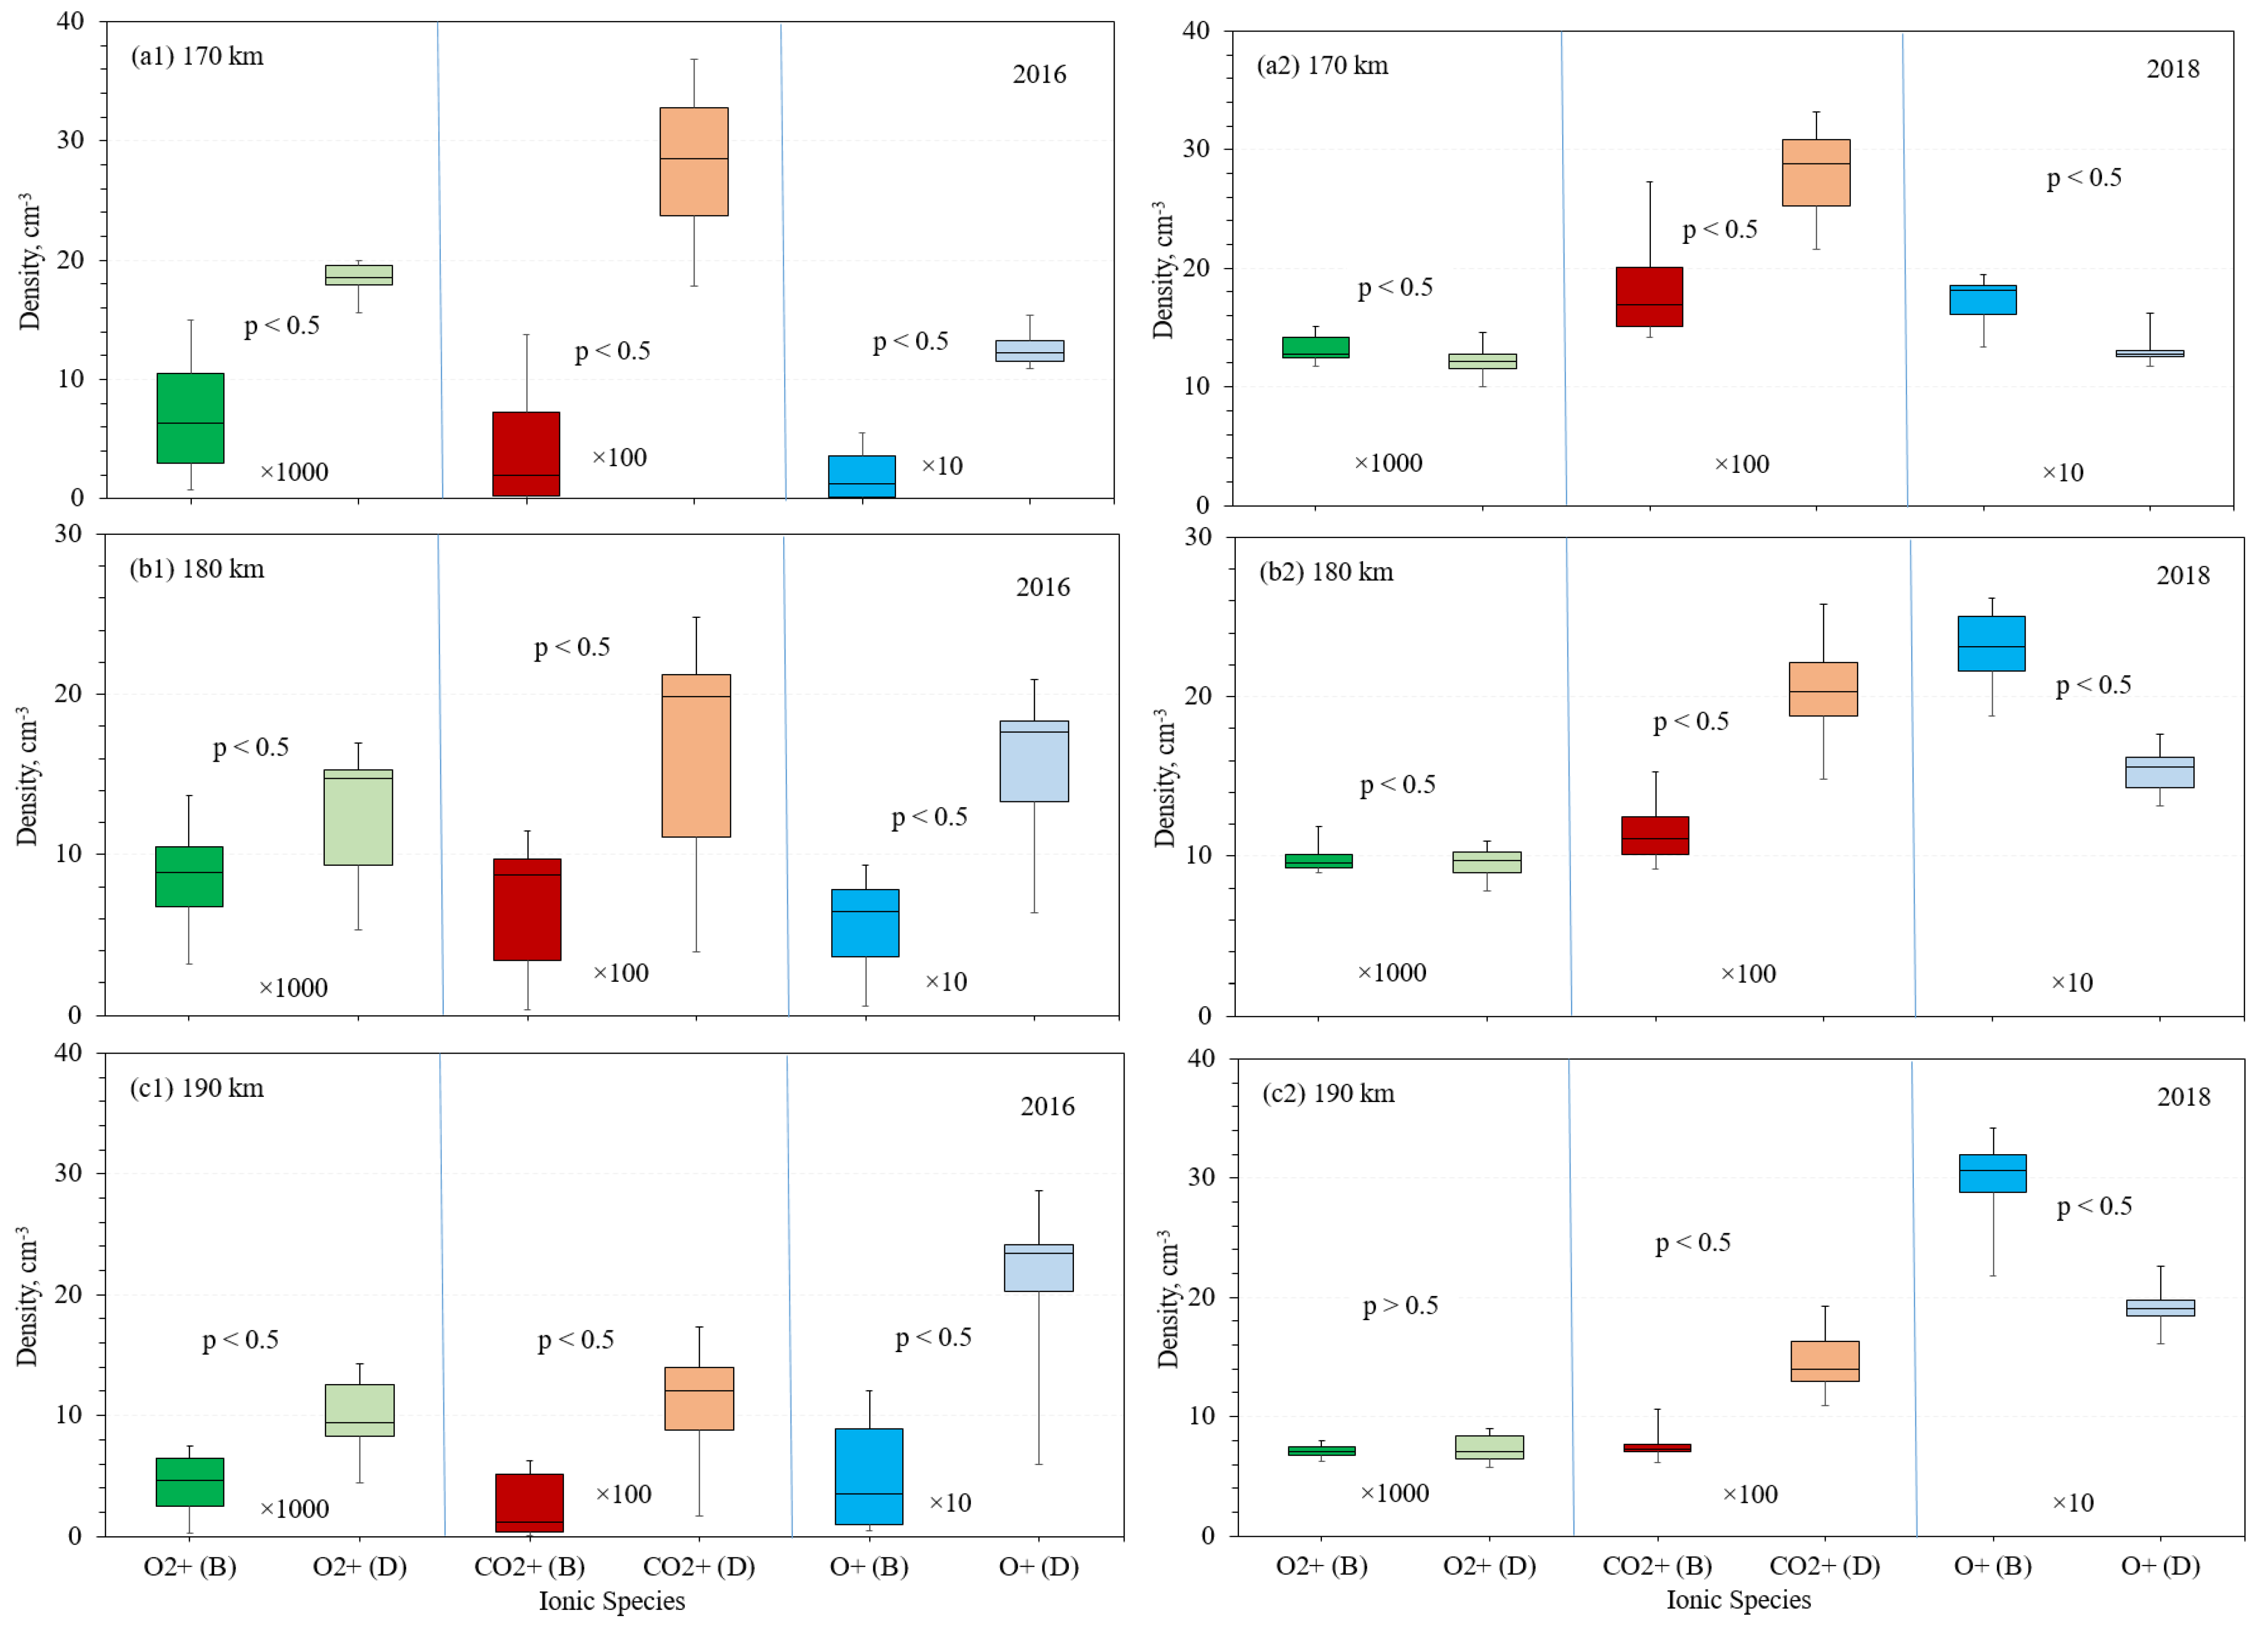
3.3. Data Statistical Significance

Figure 9 show that the variations in the O2+, CO2+, and O+ densities are caused by the regional and global dust storm events from 9 September–2 October 2016 (RDS 2016) and from 27 May to 17 June 2018 (GDS 2018) respectively. This is indicated by p < 0.5 except for O2+ from 27 May to 17 June 2018 at 190 km, where the difference between O2+ before and during the storm was found to be insignificant, as indicated by p~0.593 (p > 0.5). This means that we can reject the null-hypothesis H01, which indicates that regional and global dust storms can cause variations in the O2+, CO2+, and O+ species densities.
Figure 9 also shows that both RDS 2016 and GDS 2018 regional and global dust storms resulted in the increase of CO2+ density during the storm compared to pre-storm. The median value (indicated by the horizontal lines in the box plots) of CO2+ density during the 2016 regional dust storm increased from 1.9–28.5 cm−3 (around 14.7 times), 8.7–19.9 cm−3 (around 2.2 times), and 1.2–12.1 cm−3 (around 10.1 times) at 170, 180, and 190 km respectively. Meanwhile, the median value of CO2+ density during the 2018 global dust storm increased from 16.9–28.8 cm−3 (around 1.7 times), 11.1–20.3 cm−3 (around 1.8 times), and 7.2–13.9 cm−3 (around 1.9 times) at 170, 180, and 190 km respectively. It can be observed that the regional 2016 storm contributed more to the generation of CO2+ compared to the global 2018 storm.
The median value of O2+ density during the 2016 regional dust storm increased from 6.3–18.5 cm−3 (around 2.9 times), 8.8–14.7 cm−3 (around 1.6 times), and 4.6–9.4 cm−3 (around 2.1 times) at 170, 180, and 190 km respectively. Meanwhile, the median value of O2+ density during the 2018 global dust storm decreased from 12.8–12.1 cm−3 (around 0.97 times), increased from 9.6–9.7 cm−3 (around 0.98 times), and increased from 7.03–7.07 cm−3 (around 1.001 times) at 170, 180, and 190 km respectively. It can be observed that both regional 2016 and global 2018 dust storms did not largely contribute to the variation of O2+ density; however, small-scale regional dust may increase O2+ density more than wide-scale planet-covering dust.
The median value of O+ density during the 2016 regional dust storm increased from 1.3–12.3 cm−3 (around 9.5 times), 6.4–17.6 cm−3 (around 2.8 times), and 3.5–23.5 cm−3 (around 6.7 times) at 170, 180, and 190 km respectively. Meanwhile, the median value of O+ density during the 2018 global dust storm decreased from 18.2–12.8 cm−3 (around 0.70 times), from 23.1–15.6 cm−3 (around 0.67 times), from 30.6–19.1 cm−3 (around 0.62 times) at 170, 180, and 190 km respectively.
It is important to note that the increase in neutral species lighter than CO2 (for example CO and O) with altitude could be attributed to molecular diffusion and photodissociation and not be necessarily related to the dust storm. This is because such lighter species can increase due to the combination of molecular diffusion and the generation of CO and O from CO2 due to photodissociation in the Martian atmosphere [2]. Dust storms, however, can have a significant effect on atmospheric temperature variability, and thereby neutral species dynamics.

4. Conclusions

We analyzed the density profiles of three ion species in the upper Martian atmosphere using data acquired by MAVEN/NGIMS during RDS 2016 and GDS 2018. We examined the continuous altitude coverage from 160–240 km at the SZA range of 75–130° (RDS 2016) and 50–85° (GDS 2018). A total of 24 days of ion species abundances data were examined from MAVEN/NGIMS to study the effect of dust on the variation of the ion species densities.
Compared to their densities on 13 September 2016 (pre-storm density), the densities of O2+, CO2+, and O+ decreased by around 55% for six days before the RDS 2016 onset (16–21 September 2016) then their densities increased by around 10–65% after the storm onset. Additionally, compared to their densities on 31 May 2018 (pre-storm density), the density of O2+ decreased by around 10%, CO2+ increased by around 44%, and O+ decreased by 35% after the GDS 2018 onset (11–18 June 2018).
This work also investigated possible sources of ion species abundance variation by examining O2+, CO2+, and O+ density relative to CO2 and CO. It is observed that the increase of CO2+ or O+ abundance during the RDS 2016 dust event could have resulted in the observed increase in O2+ density. It is also found that the increase in O2+ density is not connected with the change of O or CO2 abundance. Also, the decrease of O and O+ abundance during the GDS 2018 dust event could have resulted in the observed decrease in O2+ density. This decrease in O2+ density was found not be connected to the change in CO2+ or CO abundances during the storm.
A statistical sensitivity p-value test was performed to inspect how ion species variation could be affected by data randomness. Results show that variations in ion species are caused by the RDS 2016 and GDS 2018 and not due to data randomness. Meanwhile, it is found that the intensity and spatial coverage of a dust storm can affect the abundance of ion species on the Martian upper atmosphere.
We investigated the possible effect of SZA in the ion species variation. We found that the ion species trends reported are due to the RDS 2016 and GDS 2018, not the SZA variations. We also showed that this ion species variation is not a typical feature of the Martian upper atmosphere but is connected to the dust events’ onset and propagation.
The findings of this work encourage more modeling efforts to investigate a possible link between the variability of ion densities in the Martian upper atmosphere and changes in atmospheric temperature associated with the dust storms.

Author Contributions

A.F.: Conceptualization, Methodology, Software, Validation, Formal analysis, Investigation, Resources, Data curation, Writing—original draft, Writing—review & editing, Visualization, Project administration, Funding acquisition. P.W.: Methodology, Software, Validation, Investigation, Data curation, Writing—original draft, Writing—review & editing, Visualization, Supervision, Project administration. M.M.: Methodology, Software, Validation, Investigation, Data curation, Writing—original draft, Writing—review & editing, Supervision. M.A.D.: Software, Writing—review & editing, Visualization. All authors have read and agreed to the published version of the manuscript.

Funding

The authors would like to acknowledge the support provided by the Deanship of Scientific Research (DSR) at the King Fahd University of Petroleum and Minerals (KFUPM) for funding this work through Project No. SB201002. P. Withers acknowledges support from the MAVEN. M.A.D. acknowledges partial support from 80NSSC19K0079.

Data Availability Statement

The MAVEN data set used in this study is available at the MAVEN Science Data Center through https://lasp.colorado.edu/maven/sdc/public/data/sci/ngi/l2/ (NGIMS level 2, version 8, revision 1) (Last Access: 15 February 2022).

Acknowledgments

A portion of this work was performed at the Center for Space Physics, Boston University. The authors thank the reviewers for their helpful comments. Author A.F. acknowledges the support of the Center of Research Excellence in Renewable Energy (CORERE), KFUPM.

Conflicts of Interest

The authors declare no conflict of interest.

References

  1. Bougher, S.W.; Fesen, C.G.; Ridley, E.C.; Zurek, R.W. Mars Mesosphere and Thermosphere Coupling: Semidiurnal Tides. J. Geophys. Res. Planets 1993, 98, 3281–3295. [Google Scholar] [CrossRef]
  2. Clark, I.D.; Noxon, J.F. Photodissociation of CO2 on Mars. J. Geophys. Res. 1970, 75, 7307–7310. [Google Scholar] [CrossRef]
  3. Withers, P.; Pratt, R. An Observational Study of the Response of the Upper Atmosphere of Mars to Lower Atmospheric Dust Storms. Icarus 2013, 225, 378–389. [Google Scholar] [CrossRef] [Green Version]
  4. Martin, L.J.; Zurek, R.W. An Analysis of the History of Dust Activity on Mars. J. Geophys. Res. Planets 1993, 98, 3221–3246. [Google Scholar] [CrossRef]
  5. Wang, H.; Richardson, M.I. The Origin, Evolution, and Trajectory of Large Dust Storms on Mars during Mars Years 24–30 (1999–2011). Icarus 2015, 251, 112–127. [Google Scholar] [CrossRef]
  6. Heavens, N.G.; Kass, D.M.; Shirley, J.H. Dusty Deep Convection in the Mars Year 34 Planet-Encircling Dust Event. J. Geophys. Res. Planets 2019, 124, 2863–2892. [Google Scholar] [CrossRef]
  7. Kass, D.M.; Schofield, J.T.; Kleinböhl, A.; McCleese, D.J.; Heavens, N.G.; Shirley, J.H.; Steele, L.J. Mars Climate Sounder Observation of Mars’ 2018 Global Dust Storm. Geophys. Res. Lett. 2020, 47, e2019GL083931. [Google Scholar] [CrossRef]
  8. Basu, S.; Richardson, M.; Wilson, R. Simulation of the Martian Dust Cycle with the GFDL Mars GCME. J. Geophys. Res 2004, 109. [Google Scholar] [CrossRef] [Green Version]
  9. Cantor, B.A. MOC Observations of the 2001 Mars Planet-Encircling Dust Storm. Icarus 2007, 186, 60–96. [Google Scholar] [CrossRef]
  10. Stewart, A.J.; Hanson, W.B. Mars’ Upper Atmosphere: Mean and Variations. Adv. Space Res. 1982, 2, 87–101. [Google Scholar] [CrossRef]
  11. Hantsch, M.H.; Bauer, S.J. Solar Control of the Mars Ionosphere. Planet. Space Sci. 1990, 38, 539–542. [Google Scholar] [CrossRef]
  12. Madeleine, J.-B.; Forget, F.; Millour, E.; Montabone, L.; Wolff, M.J. Revisiting the Radiative Impact of Dust on Mars Using the LMD Global Climate Model. J. Geophys. Res. Planets 2011, 116. [Google Scholar] [CrossRef] [Green Version]
  13. Chaufray, J.-Y.; Chaffin, M.; Deighan, J.; Jain, S.; Schneider, N.; Mayyasi, M.; Jakosky, B. Effect of the 2018 Martian Global Dust Storm on the CO2 Density in the Lower Nightside Thermosphere Observed From MAVEN/IUVS Lyman-Alpha Absorption. Geophys. Res. Lett. 2020, 47, e2019GL082889. [Google Scholar] [CrossRef]
  14. Bell, J.M.; Bougher, S.W.; Murphy, J.R. Vertical Dust Mixing and the Interannual Variations in the Mars Thermosphere. J. Geophys. Res. Planets 2007, 112. [Google Scholar] [CrossRef]
  15. Spiga, A.; Forget, F. A New Model to Simulate the Martian Mesoscale and Microscale Atmospheric Circulation: Validation and First Results. J. Geophys. Res. Planets 2009, 114. [Google Scholar] [CrossRef] [Green Version]
  16. Gilli, G.; Forget, F.; Spiga, A.; Navarro, T.; Millour, E.; Montabone, L.; Kleinböhl, A.; Kass, D.M.; McCleese, D.J.; Schofield, J.T. Impact of Gravity Waves on the Middle Atmosphere of Mars: A Non-Orographic Gravity Wave Parameterization Based on Global Climate Modeling and MCS Observations. J. Geophys. Res. Planets 2020, 125, e2018JE005873. [Google Scholar] [CrossRef] [Green Version]
  17. Wu, Z.; Li, T.; Heavens, N.G.; Newman, C.E.; Richardson, M.I.; Yang, C.; Li, J.; Cui, J. Earth-like Thermal and Dynamical Coupling Processes in the Martian Climate System. Earth-Sci. Rev. 2022, 229, 104023. [Google Scholar] [CrossRef]
  18. Martinis, C.R.; Wilson, J.K.; Mendillo, M.J. Modeling Day-to-Day Ionospheric Variability on Mars. J. Geophys. Res. Space Phys. 2003, 108, 1383. [Google Scholar] [CrossRef] [Green Version]
  19. Elrod, M.K.; Bougher, S.W.; Roeten, K.; Sharrar, R.; Murphy, J. Structural and Compositional Changes in the Upper Atmosphere Related to the PEDE-2018 Dust Event on Mars as Observed by MAVEN NGIMS. Geophys. Res. Lett. 2020, 47, e2019GL084378. [Google Scholar] [CrossRef]
  20. Kass, D.M.; Kleinböhl, A.; McCleese, D.J.; Schofield, J.T.; Smith, M.D. Interannual Similarity in the Martian Atmosphere during the Dust Storm Season. Geophys. Res. Lett. 2016, 43, 6111–6118. [Google Scholar] [CrossRef]
  21. Farahat, A. MAVEN GDS2018. 2021, 2. Mendeley Data. Available online: https://data.mendeley.com/datasets/f89vg2dhtg/2 (accessed on 22 May 2022).
  22. Kahre, M.A.; Murphy, J.R.; Haberle, R.M. Modeling the Martian Dust Cycle and Surface Dust Reservoirs with the NASA Ames General Circulation Model. J. Geophys. Res. Planets 2006, 111. [Google Scholar] [CrossRef]
  23. Medvedev, A.S.; Yiğit, E.; Kuroda, T.; Hartogh, P. General Circulation Modeling of the Martian Upper Atmosphere during Global Dust Storms. J. Geophys. Res. Planets 2013, 118, 2234–2246. [Google Scholar] [CrossRef]
  24. González-Galindo, F.; López-Valverde, M.A.; Forget, F.; García-Comas, M.; Millour, E.; Montabone, L. Variability of the Martian Thermosphere during Eight Martian Years as Simulated by a Ground-to-Exosphere Global Circulation Model. J. Geophys. Res. Planets 2015, 120, 2020–2035. [Google Scholar] [CrossRef] [Green Version]
  25. Wu, Z.; Li, T.; Zhang, X.; Li, J.; Cui, J. Dust Tides and Rapid Meridional Motions in the Martian Atmosphere during Major Dust Storms. Nat. Commun. 2020, 11, 614. [Google Scholar] [CrossRef] [Green Version]
  26. Guzewich, S.D.; Lemmon, M.; Smith, C.L.; Martínez, G.; de Vicente-Retortillo, Á.; Newman, C.E.; Baker, M.; Campbell, C.; Cooper, B.; Gómez-Elvira, J.; et al. Mars Science Laboratory Observations of the 2018/Mars Year 34 Global Dust Storm. Geophys. Res. Lett. 2019, 46, 71–79. [Google Scholar] [CrossRef] [Green Version]
  27. Sánchez-Lavega, A.; del Río-Gaztelurrutia, T.; Hernández-Bernal, J.; Delcroix, M. The Onset and Growth of the 2018 Martian Global Dust Storm. Geophys. Res. Lett. 2019, 46, 6101–6108. [Google Scholar] [CrossRef] [Green Version]
  28. Smith, M.D. THEMIS Observations of the 2018 Mars Global Dust Storm. J. Geophys. Res. Planets 2019, 124, 2929–2944. [Google Scholar] [CrossRef]
  29. Jain, S.K.; Bougher, S.W.; Deighan, J.; Schneider, N.M.; González Galindo, F.; Stewart, A.I.F.; Sharrar, R.; Kass, D.; Murphy, J.; Pawlowski, D. Martian Thermospheric Warming Associated With the Planet Encircling Dust Event of 2018. Geophys. Res. Lett. 2020, 47, e2019GL085302. [Google Scholar] [CrossRef]
  30. Withers, P.; Bougher, S.W.; Keating, G.M. The Effects of Topographically-Controlled Thermal Tides in the Martian Upper Atmosphere as Seen by the MGS Accelerometer. Icarus 2003, 164, 14–32. [Google Scholar] [CrossRef]
  31. Jakosky, B.M.; Grebowsky, J.M.; Luhmann, J.G.; Brain, D.A. Initial Results from the MAVEN Mission to Mars. Geophys. Res. Lett. 2015, 42, 8791–8802. [Google Scholar] [CrossRef]
  32. Montabone, L.; Spiga, A.; Kass, D.M.; Kleinböhl, A.; Forget, F.; Millour, E. Martian Year 34 Column Dust Climatology from Mars Climate Sounder Observations: Reconstructed Maps and Model Simulations. J. Geophys. Res. Planets 2020, 125, e2019JE006111. [Google Scholar] [CrossRef] [Green Version]
  33. Montabone, L.; Millour, E.; Forget, F.; Spiga, A.; Kass, D.; Kleinböhl, A. Martian Year 34 Climatology of the Atmospheric Column Dust Optical Depth; ESPRI/IPSL: Paris, France, 2019. [Google Scholar]
  34. Farahat, A.; Mayyasi, M.; Withers, P.; Dayeh, M.A.; Abuelgasim, A. Effects of the June 2018 Global Dust Storm on the Atmospheric Composition of the Martian Upper Atmosphere as Observed by MAVEN. J. Geophys. Res. Planets 2021, 126, e2021JE006868. [Google Scholar] [CrossRef]
  35. Clancy, R.; Wolff, M.; Whitney, B.; Cantor, B. Vertical Distributions of Dust Optical Depth During the 2001 Planet Encircling Storm from a Spherical Radiative Transfer Analysis of MOC Limb Images. In Proceedings of the Sixth International Conference on Mars, Pasadena, CA, USA, 20–25 July 2003. [Google Scholar]
  36. Clancy, R.T.; Wolff, M.J.; Whitney, B.A.; Cantor, B.A.; Smith, M.D.; McConnochie, T.H. Extension of Atmospheric Dust Loading to High Altitudes during the 2001 Mars Dust Storm: MGS TES Limb Observations. Icarus 2010, 207, 98–109. [Google Scholar] [CrossRef]
  37. Mahaffy, P.R.; Benna, M.; King, T.; Harpold, D.N.; Arvey, R.; Barciniak, M.; Bendt, M.; Carrigan, D.; Errigo, T.; Holmes, V.; et al. The Neutral Gas and Ion Mass Spectrometer on the Mars Atmosphere and Volatile Evolution Mission. Space Sci. Rev. 2015, 195, 49–73. [Google Scholar] [CrossRef] [Green Version]
  38. Cramer, A.G.; Withers, P.; Elrod, M.K.; Benna, M.; Mahaffy, P.R. Effects of the 10 September 2017 Solar Flare on the Density and Composition of the Thermosphere of Mars. J. Geophys. Res. Space Phys. 2020, 125, e2020JA028518. [Google Scholar] [CrossRef]
  39. Withers, P. A Review of Observed Variability in the Dayside Ionosphere of Mars. Adv. Space Res. 2009, 44, 277–307. [Google Scholar] [CrossRef]
Figure 2. Ion species distribution from 9 September to 4 October 2016, at altitudes of 160–240 km and SZAs of 75–130°: (a) O2+, (b) CO2+, and (c) O+. The vertical black line on 21 September 2016 indicates the storm onset. The blank regions represent missing NGIMS data from all of 21 September.
Remotesensing 14 02594 g002
Figure 3. Ion species and electrons density distribution 27 May to 17 June 2018, at altitudes of 160–240 km and SZAs of 50–85°: (a) O2+, (b) CO2+, and (c) O+. The vertical black line on 8 June 2018 indicates the storm onset. The blank regions represent missing NGIMS data from all of 9 June and most of 10 June.
Remotesensing 14 02594 g003
Figure 4. O+, CO2+, and O2+ densities (cm−3) and solar zenith angle variation (colored solid and dashed lines respectively) at 170 km; 180 km; and 190 km from 9 September–4 October 2016 (a1c1) and 27 May–17 June 2018 (a2c2). The dashed vertical black line marks the beginning of the 2016 regional dust storm on 20 September (a1c1) and the beginning of the 2018 global dust storm on 8 June (a2c2). Right axis: species density; left axis: SZA.
Remotesensing 14 02594 g004
Figure 5. Distribution of (O2+, CO2+, and O+) ion species density normalized to their own pre-storm densities as a function of altitude (a1c1) 9 September–2 October 2016 (RDS 2016); (a2c2) 27 May to 17 June 2018 (GDS 2018). The vertical black line indicates the storm onset. The blank regions represent missing data.
Remotesensing 14 02594 g005
Figure 6. Density evolution of three neutral species, CO2 (green lines), CO (blue lines), and O (red lines) from (a) 9 September to 4 October 2016, at altitudes of 160–240 km, (b) 27 May to 17 June 2018. The vertical black line indicates the storm onset. The blank regions represent missing NGIMS data.
Remotesensing 14 02594 g006
Figure 7. Ratio of (O2+, CO2+, and O+) to CO at 170, 180, and 190 km (a1c1) from 9 September–2 October 2016 (RDS 2016); (a2c2) from 27 May to 17 June 2018 (GDS 2018). The vertical black line indicates the storm onset. Left axis: CO2+ and O+ to CO; right axis: O2+ to CO.
Remotesensing 14 02594 g007
Figure 8. Ratio of (O2+, CO2+, and O+) to CO2 at 170, 180, and 190 km (a1c1) from 9 September–2 October 2016 (RDS 2016); (a2c2) from 27 May to 17 June 2018 (GDS 2018). The vertical black line indicates the storm onset. Left axis: CO2+ and O+ to CO2; right axis: O2+ to CO2.
Remotesensing 14 02594 g008
Figure 9. Box plots of variations of O2+, CO2+, and O+ at (a1c1) from 9 September–2 October 2016 (RDS 2016); (a2c2) from 27 May to 17 June 2018 (GDS 2018). B: before the storm; and D: during the storm.
Remotesensing 14 02594 g009
Table 1. Maximum and minimum ratios of O2+, CO2+, O+ to CO and CO2 from 9 September–2 October 2016 and 27 May–18 June 2018. B: before; D: during the RDS 2016 and GDS 2018 dust storms.
Ratio × 10−5 9 September–2 October 201627 May–18 June 2018
Altitude (km)
170180190170180190
MinMaxMinMaxMinMaxMinMaxMinMaxMinMax
O2+/COB0.354.41.337.60.5910.17.017.014.020.015.025.0
D4.737.44.6813.910.3521.55.88.59.011.513.017.0
CO2+/COB0.0010.40.030.950.020.940.801.71.102.01.52.5
D0.681.30.491.990.392.891.501.81.502.72.53.4
O+/COB~00.020.0050.080.0070.182.03.31.72.72.33.5
D0.030.050.080.160.140.480.600.850.901.31.31.6
O2+/CO2B0.141.50.833.30.47.32.95.36.49.49.914.1
D1.422.12.235.35.812.31.94.33.76.26.49.9
CO2+/CO2B~00.140.0150.420.0150.550.40.720.71.11.21.7
D0.20.380.20.770.251.310.50.760.81.21.31.8
O+/CO2B~00.0060.0020.040.0040.140.030.070.10.20.30.7
D0.010.0150.0380.070.090.230.020.040.050.120.150.3
Table 2. Mean and standard deviation of O2+, CO2+, O+ to CO and CO2 from 9 September–2 October 2016 and 27 May–18 June 2018. B: before; D: during the RDS 2016 and GDS 2018 dust storms.
Ratio × 10−5 9 September–2 October 201627 May–18 June 2018
Altitude (km)
170180190170180190
MeanStd.MeanStd.MeanStd.MeanStd.MeanStd.MeanStd.
O2+/COB1.991.45.32.186.463.18.70.9812.31.0316.31.14
D5.990.79.92.6214.93.27.41.0710.71.4714.71.33
CO2+/COB0.10.140.390.330.340.331.20.31.50.31.80.37
D0.90.201.270.471.610.691.60.242.20.42.80.35
O+/COB0.010.0060.030.020.090.060.110.020.30.030.60.09
D0.040.0040.120.020.320.090.080.020.180.030.40.09
O2+/CO2B0.70.452.40.784.071.94.170.67.50.812.51.2
D1.80.464.100.678.082.12.780.74.80.87.91.1
CO2+/CO2B0.030.050.170.130.210.20.560.080.90.091.40.14
D0.280.050.520.130.830.20.60.090.990.141.50.15
O+/CO2B0.0010.0020.020.010.060.040.060.010.170.030.490.11
D0.0130.0020.050.010.170.030.030.010.080.020.20.06
Publisher’s Note: MDPI stays neutral with regard to jurisdictional claims in published maps and institutional affiliations.

