Article

Ten Years of VIIRS Land Surface Temperature Product Validation

1
Earth System Science Interdisciplinary Center, University of Maryland, College Park, MD 20740, USA
2
Center for Satellite Applications and Research, National Oceanic and Atmospheric Administration (NOAA)/National Environmental Satellite, Data, and Information Service (NESDIS), College Park, MD 20740, USA
*
Author to whom correspondence should be addressed.
Remote Sens. 2022, 14(12), 2863; https://doi.org/10.3390/rs14122863
Submission received: 4 May 2022 / Revised: 9 June 2022 / Accepted: 13 June 2022 / Published: 15 June 2022
(This article belongs to the Special Issue VIIRS 2011–2021: Ten Years of Success in Earth Observations)

Abstract

:
The Visible Infrared Imaging Radiometer Suite (VIIRS) Land Surface Temperature (LST) has been operationally produced for a decade since the Suomi National Polar-orbiting Partnership (SNPP) launched in October 2011. A comprehensive evaluation of its accuracy and precision will be helpful for product users in climate studies and atmospheric models. In this study, the VIIRS LST is validated with ground observations from multiple high-quality radiation networks, including six stations from the Surface Radiation budget (SURFRAD) network, two stations from the Baseline Surface Radiation Network (BSRN), and 13 stations from the Atmospheric Radiation Measurement (ARM) network, to evaluate its performance over various land-cover types. The VNP21A1 LST was validated against the same ground observations as a reference. The results yield a close agreement between the SNPP VIIRS LST and ground LSTs with a bias of −0.4 K and a RMSE of 1.96 K over six SURFRAD sites; a bias of −0.2 K and a RMSE of 1.93 K over two BSRN sites; and a bias of −0.1 K and a RMSE of 1.7 K over the 13 ARM sites. The time series of the LST errors over individual sites indicate seasonal cycles. The data anomaly over the BSRN site in Cabauw and the SURFRAD site in Desert Rock is revealed and discussed in this study. In addition, a method using Landsat-8 data is applied to quantify the heterogeneity level of each ground station and the results provide promising insights. The validation results demonstrate the maturity of the JPSS VIIRS LST products and their readiness for various application studies.

1. Introduction

With the launch of the SNPP satellite in 2011, the VIIRS LST, as an important baseline environmental data record (EDR), has now been produced from infrared radiance measurements for over ten years. The NOAA-20 satellite was successfully launched in November 2017 and its LST data were available since 5 January 2018. The LST is one of the essential climate variables (ECV), i.e., important variables with a critical contribution to make to the characterization of Earth’s climate, as specified by the Global Climate Observing System (GCOS) [1]. Therefore, the availability of long-term and high-quality LST observations is indispensable.
The LST data are useful for various applications in climate research, such as numerical weather prediction models and data assimilation systems [2,3], evapotranspiration evaluation [4,5], agricultural drought monitoring [6], soil moisture downscaling [7], and urban heat island monitoring [8,9], etc.
The VIIRS LST is retrieved based on the Split Window (SW) algorithm, which is a widely used approach in operational LST productions, such as the Moderate Resolution Imaging Spectroradiometer (MODIS) LST [10], Advanced Baseline Image (ABI) LST on Geostationary Operational Environmental Satellite (GOES) series [11], Spinning Enhanced Visible and InfraRed Imager (SEVIRI) LST [12], Advanced Along-Track Scanning Radiometer (AATSR) LST [13], and Sentinel-3 LST [14], etc. The early SNPP’s VIIRS LST used a surface-type-dependent algorithm where the coefficients are stratified by the 17 International Geosphere Biosphere Program (IGBP) surface types [15]. Because the surface type is annual static data, it fails to capture the seasonal variations of some of the surface types, such as cropland, grassland, mixed forest, savannas, etc. It was replaced with the enterprise LST algorithm in 2019 [16], in which the emissivity is explicitly used in the formula to characterize the surface emission feature and to extend the heritage by MODIS LST.
Note that the VIIRS LST product has gone through several major updates, including the algorithm change as mentioned above and updates to the lookup table (LUT) a couple of times, which certainly has an impact on the validation results. Previous studies validated the VIIRS LST for a certain short time period, with the algorithms in operation during that time. Li et al. [17] evaluated the VIIRS LST using ground observations collected in an arid area of northwest China for the time period from June 2012 to April 2013. The results demonstrate the accuracy with a bias of 0.36 K and −0.58 K and a root mean square error (RMSE) of 2.74 K and 1.48 K for the four sites during the daytime and nighttime, respectively. Liu et al. [15] validated the VIIRS LST using ground observations from the SURFRAD and the results show an overall bias of −0.4 K and RMSE of 2.4 K for the period from 2012 to 2015. The above two studies evaluated the performance of the VIIRS LST derived from the surface-type-dependent algorithm. Liu et al. [16] validated the NOAA-20 VIIRS LST derived from the enterprise LST algorithm, using SURFRAD data and BSRN data as a reference. It shows a bias of −0.3 K and an RMSE of 2.06 K for the SURFRAD stations and a bias of 0.2 K and a RMSE of ~2 K for the BSRN sites. Despite the data from different algorithms at different stages, the results are generally consistent with a slight improvement observed in the implementation of the enterprise LST algorithm. However, the difference in the satellite LST retrieval algorithms may introduce significant LST differences under specific conditions, due to the sensitivity and uncertainty distribution of each algorithm. It demonstrates the need for an enterprise satellite LST algorithm for the LST production from satellite series within one mission and even among different satellite missions. It will facilitate the cross-satellite comparison and help to build long-term, consistent LST data records for climate studies.
Compared to the MODIS LST, the VIIRS LST has not gained a lot of attention from users, but VIIRS will eventually replace MODIS in providing land surface products. Therefore, it is very important to provide the user community with an assessment of the VIIRS LST products. The aim of this work is to provide a comprehensive evaluation of the accuracy and precision of the VIIRS LST product using 10 years of data, reprocessed with the enterprise LST algorithm and the latest LUT in operation. Specifically, the satellite LST is compared with the ground observations from multiple radiation networks including SURFRAD, BSRN, and ARM, which are located in different areas with various land cover types. These ground in situ data were widely used in the satellite LST validation. Guillevic et al. [18] took in situ data from the Bondville site in SURFRAD and reported a bias of 0.3 K for the VIIRS LST. Li et al. [19] validated the MODIS LST using ten years of data over six SURFRAD sites, resulting in a bias of −0.93 K and RMSE of 2.65 K. The GOES-R LSTs were validated over one year of SURFRAD data yielding an average precision of 2.3 K [20]. Martin et al. [21] used measurements over six SURFRAD stations to validate the performance of five satellite LST datasets including AATSR, GOES, two Glob Temperature MODIS products (MOGSV and MYGSV), and SEVIRI, and reported the average accuracies of within ±2.0 K during the night, and within ±4.0 K during the day. The ARM observations from the SGP station were used to validate the GOES LST [22] and the Glob temperature LST products [23].
The paper is organized as follows: the data used in this study are described in Section 2, followed by the methodology and the data processing procedure. Results are presented in Section 4 and the discussion is in Section 5. The conclusion is given in Section 6.

2. Data Used

2.1. Satellite Data

The VIIRS onboard the SNPP, NOAA-20, and future JPSS series, a scanning radiometer, collects visible and infrared imagery and radiometric measurements of the land, atmosphere, cryosphere, and oceans. The NOAA VIIRS LST EDR, a granule product, is produced daily for both daytime and nighttime. Each granule contains 86 s of temporal VIIRS sensing with 768 detectors’ scan lines, at 750 m moderate spatial resolution. The VIIRS LST product includes layers of LSTs, quality control flags, emissivity for band M15, M16, and broadband, satellite viewing angle and azimuth angle, latitude, and longitude, and it is distributed via NOAA, the Comprehensive Large Array-data Stewardship System (CLASS) (https://www.avl.class.noaa.gov/saa/products/welcome, accessed on 4 June 2022). Both the SNPP and NOAA-20 VIIRS LSTs are used in this study, in which the NOAA-20 LSTs are only used for validation against SURFRAD observations with the purpose of verifying the consistent performance between the two LST datasets. The SNPP LST has 10 years of data from February 2012 to January 2022, and NOAA-20 LST has four years of data from January 2018 to December 2021. Both of the LSTs are reprocessed with the enterprise LST algorithm, using the latest LUT in operational and land surface emissivity (LSE) data in its latest version to ensure consistent validation. The enterprise LST algorithm has been operationally implemented since June 2019, which uses emissivity explicitly in the formula and is expressed as:
LST = a 0 + a 1 T 15 + a 2 T 15 T 16 + a 3 ε + a 4 ε T 15 T 16 + a 5 Δ ε
where ai are algorithm coefficients with a stratification of day/night condition, sensor view zenith angles, and total precipitable water vapor conditions; ε = (ε15 + ε16)/2 and Δε = (ε15ε16), where ε15 and ε16 are the spectral emissivity values of the M15 and M16 channels, respectively.
The LSE product is generated based on the vegetation cover method (VCM), which combines two constant emissivity values from the bare ground and full vegetation coverage situations. The daily emissivity is adjusted according to the VIIRS’ daily green vegetation fraction (GVF) and snow fraction products. The new daily LSE product (NOAA LSE Product) provides the spectral emissivity for the VIIRS split window bands, as well as the broadband emissivity at 1 km spatial resolution [24]. In addition, the VNP21A1 LST product, including the VNP21A1D for daytime and the VNP21A1N for nighttime, is used as a reference data set, in which two years of data, from 2019 and 2020, were used in this study. The VNP21 LST product is developed using a physics-based temperature and emissivity separation (TES) algorithm to dynamically retrieve both the LST and the emissivity for the VIIRS onboard the SNPP satellite, which is then aggregated to produce the global daily (VNP21A1) LST. Details on the VNP21A1 product can be found in [25].

2.2. Ground Data

The ground stations are located in different regions worldwide with different land covers and topography. They are operated under three radiation networks, including SURFRAD, BSRN, and ARM.
All three of the network stations provide upwelling and downwelling broadband IR radiances in the wavelength range from 4–50 µm with a small temporal interval i.e., one minute in their measurements which allows the validation to be performed with a nearly simultaneous observation between the satellite and the in situ instrument. The in situ LST is derived from the upwelling and downwelling radiance flux by the Stefan-Boltzmann law
F = ε σ T s 4 + 1 ε F
where F and F are the upwelling and downwelling longwave radiation flux, respectively; ε is the broadband surface emissivity and σ is the Stefan–Boltzman constant (σ = 5.67051 × 10⁻⁸ Wm−2k−4), and T S   is the surface skin temperature. Here, the broadband emissivity is derived from the NOAA LSE product. Ts is then obtained by inverting Equation (2):
T s = F 1 ε F ε σ 1 4
From Equation (3), the accuracy of the ground LST depends on the accurate measurements of the upwelling and downwelling radiation and the broadband emissivity (BBE). Different types of instruments are used in in situ networks. The infrared radiometer, e.g., the pyrgeometers used in all of the SURFRAD sites measuring both downwelling and upwelling radiation has an uncertainty about ±5 W·m−2 [26]. The BBE uncertainty makes a minor contribution to the total LST uncertainty compared to the radiometer measurements’ uncertainty. The NOAA broadband emissivity for the spectral range of 8–13.5 µm has an uncertainty of 0.012, based on the comparison with the in situ emissivity measurements [24], which give rise to an uncertainty in the ground LST of less than 0.4 K for 99.6% of the total matchups between the SNPP LST and SURFRAD observations. The three uncertainty components, including upwelling measurement uncertainty, downwelling measurement uncertainty, and BBE uncertainty, are mutually independent and result in an overall LST uncertainty of 0.6–2.0 K [21] for all of the stations considering that the BBE uncertainty has a minor contribution compared to the other two components. In this study, the NOAA broadband LSE is matched to the in situ station and the in situ LST is calculated based on the latest LSE dataset.

2.2.1. SURFRAD Stations

The SURFRAD stations provide long-term high-quality in situ measurements of the surface upwelling and downwelling longwave radiations, along with other meteorological parameters [27]. An upward looking pyrgeometer on the main platform measures the longwave radiation emitted downward by the clouds and other atmospheric constituents. Another pyrgeometer is mounted on a 10-m high tower in each SURFRAD site, facing downward to sense the surface-upwelling longwave radiation. The spatial representativeness is about 70 m × 70 m [28]. Observations from the SURFRAD stations have been widely used for evaluating satellite-based estimates of surface radiation, for validating hydrology, weather prediction, climate models, and satellite LST products from the Advanced Spaceborne Thermal Emission and Reflection Radiometer (ASTER), GOES, MODIS, and VIIRS [15,16,28,29,30,31]. The SURFRAD consists of seven stations, from which the Goodwin Creek (GWN) site was removed by the LST validation, due to the onsite thermal heterogeneity which caused the ground LST to be lower than the satellite LST in the daytime, while it was higher in the nighttime [16]. The remaining six SURFRAD sites located throughout the USA covering a variety of surface types are used in this study, and the details are provided in Table 1. The NOAA SURFRAD network site locations were chosen, with the intention of best representing the diverse climates of the United States. Special consideration was given to the places where the landform and vegetation are homogeneous over an extended region, so that the point measurements would be qualitatively representative of a large area (https://www.esrl.noaa.gov/gmd/grad/surfrad/overview.html, accessed on 1 June 2022).

2.2.2. BSRN Stations

The radiometric network, BSRN, was launched in 1992 by the World Climate Research Program (WCRP) to support the research projects of the WCRP and other scientific programs [32]. It provides 1-min averaged short- and long-wave surface radiation fluxes of the best possible quality currently available. At a small number of the stations (currently 58 are active) in contrasting climatic zones, covering a latitude range from 80° N to 90° S, the solar and atmospheric radiation is measured with instruments of the highest available accuracy and with high time resolution (https://bsrn.awi.de, accessed on 4 June 2022). However, only two of the stations are selected for LST validation for several reasons: the longwave upwelling and downwelling data availability; temporal overlap with VIIRS measurements; and the site homogeneity requirements for LST validation. The selected two sites are located at Gobabeb, Namibia (GOB) and Cabauw, The Netherlands (CAB). Table 2 provides details on these two stations.
The CAB site is mainly covered by cropland, with residential housing in the surrounding area, where the farmland is a patchwork of different crops, such as corn and potatoes etc., but mostly dominated by grassland. The GOB site is located in the hyper-arid climate of the Namibia desert. Note that for the GOB site, the downwelling radiation sensor and upwelling radiation sensor are mounted at different locations, with about a 10 km distance between them. The downwelling sensor is located near the Gobabeb Research and Training Center (latitude 23.56° S, longitude 15.04° E), where the nearby Kuiseb river forms a natural boundary between the large gravel plains (>900 km2) and the sand dunes of the Namib Desert [33]. The upwelling sensor is located at latitude 23.519° S and longitude 15.083° E, where there are homogeneous gravel plains with very sparse grass coverage. The matchups between the in situ and satellite data are set at the homogeneous upwelling sensor location.

2.2.3. ARM Stations

The Atmospheric Radiation Measurement (ARM) operates three fixed-location atmospheric observatories, including the Southern Great Plains (SGP), the North Slope of Alaska (NSA), and the Eastern North Atlantic (ENA). The SGP atmospheric observatory, the first field measurement site established by ARM, is the world’s largest and most extensive climate research facility [34]. The ARM provides longwave downwelling and upwelling radiance at a 60 s average with a pyrgeometer instrument similar to the instrument used in the BSRN stations. Thirteen of the extended SGP sites have been included in this study, with the geolocation and surface type information given in Table 3.

3. Methodology and Data Processing

LST validation is challenging because of its high spatial, temporal, and directional variabilities. Three approaches have been widely used for the LST product validation: temperature-based (T-based) validation; radiance-based validation (R-based); and the cross-satellite comparison method [35]. In addition, the time series inter-comparison method, widely used in sea surface temperature validation (e.g., [36]), is also adopted for LST validation, such as the detection of potential instrument problems [37] or unrealistic outliers due to undetected clouds. However, this approach requires a relatively long time series of observations over temporally highly stable targets, e.g., inland water bodies [37], therefore its application in the LST validation is limited. These methods are complementary and provide different levels of information about the accuracy of the satellite-derived LST products [38].
The T-based validation uses the ground in situ LST measurements directly as an independent reference, to compare with the satellite LST; then, the difference between the two variables is investigated and analyzed, based on a statistical technique. There are several requirements for the ground sites to be suitable for the LST validation. First of all, the ground site should be able to provide long-term high-quality in situ LST observations. The instrument calibration, data quality control, and site maintenance should be performed on a regular basis. Secondly, the ground site should be able to provide a stable and sufficiently high sampling rate of the in situ measurements e.g., every 1 min to have a good temporal collocation with the satellite LST. Thirdly, the ground site should be relatively homogeneous within its surrounding areas with a size comparable to the satellite pixel. Most of the ground LST is measured within a small area, with a limited field of view comparing the relatively large satellite pixel size. In addition, the pixel size of a polar orbit satellite varies over the satellite zenith angle, which results in the edge pixel being two or three times the nadir pixel size with a large satellite viewing angle. Therefore, the site needs to have a homogenous surface cover over a relatively large area to be able to spatially represent the pixel LST.
In this study, the T-based validation method is used to evaluate the quality of both the VIIRS LST product and the VNP21A1 LST product through the comparison with ground in situ measurements. The time series analysis of LST error is performed over each ground site to detect anomalies, error patterns, and annual or seasonal signals.
Although the T-based validation is a well-established procedure, some of the details of satellite LST screening and ground data processing might be different from previous studies. Considering the cloud residue effect and the ground in situ data quality control, the following procedures were used for the matchup between the satellite LST and the ground in situ LST measurements: the temporal difference is less than 86 s, which is the duration of a single granule; the area spatially closest to the center of the pixel is used for the comparison; the 3 × 3 neighboring pixels are all marked as confidently clear to reduce the nearby cloud impact; the standard deviation of the band M15 brightness temperature in the neighboring 3 × 3 box is less than the threshold, which is set as 1.5 K for all of the sites; the standard deviation of the 30 min (centered at the matchup time) downwelling radiation from the in situ observations is less than a predetermined threshold, which is set as 1.2 W·m−2 for all of the sites. The above procedure is applied to the validation over all of the ground stations for both the SNPP and NOAA-20. For VNP21A1, however, it is unable to get the corresponding band 15 brightness temperature, so the criterion of the standard deviation of the band M15 brightness temperature in the neighboring 3 × 3 box is removed.
The spatial mismatching is often reported in the LST validation, with the ground observations mainly due to upscaling [15,16,18,19,21,23]. The upscaling model, introduced to decrease this uncertainty, shows improvement in the validation methods over the stations with complex backgrounds [18]. However, it is very complex and might introduce new uncertainty to the problem. We, therefore, use the high-resolution independent satellite data, such as Landsat 8, to analyze the site heterogeneity effect and understand the heterogeneity of each site. The analysis results of the brightness temperature at 11 microns (Landsat 8 band 10 is referred to as BT10 in the plot) and NDVI were used as variables in this study. The aggregated value of the Landsat 8 pixels falling within an area circled at the site location with a radius of 1 km is used to represent the parameter at the VIIRS pixel i.e., V a r a r e a . The field view of the in situ instrument is calculated considering the tower height and sensor geometry, and the site-circle response area radius is 35 m for SURFRAD, 30 m for ARM, and 45 m for the BSRN stations, which represents an approximately 90% response of the site instrument. Then, the aggregated value of the Landsat 8 pixel falling within this smaller circle area is used to represent the ground value i.e., V a r p o i n t . Note that neither the V a r a r e a nor the V a r p o i n t would be compared with the satellite LST retrievals. The difference between these two values V a r a r e a V a r p o i n t does not involve a sensor or algorithm difference, but only involves a spatial scope difference, which is referred to as scale difference to quantify the heterogeneity near a ground station. With a long-time series of the above scale differences, we can identify the seasonal and inter-annual variations or system deviations, etc. In addition, the analysis also provides the internal heterogeneity denoted by the standard deviation of variables of the Landsat’s pixels’ set which is composed of all of the pixels within the 1 km area. To minimize the impact of cloud, only cloud-clear measurements are used in this analysis, i.e., all of the Landsat 8 pixels falling within the satellite footprint are cloud-free observations.

4. Results

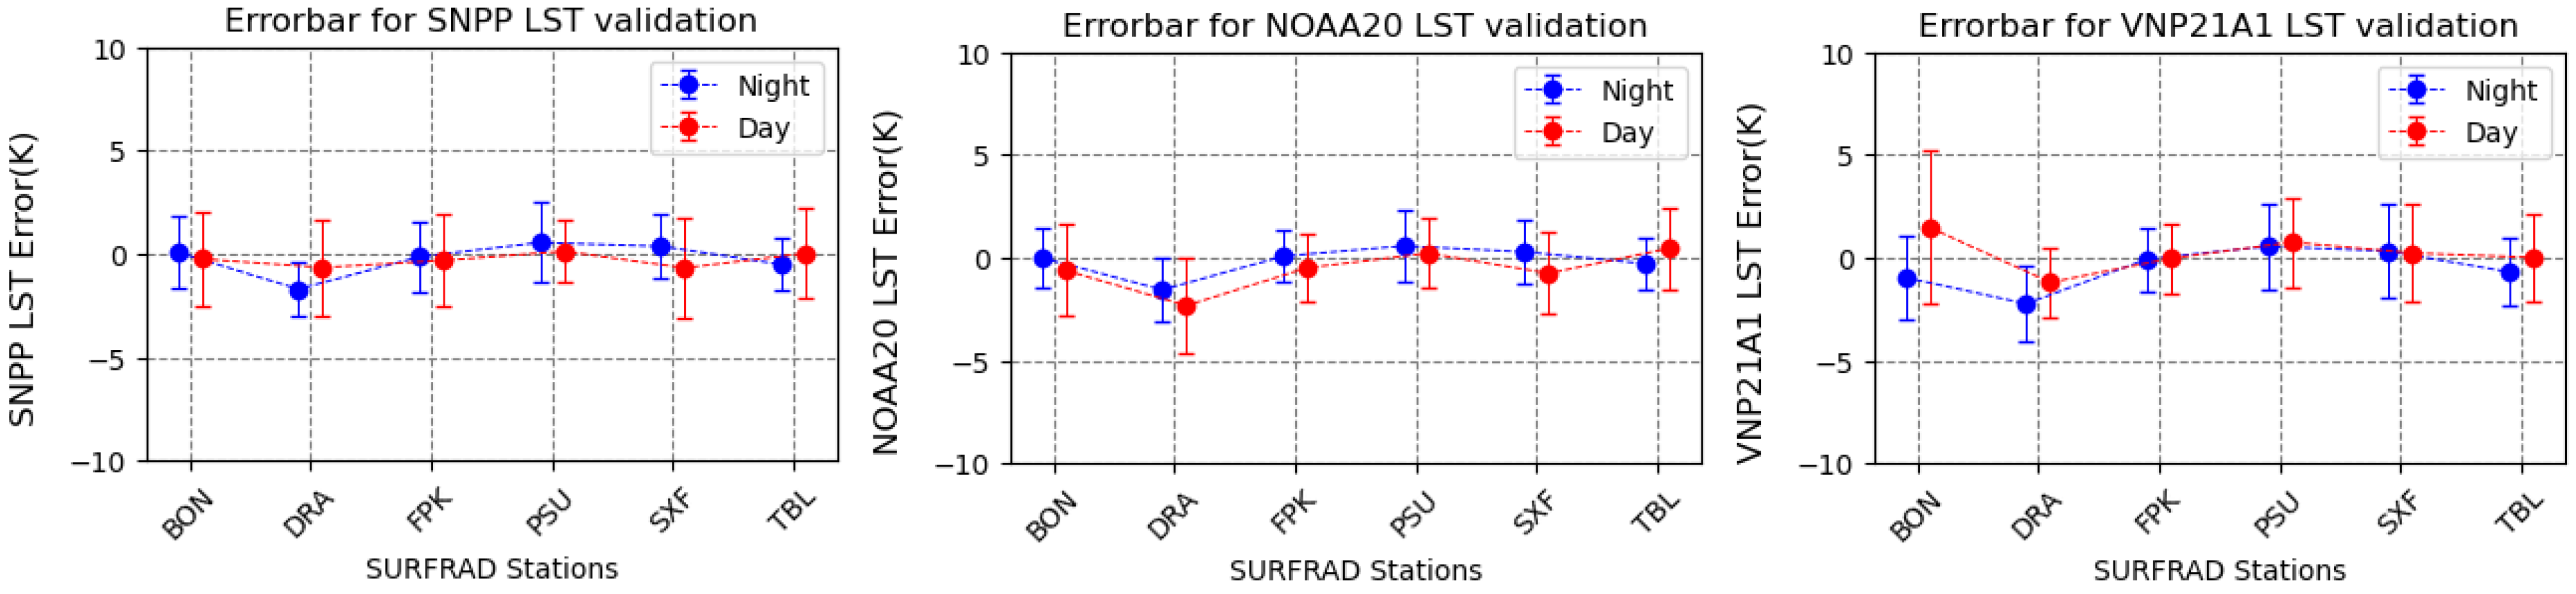
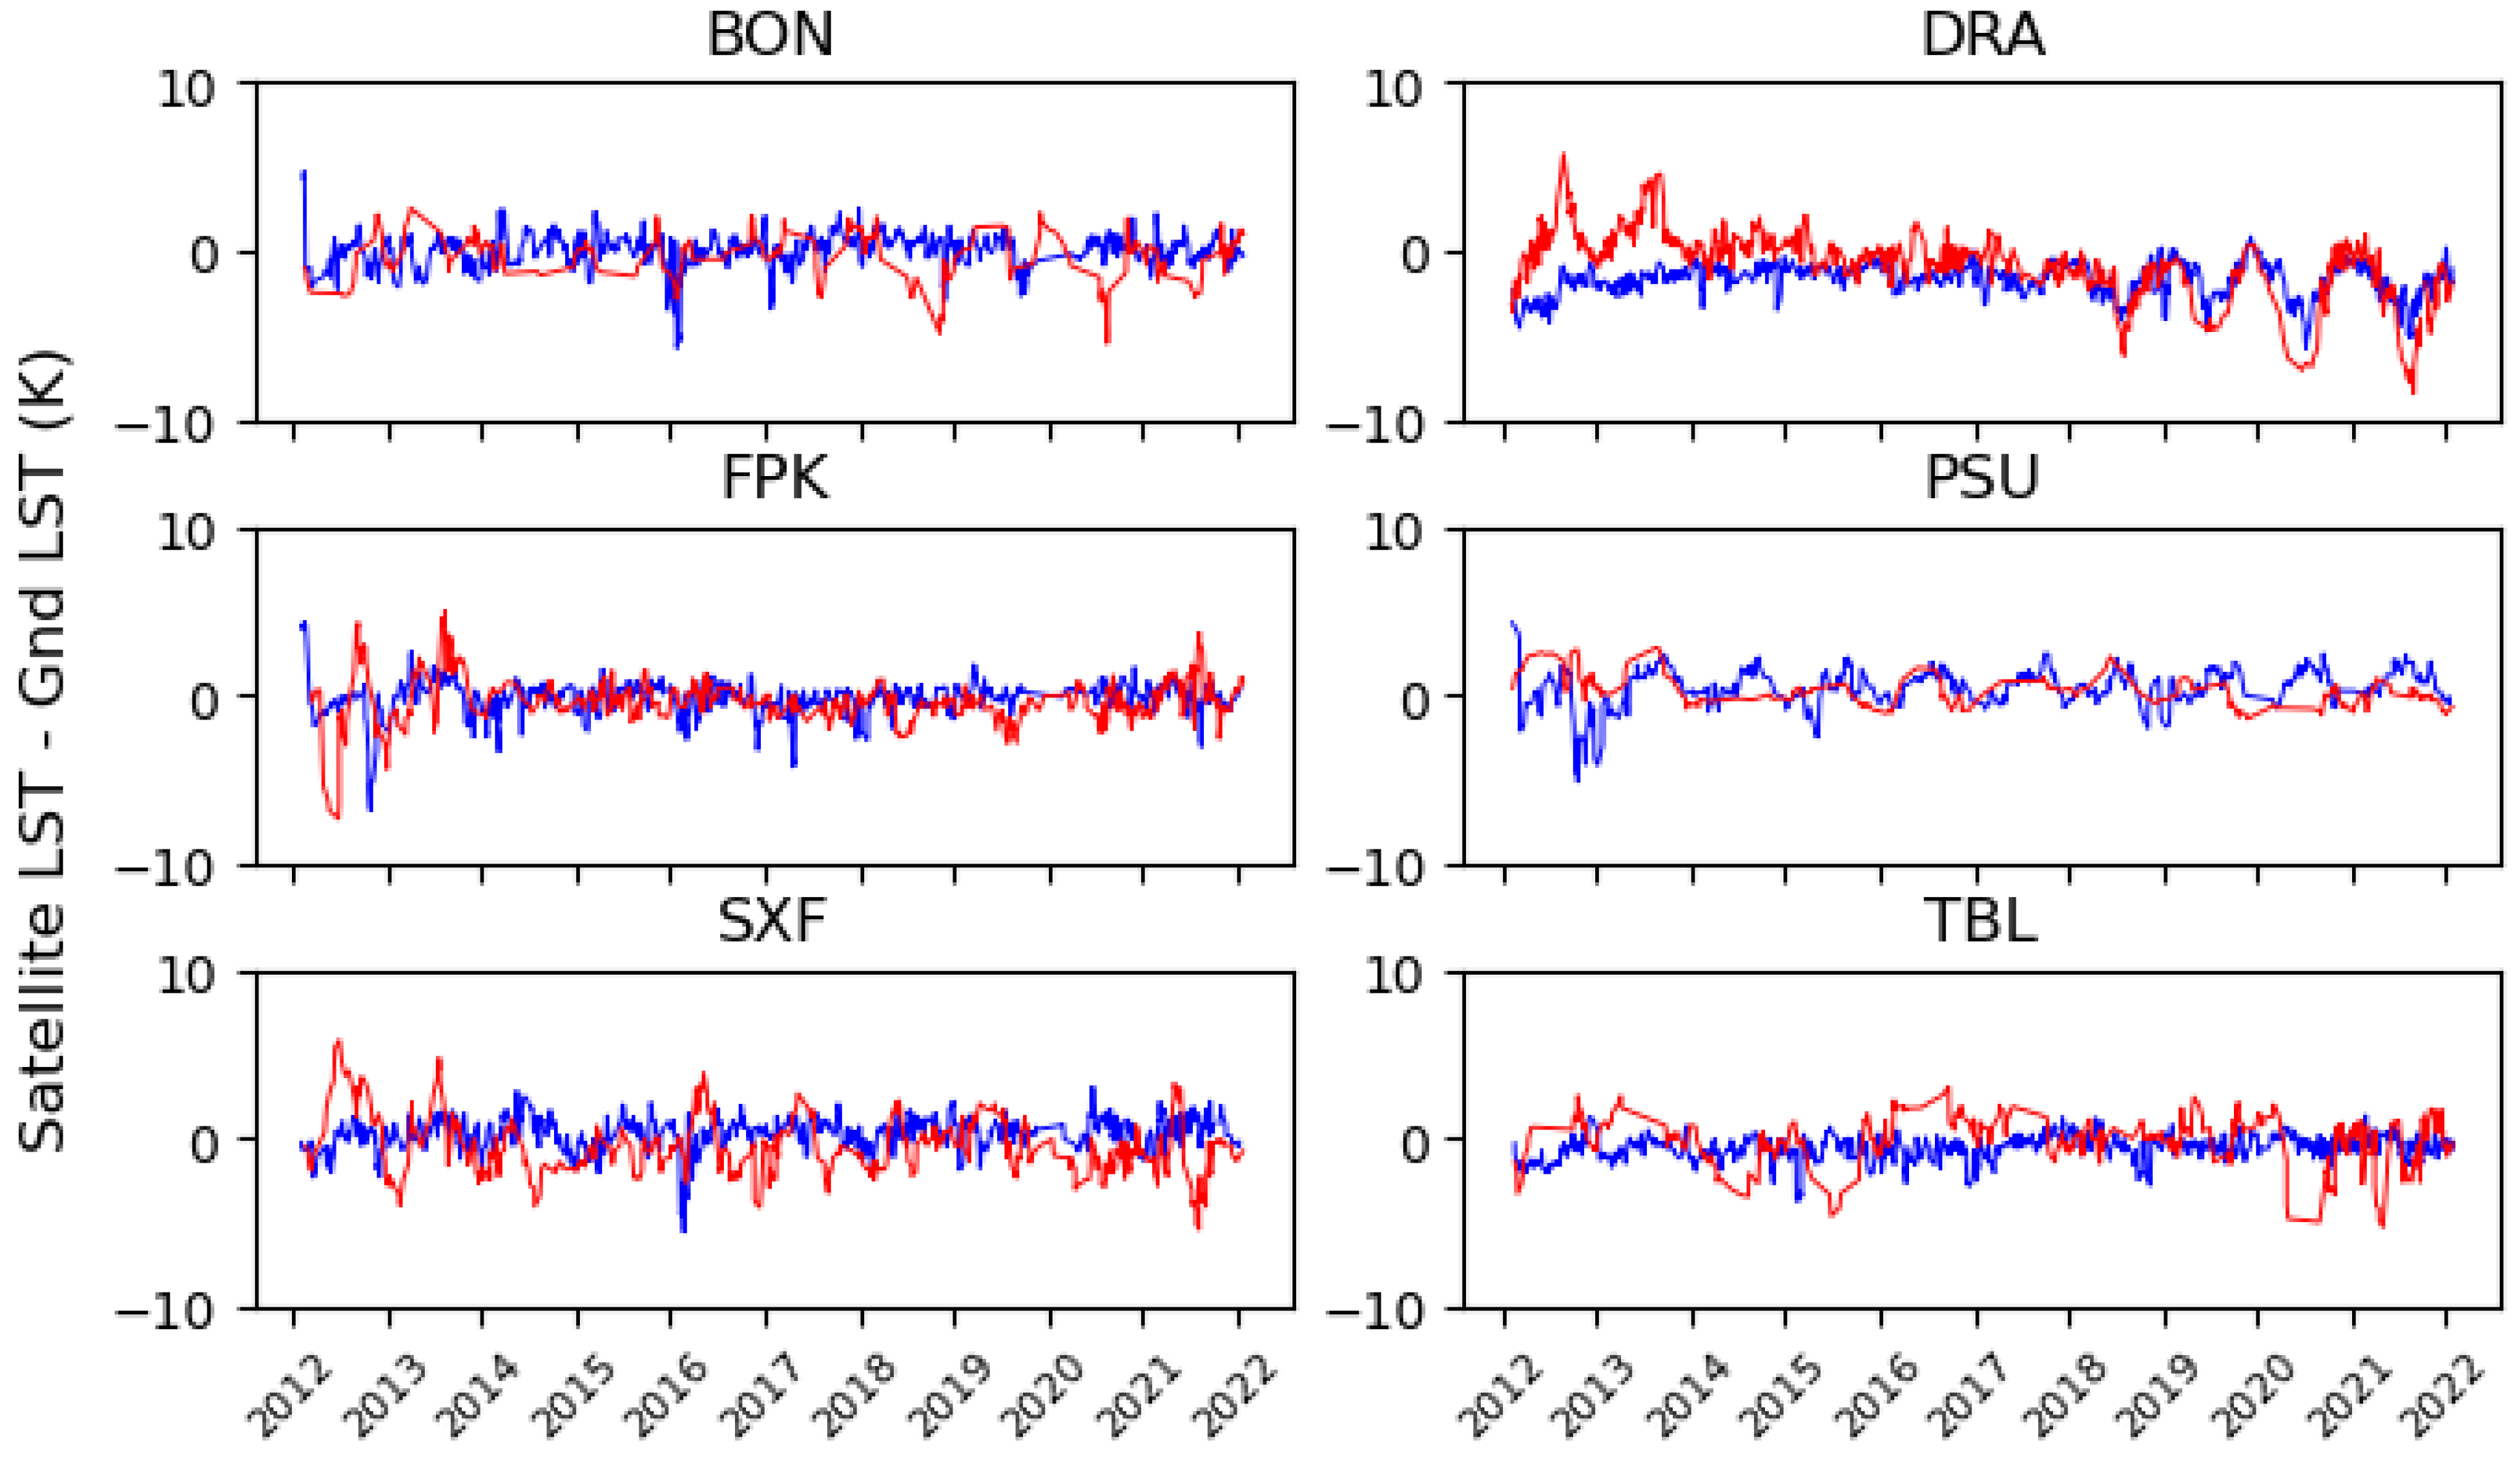
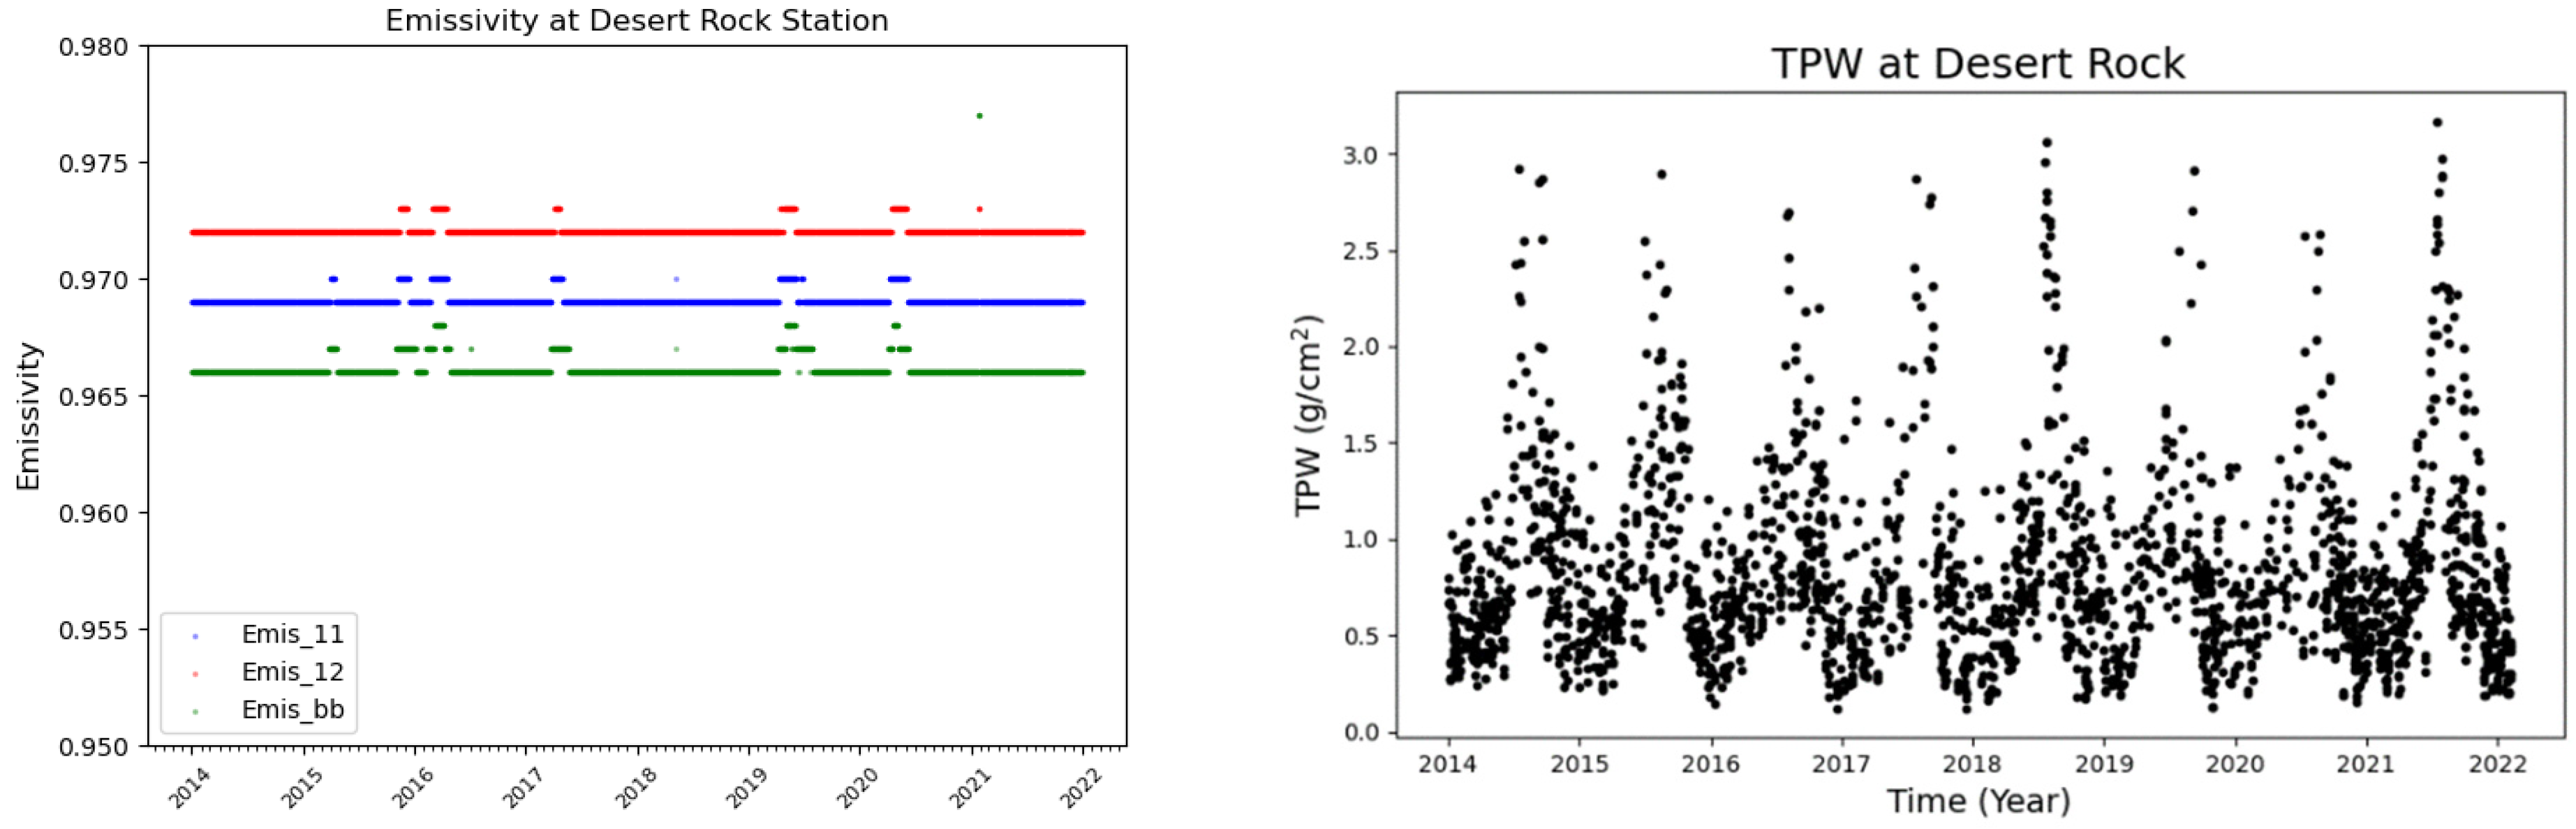
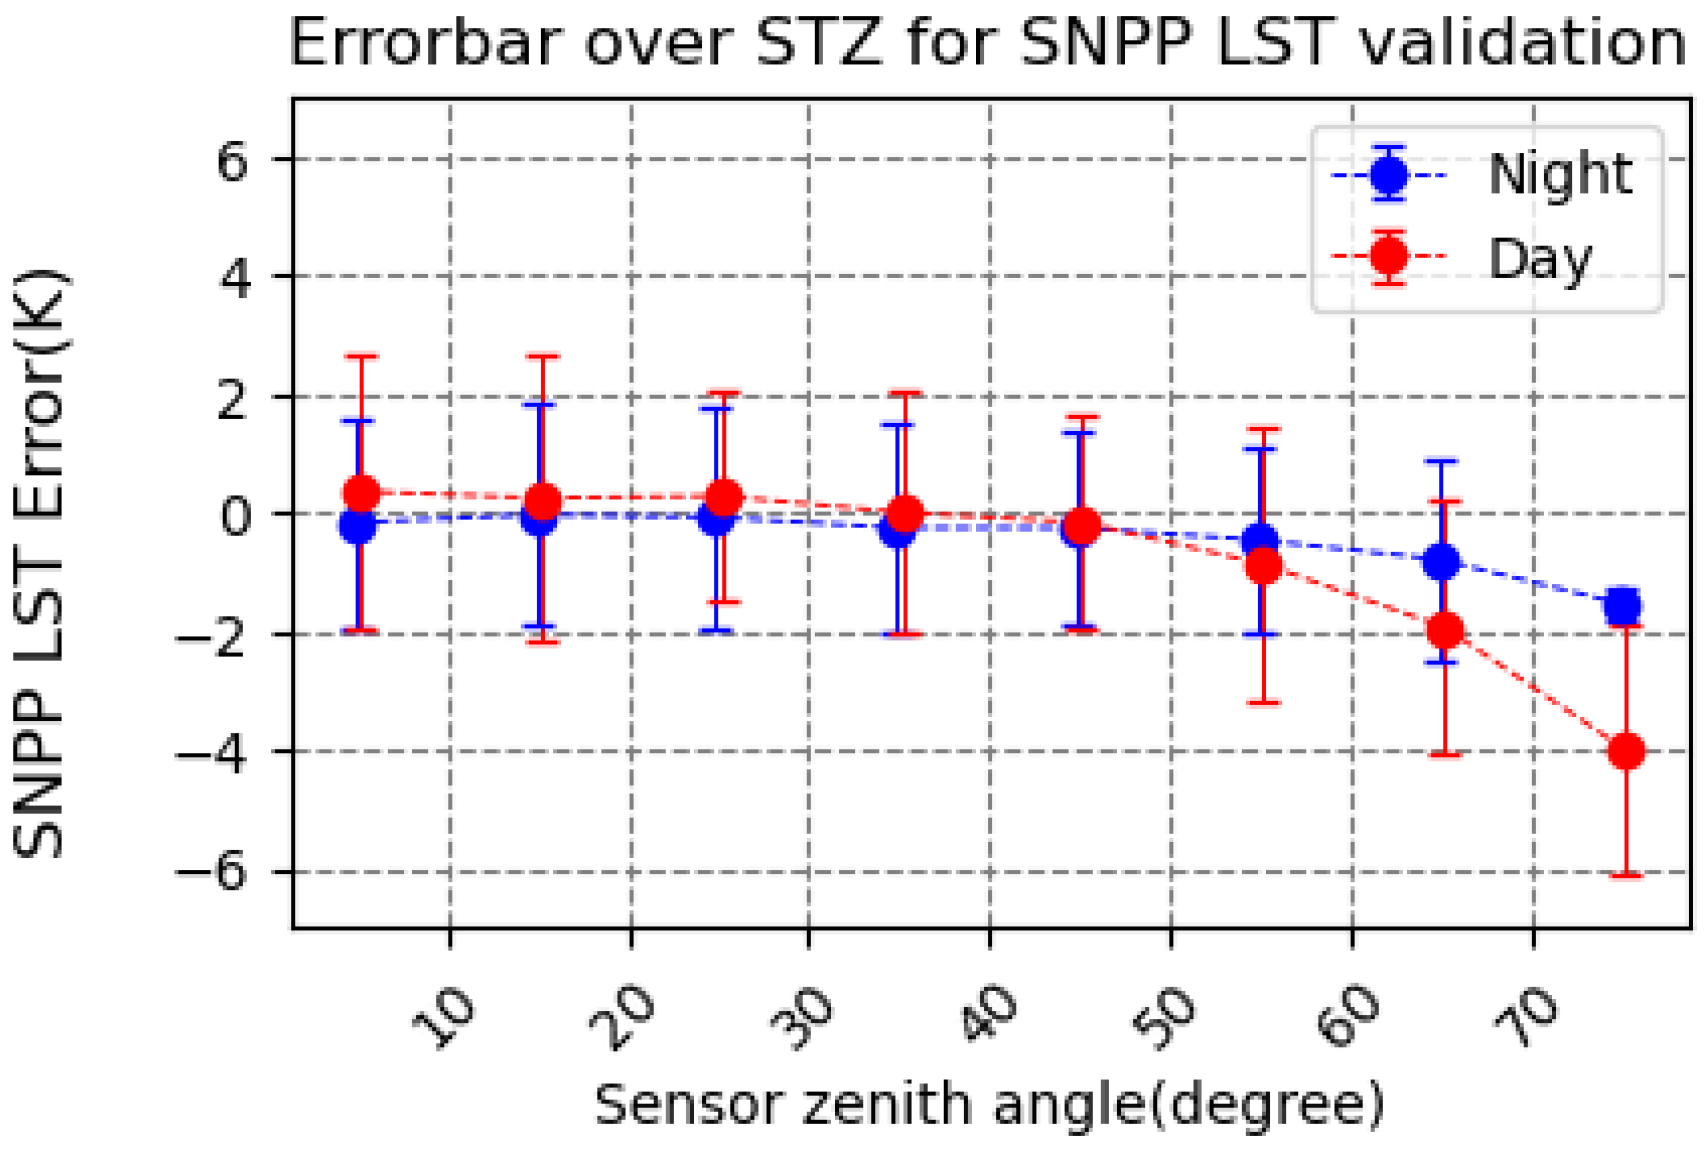
4.1. Validation Results against SURFRAD

A total of 10 years of SNPP VIIRS LST data, from February 2012 to January 2022, were used in the validation against the SURFRAD observations and four years of the NOAA-20 VIIRS LSTs, from January 2018 to December 2021, were used to verify the consistency between the two JPSS series LST products. In addition, two years of the VNP21A1 data, from 2019 and 2020, were used in this study as a reference.
Besides the validation procedures mentioned in Section 3, an additional filter is applied over the site in Bondville, IL, USA. During the late spring and early summer, an obvious daytime discrepancy between the satellite LST and the in situ measurement was reported in previous studies [15,17,18]. The satellite LST is 6 K to 10 K warmer than the ground in situ observations. Li et al. [19] compared the 10 years 16-day average NDVI and the daily emissivity datasets from the MODIS observations and found that this feature might be caused by an anomalous NDVI–emissivity relationship, i.e., emissivity does not change accordingly with the NDVI change during the time period. Guillevic et al. [18] mentioned that the validation results obtained for the stations surrounded by croplands present strong seasonal dependency: the station observations may be closer/deviate more from the temperature of surrounding fields, according to crop maturity. When the crops are short, they will have little shade on the ground. The satellite views the scene at a certain angle, so that the soil surface emission has a great contribution to the warmer satellite LST estimation. The radiometer of the station, however, is always looking down at the nadir measuring the surface upwelling radiance from the vegetation canopy. Similarly, the mismatch with the in situ sensor observation also happens during the harvest season, when no crop cover is on the satellite footprint which also leads to a warmer satellite LST estimation than the ground LST. Considering its great impact on the validation, the mismatch in April, May, and June during the growing season and in September and October during the harvest season were removed from the results over the BON site. The overall comparison shown in Figure 1left, a combined validation of six SURFRAD sites for both daytime (in red color) and nighttime (in blue color) with over 10,000 matchups, indicates a bias of −0.37 K and RMSE of 1.96 K from SNPP, compared to a bias of −0.45 K and −0.33 K, and RMSE of 1.92 K and 2.28 K from NOAA-20 and VNP21A1, respectively. Both the SNPP and NOAA-20 achieve the same correlation of 0.993, which suggests their consistent performance. Among all of the samples from the SNPP, about 52% have absolute errors within 1 K, 29% have absolute errors from 1 K to 2 K, 11% have errors from 2 K to 3 K, and 8% have errors larger than 3 K.
The nighttime comparison result shows a bias of −0.35 K, −0.28 K, and −0.55 K, a RMSE of 1.77 K, 1.63 K, and 2.19 K, the daytime result shows a bias of −0.4 K, −0.79 K, and 0.07 K with a RSME of 2.3 K, 2.37 K, and 2.44 K for SNPP, NOAA-20, and VNP21A1 LST, respectively. The nighttime LST generally outperforms the daytime LST, as expected. Outliers are observed from all three of the LST validation results particularly in the nighttime, where the matchup points are mainly concentrated below the 1:1 line, meaning that the satellite LST is much lower than the ground LST observations. Those are likely due to the undetected cloud contamination, which implies the great impact of the nighttime cloud detection on the LST validation. The cloud screening procedure may fail to detect the cloud for a certain scenario.
It is noticed that the NOAA-20 VIIRS LST presents a larger negative bias in the daytime compared to the SNPP VIIRS LST, while a closer bias in the nighttime, as shown in Figure 1. The site-wide validation results, as shown in Figure 2, display a close performance between the SNPP and NOAA-20 over all of the sites except DRA, with a great deviation of −2.3 K from NOAA-20 compared to −0.8 k from SNPP VIIRS LST in the daytime. Therefore, the time series of LST errors i.e., the difference between the satellite LST and ground LST (ΔLST) at all of the SURFRAD sites, are shown in Figure 3.
The top right plot shows the time series over the DRA site. It indicates a strong seasonal cycle in the difference, which was not so pronounced prior to the year 2017. The discrepancy increased over time, particularly after 2018, when the SNPP and NOAA-20 coexist, which explains the cause of the large negative bias exhibited in the NOAA-20 LST. Li et al. [19] also reported a strong seasonal cycle over the DRA site, with ten years of MODIS data from 2002 to 2012, but to a lesser extent. A large negative bias over the DRA site was observed and the surface emissivity in the MYD11A product is on average 0.98 [19]. A significant negative bias was also reported in the MODIS LST validation at the four barren surface sites attributed to the overestimated emissivity in arid and semi-arid regions [39]. The ASTER Global Emissivity Dataset (GED), a mean emissivity database, is used as the data source for the emissivity climatology over the bare ground in the NOAA LSE product. It is reported that ASTER GED can improve the accuracy of SW LST over a barren surface for MODIS data [40]. Figure 4 indicates the mean emissivity of 0.967 compared to 0.98 for MODIS. Therefore, less impact is expected from the NOAA LSE input on the LST underestimation.
The DRA site is located about 65 miles northwest of Las Vegas. The site consists of mostly open shrubland with some exposed bare soils. The emissivity map within 1 km of the site, using the ASTER GED data, indicates that it is the most homogeneous site in terms of land cover among the seven sites in the SURFRAD network. In order to understand the increasing underestimation, factors relevant to the satellite LST retrieval, such as total water vapor, spectral emissivity, etc., and factors related to the ground in situ LST calculation, such as broadband emissivity, upwelling, and downwelling radiation, etc., have been analyzed. As shown in Figure 4, the total precipitable water (TPW) obtained from the GFS forecast, an important parameter used in the satellite LST retrieval for atmospheric absorption correction, shows no obvious variations across the years from 2012 to 2022. In addition, emissivity, including spectral emissivity as the input for satellite LST calculation and the broadband emissivity for in situ LST calculation, shows insignificant variation over the years. The correlation analysis indicates an ignorable correlation of −0.045 for daytime and −0.007 for nighttime between the ΔLST and mean LSE over the DRA site. Therefore, the issue is not related to the emissivity data set. Figure 5 shows the time series of the ground IR radiation, satellite LST, and in situ LST over the DRA site. The time series of the satellite LST displays a strong seasonal cycle with very minor variation for seasonal high and low temperatures over the years for both daytime and nighttime, while the time series of upwelling and downwelling IR and in situ LST display an upward increasing trend in recent years since 2018. The largest negative LST error occurs in the summer when the in situ LST reaches its seasonal peak. The time series of the monthly average of metrological parameters over the DRA site (obtained at https://gml.noaa.gov/dv/iadv/graph.php?code=DRA&program=g-rad&type=gradts, accessed on 1 May 2022) reveals a pronounced increase in both downwelling and upwelling infrared radiation since 2018, particularly in the summer months from June to August but the air temperature shows no obvious variation across the years, with an exception in 2018 with a minor increase and in 2019 with a colder summer temperature. Therefore, the increasing ΔLST is mainly related to the rising in situ measurements, such as an increased measurement uncertainty, microclimate change around the site due to site management, etc. In addition, the surface topography near the DRA site is complicated. In a 30 km by 30 km area centered at the Desert Rock site, the surface elevation changes from 731 m to 2228 m. Such a large elevation variability has a significant impact on the homogeneity of the LST and leads to a high uncertainty of LST validation results [20].
It is also interesting to note the strong seasonal variation over the PSU and SXF stations. The LST error at the PSU site is generally between −0.5 to 2.0 K range, with a warm bias in the spring and early summer and a cold bias in the late summer in the daytime, while there is a warm bias in the whole summer in the nighttime. The PSU station is located in an agriculture field and the land cover around the PSU site is quite diverse, with a mixture of forests and rotating cropland. The place where the equipment is placed is covered with grass and the grass is regularly mowed. The seasonal feature might be related to the crop growth cycle and mowing routine. The LST error at the SXF site only shows a seasonal variation for daytime observations, with an obvious cold bias in summer and a warm bias in spring. There is no clear seasonal trend observed in the FPK site, which shows the smallest seasonal variation among the six sites. This regularity of an error pattern might be related to other factors that show seasonal features. In this study, the correlation test is performed between ΔLST and multiple impact factors including TPW, sensor zenith angle, mean spectral LSE, i.e., (ε11 + ε12)/2.0, and LSE difference, i.e., ε11−ε12. The result is shown in Table 4. It generally indicates a strong relationship between the sensor zenith angle and daytime ΔLST over all of the sites except the BON station which has a small correlation of 0.09 compared to other stations with a correlation coefficient from 0.25 to 0.58, while the correlation is weak in the nighttime over most of the sites. Li et al. [19] conducted an analysis on the impact factors for daytime MODIS LST errors, in which multiple factors such as sensor zenith angle, cloud coverage, emissivity difference, NDVI, relative humidity, etc. were analyzed, and found that the sensor zenith angle presents the highest correlation at all of the sites except BON. Figure 6 shows how the ΔLST changes with the sensor zenith angle for both daytime (in red color) and nighttime (in blue color). The LST error is close to 0 at nadir and it remains nearly constant till the sensor zenith angle reaches 40 degrees for both daytime and nighttime. Beyond 40 degrees, the LST error begins to deviate for daytime and nighttime. During the daytime, the ΔLST decreases at a relatively fast rate and gradually becomes negative and reaches the lowest negative values at the observation edges. During the nighttime, however, the ΔLST drops and gradually becomes negative at a slower rate and to a lesser extent. The LST validation is of a higher uncertainty under a large angle, which on the one hand is due to the satellite LST product itself, the uncertainty of large angles LST is greatly increased compared to the nadir view during the regression process, and on the other hand, the large angle may introduce more mismatches between the satellite view and ground view.
A relatively strong correlation is also found between TPW and the daytime ΔLST, with the strongest impact of 0.55 over the BON site and the least impact over the PSU site. The emissivity difference overall shows a fairly weak correlation with the ΔLST for both daytime and nighttime, except over the PSU site where the correlation of 0.32 is obtained in the nighttime while the correlations of all of the other sites are below 0.2. The mean emissivity shows a high correlation with daytime LST error over the BON, SXF, and TBL stations, while a weak correlation is found with nighttime LST error.

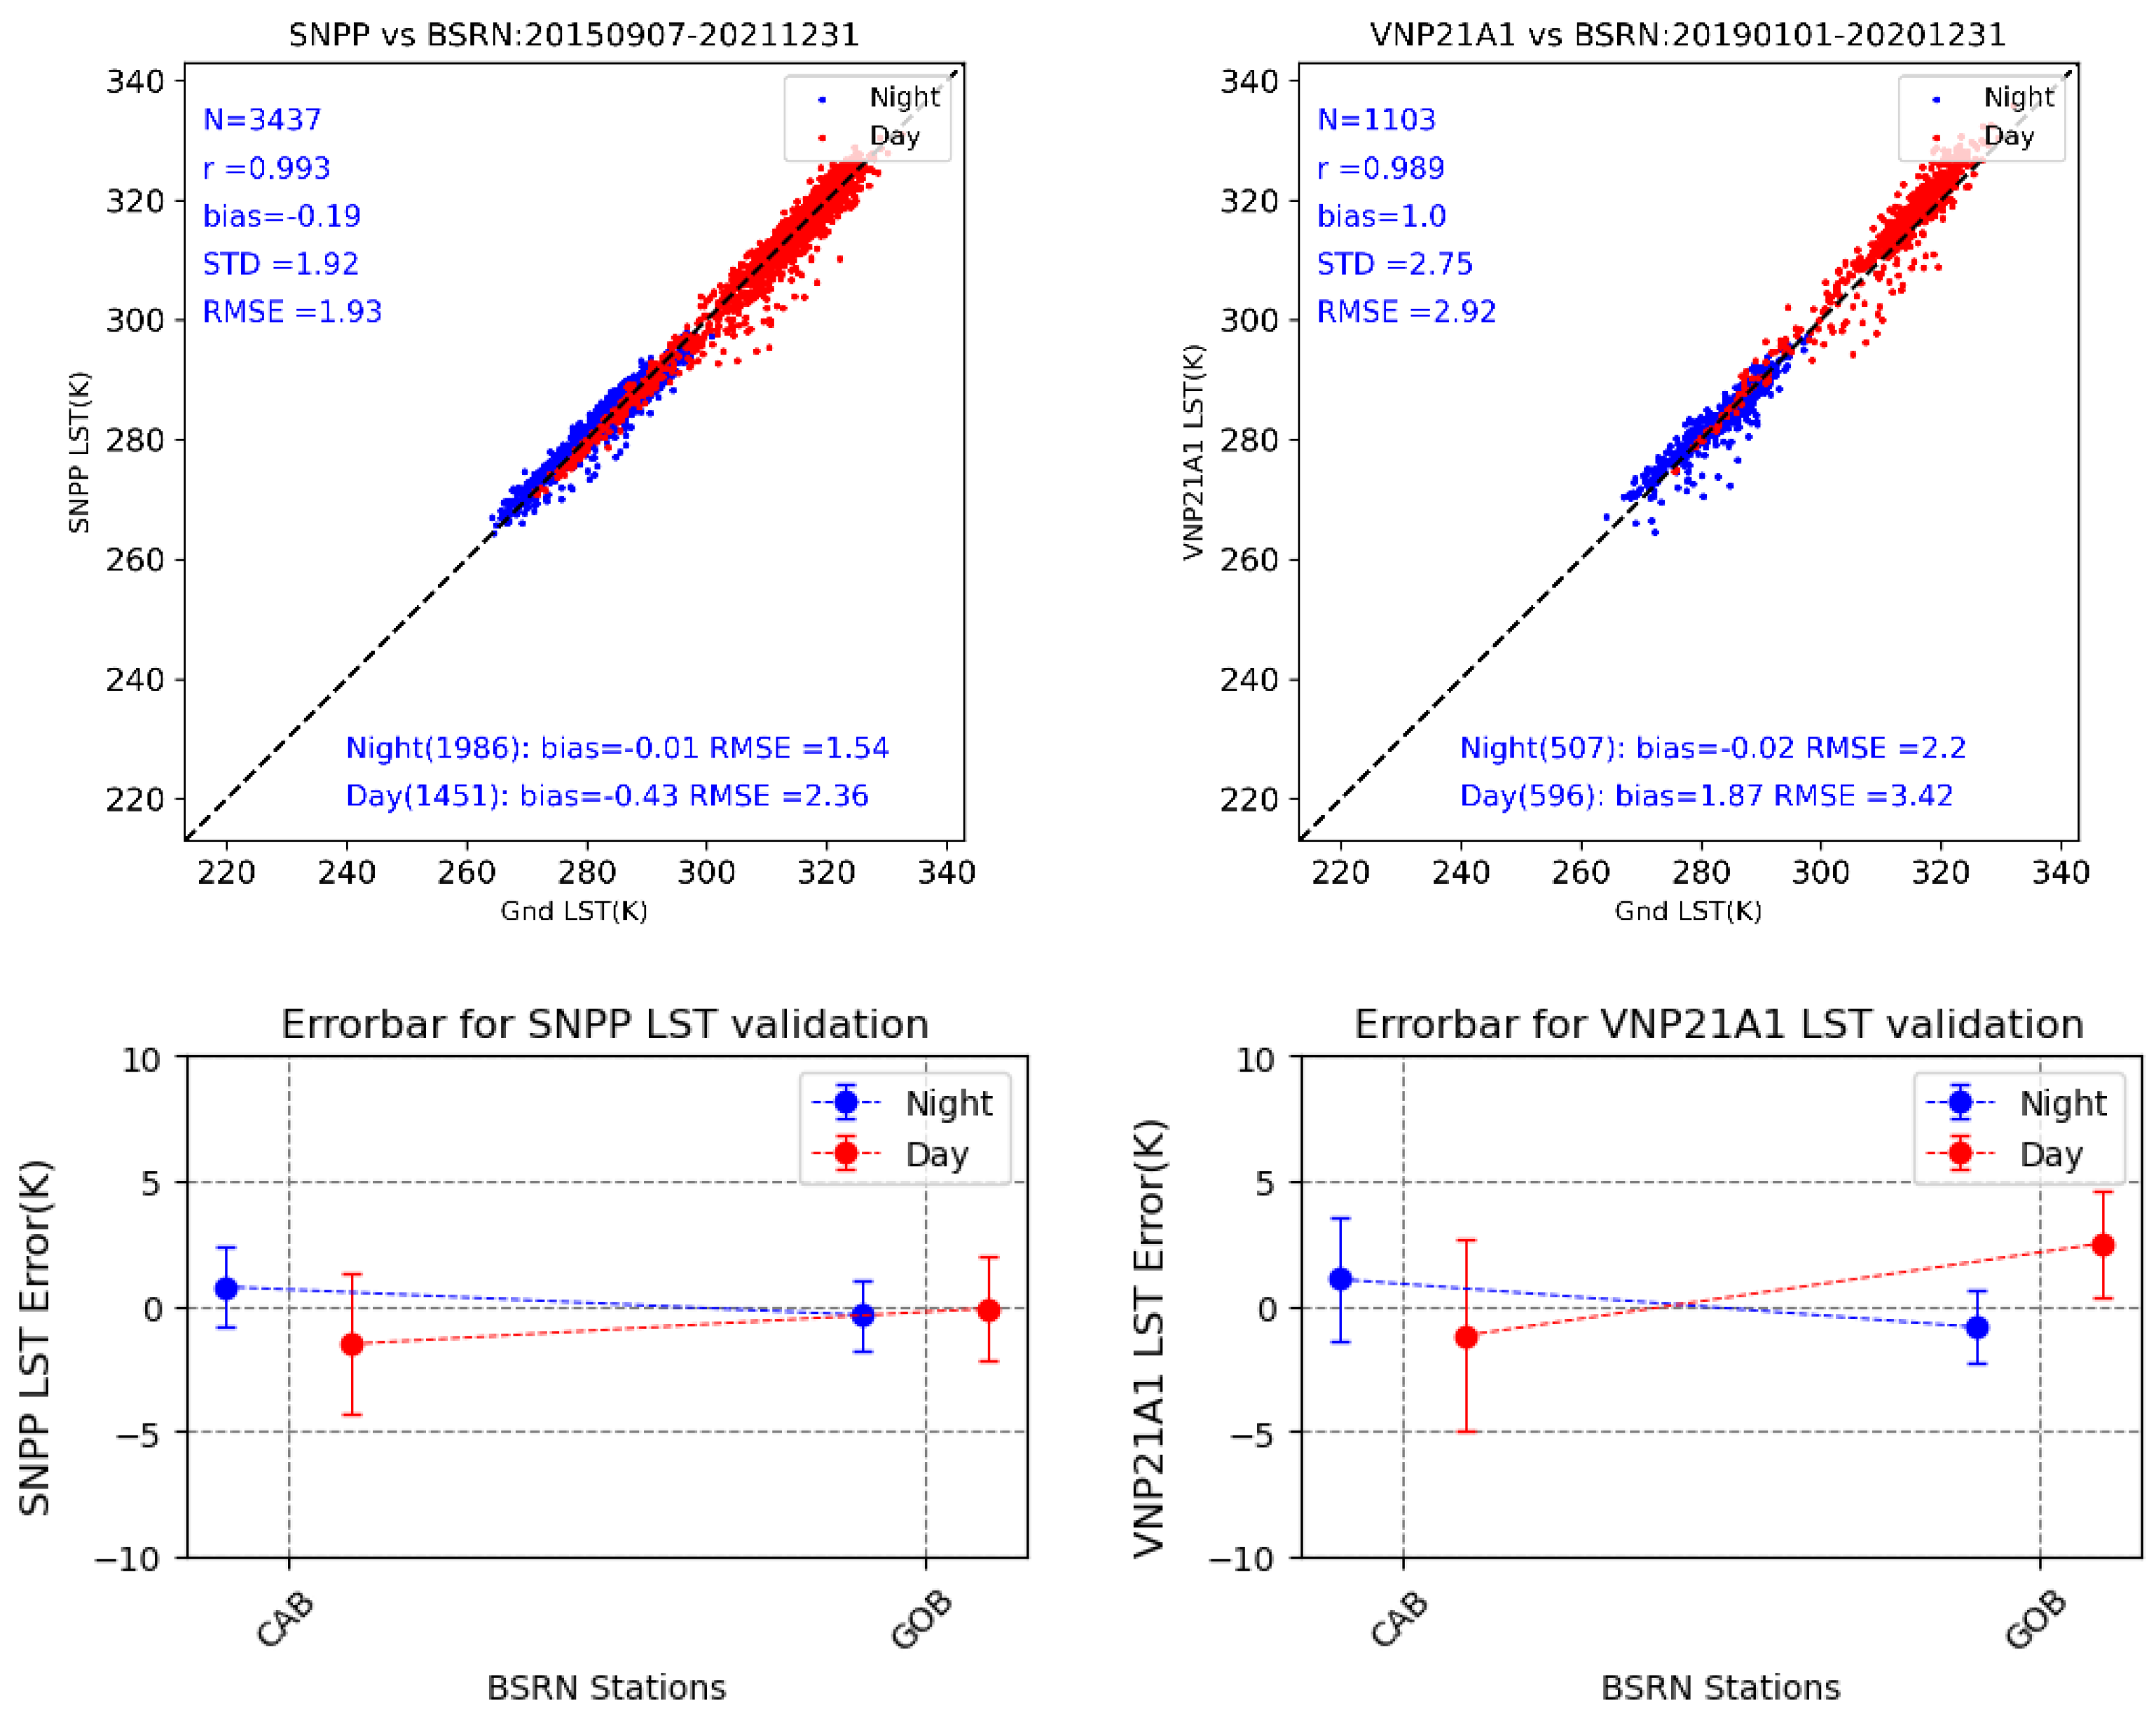
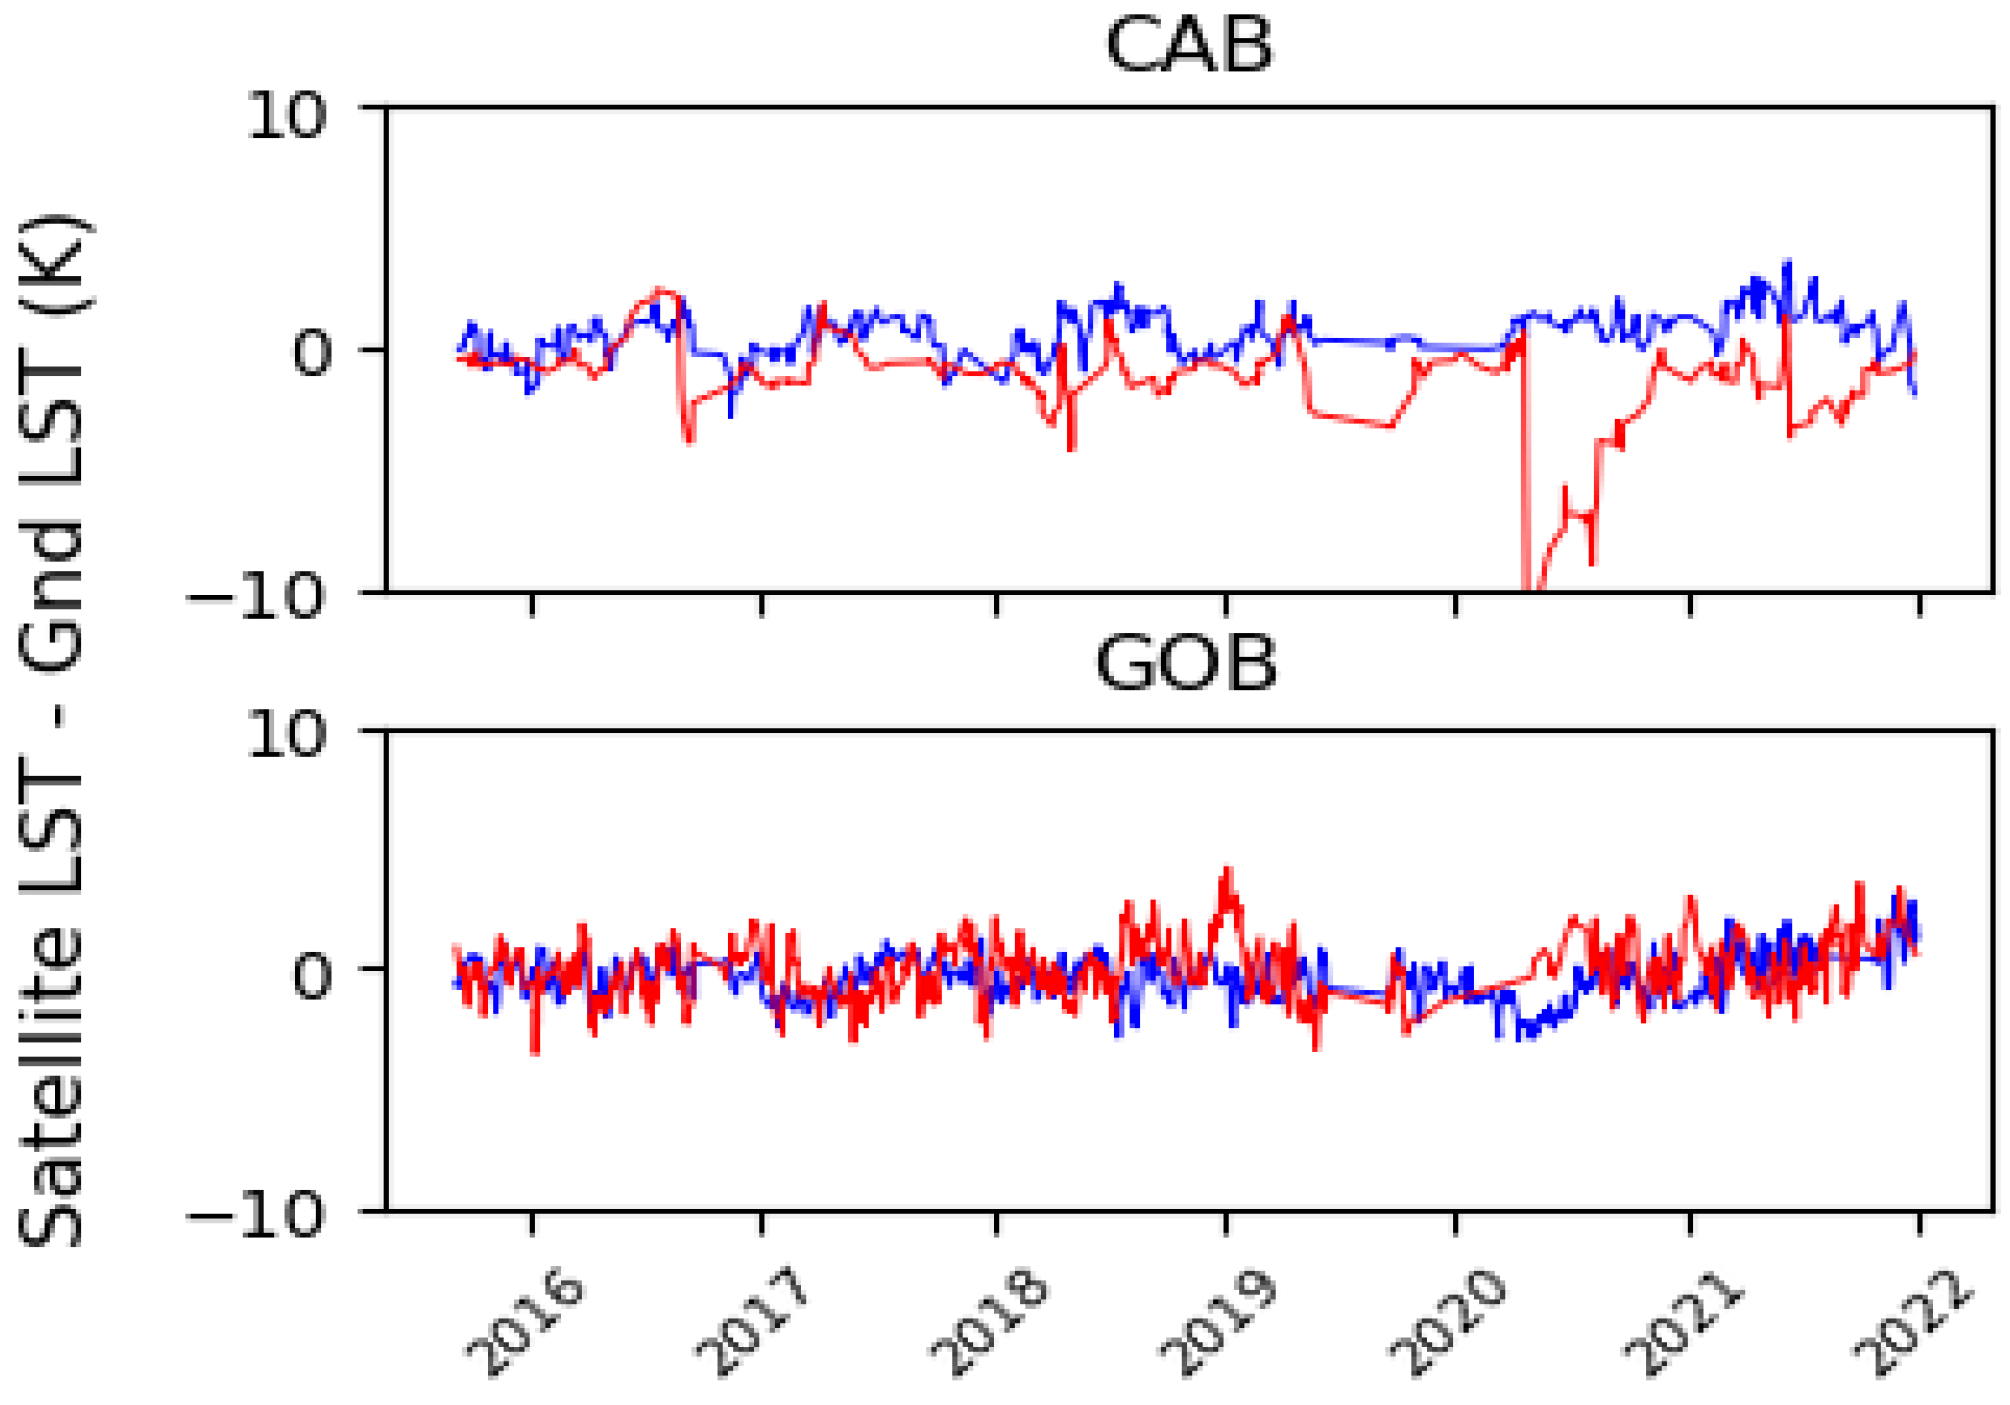
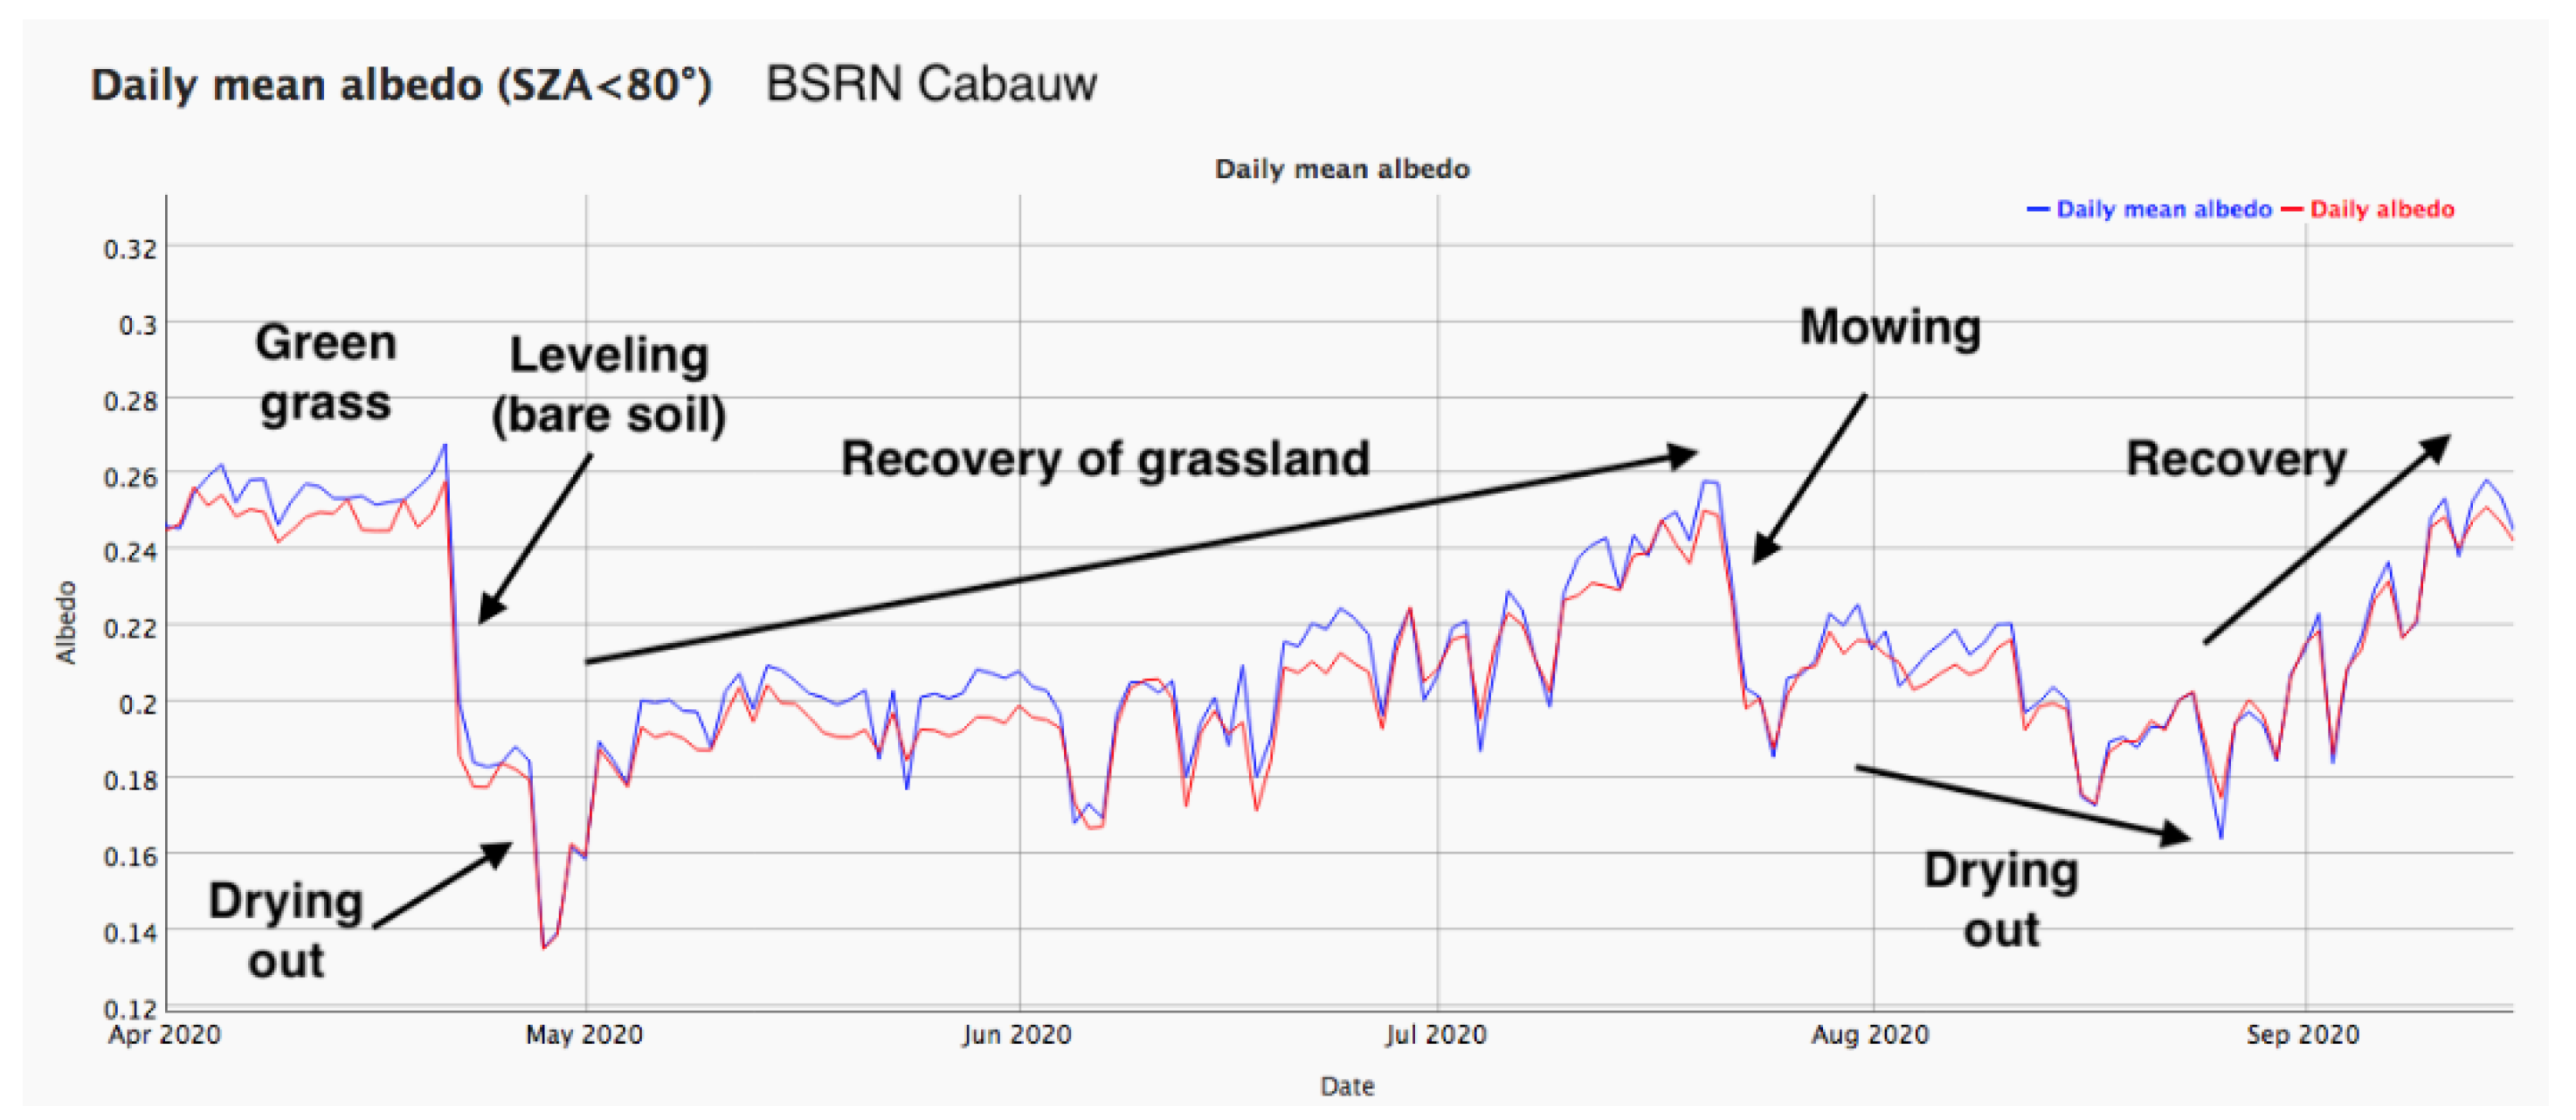
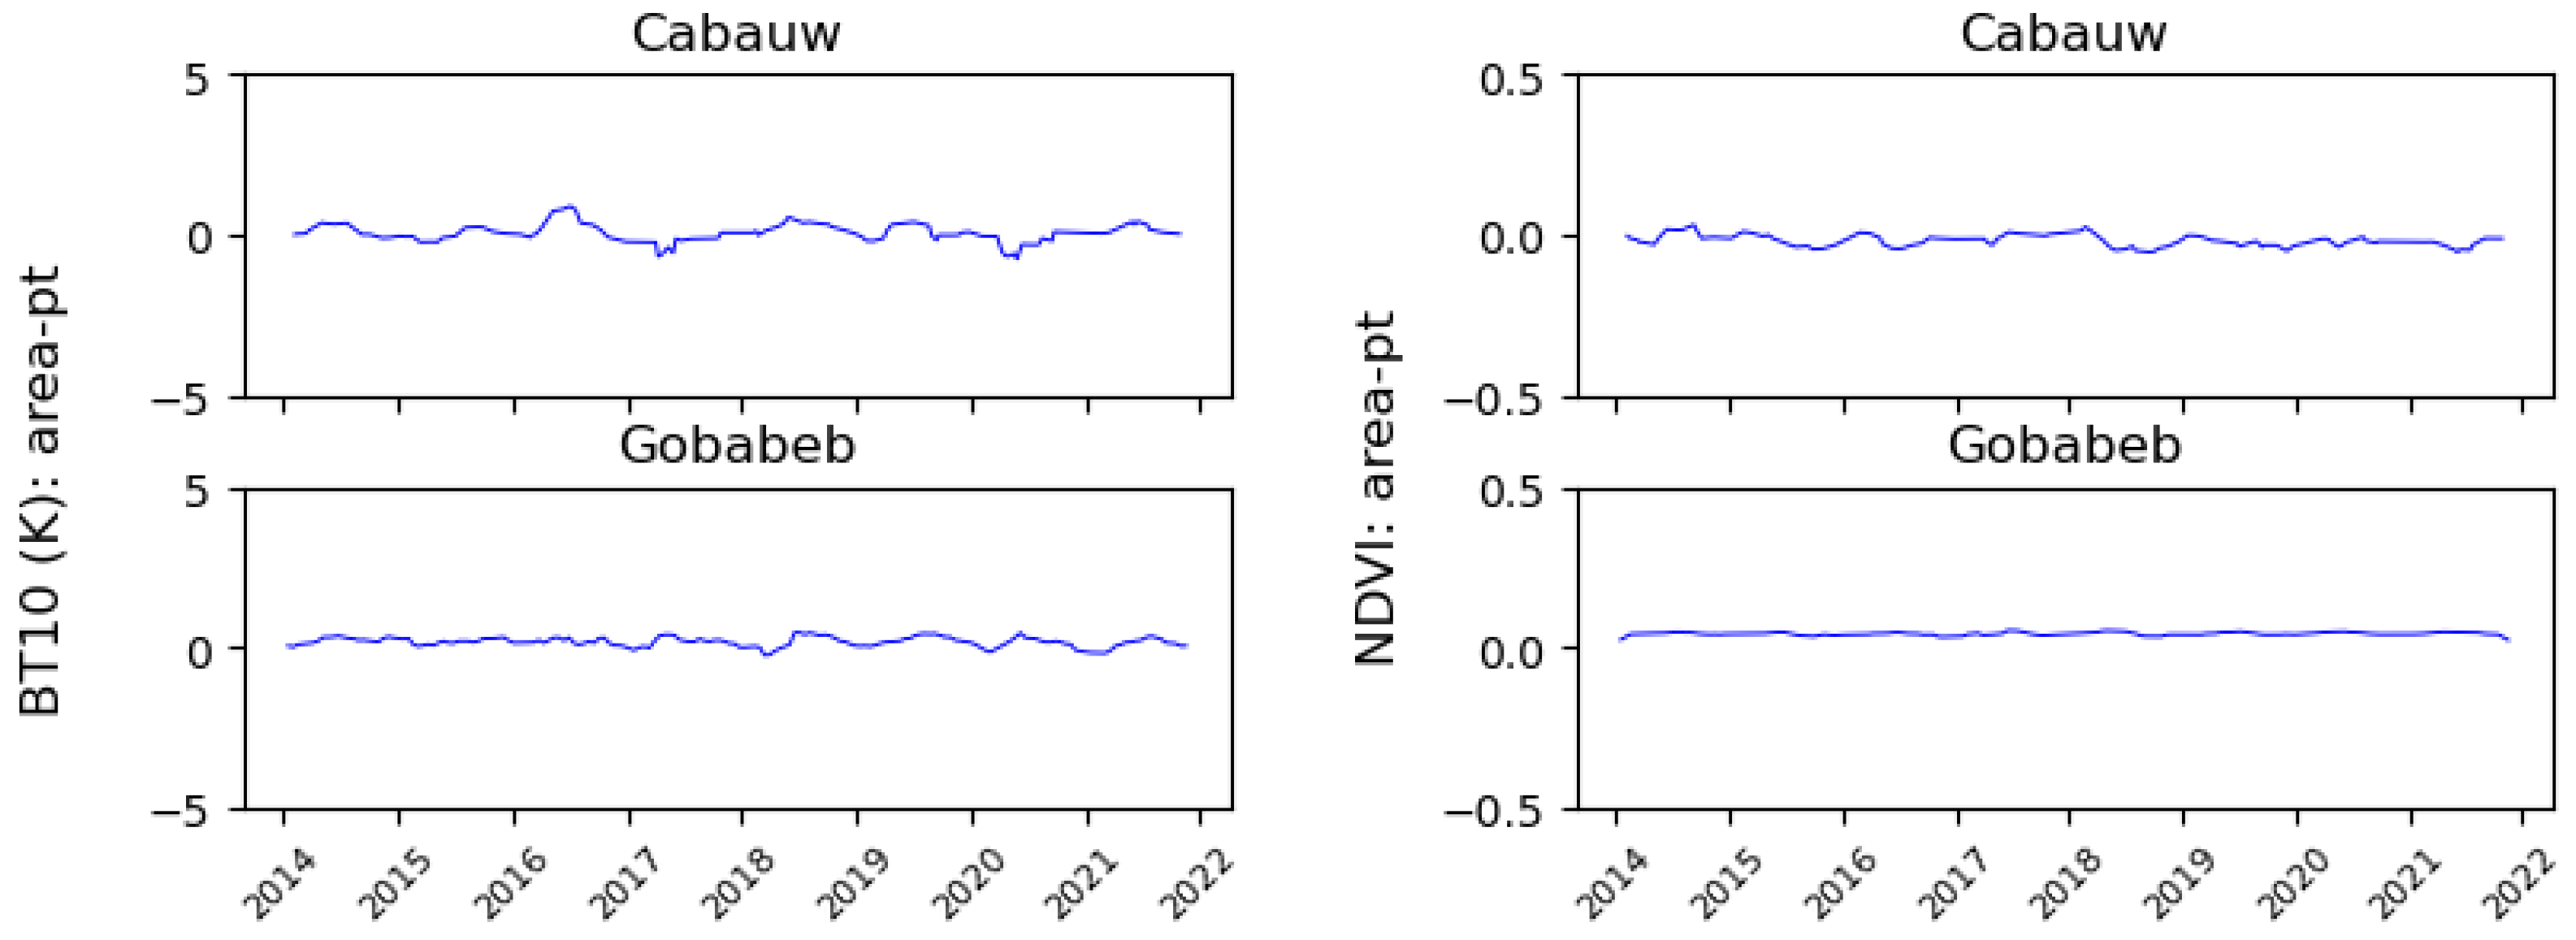
4.2. Validation Results against BSRN

Figure 7 shows the validation results against BSRN. Some outliers can be seen mostly with station LST higher than satellite LST. The validation over the CAB site yields zero overall bias and a RMSE of 2.36 K with a deviation of about −1.5 K and 0.8 K between satellite LST and ground LST for the daytime and nighttime measurements, respectively. Validation results over the GOB site indicate an overall bias of −0.25 K and RMSE of 1.74 K with a deviation of about −0.1 K and −0.4 K between the satellite LST and ground LST for daytime and nighttime measurements, respectively. To understand the fairly large cold bias over the CAB site, the time series of ΔLST were analyzed, as shown in Figure 8. An abrupt decline occurred in April 2020 before returning to a normal curve by the end of 2020.
The satellite data, including the LST and input variables, were firstly investigated but no anomaly was found during the time period. Therefore, the direction of the investigation was shifted to the ground LST and a discussion about the identified issue was made with the data provider. It was confirmed that there was a major site management activity that occurred in April 2020 which led to a surface cover change of the in situ ground site. Figure 9 demonstrates the mean albedo variations that resulted from the activity. The site was covered by green grass in early April 2020 and then leveling of the site led to it being by bare soil which dried out till the end of April, during this time period the mismatch between the satellite LST and ground LST reached a peak of up to 10 K, as shown in Figure 9. This was followed by the recovery of the grassland, during which the discrepancy was reduced accordingly. Note that the routine mowing activity from late July caused a small albedo drop compared to that in April, followed by a drying out and recovery process. The mowing and recovery might explain the small fluctuations of the LST error.
The ΔLST also shows a seasonal variation over the CAB site where a cold bias displays in the daytime while a warm bias displays in the nighttime in the summer. The LST error over the GOB site does not show an obvious seasonal signal, except for a minor bias variation to a very small extent, i.e., a warm bias in January to March and then a change to a slight cold bias from April to July.

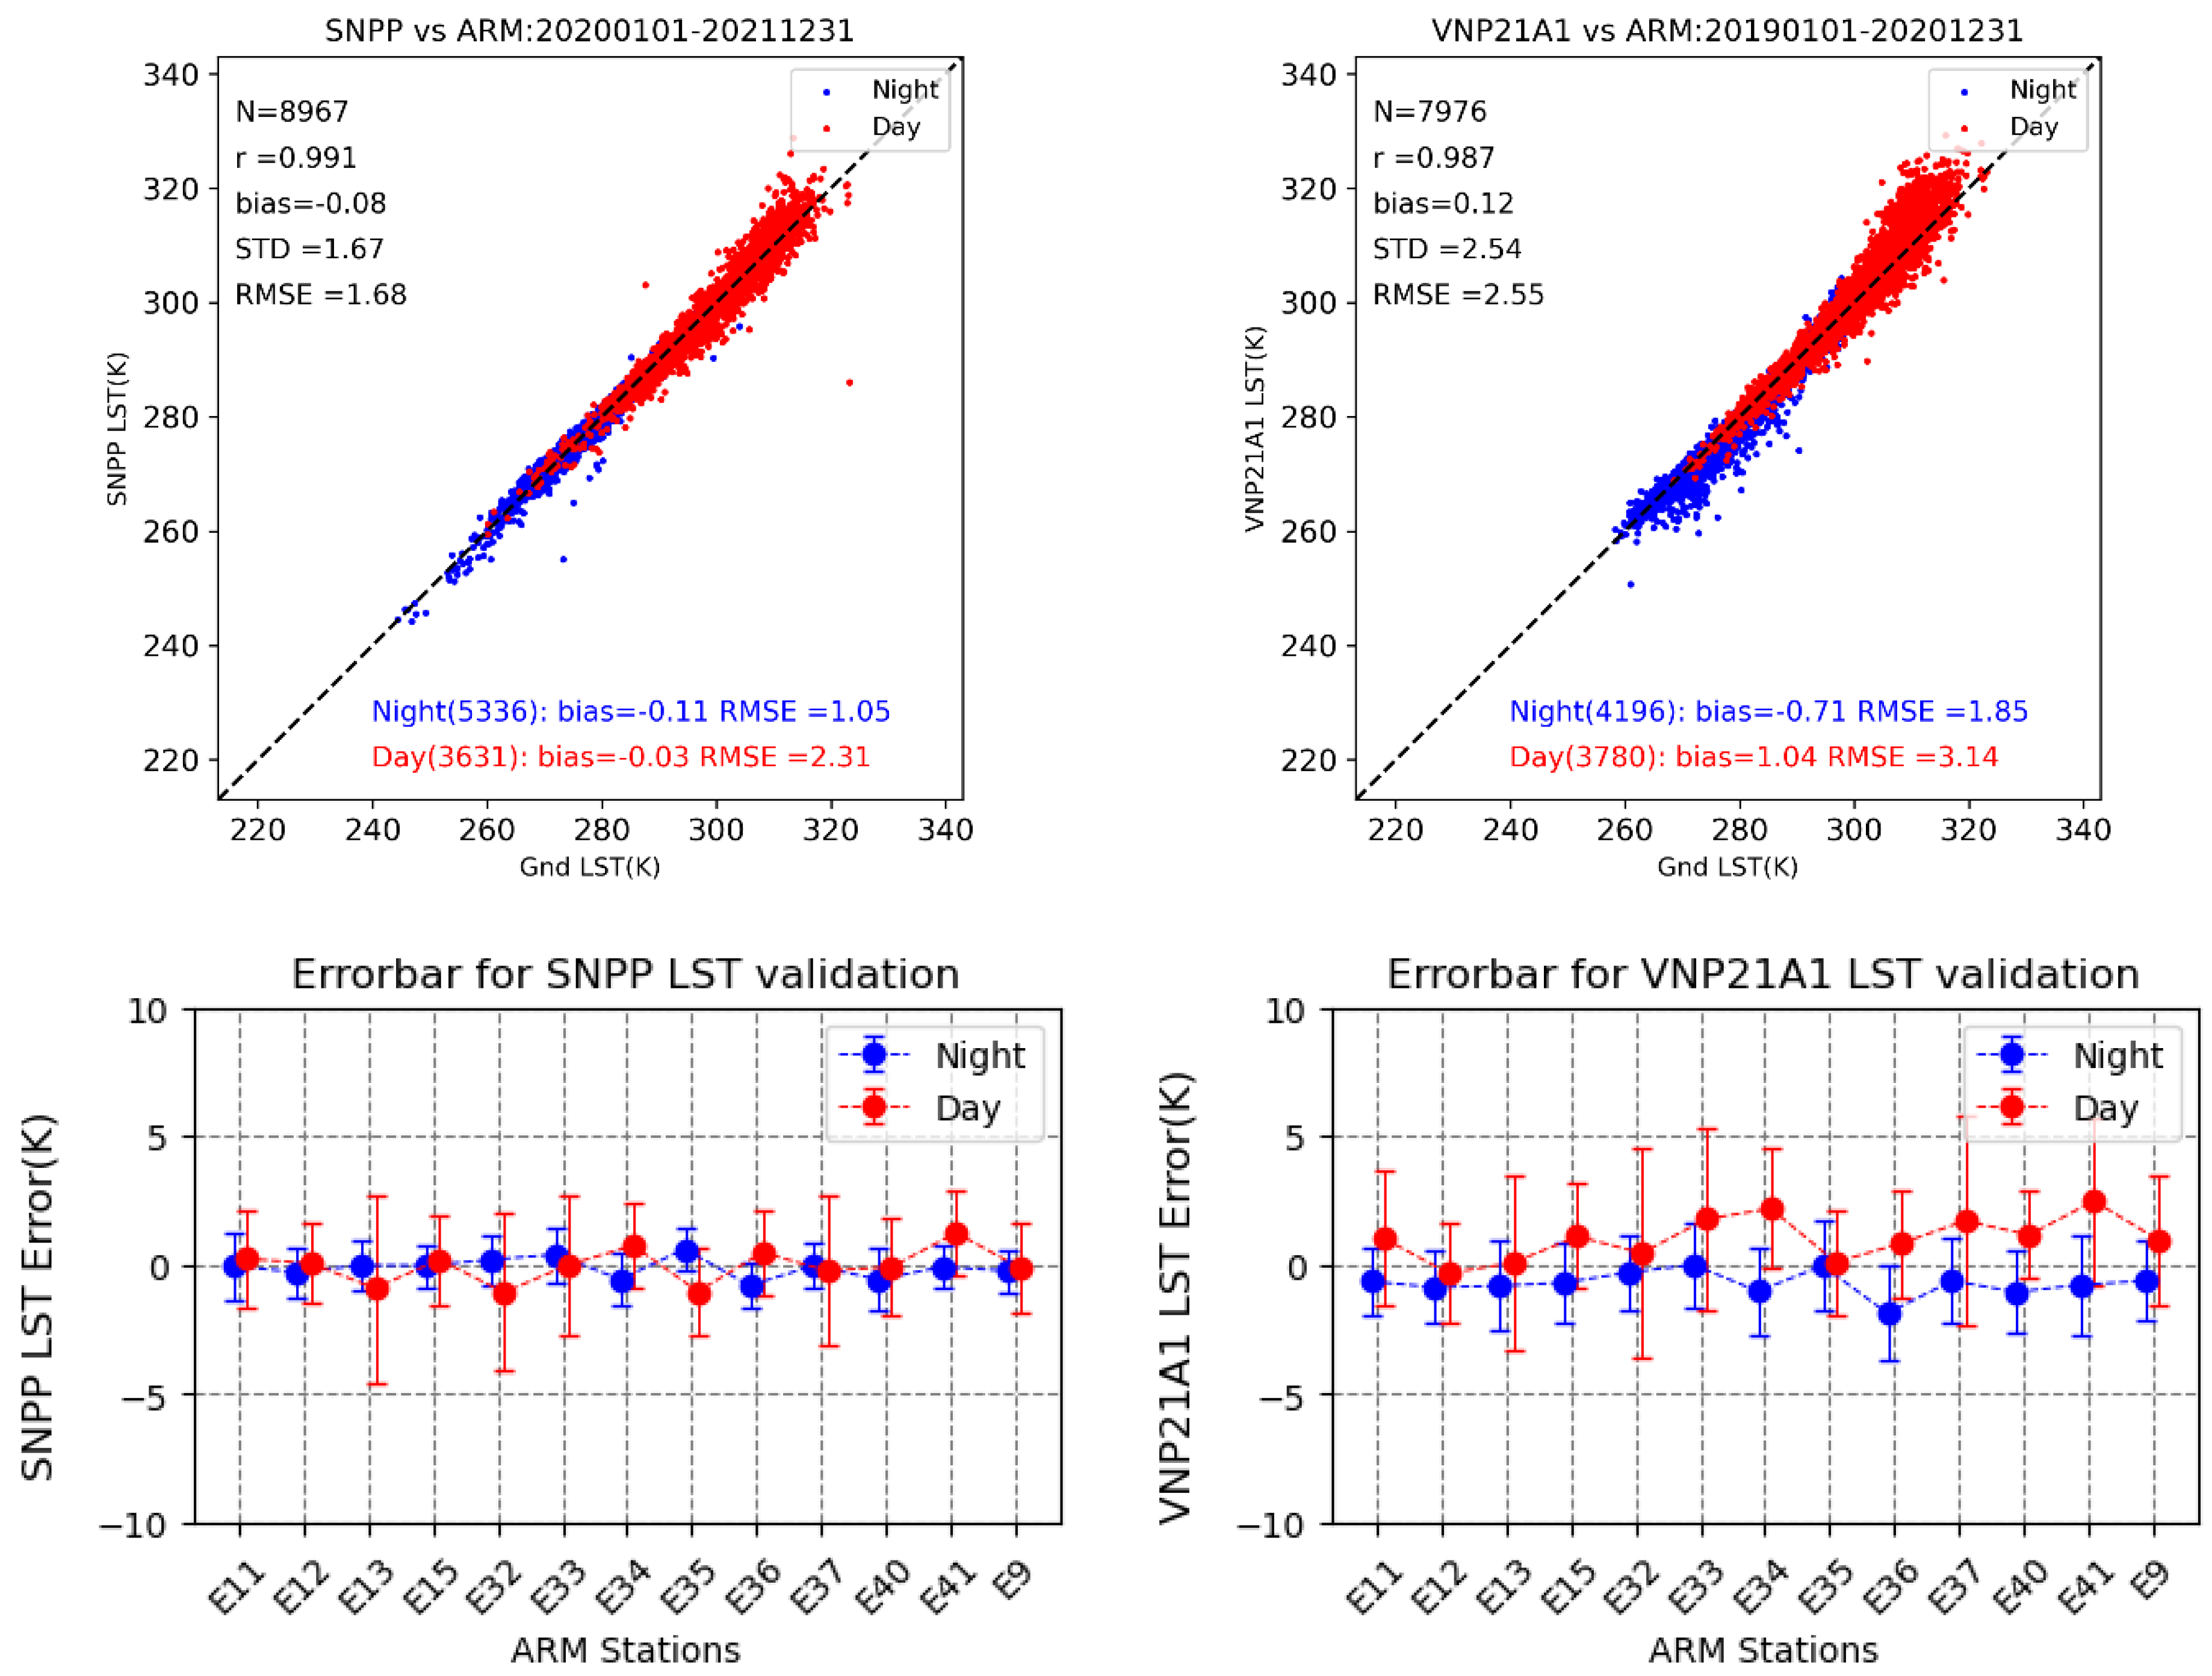
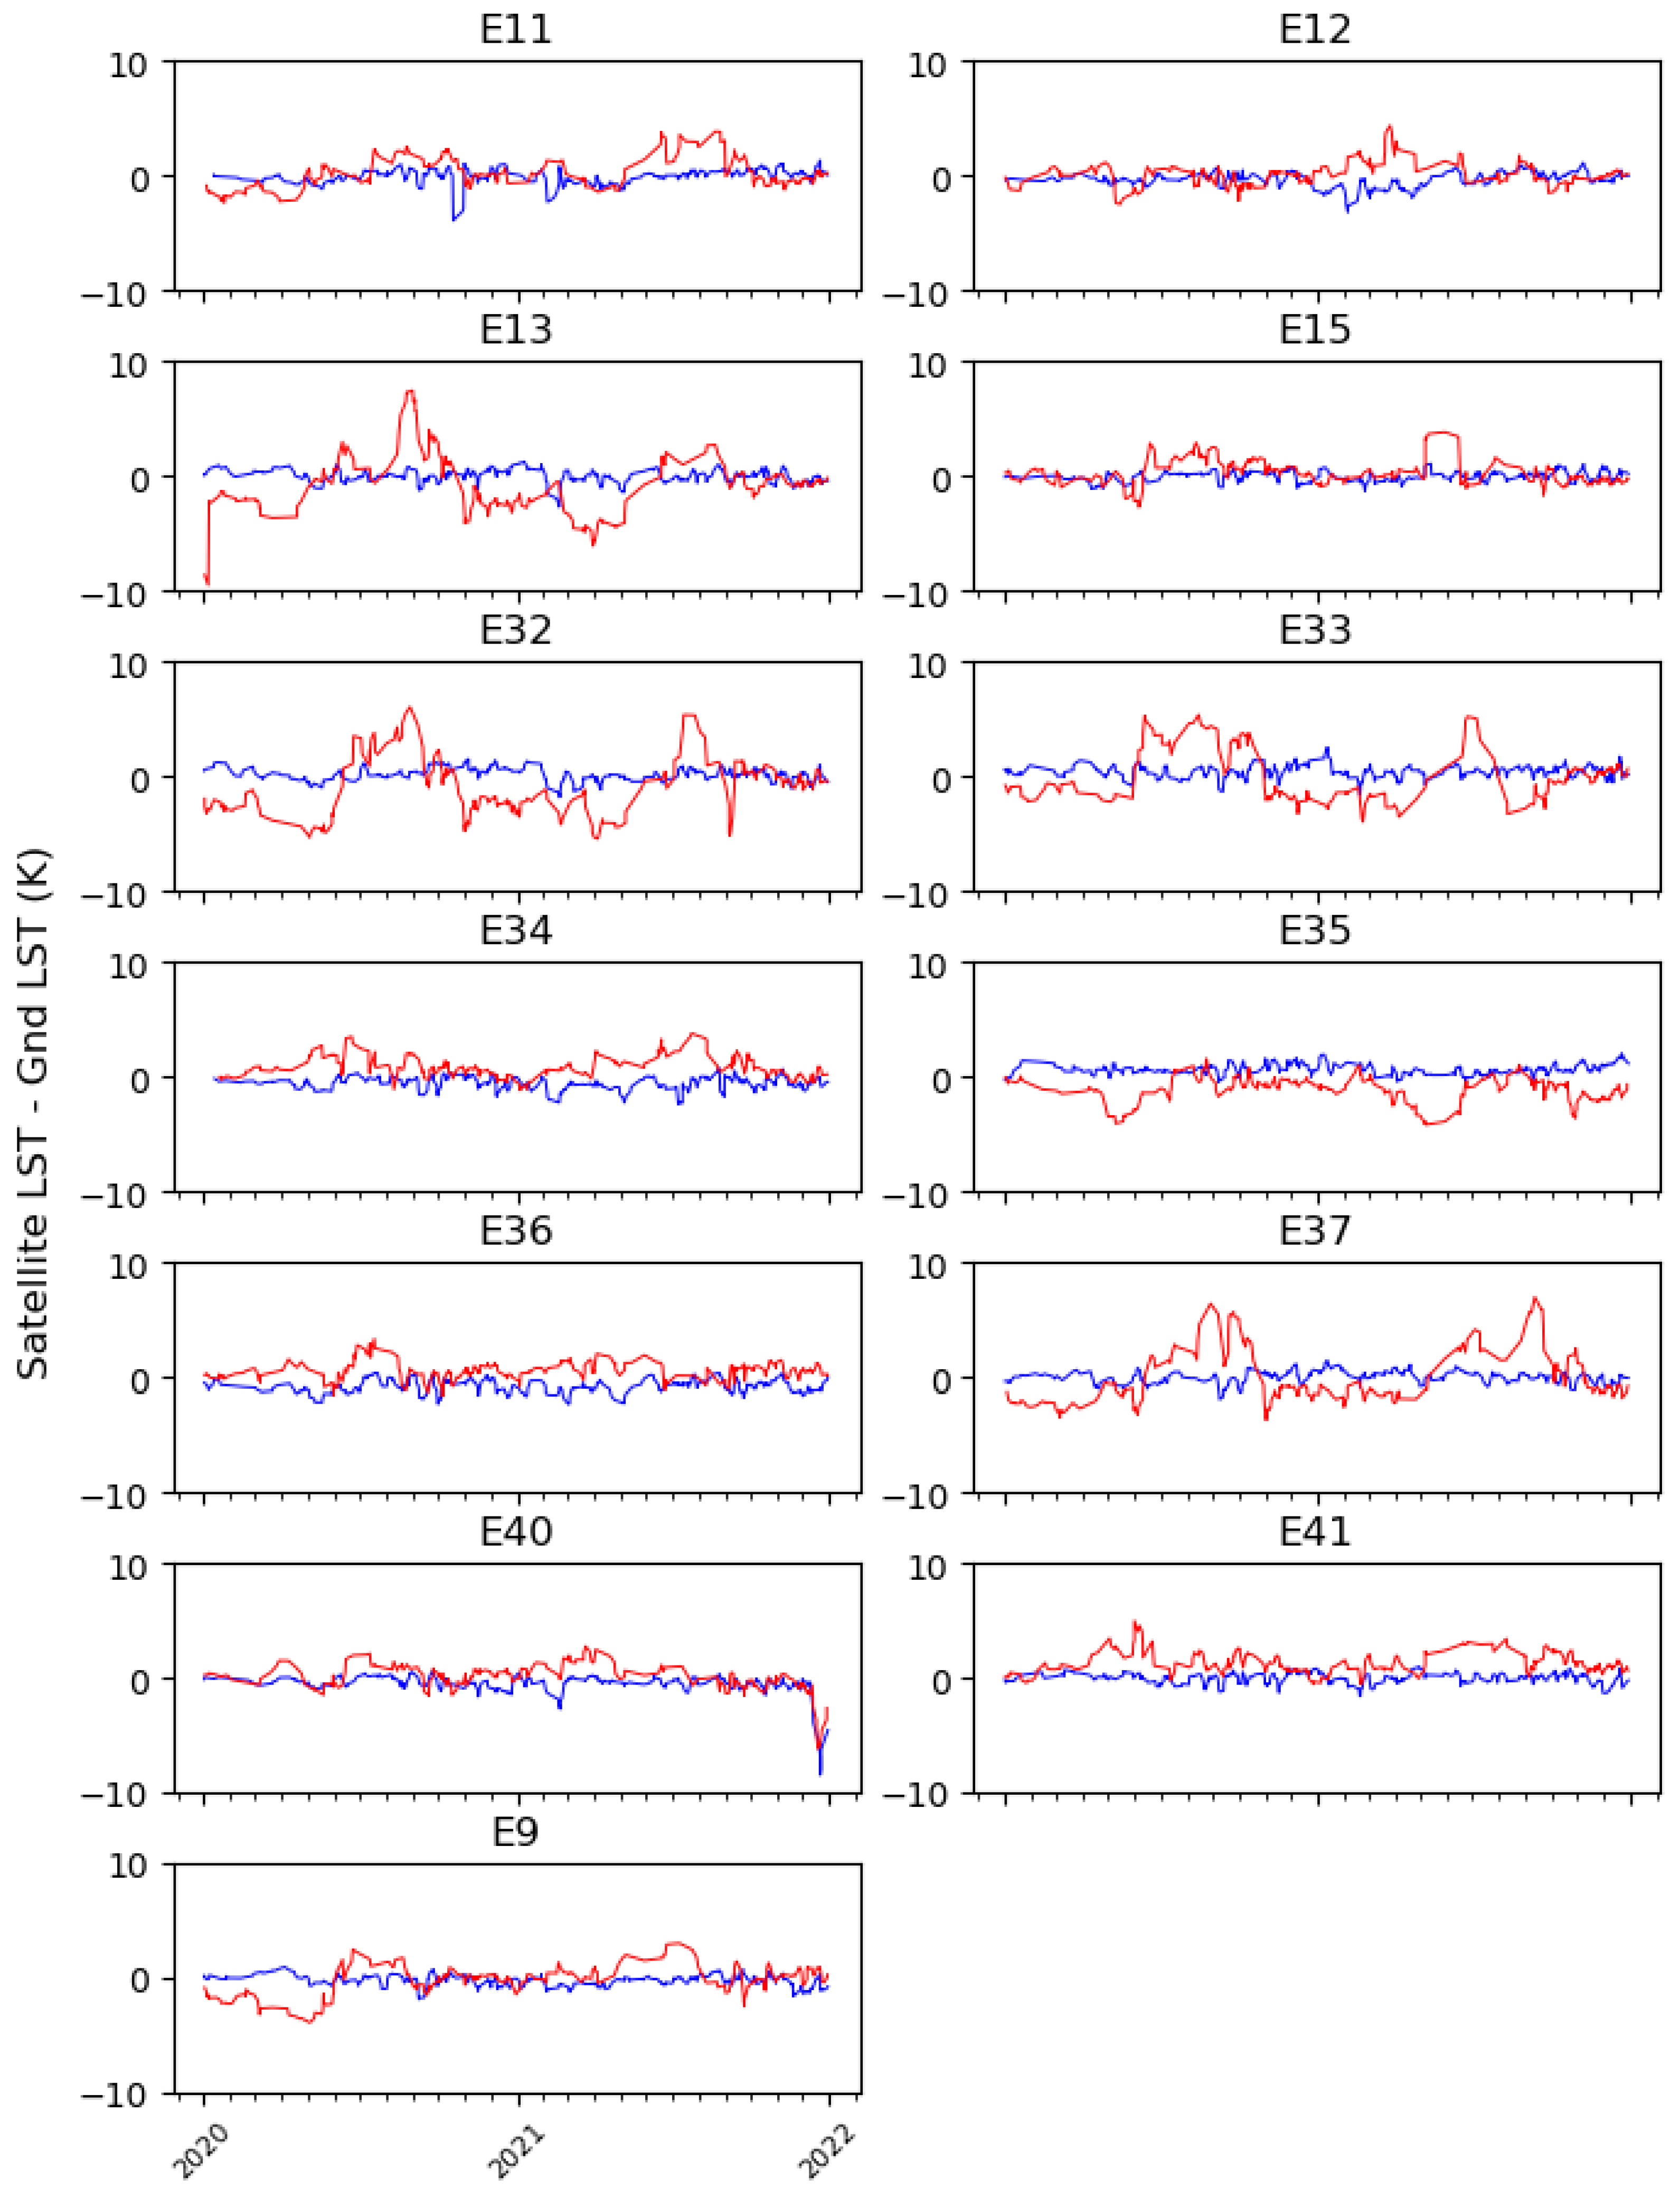
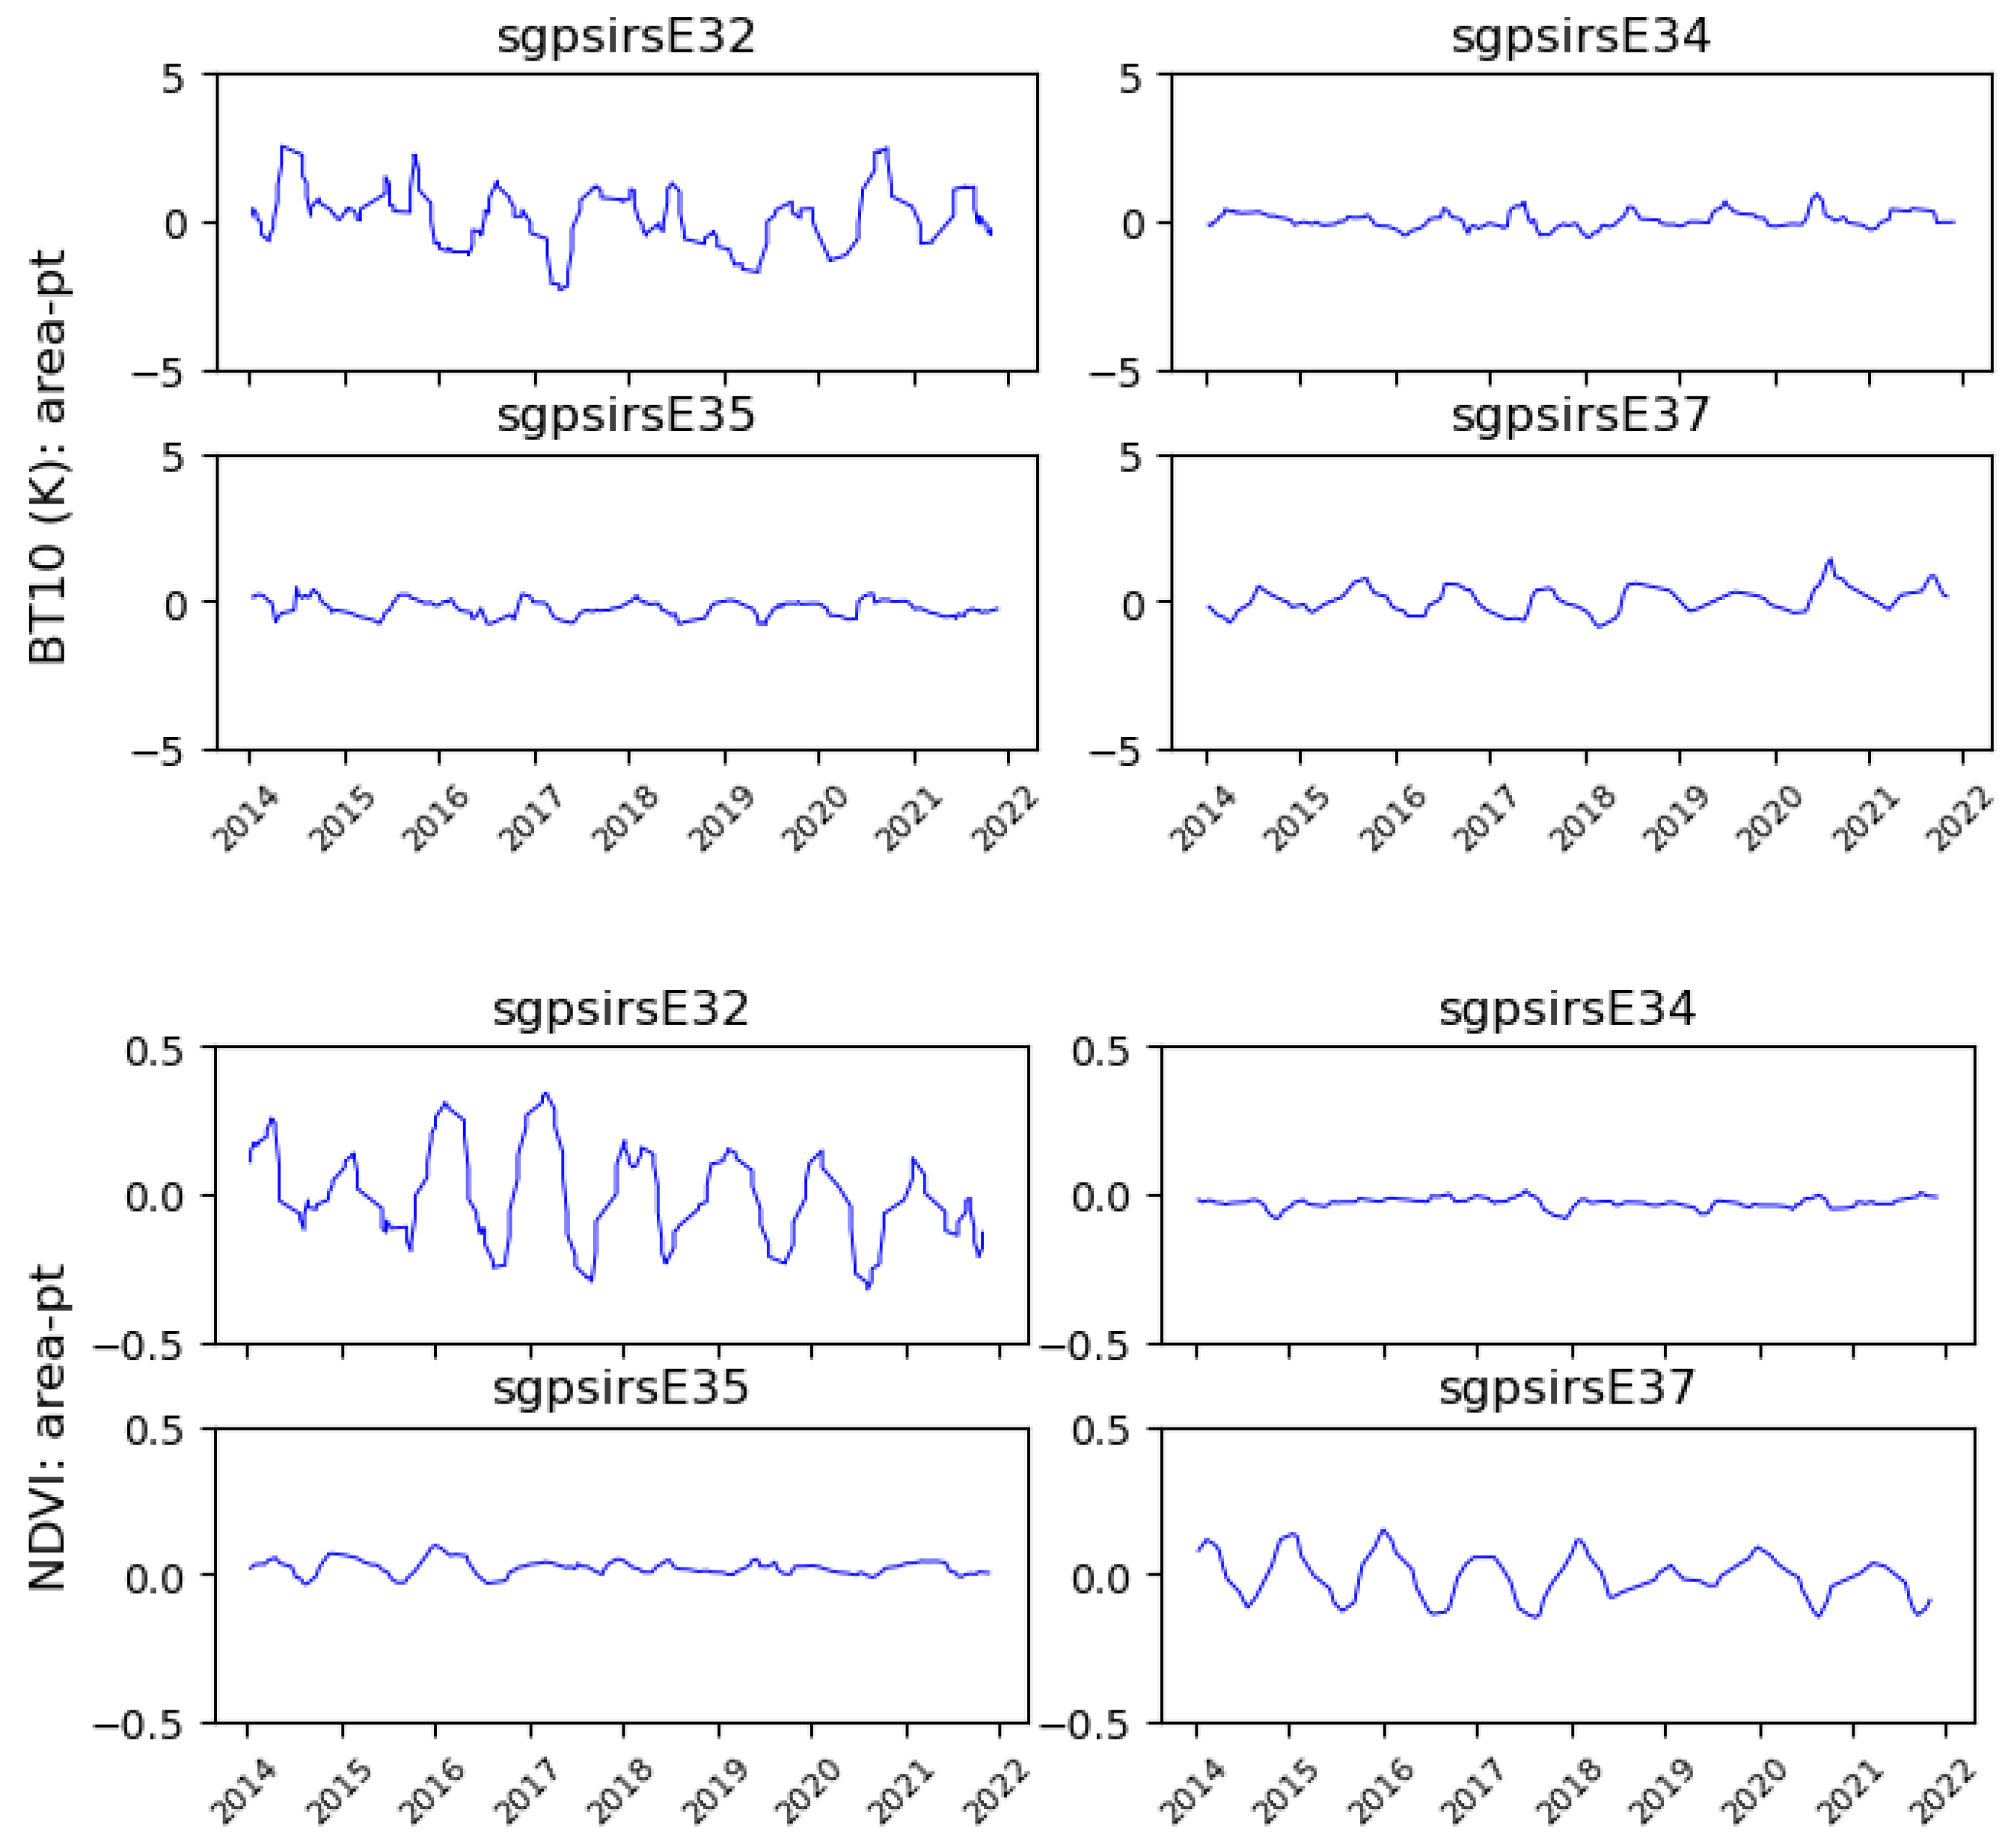
4.3. Validation Results against ARM

Two years of the SNPP VIIRS LST data in 2020 and 2021 were used in the validation against ARM observations, while two years of the VNP21A1 LST data in 2019 and 2020 were validated as a reference. Figure 10 shows the validation results. The overall validation of a combination of the 13 sites indicates a bias of −0.08 K and a RMSE of 1.68 K with nearly 9000 matchups for the SNPP LST, in which the nighttime LST achieves very close agreement with the ground observations, with a bias of −0.11 K and RMSE of 1.05 K compared to zero bias and a RMSE of 2.31 K in the daytime. For the VNP21A1 LST, the validation with nearly 8000 matchups yields an overall bias of 0.12 K and a RMSE of 2.55 K, in which the nighttime LST presents a cold bias of −0.7 K and a RMSE of 1.85 K compared to a bias of 1.04 K and a RMSE of 3.14 K in the daytime. The site-wide results, as shown at the bottom of Figure 10, indicate a positive bias in the daytime and a negative bias at night over most of the sites from VNP21 LST, while SNPP LST maintains a close agreement for most of the sites, except for several sites such as E32 and E35 with a positive bias in the daytime, E36 with a negative bias in the nighttime, and E41 with a positive bias in the daytime. Figure 11 shows the time series of LST errors over each site included in this study. The nighttime LST error is very stable with small fluctuations over all of the sites, while more variations are observed during the daytime. Seasonal variations are noticeable over many of the sites such as E13, E32, E33, and E37, with the positive differences in summer and negative differences in winter, whereas there is a negative difference in early summer over station E35. It is thought to be linked to the vegetation cycle with the low NDVI in winter and high NDVI in summer as discussed in Section 5. The ARM stations are located on farmland. For this region, wheat serves as the major crop and it occupies approximately 65% of the area around the ARM SGP central facility. There are some variations in the frequency of occurrence for other classes such as corn/milo, pasture/grassland, and wheat stubble/dry grass [42]. The vegetation cycle can change the land cover fractions and emissivity throughout the year. In addition, the solar zenith angle varies with the season and the time of day, changing the fractions of shadow and sunlit areas observed by satellites and in situ instruments. The importance of this influence depends on the land cover type and is the least for the flat and homogenous validation sites [21].

5. Discussion

In this study, six of the ground sites from the SURFRAD network, two sites from the BSRN network, and sixteen sites from the ARM network were used to evaluate the performance of the SNPP VIIRS LST product with a reference from the VNP21 LST product. It is found that the LST accuracy varies considerably from station to station and between different satellite datasets, which can be attributed to different causes such as satellite LST algorithm uncertainty, in situ LST quality, and site heterogeneity, etc. In this study, the satellite LSTs are retrieved using different algorithms in which the VIIRS uses the split window algorithm and the VNP21 uses the physics-based Temperature Emissivity Separation algorithm. Because the two products are for the same sensor onboard the same satellite, there is generally no temporal and geometric difference between the SNPP LST and VNP21 LST. The difference in the validation results mainly results from the algorithm difference. Besides, the compositing method used in the VNP21A1 LST product may also affect the validation results.
The stations from the SURFRAD, BSRN, and ARM networks have provided high-quality ground measurements for years, which have been widely used in many studies. The instruments are calibrated routinely, for example, the instruments in SURFRAD are calibrated every year and the data quality is strictly managed. However, we must bear in mind that the ground data are spot observations whereas the satellite data are an aggregation of a much larger area at a viewing angle and time. Therefore, the direct comparison between the satellite retrievals and the co-located ground observation might involve spatial, temporal, and directional mismatches. The temporal mismatch is negligible in the validation presented here due to the high temporal resolution of the ground data, which is typically 1 min in all three of the networks. For validation with the VNP21A1 LST product, the temporal difference can reach up to 6 min. The directional mismatch mainly happens with bushes or trees, with shadows created by complex geometry from the sensor and the solar view from different directions, especially when coupled with the terrain effects of the site. This effect is discussed in the validation over the KAL_R and EVO stations [21] and a geometrical optical model is used to correct the directional impact. In this study, there are no sites with dominant tree cover, therefore, it has a minor influence on the validation. The mismatch in this study mainly occurs in the spatial domain, due to the different fields of view of the ground instruments and satellite sensors. Based on the method introduced in Section 3, the heterogeneity is analyzed for each station in the three networks. Figure 12 shows the results for the SUFRAD stations.
Pronounced seasonal variations are observed over the TBL, FPK, and BON stations, and a weak variation is observed over the SXF station. Over the DRA site, however, the interannual curve is very straight with very small fluctuations over the years. The scale difference over the PSU station is also flat but with more fluctuations than the DRA site. Note that the clear-sky observations are very limited over the PSU site, which restrains its statistical significance. Generally, a constant deviation is observed from the FPK and SXF stations with a cold bias of −0.43 K and −0.63 K, respectively, which indicates a greater heterogeneity level over these two sites. The scale difference over DRA and PSU maintains a close to zero line across all of the years from 2014 to 2022, with a systematic bias of −0.26 K and 0.16 K, respectively. The seasonal cycle over the BON site clearly shows the warmer BT10 of a 1 km spatial area during the late spring and colder BT10 during the summer compared to the in situ brightness temperature. The pronounced seasonal variation over the BON site is also found in the NDVI time series as shown in Figure 13, which shows that the NDVI scale difference gradually increases from the spring and reaches the peak in the summer and then gradually decreases in the fall, which basically synchronized with the crop growth and serves as the main contributor to the seasonal cycle. A minor NDVI variation is observed over the FPK site, while no obvious change is observed in all of the other sites.
Figure 14 shows the heterogeneity analysis over some of the ARM stations in which sgpsirsE32 presents the most scattered scale difference in both of the BT10 and NDVI variables, which indicates the most significant heterogeneity level among the 13 ARM sites. Obvious seasonal patterns are observed over sgpsirsE32 and sgpsirsE37, while the minor variation is observed over sgpsirsE34 and sgpsirsE35 for both the BT10 and NDVI analysis, which explains the seasonal variation found in the LST error time series.
As shown in Figure 15, the scale difference over the two BSRN stations shows no obvious seasonal variations and maintains at a stable level over the years; the scale difference for both BT10 and NDVI are flat without an obvious seasonal cycle.
The multi-year average of the internal heterogeneity is calculated and the results indicate that TBL, among the six SURFRAD sites, shows the maximum internal heterogeneity level of 1.71 K and BON shows the minimum internal heterogeneity level of 0.75 K, followed by the DRA site with an internal heterogeneity of 0.78 K; sgpsirsE33 among the sixteen ARM sites shows the maximum heterogeneity level of 1.11 K, and sgpsirsE34 shows the minimum heterogeneity level of 0.56 K; the CAB station shows a heterogeneity level of 0.43 K and GOB shows a heterogeneity level of 0.72 K. Note that this result is impacted by the clear-sky data sample numbers at each site.
It is found that the station heterogeneity analysis can help interpret the LST error patterns over some of the sites; however, the LST error may present a contrary trend or pattern than the scale difference over some of the other sites, which is related to the limitations of this analysis. Firstly, the simplification of the satellite pixel size as a 1 km circle may bring in some uncertainty, particularly when the satellite is viewing the station at a large angle. Secondly, the scale difference only represents a nadir-view condition, due to the limited view angle range of Landsat 8 which is about 6 degrees, while the sensor zenith angle of VIIRS can reach over 70 degrees. Thus, the LST errors related to emissivity anisotropy and large angles cannot be analyzed using this method. Thirdly, the Landsat 8 data are very limited due to its 16-day repeat cycle, and the screening of clear-sky criteria further reduces the number of valid observations, which may affect the analysis results, particularly the seasonal patterns. On the one hand, fewer matchups might lead to missing some patterns, on the other hand, they may skew the pattern and statistics.

6. Conclusions

This study validates the VIIRS LST against the in situ data from three networks including SURFRAD, BSRN, and ARM with a total of 21 stations using 10 years of available data. The NOAA-20 VIIRS LST is validated against SURFRAD to ensure a consistent performance among the JPSS series satellite and the VNP21A1 LST is used as a reference. The stations represent different land cover types, including cropland, grassland, shrubland, barren surfaces, and a mixture of several surface types on site. The same validation procedure was used for different VIIRS LST products, therefore making the validation results comparable to each other. The difference found between the SNPP VIIRS LST product and VNP21 LST product is mainly caused by the algorithm difference.
The results were analyzed at two levels: the overall level with a combination of all of the sites in a network, and the site-wide level with each station, and the statistical accuracy and precision are presented for the daytime and nighttime separately. The results indicate an overall close agreement between the VIIRS LST and the ground measurements with a bias of −0.4 K and a RMSE of 1.9 K over six SURFURD sites; a bias of −0.3 K and a RMSE of 1.7 K over two BSRN sites and a bias of −0.1 K and a RMSE of 1.7 K over 13 ARM sites. In general, the RMSE, as expected, is much smaller in the nighttime due to the absence of the shadow impact and the lower influence of heterogeneous land cover, which in contrast leads to the increased difference between the satellite LST and ground measurement during daytime. The site-wide results show that the median accuracies of the individual stations are within −1.5 K to 0.8 K during the nighttime, and −1.5 K to 1.3 K during the daytime among all of the 21 sites, with most of the sites less than 1 K for both daytime and nighttime.
The time series analysis was conducted over each site for the whole study period, i.e., 2012 to 2022 for SURFRAD, 2015 to 2021 for BSRN, and 2020–2021 for ARM stations. The seasonal pattern was found to be pronounced over some sites, such as BON, PSU, and some of the ARM sites, which might be related to the vegetation growth cycle, site heterogeneity, site management, etc. In this study, the time series helped to identify the periodic mismatch between satellite estimations and ground measurements and revealed issues from the ground measurements e.g., the CAB site.
The cloud contamination is found to have a great impact on the validation results though the satellite cloud mask and additional cloud screening procedures were applied. Outliers can still be found from the comparison between the satellite retrievals and their in situ counterpart, particularly during the nighttime. This is often due to failure in the detection of cloudy pixels, especially small pieces of cloud or cloud edge. The improvement in cloud detection will benefit the LST validation studies.
We should bear in mind that the ground validation quality is strongly subject to the spatial heterogeneity of surface temperature within the satellite field of view, which is not well presented by the ground in situ observations. This restricts the LST validation only at the relatively homogeneous ground stations. In this study, we tried to quantify the station heterogeneity based on Landsat 8 data, which proves a promising outcome in not only the characterization of the site at a heterogeneity level, but also the capture of the seasonal or inter-annual cycle feature from the long-term time series. The method itself is simple and straightforward.
The enterprise LST algorithm has been running in the operational environment since June 2019 and the data are available at NOAA CLASS. Compared to the 10-year MODIS LST validation results [19], the results from the 10-year VIIRS LST validation demonstrate the good quality of the LST product of the JPSS series satellite.

Author Contributions

Conceptualization, Y.L.; methodology, Y.L., P.Y. and J.P.; software, Y.L.; validation, Y.L. and P.Y.; formal analysis, Y.L.; investigation, Y.L.; resources, Y.L.; data curation, Y.L. and P.Y.; writing—original draft preparation, Y.L.; writing—review and editing, Y.L., P.Y., H.W. and J.P.; visualization, Y.L. and P.Y.; supervision, Y.Y.; project administration, Y.Y.; funding acquisition, Y.Y. All authors have read and agreed to the published version of the manuscript.

Funding

This study was funded by NOAA grant NA19NES4320002 (Cooperative Institute for Satellite Earth System Studies-CISESS) at the University of Maryland/ESSIC.

Data Availability Statement

Publicly available datasets were analyzed in this study. This data can be found here: https://www.avl.class.noaa.gov/saa/products/welcome/ (accessed on 4 June 2022).

Acknowledgments

This study was supported by NOAA grant NA19NES4320002 (Cooperative Institute for Satellite Earth System Studies-CISESS) at the University of Maryland/ESSIC.

Conflicts of Interest

The authors declare no conflict of interest.

References

  1. GCOS-200 (GOOS-214). The Global Observing System for Climate: Implementation Needs. Available online: https://library.wmo.int/doc_num.php?explnum_id=3417 (accessed on 12 June 2022).
  2. Zheng, W.; Wei, H.; Wang, Z.; Zeng, X.; Meng, J.; Ek, M.; Mitchell, K.; Derber, J. Improvement of daytime land surface skin temperature over arid regions in the NCEP GFS model and its impact on satellite data assimilation. J. Geophys. Res. Atmos. 2012, 117, D06117. [Google Scholar] [CrossRef] [Green Version]
  3. Trigo, I.F.; Boussetta, S.; Viterbo, P.; Balsamo, G.; Beljaars, A.; Sandu, I. Comparison of model land skin temperature with remotely sensed estimates and assessment of surface-atmosphere coupling. J. Geophys. Res. Atmos. 2015, 120, 12096–12111. [Google Scholar] [CrossRef] [Green Version]
  4. Fang, L.; Zhan, X.; Schull, M.; Kalluri, S.; Laszlo, I.; Yu, P.; Carter, C.; Hain, C.; Anderson, M. Evapotranspiration Data Product from NESDIS GET-D System Upgraded for GOES-16 ABI Observations. Remote Sens. 2019, 11, 2639. [Google Scholar] [CrossRef] [Green Version]
  5. Sun, J.; Salvucci, G.D.; Entekhabi, D. Estimates of evapotranspiration from MODIS and AMSR-E land surface temperature and moisture over the Southern Great Plains. Remote Sens. Environ. 2012, 127, 44–59. [Google Scholar] [CrossRef]
  6. Anderson, M.C.; Allen, R.G.; Morse, A.; Kustas, W.P. Use of Landsat thermal imagery in monitoring evapotranspiration and managing water resources. Remote Sens. Environ. 2012, 122, 50–65. [Google Scholar] [CrossRef]
  7. Yin, J.; Zhan, X.; Liu, J.; Moradkhani, H.; Fang, L.; Walker, J.P. Near-real-time one-kilometre Soil Moisture Active Passive soil moisture data product. Hydrol. Processes 2020, 34, 4083–4096. [Google Scholar] [CrossRef]
  8. Rajasekar, U.; Weng, Q. Urban heat island monitoring and analysis by data mining of MODIS imageries. ISPRS J. Photogramm. Remote Sens. 2009, 64, 86–96. [Google Scholar] [CrossRef]
  9. Weng, Q.; Lu, D.; Schubring, J. Estimation of land surface temperature vegetation abundance relationship for urban heat island studies. Remote Sens. Environ. 2004, 89, 467–483. [Google Scholar] [CrossRef]
  10. Wan, Z.; Dozier, J. A generalized split-window algorithm for retrieving land-surface temperature measurement from space. IEEE Trans. Geosci. Remote Sens. 1996, 34, 892–905. [Google Scholar]
  11. Yu, Y.; Tarpley, D.; Privette, J.; Goldberg, M.; Raja, M.; Vinnikov, K.; Xu, H. Developing algorithm for operational GOES-R land surface temperature product. IEEE Trans. Geosci. Remote Sens. 2009, 47, 936–951. [Google Scholar]
  12. Trigo, I.; Freitas, S.; Bioucas-Dias, J.; Barroso, C.; Monteiro, I.; Viterbo, P. Algorithm Theoretical Basis Document for Land Surface Temperature (LST) Products: LSA-001(MLST), LSA-050 (MLST-R). 2017. Available online: https://landsaf.ipma.pt/en/products/land-surface-temperature/lst/ (accessed on 23 August 2019).
  13. Prata, A.J. Land Surface Temperature Measurement from Space: AATSR Algorithm Theoretical Basis Document. Available online: https://earth.esa.int/c/document_library/et_file?folderId=13019&name=DLFE-660.pdf (accessed on 12 June 2022).
  14. Remedios, J. Sentinel-3 Optical Products and Algorithm Definition: Land Surface Temperature Algorithm Theoretical Basis Document. Available online: https://sentinels.copernicus.eu/web/sentinel/user-guides/sentinel-3-slstr/document-library (accessed on 12 June 2022).
  15. Liu, Y.; Yu, Y.; Yu, P.; Göttsche, F.M.; Trigo, I.F. Quality Assessment of SNPP VIIRS Land Surface Temperature Product. Remote Sens. 2015, 7, 12215–12241. [Google Scholar] [CrossRef] [Green Version]
  16. Liu, Y.; Yu, Y.; Yu, P.; Wang, H.; Rao, Y. Enterprise LST Algorithm Development and Its Evaluation with NOAA 20 Data. Remote Sens. 2019, 11, 2003. [Google Scholar] [CrossRef] [Green Version]
  17. Li, H.; Sun, D.; Yu, Y.; Wang, H.; Liu, Y.; Liu, Q.; Du, Y.; Wang, H.; Cao, B. Evaluation of the VIIRS and MODIS LST products in an arid area of Northwest China. Remote Sens. Environ. 2014, 142, 111–121. [Google Scholar] [CrossRef] [Green Version]
  18. Guillevic, P.C.; Biard, C.J.; Hulley, G.C.; Privette, J.L.; Hook, S.J.; Olioso, A.; Göttsche, F.M.; Radocinski, R.; Román, M.O.; Yu, Y.; et al. Validation of land surface temperature products derived from the Visible Infrared Imaging Radiometer Suite (VIIRS) using ground-based and heritage satellite measurements. Remote Sens. Environ. 2014, 154, 19–37. [Google Scholar] [CrossRef]
  19. Li, S.; Yu, Y.; Sun, D.; Tarpley, D.; Zhan, X.; Chiu, L. Evaluation of 10 year AQUA/MODIS land surface temperature with SURFRAD observations. Int. J. Remote Sens. 2014, 35, 830–856. [Google Scholar] [CrossRef]
  20. Yu, Y.; Yu, P. Land Surface Temperature Product from the GOES-R Series. In A new Generation of Geostationary Environmental Satellites; The GOES-R Series; Elsevier: Amsterdam, The Netherlands, 2019; pp. 133–144. [Google Scholar] [CrossRef]
  21. Martin, M.A.; Ghent, D.; Pires, A.C.; Göttsche, F.-M.; Cermak, J.; Remedios, J.J. Comprehensive in Situ Validation of Five Satellite Land Surface Temperature Data Sets over Multiple Stations and Years. Remote Sens. 2019, 11, 479. [Google Scholar] [CrossRef] [Green Version]
  22. Sun, D.L.; Pinker, R.T.; Basara, J.B. Land surface temperature estimation from the next generation of Geostationary Operational Environmental Satellites: GOES M-Q. J. Appl. Meteorol. 2004, 43, 363–372. [Google Scholar] [CrossRef]
  23. Martin, M.A.; Göttsche, F.-M. Satellite LST Validation Report (DEL-13). ESA DUE Glob Temperature Project, Reference GlobT-WP4-DEL-12. 2016. Available online: www.globtemperature.info (accessed on 8 June 2022).
  24. Wang, H.; Yu, Y.; Yu, P.; Liu, Y. Land Surface Emissivity Product for NOAA JPSS and GOES-R Missions: Methodology and Evaluation. IEEE Trans. Geosci. Remote Sens. 2020, 58, 307–318. [Google Scholar] [CrossRef]
  25. Hulley, G.; Islam, T.; Freepartner, R.; Malakar, N. Visible Infrared Imaging Radiometer Suite (VIIRS) Land Surface Temperature and Emissivity Product Collection 1 Algorithm Theoretical Basis Document. Available online: https://lpdaac.usgs.gov/documents/1332/VNP21_ATBD_V1.pdf (accessed on 12 June 2022).
  26. Augustine, J.A.; Dutton, E.G. Variability of the surface radiation budget over the United States from 1996 through 2011 from high-quality measurements. J. Geophys. Res. Atmos. 2013, 118, 43–53. [Google Scholar] [CrossRef] [Green Version]
  27. Augustine, J.A.; Hodges, G.B.; Cornwall, C.R.; Michalsky, J.J.; Medina, C.I. An Update on SURFRAD—The GCOS Surface Radiation Budget Network for the Continental United States. J. Atmos. Oceanic Technol. 2005, 22, 1460–1472. [Google Scholar] [CrossRef]
  28. Yu, Y.; Liu, Y.; Yu, P. Land Surface Temperature Product Development for JPSS and GOES-R Missions. In Reference Module in Earth Systems and Environmental Sciences; Princeton University: Princeton, NJ, USA, 2017. [Google Scholar] [CrossRef]
  29. Sun, D.; Yu, Y.; Fang, L.; Liu, Y. Toward an operational land surface temperature algorithm for GOES. J. Appl. Meteorol. Clim. 2013, 52, 1974–1986. [Google Scholar] [CrossRef]
  30. Malakar, N.K.; Hulley, G.C.; Hook, S.J.; Laraby, K.; Cook, M.; Schott, J.R. An Operational Land Surface Temperature Product for Landsat Thermal Data: Methodology and Validation. IEEE Trans. Geosci. Remote Sens. 2018, 56, 5717–5735. [Google Scholar] [CrossRef]
  31. Zhou, J.; Liang, S.; Cheng, J.; Wang, Y.; Ma, J. The GLASS Land Surface Temperature Product. IEEE J. Sel. Top. Appl. Earth Obs. Remote Sens. 2019, 12, 493–507. [Google Scholar] [CrossRef]
  32. Ohmura, A.; Dutton, E.G.; Forgan, B.; Fröhlich, C.; Gilgen, H.; Hegner, H.; Heimo, A.; König-Langlo, G.; McArthur, B.; Müller, G.; et al. Baseline Surface Radiation Network (BSRN/WCRP): New Precision Radiometry for Climate Research. Bull. Am. Meteorol. Soc. 1998, 79, 2115–2136. [Google Scholar] [CrossRef] [Green Version]
  33. Göttsche, F.-M.; Olesen, F.-S.; Bork-Unkelbach, A. Validation of land surface temperature derived from MSG/SEVIRI with in situ measurements at Gobabeb, Namibia. Int. J. Remote Sens. 2013, 34, 3069–3083. [Google Scholar] [CrossRef]
  34. ARM Observatories. Available online: https://www.arm.gov/capabilities/observatories (accessed on 1 June 2022).
  35. Li, Z.; Tang, B.; Wu, H.; Ren, H.; Yan, G.; Wan, Z.; Trigo, I.F.; Sobrino, J.A. Satellite-Derived Land Surface Temperature: Current Status and Perspectives. Remote Sens. Environ. 2013, 131, 14–37. [Google Scholar] [CrossRef] [Green Version]
  36. Goela, P.C.; Cordeiro, C.; Danchenko, S.; Icely, J.; Cristina, S.; Newton, A. Time series analysis of data for sea surface temperature and upwelling components from the southwest coast of Portugal. J. Mar. Syst. 2016, 163, 12–22. [Google Scholar] [CrossRef] [Green Version]
  37. Hook, S.J.; Vaughan, R.G.; Tonooka, H.; Schladow, S.G. Absolute radiometric in-flight validation of mid infrared and thermal infrared data from ASTER and MODIS on the Terra spacecraft using the lake Tahoe, CA/NV, USA, Automated Validation Site. IEEE Trans. Geosci. Remote Sens. 2007, 45, 1798–1807. [Google Scholar] [CrossRef]
  38. Guillevic, P.; Göttsche, F.; Nickeson, J.; Hulley, G.; Ghent, D.; Yu, Y.; Trigo, I.; Hook, S.; Sobrino, J.A.; Remedios, J.; et al. Land Surface Temperature Product Validation Best Practice Protocol. Version 1.1. In Good Practices for Satellite-Derived Land Product Validation; Guillevic, P., Göttsche, F., Nickeson, J., Román, M., Eds.; Land Product Validation Subgroup (WGCV/CEOS), 2018; p. 58. [Google Scholar] [CrossRef]
  39. Li, H.; Li, R.; Yang, Y.; Cao, B.; Bian, Z.; Hu, T.; Du, Y.; Sun, L.; Liu, Q. Temperature-Based and Radiance-Based Validation of the Collection 6 MYD11 and MYD21 Land Surface Temperature Products Over Barren Surfaces in Northwestern China. IEEE Trans. Geosci. Remote Sens. 2021, 59, 1794–1807. [Google Scholar] [CrossRef]
  40. Li, H.; Yang, Y.; Li, R.; Wang, H.; Cao, B.; Bian, Z.; Hu, T.; Du, Y.; Sun, L.; Liu, Q. Comparison of the MuSyQ and MODIS Collection 6 land surface temperature products over barren surfaces in the Heihe River Basin, China. IEEE Trans. Geosci. Remote Sens. 2019, 57, 8081–8094. [Google Scholar] [CrossRef]
  41. Knap, W. Basic and Other Measurements of Radiation at Station Cabauw (2021-10); Koninklijk Nederlands Meteorologisch Instituut: De Bilt, The Netherlands, 2021. [CrossRef]
  42. Trishchenko, A.P.; Luo, Y.; Latifovic, R.; Li, Z. Land Cover Type Distribution Over the ARM SGP Area for Atmospheric Radiation and Environmental Research. In Proceedings of the Fourteenth ARM Science Team Meeting, Albuquerque, NM, USA, 22–26 March 2004. [Google Scholar]
Figure 1. The overall VIIRS LST validation against SURFRAD observations for SNPP (left), NOAA-20 (middle) and VNP21A1 (right, two years of data in 2019 and 2020 were used).
Remotesensing 14 02863 g001
Figure 2. Site-wide validation results for SNPP (left) NOAA-20 (middle) and VNP21A1 (right).
Remotesensing 14 02863 g002
Figure 3. Time series plots of SNPP VIIRS LST errors in each SURFRAD station from 2012 to 2022 (blue color for nighttime and red color for daytime).
Remotesensing 14 02863 g003
Figure 4. Time series of emissivity including spectral emissivity and broadband emissivity over DRA site (left) and TPW obtained from GFS (right).
Remotesensing 14 02863 g004
Figure 5. The time series of in situ radiation (left) with upwelling IR (top left) and downwelling IT (bottom left), satellite LST (top right), and ground LST (bottom right).
Remotesensing 14 02863 g005
Figure 6. The relationship between the LST error and sensor view zenith angle over all six SURFRAD sites.
Remotesensing 14 02863 g006
Figure 7. LST validation against BSRN data for SNPP (left) and VNP21A1 (right) with the overall valuation result at top and site-wide results at the bottom.
Remotesensing 14 02863 g007
Figure 8. Site-wide time series of LST accuracy (blue color for nighttime and red color for daytime).
Remotesensing 14 02863 g008
Figure 9. The daily mean albedo on BRSN CAB site (courtesy of Dr. Wouter Knap [41]).
Remotesensing 14 02863 g009
Figure 10. LST validation against ARM data for SNPP (left) and VNP21A1 (right) with the overall valuation result at top and site wide results at the bottom.
Remotesensing 14 02863 g010
Figure 11. Time series of SNPP LST errors in each ARM site from 2020 to 2022 (blue color for nighttime and red color for daytime).
Remotesensing 14 02863 g011
Figure 12. The heterogeneity analysis of SURFRAD stations over brightness temperature variable.
Remotesensing 14 02863 g012
Figure 13. The heterogeneity analysis of SURFRAD stations over NDVI variable.
Remotesensing 14 02863 g013
Figure 14. The heterogeneity analysis of some ARM stations over BT10 (top) and NDVI variable (bottom).
Remotesensing 14 02863 g014
Figure 15. The heterogeneity analysis of BSRN stations over BT10 (left) and NDVI variable (right).
Remotesensing 14 02863 g015
Table 1. Geo-Location and surface type of the six SURFRAD stations.
No.Site LocationStation Abb.Lat(N)/Lon(W)Elevation(m)Surface Type
1Bondville, IL, USABON40.05/88.37230Crop Land
2Fort Peck, MT, USAFPT48.31/105.10634Grass Land
3Table Mountain, CO, USATBL40.13/105.241689Grass/Crop Land
4Desert Rock, NV, USADRA36.63/116.021007Shrub Land
5Penn. State Univ., PA, USAPSU40.72/77.93376Cropland
6Sioux Falls, SD, USASFX43.73/96.62473Cropland
Table 2. Geo-Location and surface type of the two BSRN stations.
No.Site LocationStation Abb.Lat(N)/Lon(E)Elevation(m)Surface Type
1Cabauw, The NetherlandsCAB51.97/4.93213Crop Land
2Gobabeb, NamibiaGOB−23.56/15.04407Bare ground
Table 3. Geolocation and surface type of the ARM stations.
No.Site NameStation Abb.Lat(N)/Lon(W)Altitude(m)Surface Type
1sgpsirsE9E937.133/97.266386Pasture
2sgpsirsE11E1136.881/98.285360Pasture
3sgpsirsE12E1236.841/96.427331Native Prairie
4sgpsirsE13E1336.605/97.485318Pasture and Wheat
5sgpsirsE15E1536.431/98.284418Pasture
6sgpsirsE32E3236.819/97.8199328Pasture
7sgpsirsE33E3336.9255/97.0817357Grassy field
8sgpsirsE34E3437.0694/96.7606417Pasture
9sgpsirsE35E3535.8615/97.0695294.1Pasture
10sgpsirsE36E3636.1166/97.5112336.8Pasture
11sgpsirsE37E3736.3106/97.928378.9Grass
12sgpsirsE40E4036.31937/96.76203247Pasture
13sgpsirsE41E4136.87956/97.08645340Grassy field
Table 4. Correlation between LST error and multiple factors for nighttime and daytime.
Day/NightFactorsBONDRAFPKPSUSXFTBL
NightTPW−0.2−0.52−0.240.150.01−0.1
STZ−0.25−0.16−0.29−0.03−0.08−0.23
emiMean−0.17−0.04−0.020.10.210.01
emiDiff−0.15−0.030.060.32−0.130.09
DayTPW−0.55−0.490.180.11−0.17−0.18
STZ−0.09−0.33−0.48−0.25−0.49−0.58
emiMean−0.7−0.02−0.040.11−0.35−0.35
emiDiff−0.2−0.010.01−0.02−0.01−0.18
Publisher’s Note: MDPI stays neutral with regard to jurisdictional claims in published maps and institutional affiliations.

