Article

Machine-Learning-Based Change Detection of Newly Constructed Areas from GF-2 Imagery in Nanjing, China

School of Geographical Science, Nanjing University of Information Science and Technology (NUIST), Nanjing 210044, China
*
Author to whom correspondence should be addressed.
Remote Sens. 2022, 14(12), 2874; https://doi.org/10.3390/rs14122874
Submission received: 13 May 2022 / Revised: 7 June 2022 / Accepted: 13 June 2022 / Published: 15 June 2022

Abstract

:
Change detection of the newly constructed areas (NCAs) is important for urban development. The advances of remote sensing and deep learning algorithms promotes the high precision of the research work. In this study, we firstly constructed a high-resolution labels for change detection based on the GF-2 satellite images, and then applied five deep learning models of change detection, including STANets (BASE, BAM, and PAM), SNUNet (Siam-NestedUNet), and BiT (Bitemporal image Transformer) in the Core Region of Jiangbei New Area of Nanjing, China. The BiT model is based on transformer, and the others are based on CNN (Conventional Neural Network). Experiments have revealed that the STANet-PAM model generally performs the best in detecting the NCAs, and the STANet-PAM model can obtain more detailed information of land changes owing to its pyramid spatial-temporal attention module of multiple scales. At last, we have used the five models to analyze urbanization processes from 2015 to 2021 in the study area. Hopefully, the results of this study could be a momentous reference for urban development planning.

Graphical Abstract

1. Introduction

Urbanization is essential to push forward progress of society [1]. China has seen an unparalleled increase of urbanization over the past several decades [2], and the urbanization rate of China has reached 64.72% by 2020 [3]. It is well known that one of the characteristics of urbanization is urban land expansion [4]. Under the circumstance where urban expansion has experienced great development, there is an urgent need for urbanization monitoring [5], which may contribute to sustainable land use and urbanization management for a better adaption to the smart city [6].
The concept of Normalized Difference Built-up Index (NDBI) was first put forward by Zha et al. [7] to extract the built-up regions. Suppose positive NDBI values and Normalized Difference Vegetation Index (NDVI) values indicate built-up and vegetated regions, respectively, this algorithm takes advantage of unique spectral responses of the two above-mentioned regions and then built-up areas are identified by computing the difference of binary NDBI and NDVI values obtained from TM imagery [8,9]. After that, various modified NDBI algorithms have been proposed. For instance, He et al. [9] developed the thresholding algorithm considering the continuous values of NDBI and NDVI instead of only positive values, which achieved better performance in identifying built-up regions. However, the actual spectral response patterns are too complex to study thoroughly, so conventional index methods are difficult to make a breakthrough. The lack of high-resolution images has been an obstacle in monitoring urbanization accurately for a long period too [10]. Furthermore, bi-temporal or multi-temporal images obtained at different times cannot always have the same environmental, illumination, or imaging angels conditions [11,12,13]. Such factors are of significance for extracting information in satellite images and pose great challenges to monitoring urbanization research.
Fortunately, the advancement of modern satellite technology has given birth to remote sensing images [14] with high spatial and temporal resolution [15], such as IKONOS, QuickBird, WorldView, ZY-3 01/02, and GaoFen I/II; (GF-1/2). Specifically, most satellite images obtained from optical sensors support adequate detailed texture and color information [16]. Several studies employing high-resolution remote sensing images achieved better performance in urbanization monitoring. For example, Burbrige et al. [17] examined the extent to which high-resolution data can improve the accuracy and effectiveness of change detection, especially when the study area is small urban areas. QuickBird and IKONOS images are used to identify urban changes in Thessaloniki through objected-oriented classification, showing high accuracy [18]. Furthermore, since GF-2 remote sensing imagery were released, they have been widely used in urban land use classification and change detection work [19,20].
In the wake of the vigorous development of deep learning, many studies have been driven to focus on the integration of deep learning and high-resolution remote sensing images [21]. The incorporation can not only expand the applications of computer vision but also be beneficial for remote sensing interpretation [22]. One of the advantages of methods that are based on deep learning techniques is that they are extremely expert at learning features from the original images actively [23]. As a consequence, they show promising results and are becoming more and more popular in the geoscientific community [24]. Currently, deep learning-based methods in change detection can be classified into two categories: post-classification comparison methods and direct comparison methods [25]. The post-classification comparison methods’ principle is to extract and classify the ground objects of bi-temporal images separately and then compare the classification maps to identify the changed urban areas [26,27]. The convolutional neural networks (CNNs) gain the majority of attention among basic networks in remote sensing classification and change detection work [27]. Nemoto et al. [28] used deep CNNs to first detect buildings and then obtained the building changes according to detection results. Considering the ability of a fully convolutional neural network (FCN) to extract features and semantic segmentation, Sun et al. [29] employed the FCN as a basis for the fine-grained “from-to” construction change detection. In addition, supervised classification approach is applied to extract land cover information, and comparisons between the two phases show a change tendency of increase in the urban settlement [30]. However, for post-classification comparison methods, there is a need for high accuracy of classification maps or extraction results for both images because whether the classification results are accurate or not has a great influence on the final change maps [31], which becomes a hindrance for post-classification methods to make progress.
The direct comparison methods, namely change detection, aims to identify differences in the state of objects, scenes or phenomena by comparing remote sensing images which were obtained at different times in the same location [32,33]. The definition of “change” varies according to the goal of certain study [34]. Concerning our study, we focus on the change of NCAs. Such a method avoids the accumulation of misclassification errors brought by the post-classification comparison method. In CNN-based models, original images are fed into the models to be converted into several layers of feature maps that contain high-level abstract features. Then they are automatically output as a change map through the strong learning ability [35]. A CNN-based architecture was suggested to identify roads through detecting changes between pre-disaster images and post-disaster ones [36]. Furthermore, a Siamese CNN (S-CNN) was proposed as a special framework of CNN and employed in change detection [37]. Zhang et al. [37] put forward an approach to detect building and tree changes based on the S-CNN. Their study proves that the detection accuracy can reach 86.4% on the urban data. In recent years, transfer learning techniques coupled with CNNs have had satisfactory performance in change detection [38]. Lyu et al. [39] used this method to carry out the urban detection study in Beijing and New York and the results indicated good performances on annual detection. Although transfer learning is effective, it may be an obstacle to the applicability of certain methods [40]. Lately, inspired by DenseNet and NestedUNet, Fang et al. put forward a new kind of architecture—SNUNet (Siam-NestedUNet) [41]. Innovatively, they created dense skip connections between encoder and decoder as well as decoder and encoder instead of using the successive downsampling that other methods usually do. The modification is beneficial to preserve high-resolution and fine-grained representation that otherwise would be lost [41]. The validation experiments were conducted on the CDD dataset and the results turned out to be outstanding in change detection. Since the attention-based approaches started showing up, they have achieved a lot of concentration. The attention mechanism primarily focuses on important information according to different tasks to save resources and obtain useful results as fast as possible. Studies show that it is uncomplicated yet useful through adjusting the weight of features in CNNs [42]. Furthermore, it is able to conquer the shortcomings of CNNs, which focuses merely on locally relevant structures within a certain layer [43]. Incorporating the attention mechanism, the STANet framework [44] is designed to fully utilize the relationship between spatial and temporal. In this method, two novel models were proposed, namely STANet-BAM and STANet-PAM; especially, the STANet-PAM aggregates multi-scale spatial-temporal attention representation to strengthen the capability to detect details in images, showing a good performance on the LEVIR-CD dataset with images from various urban areas.
Transformer-based models are almost the latest architecture and show promising performance in the computer vision field [45]. As a new kind of feature extractor, it doesn’t have convolution layers and pooling layers. However, it owns an outstanding capacity to extract semantic features and compute power. Pure transformer architectures are too complex to carry out the change detection work efficiently [45]. As a result, Hao Chen et al. [46] came up with a method of Bitemporal image Transformer (BiT) model, intending to explore the potential of transformers in the binary change detection task. They incorporated a transformer encoder into the model. Experiments on building datasets indicate that the model does achieve better results than models without the transformer structure [46].
More and more methods for change detection have been proposed. However, the applicability of these models for detecting the change of NCAs has not been evaluated systematically. In this paper, our first purpose is to automatically detect and derive the NCAs in the Core Region of Nanjing Jiangbei New Area, using high-resolution GF-2 data. Secondly, the five methods, including STANet-BASE, STANet-BAM, STANet-PAM, SNUNet, and BiT, are evaluated according to their performance in change detection. Results indicate that the performance of STANet-PAM ranks first among the five methods. Then we employ these five methods to detect the NCAs between images acquired in 2015 and 2021. Hopefully, change detection by using GF-2 data with satisfactory precision could be a momentous reference for urban development planning.

2. Materials and Methods

2.1. Study Area

This study chooses the Core Region of Nanjing Jiangbei New Area (Figure 1) as the study area because it is a representative area of fast urban development in China. In order to boost the economy of the north of Nanjing, Nanjing Jiangbei New Area was established on 2 July 2015, consisting of Pukou District, Liuhe District, and Baguazhou Subdistrict of Qixia District. The Core Region belongs to Pukou District and is located opposite Nanjing Hexi Newtown.
Since the Core Region was set up, it has been one of the most rapidly growing regions in China. This region used to be a mixture of rural buildings, farmland, and bare fields. Nevertheless, it has transformed into an area covered with large-scale residential areas, factories, highways, etc. Hence, the abundance of land surface is conducive to our change detection study.

2.2. Data

Our experiments were all conducted using GF-2 images. GF-2 was the first independently developed civil optical remote sensing satellite in China, carrying one 1 m high-resolution panchromatic camera and one 4 m multispectral camera [47]. The spatial resolution of subsatellite points can reach 0.8 m to the sub-meter level. It was successfully launched on 19 August 2014. Due to the features of sub-meter spatial resolution, high positioning accuracy, and rapid attitude maneuverability, GF-2 mainly provides application services for the Ministry of Land and Resources, the Ministry of Housing and Urban-Rural Development, and other departments. As a consequence, we apply bi-temporal images of GF-2 covering the Core Region of Jiangbei New Area for the training phase, including one obtained on 21 April 2015, and the other on 19 March 2020. As for predicting phase, we use one GF-2 image obtained on 14 January 2021. Each of GF-2 images comprises a multispectral image and a panchromatic image. The former consists of four spectral bands that are blue, green, red, and near-infrared. The data selected all have less than 10% cloud cover, so they can support the interpretation of ground objects rigorously.

2.3. Methods

In our study, we first preprocess and annotate GF-2 images. Then experiments with five network models, including STANet-BASE, STANet-BAM, STANet-PAM, SNUNet, and BiT, are carried out to evaluate the performance of each in change detection. At last, we apply them to predict the change of NCAs in the Core Region of Jiangbei New Area in 2021. Details are provided below.

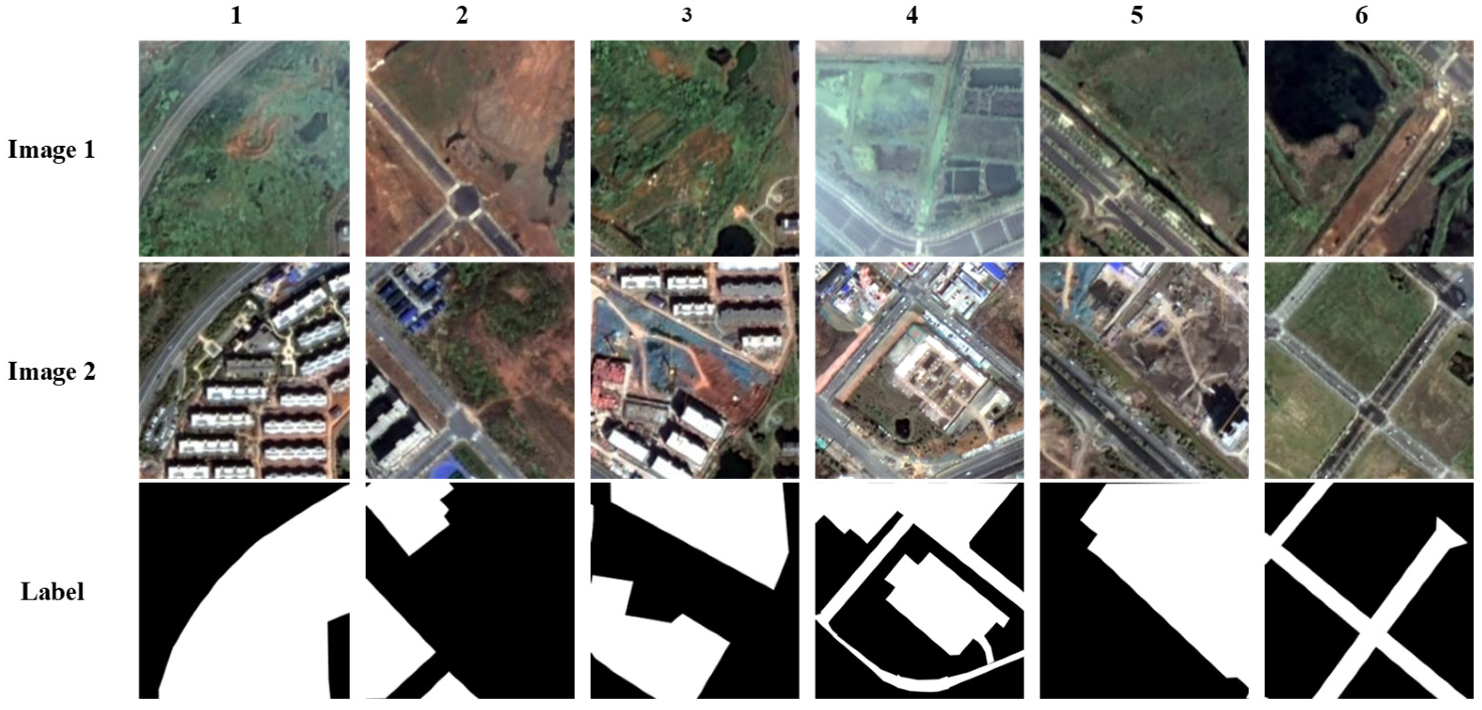
2.3.1. Dataset Preprocessing and Annotation

So far, few open datasets of NCAs have been available. Considering that we mainly intend to carry out the research on the Core Region of Jiangbei New Area, we establish a dataset of NCAs using GF-2 data. Before being trained, original data are preprocessed, annotated, split, and augmented. The pre-processing operation includes radiometric calibration with the FLAASH model, atmosphere correction, image fusion with Gram-Schmidt tool, and image-to-image registration. We complete the pre-processing with Environment for Visualizing Images (ENVI) software. At last, we obtain the fusion images with a spatial resolution of 1 m.
We only pay attention to the increase of constructed areas rather than both of increase and decrease. Due to the complex and diverse types of remote sensing objects, it is difficult to take all increase circumstances into consideration. Therefore, based on the reference of land use/land cover and the actual situation of our study area, this paper briefly defines the NCAs as follows: (a) The pre-images are covered with vegetation or farmland or obvious non-construction traces, while the post-images have obvious features of buildings; (b) the pre-images are covered with vegetation or farmland or obvious non-construction traces, while the post-images have obvious features of pushing or filling; (c) the pre-images are covered with vegetation or farmland or obvious non-construction traces, while the post-images have obvious road features.
According to the above-mentioned standards, we carry out visual interpretation of the bi-temporal images of the same space, vectorize the NCAs, and convert them into binary label maps. Figure 2 shows part of the dataset and their corresponding properties, in which the white part is the NCAs, and the black part is the unchanged areas. In order to meet the input requirement of the experiment models, the imagery selected are split into 509 slices with a size of 256 × 256. Then we divide the data into a training set, a validation set, and a test set in a ratio of about 7:2:1, which are next expanded sixfold, respectively, through vertical flipping, rotating 90 degrees, rotating 180 degrees, translating, and zooming in. At last, we acquire 2106 training data pairs, 588 validation data pairs, and 390 test data pairs.

2.3.2. The STANet-BASE, STANet-BAM, STANet-PAM, SNUNet, and BiT Model

This paper focuses on the solution of urban areas change detection between bi-temporal images based on innovative networks proposed lately in computer vision. Five network models, including STANet-BASE, STANet-BAM, STANet-PAM [44], SNUNet [41], and BiT [46], are employed to evaluate their performance of NCAs change detection, respectively.
The spatial-temporal attention neural network (STANet) is founded on the Siamese network and is inspired by the idea of acquiring illumination-invariant and misregistration-robust features via taking advantage of the spatial-temporal relationship. A feature extractor, an attention module, and a metric module are the three major structures of the STANet. First, in the light of a dense classification of change detection, the feature extractor utilizes ResNet18 for reference to design an FCN-like one, which keeps every layer but holds the global pooling layer and the fully connected layer of initial ResNet. Two images of different times are fed into the feature extractor to gain feature maps, respectively, after which the feature maps enter the attention module. In respect of the STANet-BASE model, we use a FCN network without modification for the purpose of comparison. One of the most significant creations of this model is the CD (Change Detection) self-attention mechanism. The CD self-attention mechanism is able to seize rich global spatial-temporal relationships among individual pixels. Hence, the network is likely to master more discriminative features. There are two types of attention modules in STANets, that is the basic spatial-temporal attention (BAM) module and the pyramid spatial-temporal attention (PAM) module. Think of the constituent elements in a source as being composed of a series of Keys and Values; In this case, an element Query in a given Target is constructed. By calculating the similarity or correlation between Query and each Key, the weight coefficient of each Key corresponding to Value is obtained, and then the weighted sum of values is calculated to obtain the final Attention Value, where Query, Key, Value tensor are obtained from input feature tensors through three different convolution layers, respectively. At last, the tensor that was learned from the attention module plus the original input feature tensor acquire the updated feature map output by BAM. For PAM module, it is stimulated by the architecture of PSPNet (Pyramid Scene Parsing Network) and is developed to better identify fine details in the way of associating the space-time attention context of various scales. PAM module designs four branches, which separate the feature tensor into sub-regions of different scales equally. Then BAMs are applied after the very four sub-regions, respectively, in order to acquire the local attention output at this scale. Then the outputs of four branches are concatenated and processed with convolution to develop a residual feature tensor. Finally, the original feature tensor plus the residual feature tensor creates the updated tensor. In terms of the change detection judgment, a contrastive loss is applied to distinguish the different distances between no-change pixel pairs and the change in the embedding space while dataset is training. In addition, when testing, a fixed threshold is set to generate change maps.
Take the STANet-PAM (Figure 3) as an example, we first input a pair of bi-temporal images into the network. After entering the feature extractor, we obtain two feature maps X1, X2, and stack the two into one feature tensor X. Then we have four branches, where the feature tensor is evenly separated into 1 × 1, 2 × 2, 4 × 4, 8 × 8 sub-regions. Four BAMs are used for each branch to generate a new residual feature tensor Y. The four tensors Y are combined to enter a convolution layer and add it to the initial tensor, so we acquire updated attention feature maps Z1, Z2. Finally, Z1 and Z2 are fed into the metric module, where they are firstly resized as the same size as the input images and distance are then calculated.
Influenced by DenseNet and NestedUNet, Fang et al proposed SNUNet, which consist of four components. The backbone of SNUNet is derived from Unet++. The input image goes through down-sampling, up-sampling, max-pooling, and transpose convolution in it and different features of bi-temporal images are extracted. Then the Siamese network acts as an encoder in this standard encoder and decoder structure. Two branches of the Siamese network that shared the same parameters are fed with bi-temporal images at the same time. Additionally, to better preserve fine-grained features, the dense skip connection mechanism is applied between the encoder and decoder. After that, we can acquire outputs of higher-dimensional features corresponding to two inputs. After the backbone concatenating feature layers of different levels together, the Ensemble Channel Attention Module (ECAM) composed of one residual block and two CAMs (Channel Attention Module) is used to compensate for the loss of effective information in deep layers. Several outstanding advantages of SNUNet are that it potentially prevents localization information from losing and improves semantic levels with dense connection and ECAM.
In contrast with the dense connection of SNUNet, BiT (Bitemporal image Transformer) models the context in the compact spacetime based on tokens, which represent the input images. On the foundation of a CNN backbone—ResNet18, BiT substitutes for the last convolutional stage of it. The first part of the model is several convolutional blocks that intend to gain feature maps of input images, on top of which, these feature maps go through BiT and then produce detected images. As the most significant element of this model, BiT is composed of a Siamese semantic tokenizer, a transformer encoder, and a Siamese transformer decoder. The former is designed to extract semantic tokens from feature maps of bi-temporal images. The middle one models the context between these tokens since the transformer is capable of utilizing the global semantic relationships in token-based space-time. The latter obtains pixel-level features through refining context-rich tokens. It’s worth noting that a compact set of tokens that represents high-level concepts and the use of a transformer in the token-based space-time make the BiT perform better in change detection than pure convolutions architectures.

2.4. Evaluation Metrics

This paper aims to detect the change of urban NCAs. Therefore, the results of detection can be divided into two categories: NCAs change and no change. The assessment problem is tackled by considering detecting change regions as a binary classification problem. The confusion matrix is the most commonly used accuracy evaluation criteria in binary classification problems. Consequently, this paper carries out accuracy evaluation on a foundation of the confusion matrix. The confusion matrix tabulates the number of predicted changes and the ground truth, including true positives (TP), true negatives (TN), false positives (FP), and false negatives (FN). From these statistics, we can acquire precision, recall, and F1_Score, which are adopted as metrics to estimate the performance of our five models. The ratio of correct change area samples to the total samples predicted as truth is demonstrated as Precision; Recall indicates the ratio of correct change area samples to the samples labeled as change area; F1_Score is the weighted harmonic average of Precision and Recall, which generally reflects the quality of whole performance [22]. Generally, the higher the F1_Score is, the more stable the corresponding network is. Still, we need to be careful that its value can’t be too high because that would cause overfitting. The metrics formulas are as follows:
Precision   = TP TP + FP
Recall = TP TP + FN
F 1 _ Score   = 2 Precision Recall Precision + Recall

3. Results

3.1. Overall Performance

In the deep neural network, loss functions are usually required to calculate the error between the final predicted value and the ground truth label [22], which serve as the basis of back-propagation as well. According to loss functions, the weight of nodes in the neural network is continuously updated during each iteration. The change detection task in our paper can be rendered as a binary classification of images [42] since the results of detection are either change or no change. Therefore, the loss function of the BiT model is cross-entropy. To optimize the network parameters, the loss value should be minimized. Different from the BiT model, the STANet-BASE, STANet-BAM, STANet-PAM, and SNUNet take the class imbalance into account. Class imbalance is not uncommon in change detection tasks because the proportion of change pixels is far more than no change pixels, which leads to bias in the network during the training phase [41]. As a consequence, the two structures both use special loss functions. For the STANets, a class-sensitive loss, also called batch-balanced contrastive loss (BLC) is designed. It judges not only the no change pixels but also the change ones. While the SNUNet applies a hybrid loss function (the combination of weighted cross-entropy loss and dice loss). The smaller the loss value is, the better the model performs.
The following contents are a concise explanation of the experiment settings for training our five models individually. Firstly, for STANett-BASE, STANet-BAM, STANet-PAM, they are operated with the same setting. The models are slightly altered on the foundation of ImageNet-pre-trained ResNet18 model. We set an initial learning rate to 10−3 and hold the same value till the 101st epoch. Then the learning rate is desidecayto decay linearly to 0 until the 200th epoch. Apart from these, the Adam solver is employed with a batch size of 4, a β 1 of 0.5, and a β 2 of 0.99. Secondly, the batch size of SNUNet we set is 16. We train for 100 epochs for the sake of converging and the initial learning rate is set to 10−3 with an attenuation of 0.5 per 8 epochs. The weights of each convolutional layer are initialized by the KaiMing normalization. For the last one, BiT, we apply stochastic gradient descent (SGD) with momentum to make it optimal. For the training process, the momentum and weight decay are set to 0.99 and 0.0005 separately. Furthermore, the initial learning rate is set to 0.01 and linearly decays to 0 until trained 200 epochs. For validation, it is carried on following each training epoch, and the finest model on the validation set is selected to do the test.
All of our experiments to evaluate the above five models were carried out on a workstation equipped with an NVIDIA Tesla T4 GPU, which was configured with Pytorch 1.6.0 environment.
Generally, a higher F1_Score indicates better performance of the model. As is clearly shown in Figure 4, the F1_Scores of five models all increase rapidly until the 20th epoch and after that they become steady. For STANets (BASE, BAM, PAM), their F1-Scores are higher than the other two. Among them, the STANet-PAM ranks first, followed by STANet-BAM and STANet-BASE. For SNUNet, it has the lowest value of about 0.66, even though its F1_Score was the most stable from epoch 20. The F1_Score curve of BiT fluctuates wildly, and its value is the second-lowest. Due to the highest F1_Score of STANet-PAM, it outperforms the other models.
In order to further compare the accuracy of the models, we figure out their precision, recall, and F1_Score. Table 1 illustrates the criteria of five methods and bold fonts represent the optimal values.
It can be seen in Table 1 that the SNUNet possesses the highest precision value of 0.821, which reveals the best capability to predict correct change areas samples to the total samples predicted as truth. The precision value of STANet-BASE, STANet-BAM, STANet-PAM, and BiT is 0.725, 0.775, 0.807, 0.719, correspondingly, among which BiT acquires the lowest value. As for the values of recall, STANet-BASE wins the highest value of 0.847 followed by STANet-BAM, STANet-PAM, SNUNet in turn and BiT is the lowest of 0.719 as well. F1_Score is the weighted harmonic average of precision and recall, through which we can comprehensively evaluate the model. The STANet-PAM acquires first place with 0.809 of its corresponding F1_Score, 0.014 ahead of the second one, STANet-BAM. The F1_Score of SNUNet is 0.775, second to last and the last is still the BiT method.
Taking all these metrics into consideration, we draw the conclusion that STANet-PAM has the optimal performance on account of its first rank in F1_Score and second place in precision.

3.2. Change Detection

In order to have a more intuitive comparison of the capacity of the five methods, Figure 5 illustrates several typical types of change detection results and from top to bottom are the pre-image, the post-image, the ground truth, the prediction results of STANet-BASE, STANet-BAM, STANet-PAM, SNUNet, and BiT, respectively. The change maps of the five methods are generally satisfactory and they are almost the same as the ground truth. Factors such as camera motion, change of light, and sensor noise, which are rendered as “non-semantic change” [41], can attribute to poor predictions in certain areas of maps. For the STANet-BASE model, its predictions are generally rough, where any change of constructed areas, vegetated, or bare land is detected as NCAs change ones (columns 1, 2, 3, 4). In addition, columns 6 and 7 represent the occasion in which the STANet-BASE model determines the area where the color of the building alters due to the lighting as a change area. However, the STANet-BASE model is better at detecting changes in large size areas compared with other models. The STANet-BAM model performs more efficiently in distinguishing the “son-semantic change”. However, its one shortcoming is that it can’t detect clear edges of change areas, which is also a common problem on other models. From the display of predicted change maps, the prominent one is the STANet-PAM model, which is consistent with the analysis of the F1_Score curve (Figure 4) and metrics (Table 1). As we can see in column 6, the color change of the edge part of the cross-river highway and some certain areas on both sides of the river due to sunlight successfully avoid being identified as change areas. The result verifies that STANet-PAM model outperforms others in being unaffected by light-induced color changes. Furthermore, in contrast with other four models whose detection results are contiguous, we are satisfied that details in images are detected more accurately by the STANet-PAM model, such as columns 1 and 5. The pyramid structure making use of global spatial-temporal context information accounts for the ability to recognize fine details and robustness to color changes. Thanks to the densely skip connections between encoder and decoder together with decoder and encoder, the SNUNet model performs better at the certainty of edge pixels of the change area. Therefore, we can find that the edge is sharper in row g. Though the BiT model brings in the transformer mechanism, whose strong representation ability has achieved notable performance in hyperspectral image classification and so on [46], it fails to predict change areas precisely in our experiment. Specifically, the BiT model is more affected by the change of light or color (columns 5, 6) and the existence of building shadows (column 2).

3.3. Change Detection of the Core Region of Jiangbei New Area in 2021

The development the Core Region of Jiangbei New Area has been attached great importance since its establishment. Its urbanization rate is so rapid that new constructions spring up widely. Proper monitoring of NCAs is necessary for healthy development. Based on the five models, we carry out the change detection experiments in the Core Region of Jiangbei New Area from 2015 to 2021. Figure 6 displays the change detection result.
Generally, there is a large-scale expansion of NCAs in the study area. After comparing it with the original image of 2015, we find that the majority of NCAs detected are in areas were used to be bare lands or there were few buildings, which support sufficient space for the construction. The NCAs are composed of a large area of factory buildings and contiguous residential areas. Moreover, we discover that NCAs prefer areas along the main roads. District (a) and (b) of STANet-BASE represent the central business district and the International Health City. Therefore, the NCAs in these two districts are more contiguous and compact, compared with residential buildings, which is probably due to the relatively large size of the office buildings or the hospital buildings. In district (c) of the change maps, we can only see the new roads clearly but no new constructed buildings. Before we obtained the image of 2021, district (c) had not been developed except that the road construction work was finished. While for the district (d), it has been basically developed and residential buildings make up most of the NCAs, which explains why the white parts of the change maps are mostly spread out at some distance.
Given that the detection results of NCAs are raster data, we count the number of white pixels in the change maps and combine it with the image resolution. Then the area of NCAs can be figured out. The results (Figure 7) detected by the STANet-BASE, STANet-BAM, STANet-PAM, SNUNet, and BiT model are around 5.434265 km2, 5.032052 km2, 4.492543 km2, 4.488993 km2, and 4.936852 km2, respectively.

4. Discussion

This paper uses deep learning techniques to detect the change of NCAs in the Core Region of Jiangbei New Area. Compared with traditional methods, such as Change Vector Analysis (CVA) and Principal Component Analysis (PCA) [14], deep learning methods have gained broad attention due to their strong learning ability. Owing to the multiple processing layers that are designed to learn and represent data, deep learning methods report great superiorities in capturing complex structures from remote sensing images [21,48]. By employing deep learning methods, a few studies on constructed areas extraction and change detection have been conducted, such as literatures [40,49,50].
Till now, two mainstream change detection methods are post-classification comparison methods and direct comparison methods [25]. Amin et al. [51] make full use of pre-trained CNN to extract features of zooming levels bi-temporal images and then compare the concatenated ones to obtain final change map. Their results suggest that this method is efficient in building change. In addition, Wan et al. [52] incorporate multitemporal segmentation with compound classification to achieve classification maps, which are then compared to generate change map. Experimental validation based on urban areas dataset demonstrates its usefulness. Theoretically, direct comparison methods of change detection show more effectiveness, which saves the step of classification and detects change areas straight. Sublime et al. [53] present a deep-learning approach to identify changes, especially changes of buildings or roads, between two remote sensing images taken before and after the tsunami. Their study shows that the proposed method outperforms others and has a quicker analysis speed.
In direct change detection field, before the transformer mechanism was proposed, CNN-based methods are the most widely used. Although CNN has great feature learning ability, its high-level features contain more semantic information but less pixel-level information. Apart from this, the correlations between pixel pairs fail to be utilized properly [54]. Compared with CNNs, transformer networks have an edge on effective receptive field (REF), which is beneficial for shaping context between pixel pairs. In [34] and [46], two transformer-based methods are proposed, respectively, namely a ChangeFormer architecture and a BiT architecture. The authors verify the outstanding performance of the transformer on DSIFN-CD dataset and LEVIR-CD dataset. Considering that so many new methods for direct change detection are constantly being proposed, there is little research to systematically compare the effectiveness of these methods for a certain study area. Therefore, we evaluated the change detection performance of these five models, including STANet-BASE, STANet-BAM, STANet-PAM, SNUNet, and BiT model, in the Core Region of Jiangbei New Area. However, the BiT model fails to achieve satisfactory result in our study. We suspect that the insufficiency of training dataset may account for the low accuracy. Therefore, we can also draw the conclusion that transformer-based methods need adequate training datasets to achieve ideal change detection results. While comparing the methods, we also achieved the areas of NCAs in the Core Region of Jiangbei New Area, which can be a critical reference for sustainable urban development planning. Another important limitation of our study lies in the fact that there is no open dataset for the NCAs in Nanjing. Although our STANet-PAM model has yielded satisfactory results, the dataset we made in this study cannot represent the change types of NCAs in all areas of Nanjing. Hence, more efforts are needed to increase the size and complexity of our dataset. An additional uncontrolled factor is that taller buildings can have shadows that appear black in the image. The direction and length of shadows are affected by the height of building as well as the height and direction of sun, which is easy to affect the judgment of whether or not there has occurred changes. Considerably more work on these issues would help us to establish a promising model of outstanding precision in NCAs change detection field.

5. Conclusions

The present study is designed to evaluate and compare the change detection performance of the STANet-BASE, STANet-BAM, STANet-PAM, SNUNet, and BiT models individually on the GF-2 dataset for the NCAs in the Core Region of Nanjing Jiangbei New Area. Taking F1_Score, and precision into consideration, we achieve the conclusion that the STANet-PAM model is the most advantageous in terms of change detection under our experimental conditions. Furthermore, we input the dataset of 2015 and 2021 into the five models to identify the NCAs and results are 5.434265 km2, 5.032052 km2, 4.492543 km2, 4.488993 km2, and 4.936852 km2, corresponding to the STANet-BASE, STANet-BAM, STANet-PAM, SNUNet, and BiT model.

Author Contributions

Conceptualization, S.Z. and Z.D.; methodology, S.Z. and Z.D.; software, S.Z. and Z.D.; validation, S.Z. and Z.D.; data curation, S.Z.; writing—original draft preparation, S.Z.; writing—review and editing, S.Z. and Z.D.; visualization, S.Z.; supervision, G.W.; project administration, S.Z.; funding acquisition, G.W. All authors have read and agreed to the published version of the manuscript.

Funding

This research was funded by the National Natural Science Foundation of China, grant number GZ1447 and 41875094. The APC was funded by the National Natural Science Foundation of China (GZ1447).

Data Availability Statement

Not applicable.

Acknowledgments

This study is financially supported by the National Natural Science Foundation of China (GZ1447, 41875094), National College Students’ Innovation and Entrepreneurship Training Program (202110300048).

Conflicts of Interest

The authors declare no conflict of interest.

References

  1. Guan, X.L.; Wei, H.K.; Lu, S.S.; Dai, Q.; Su, H.J. Assessment on the urbanization strategy in China: Achievements, challenges and reflections. Habitat Int. 2018, 71, 97–109. [Google Scholar] [CrossRef]
  2. Kuang, B.; Lu, X.; Han, J.; Fan, X.; Zuo, J. How urbanization influence urban land consumption intensity: Evidence from China. Habitat Int. 2020, 100, 102103. [Google Scholar] [CrossRef]
  3. Available online: http://www.stats.gov.cn/xxgk/sjfb/zxfb2020/202202/t20220228_1827971.html (accessed on 2 April 2022).
  4. Luo, J.; Zhang, X.; Wu, Y.; Shen, J.; Shen, L.; Xing, X. Urban land expansion and the floating population in China: For production or for living? Cities 2018, 74, 219–228. [Google Scholar] [CrossRef]
  5. Seydi, S.; Hasanlou, M.; Amani, M. A New End-to-End Multi-Dimensional CNN Framework for Land Cover/Land Use Change Detection in Multi-Source Remote Sensing Datasets. Remote Sens. 2020, 12, 2010. [Google Scholar] [CrossRef]
  6. Desdemoustier, J.; Crutzen, N.; Giffinger, R. Municipalities’ understanding of the Smart City concept: An exploratory analysis in Belgium. Technol. Forecast. Soc. Chang. 2019, 142, 129–141. [Google Scholar] [CrossRef]
  7. Zha, Y.; Gao, J.; Ni, S. Use of normalized difference built-up index in automatically mapping urban areas from TM imagery. Int. J. Remote Sens. 2003, 24, 583–594. [Google Scholar] [CrossRef]
  8. Varshney, A. Improved NDBI differencing algorithm for built-up regions change detection from remote-sensing data: An automated approach. Remote Sens. Lett. 2013, 4, 504–512. [Google Scholar] [CrossRef]
  9. He, C.; Shi, P.; Xie, D.; Zhao, Y. Improving the normalized difference built-up index to map urban built-up areas using a semiautomatic segmentation approach. Remote Sens. Lett. 2010, 1, 213–221. [Google Scholar] [CrossRef] [Green Version]
  10. Xu, L.; Jing, W.; Song, H.; Chen, G. High-Resolution Remote Sensing Image Change Detection Combined with Pixel-Level and Object-Level. IEEE Access 2019, 7, 78909–78918. [Google Scholar] [CrossRef]
  11. Lee, H.; Lee, K.S.; Kim, J.H.; Na, Y.; Park, J.; Choi, J.P.; Hwang, J.Y.Y. Local Similarity Siamese Network for Urban Land Change Detection on Remote Sensing Images. IEEE J. Sel. Top. Appl. Earth Obs. Remote Sens. 2021, 14, 4139–4149. [Google Scholar] [CrossRef]
  12. Chen, G.; Hay, G.J.; Carvalho, L.M.; Wulder, M.A. Object-based change detection. Int. J. Remote Sens. 2012, 33, 4434–4457. [Google Scholar] [CrossRef]
  13. Wang, X.; Liu, S.; Du, P.; Liang, H.; Xia, J.; Li, Y. Object-Based Change Detection in Urban Areas from High Spatial Resolution Images Based on Multiple Features and Ensemble Learning. Remote Sens. 2018, 10, 276. [Google Scholar] [CrossRef] [Green Version]
  14. Afaq, Y.; Manocha, A. Analysis on change detection techniques for remote sensing applications: A review. Ecol. Inform. 2021, 63, 101310. [Google Scholar] [CrossRef]
  15. Zhou, Y.; Song, Y.; Cui, S.; Zhu, H.; Sun, J.; Qin, W. A Novel Change Detection Framework in Urban Area Using Multilevel Matching Feature and Automatic Sample Extraction Strategy. IEEE J. Sel. Top. in Appl. Earth Obs. Remote Sens. 2021, 14, 3967–3987. [Google Scholar] [CrossRef]
  16. Wu, J.; Li, B.; Qin, Y.; Ni, W.; Zhang, H.; Fu, R.; Sun, Y. A multiscale graph convolutional network for change detection in homogeneous and heterogeneous remote sensing images. Int. J. Appl. Earth Obs. Geoinf. 2021, 105, 102615. [Google Scholar] [CrossRef]
  17. Burbridge, S.; Zhang, Y.Z.Y. A neural network based approach to detecting urban land cover changes using Landsat TM and IKONOS imagery. In Proceedings of the 22nd Digital Avionics Systems Conference. Proceedings (Cat. No.03CH37449), Berlin, Germany, 22–23 May 2003; pp. 157–161. [Google Scholar] [CrossRef]
  18. Doxani, G.; Siachalou, S.; Tsakiri-Strati, M. An object-oriented approach to urban land cover change detection. Int. Arch. Photogramm. Remote Sens. Spat. Inf. Sci. 2008, 37, 1655–1660. [Google Scholar]
  19. Li, Z.; Wang, P.; Fan, M.; Long, Y. Method of urban land change detection that is based on GF-2 high-resolution RS images. Int. J. Image Data Fusion 2020, 1–18. [Google Scholar] [CrossRef]
  20. Uamkasem, B.; Chao, H.L.; Jiantao, B. Regional land use dynamic monitoring using Chinese GF high resolution satellite data. In Proceedings of the 2017 International Conference on Applied System Innovation (ICASI), Sapporo, Japan, 13–17 May 2017; pp. 838–841. [Google Scholar] [CrossRef]
  21. Yuan, Q.; Shen, H.; Li, T.; Li, Z.; Li, S.; Jiang, Y.; Xu, H.; Tan, W.; Yang, Q.; Wang, J.; et al. Deep learning in environmental remote sensing: Achievements and challenges. Remote Sens. Environ. 2020, 241, 111716. [Google Scholar] [CrossRef]
  22. Dong, Z.; Wang, G.; Amankwah, S.O.Y.; Wei, X.; Hu, Y.; Feng, A. Monitoring the summer flooding in the Poyang Lake area of China in 2020 based on Sentinel-1 data and multiple convolutional neural networks. Int. J. Appl. Earth Obs. Geoinf. J. 2021, 102, 102400. [Google Scholar] [CrossRef]
  23. Xu, H.; Zhu, P.; Luo, X.; Xie, T.; Zhang, L. Extracting Buildings from Remote Sensing Images Using a Multitask Encoder-Decoder Network with Boundary Refinement. Remote Sens. 2022, 14, 564. [Google Scholar] [CrossRef]
  24. De Lima, R.P.; Marfurt, K.; Duarte, D.; Bonar, A. Progress and Challenges in Deep Learning Analysis of Geoscience Images. In Proceedings of the 81st EAGE Conference and Exhibition 2019, London, UK, 3–6 June 2019; Volume 1, pp. 1–5. [Google Scholar] [CrossRef]
  25. Gao, S.; Li, W.; Sun, K.; Wei, J.; Chen, Y.; Wang, X. Built-Up Area Change Detection Using Multi-Task Network with Object-Level Refinement. Remote Sens. 2022, 14, 957. [Google Scholar] [CrossRef]
  26. Wu, C.; Du, B.; Cui, X.; Zhang, L. A post-classification change detection method based on iterative slow feature analysis and Bayesian soft fusion. Remote Sens. Environ. 2017, 199, 241–255. [Google Scholar] [CrossRef]
  27. Ji, S.; Shen, Y.; Lu, M.; Zhang, Y. Building Instance Change Detection from Large-Scale Aerial Images using Convolutional Neural Networks and Simulated Samples. Remote Sens. 2019, 11, 1343. [Google Scholar] [CrossRef] [Green Version]
  28. Nemoto, K.; Imaizumi, T.; Hikosaka, S.; Hamaguchi, R.; Sato, M.; Fujita, A. Building change detection via a combination of CNNs using only RGB aerial imageries. In Remote Sensing Technologies and Applications in Urban Environments II; International Society for Optics and Photonics: Warsaw, Poland, 2017; Volume 10431, p. 104310J. [Google Scholar] [CrossRef]
  29. Sun, Y.; Zhang, X.; Huang, J.; Wang, H.; Xin, Q. Fine-Grained Building Change Detection from Very High-Spatial-Resolution Remote Sensing Images Based on Deep Multitask Learning. IEEE Geosci. Remote Sens. Lett. 2020, 19, 1–5. [Google Scholar] [CrossRef]
  30. Chughtai, A.H.; Abbasi, H.; Karas, I.R. A review on change detection method and accuracy assessment for land use land cover. Remote Sens. Appl. Soc. Environ. 2021, 22, 100482. [Google Scholar] [CrossRef]
  31. Deng, J.S.; Wang, K.; Deng, Y.H.; Qi, G.J. PCA-based land-use change detection and analysis using multitemporal and multisensor satellite data. Int. J. Remote Sens. 2008, 29, 4823–4838. [Google Scholar] [CrossRef]
  32. Coppin, P.; Jonckheere, I.; Nackaerts, K.; Muys, B.; Lambin, E. Digital change detection methods in ecosystem monitoring: A review. Int. J. Remote Sens. 2004, 25, 1565–1596. [Google Scholar] [CrossRef]
  33. Zhang, C.; Yue, P.; Tapete, D.; Jiang, L.; Shangguan, B.; Huang, L.; Liu, G. A deeply supervised image fusion network for change detection in high resolution bi-temporal remote sensing images. ISPRS J. Photogramm. Remote Sens. 2020, 166, 183–200. [Google Scholar] [CrossRef]
  34. Bandara, W.G.C.; Patel, V.M. A Transformer-Based Siamese Network for Change Detection. arXiv 2022, arXiv:2201.01293. [Google Scholar]
  35. Zhu, X.X.; Tuia, D.; Mou, L.; Xia, G.-S.; Zhang, L.; Xu, F.; Fraundorfer, F. Deep Learning in Remote Sensing: A Comprehensive Review and List of Resources. IEEE Geosci. Remote Sens. Mag. 2017, 5, 8–36. [Google Scholar] [CrossRef] [Green Version]
  36. Gupta, A.; Welburn, E.; Watson, S.; Yin, H. CNN-Based Semantic Change Detection in Satellite Imagery. In International Conference on Artificial Neural Networks, Munich, Germany, 17–19 September 2019; Springer: Cham, Switzerland, 2019; pp. 669–684. [Google Scholar] [CrossRef]
  37. Zhang, Z.; Vosselman, G.; Gerke, M.; Tuia, D.; Yang, M.Y. Change detection between multimodal remote sensing data using siamese CNN. arXiv 2018, arXiv:1807.09562. [Google Scholar]
  38. Saha, S.; Bovolo, F.; Bruzzone, L. Building Change Detection in VHR SAR Images via Unsupervised Deep Transcoding. IEEE Trans. Geosci. Remote Sens. 2020, 59, 1917–1929. [Google Scholar] [CrossRef]
  39. Lyu, H.; Lu, H. A deep information based transfer learning method to detect annual urban dynamics of Beijing and New York from 1984–2016. In Proceedings of the 2017 IEEE International Geoscience and Remote Sensing Symposium (IGARSS), Fort Vorth, TX, USA, 23–28 July 2017; pp. 1958–1961. [Google Scholar] [CrossRef]
  40. Caye Daudt, R.; Le Saux, B.; Boulch, A.; Gousseau, Y. Urban change detection for multispectral Earth observation using Convolutional Neural Networks. In Proceedings of the IEEE International Geoscience and Remote Sensing Symposium (IGARSS’2018), Valencia, Spain, 22–27 July 2018; pp. 2115–2118. [Google Scholar] [CrossRef] [Green Version]
  41. Fang, S.; Li, K.; Shao, J.; Li, Z. SNUNet-CD: A Densely Connected Siamese Network for Change Detection of VHR Images. IEEE Geosci. Remote Sens. Lett. 2021, 19, 1–5. [Google Scholar] [CrossRef]
  42. Jiang, H.; Hu, X.; Li, K.; Zhang, J.; Gong, J.; Zhang, M. PGA-SiamNet: Pyramid Feature-Based Attention-Guided Siamese Network for Remote Sensing Orthoimagery Building Change Detection. Remote Sens. 2020, 12, 484. [Google Scholar] [CrossRef] [Green Version]
  43. Dong, H.; Ma, W.; Jiao, L.; Liu, F.; Li, L. A Multiscale Self-Attention Deep Clustering for Change Detection in SAR Images. IEEE Trans. Geosci. Remote Sens. 2021, 60, 1–16. [Google Scholar] [CrossRef]
  44. Chen, H.; Shi, Z. A Spatial-Temporal Attention-Based Method and a New Dataset for Remote Sensing Image Change Detection. Remote Sens. 2020, 12, 1662. [Google Scholar] [CrossRef]
  45. Wang, L.; Fang, S.; Zhang, C.; Li, R.; Duan, C. Efficient Hybrid Transformer: Learning Global-local Context for Urban Scene Segmentation. arXiv 2021, arXiv:2109.08937. [Google Scholar]
  46. Chen, H.; Qi, Z.; Shi, Z. Remote Sensing Image Change Detection with Transformers. IEEE Trans. Geosci. Remote Sens. 2021, 60, 1–14. [Google Scholar] [CrossRef]
  47. Ren, K.; Sun, W.; Meng, X.; Yang, G.; Du, Q. Fusing China GF-5 Hyperspectral Data with GF-1, GF-2 and Sentinel-2A Multispectral Data: Which Methods Should Be Used? Remote Sens. 2020, 12, 882. [Google Scholar] [CrossRef] [Green Version]
  48. Voulodimos, A.; Doulamis, N.; Doulamis, A.; Protopapadakis, E. Deep Learning for Computer Vision: A Brief Review. Comput. Intell. Neurosci. 2018, 2018, 7068349. [Google Scholar] [CrossRef]
  49. Huang, X.; Cao, Y.; Li, J. An automatic change detection method for monitoring newly constructed building areas using time-series multi-view high-resolution optical satellite images. Remote Sens. Environ. 2020, 244, 111802. [Google Scholar] [CrossRef]
  50. Li, L.; Wang, C.; Zhang, H.; Zhang, B.; Wu, F. Urban Building Change Detection in SAR Images Using Combined Differential Image and Residual U-Net Network. Remote Sens. 2019, 11, 1091. [Google Scholar] [CrossRef] [Green Version]
  51. El Amin, A.M.; Liu, Q.; Wang, Y. Zoom out CNNs features for optical remote sensing change detection. In Proceedings of the 2017 2nd International Conference on Image, Vision and Computing (ICIVC), Chengdu, China, 2–4 June 2017; pp. 812–817. [Google Scholar]
  52. Wan, L.; Xiang, Y.; You, H. A Post-Classification Comparison Method for SAR and Optical Images Change Detection. IEEE Geosci. Remote Sens. Lett. 2019, 16, 1026–1030. [Google Scholar] [CrossRef]
  53. Sublime, J.; Kalinicheva, E. Automatic Post-Disaster Damage Mapping Using Deep-Learning Techniques for Change Detection: Case Study of the Tohoku Tsunami. Remote Sens. 2019, 11, 1123. [Google Scholar] [CrossRef] [Green Version]
  54. Zhang, Y.; Zhang, S.; Li, Y.; Zhang, Y. Single- and Cross-Modality Near Duplicate Image Pairs Detection via Spatial Transformer Comparing CNN. Sensors 2021, 21, 255. [Google Scholar] [CrossRef]
Figure 1. The spatial location of the Core Region of Jiangbei New Area.
Remotesensing 14 02874 g001
Figure 2. Examples of the original GF-2 images of 2015 and 2020 and their corresponding labels. Columns 1, 2, 3, 4 are the representations of change from vegetation or farmland or obvious non-construction area to obvious building area, and Column 5 is the representation of change from vegetation to obvious pushing and filling area, and Column 6 is the representation of change from vegetation to road.
Remotesensing 14 02874 g002
Figure 3. Illustration of STANet-PAM model. Our bi-temporal images turn into two feature maps after going through the Feature Extractor. Then the PAM self-attention module will update the two feature maps as two attention maps. Finally, the Metric Module generates an output using distance algorithms. (a) represents Feature Extractor, (b) represents BAM module, (c) represents PAM module.
Remotesensing 14 02874 g003
Figure 4. The F1_Scores of the STANet-BASE, STANet-BAM, STANet-PAM, SNUNet, and BiT. Each epoch contains 1000 iterations.
Remotesensing 14 02874 g004
Figure 5. Comparison of change detection outputs. (a) Image 1 in 2015, (b) Image 2 in 2020, (c) ground truth and result from (d) STANet-BASE, (e) STANet-BAM, (f) STANet-PAM, (g) SNUNet, and (h) BiT models individually. White and black regions denote the change area and no change area, respectively.
Remotesensing 14 02874 g005
Figure 6. The map of newly constructed areas of the Core Region of Jiangbei New Area from 2015 to 2021, detected by STANet-BASE, STANet-BAM, STANet-PAM, SNUNet, BiT.
Remotesensing 14 02874 g006
Figure 7. The total areas of new construction of the Core Region of Jiangbei New Area from 2015 to 2021, detected by STANet-BASE, STANet-BAM, STANet-PAM, SNUNet, BiT.
Remotesensing 14 02874 g007
Table 1. The precision, recall, and F1 score of the STANet-BASE, STANet-BAM, STANet-PAM, SNUNet, and BiT. The bold font demonstrates that the value of the corresponding metric is the best.
MethodPrecisionRecallF1_Score
STANet-BASE0.7250.8470.781
STANet-BAM0.7700.8160.795
STANet-PAM0.8070.8100.809
SNUNet0.8210.7340.775
BiT0.7190.7190.745
Publisher’s Note: MDPI stays neutral with regard to jurisdictional claims in published maps and institutional affiliations.

