
Assessing Land Subsidence-Inducing Factors in the Shandong Province, China, by Using PS-InSAR Measurements

Abstract
:
1. Introduction
2. Study Area and Data
2.1. Study Area
2.2. Data Source
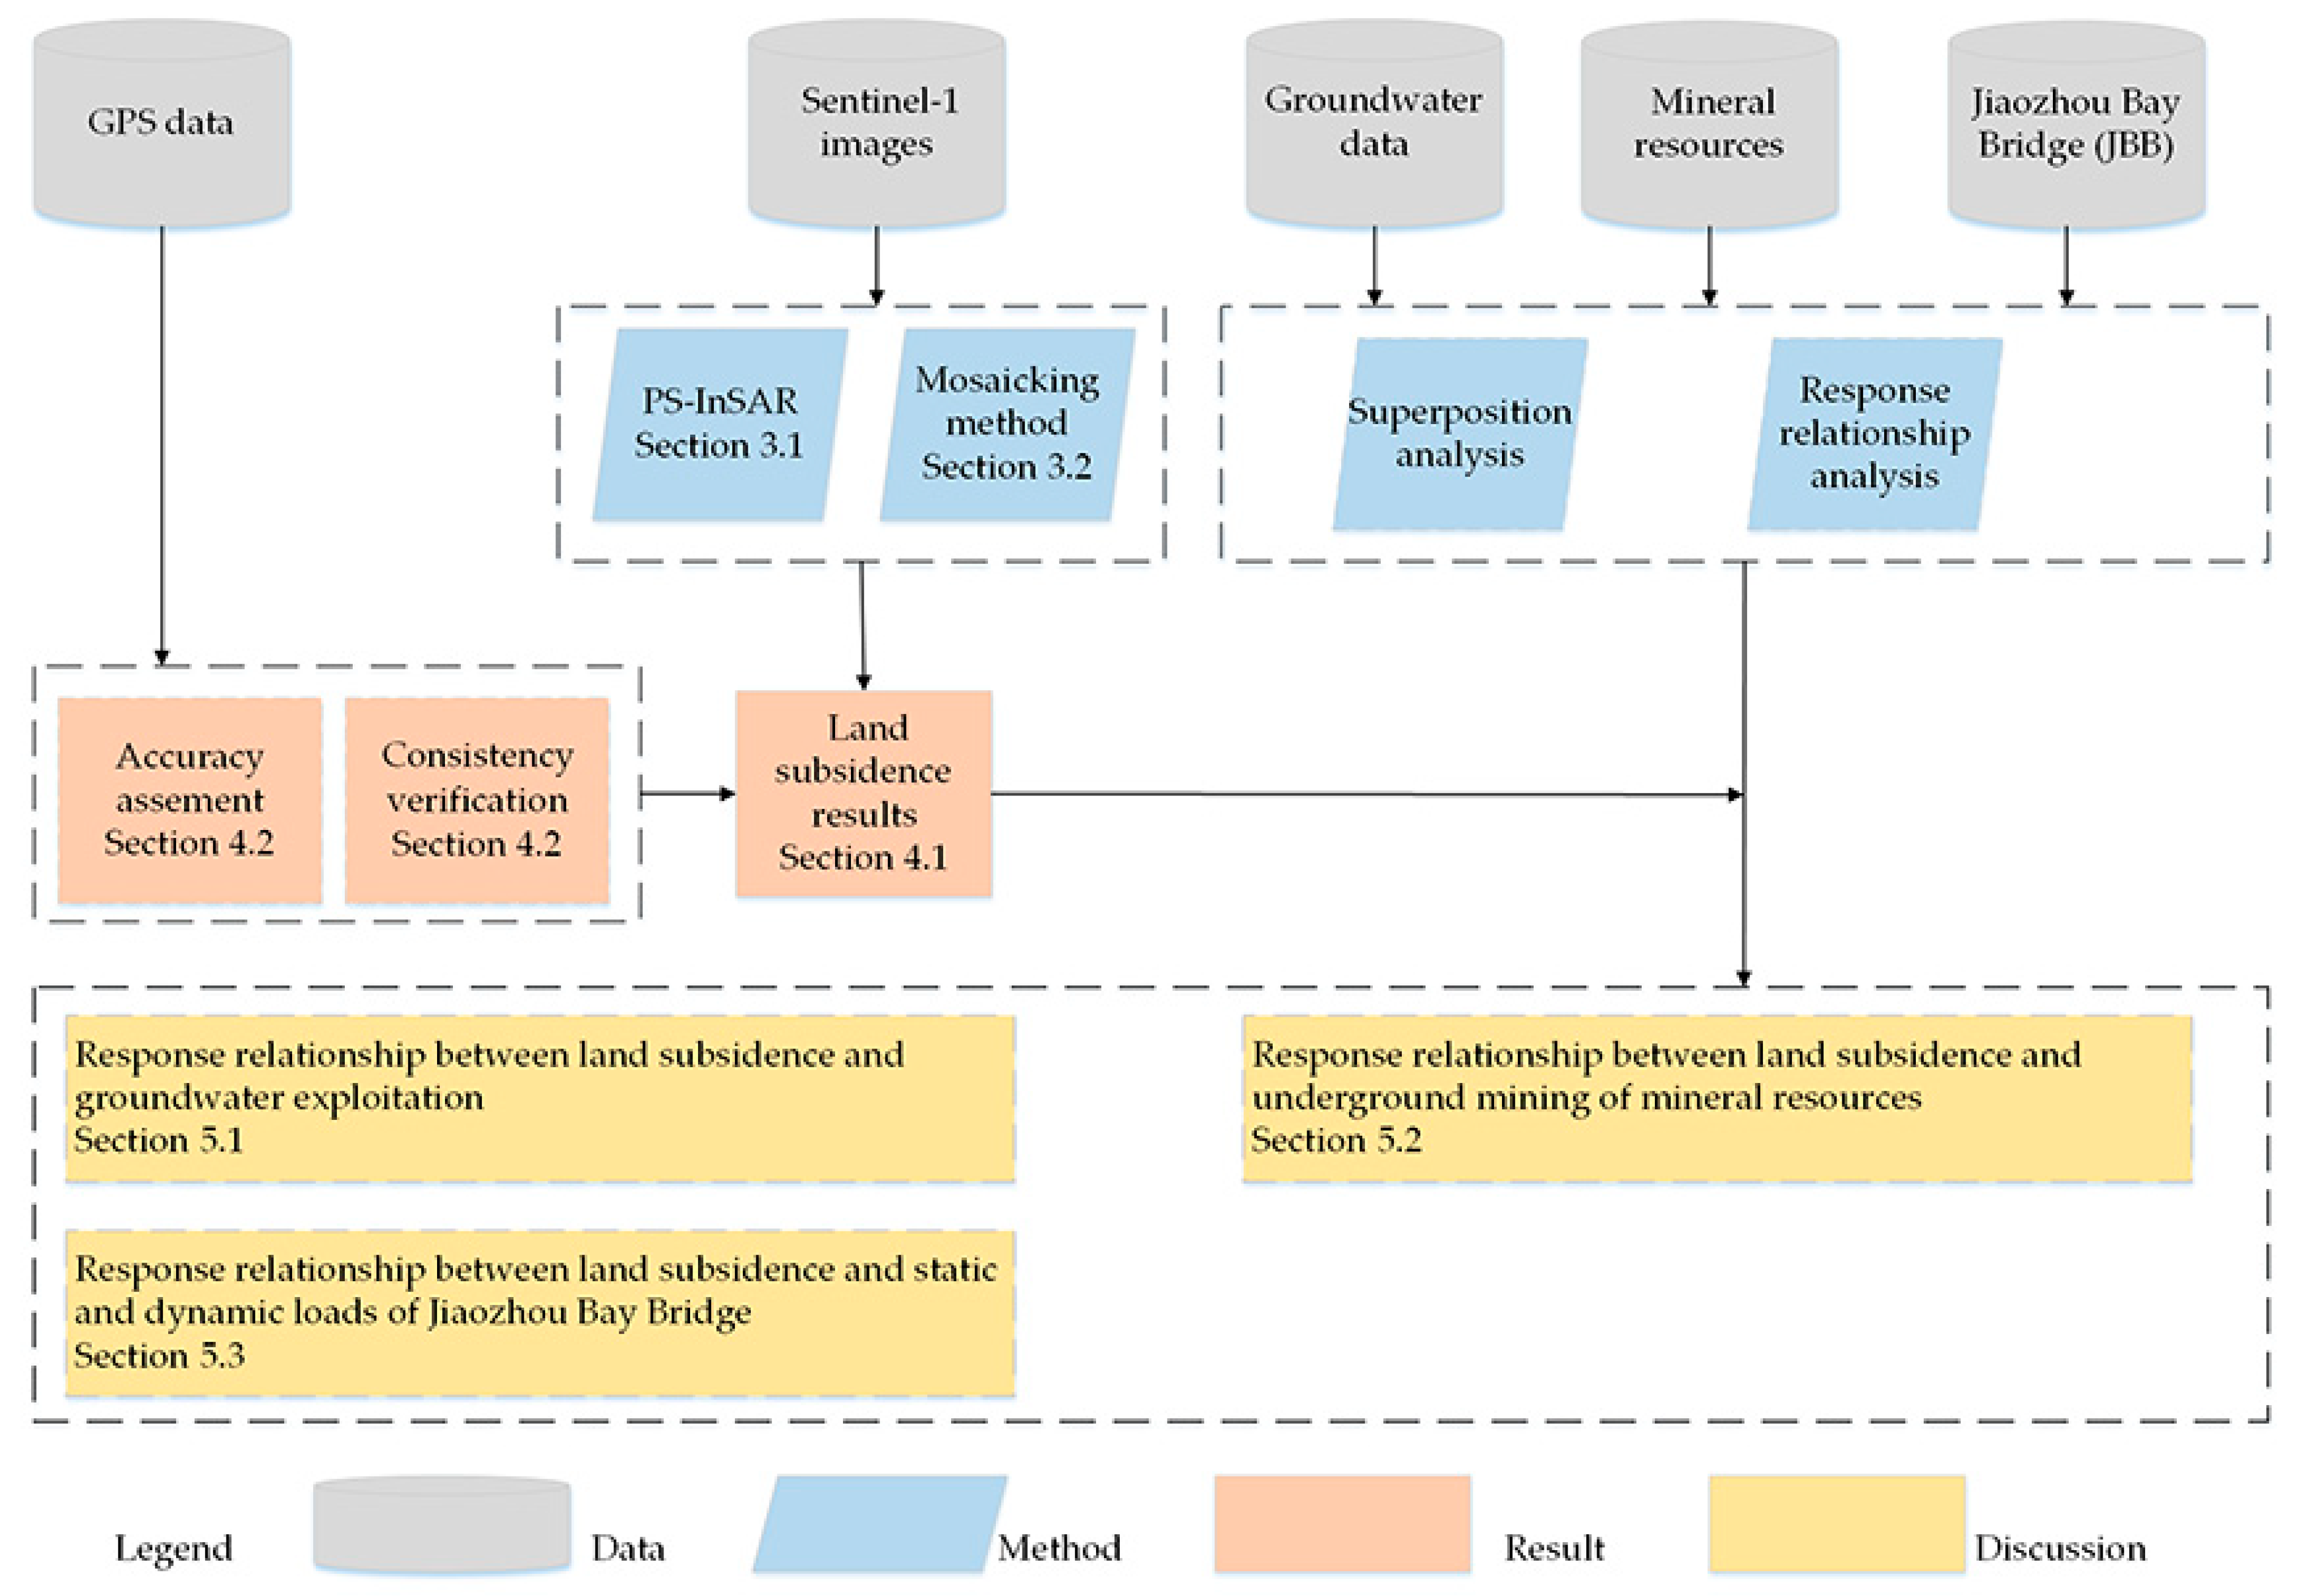
3. Methods
3.1. PS-InSAR Processing of the Sentinel-1 Datasests
3.2. Merging the Land Subsidence Monitoring Results
4. Results
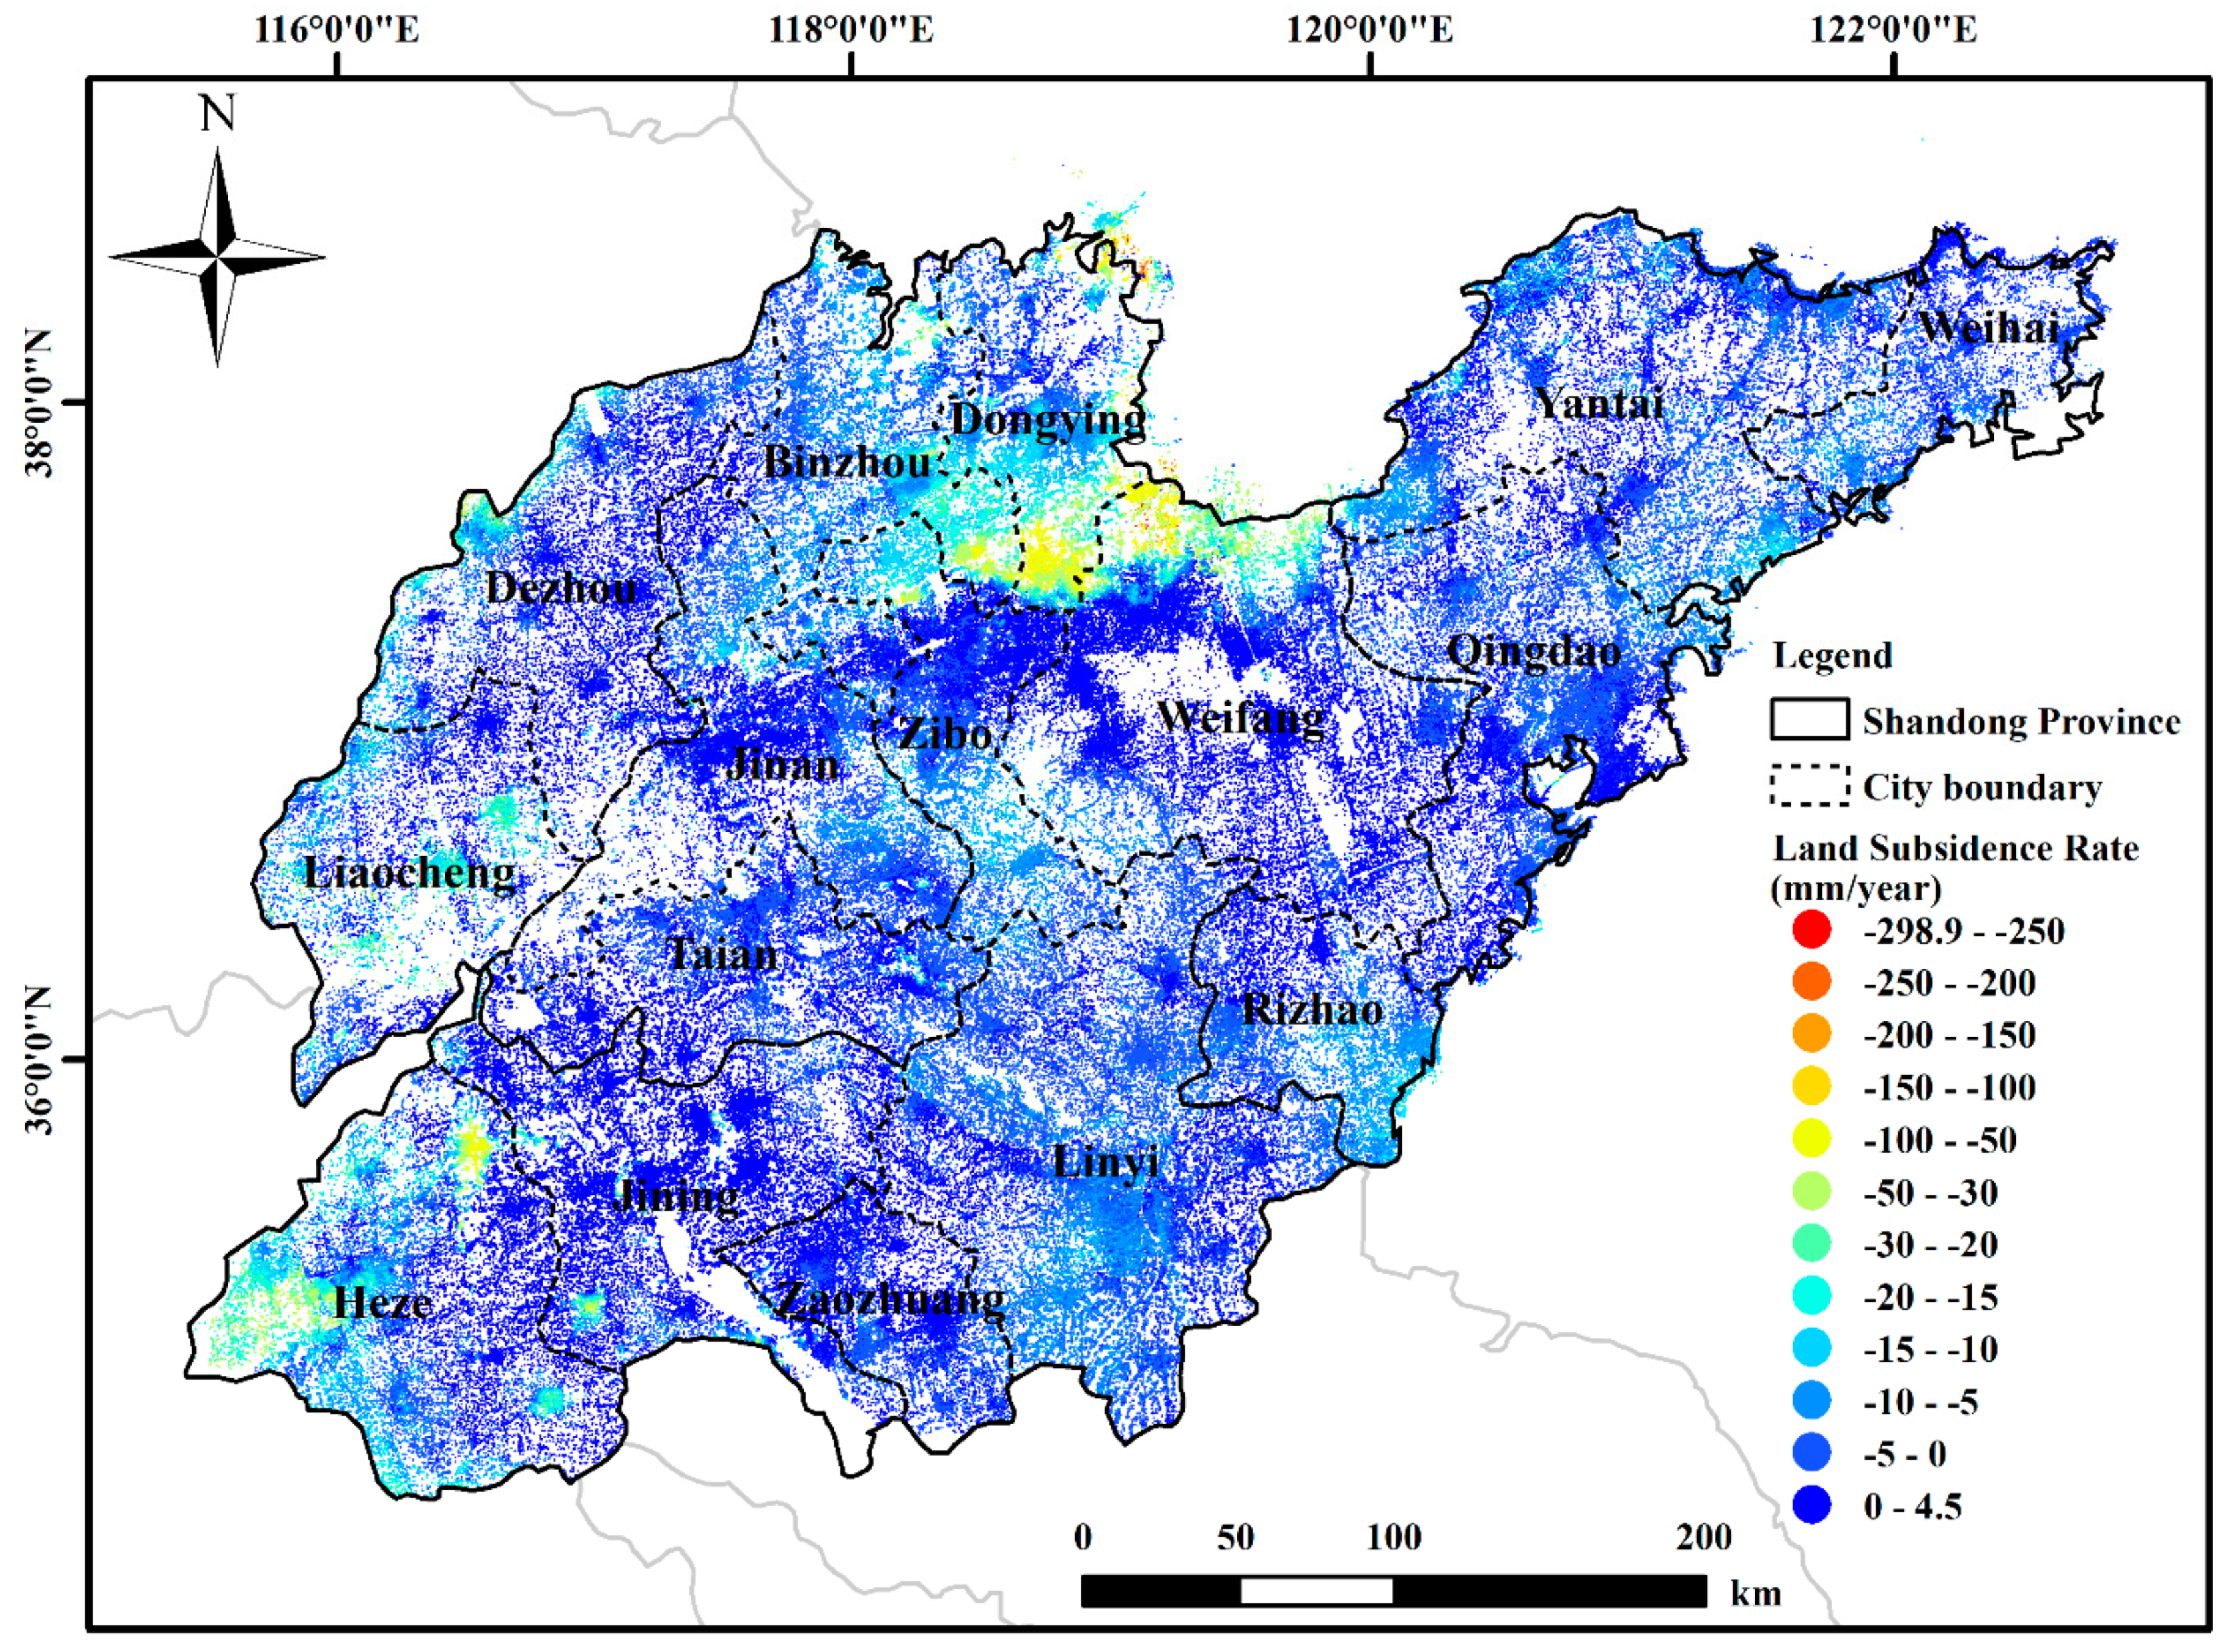
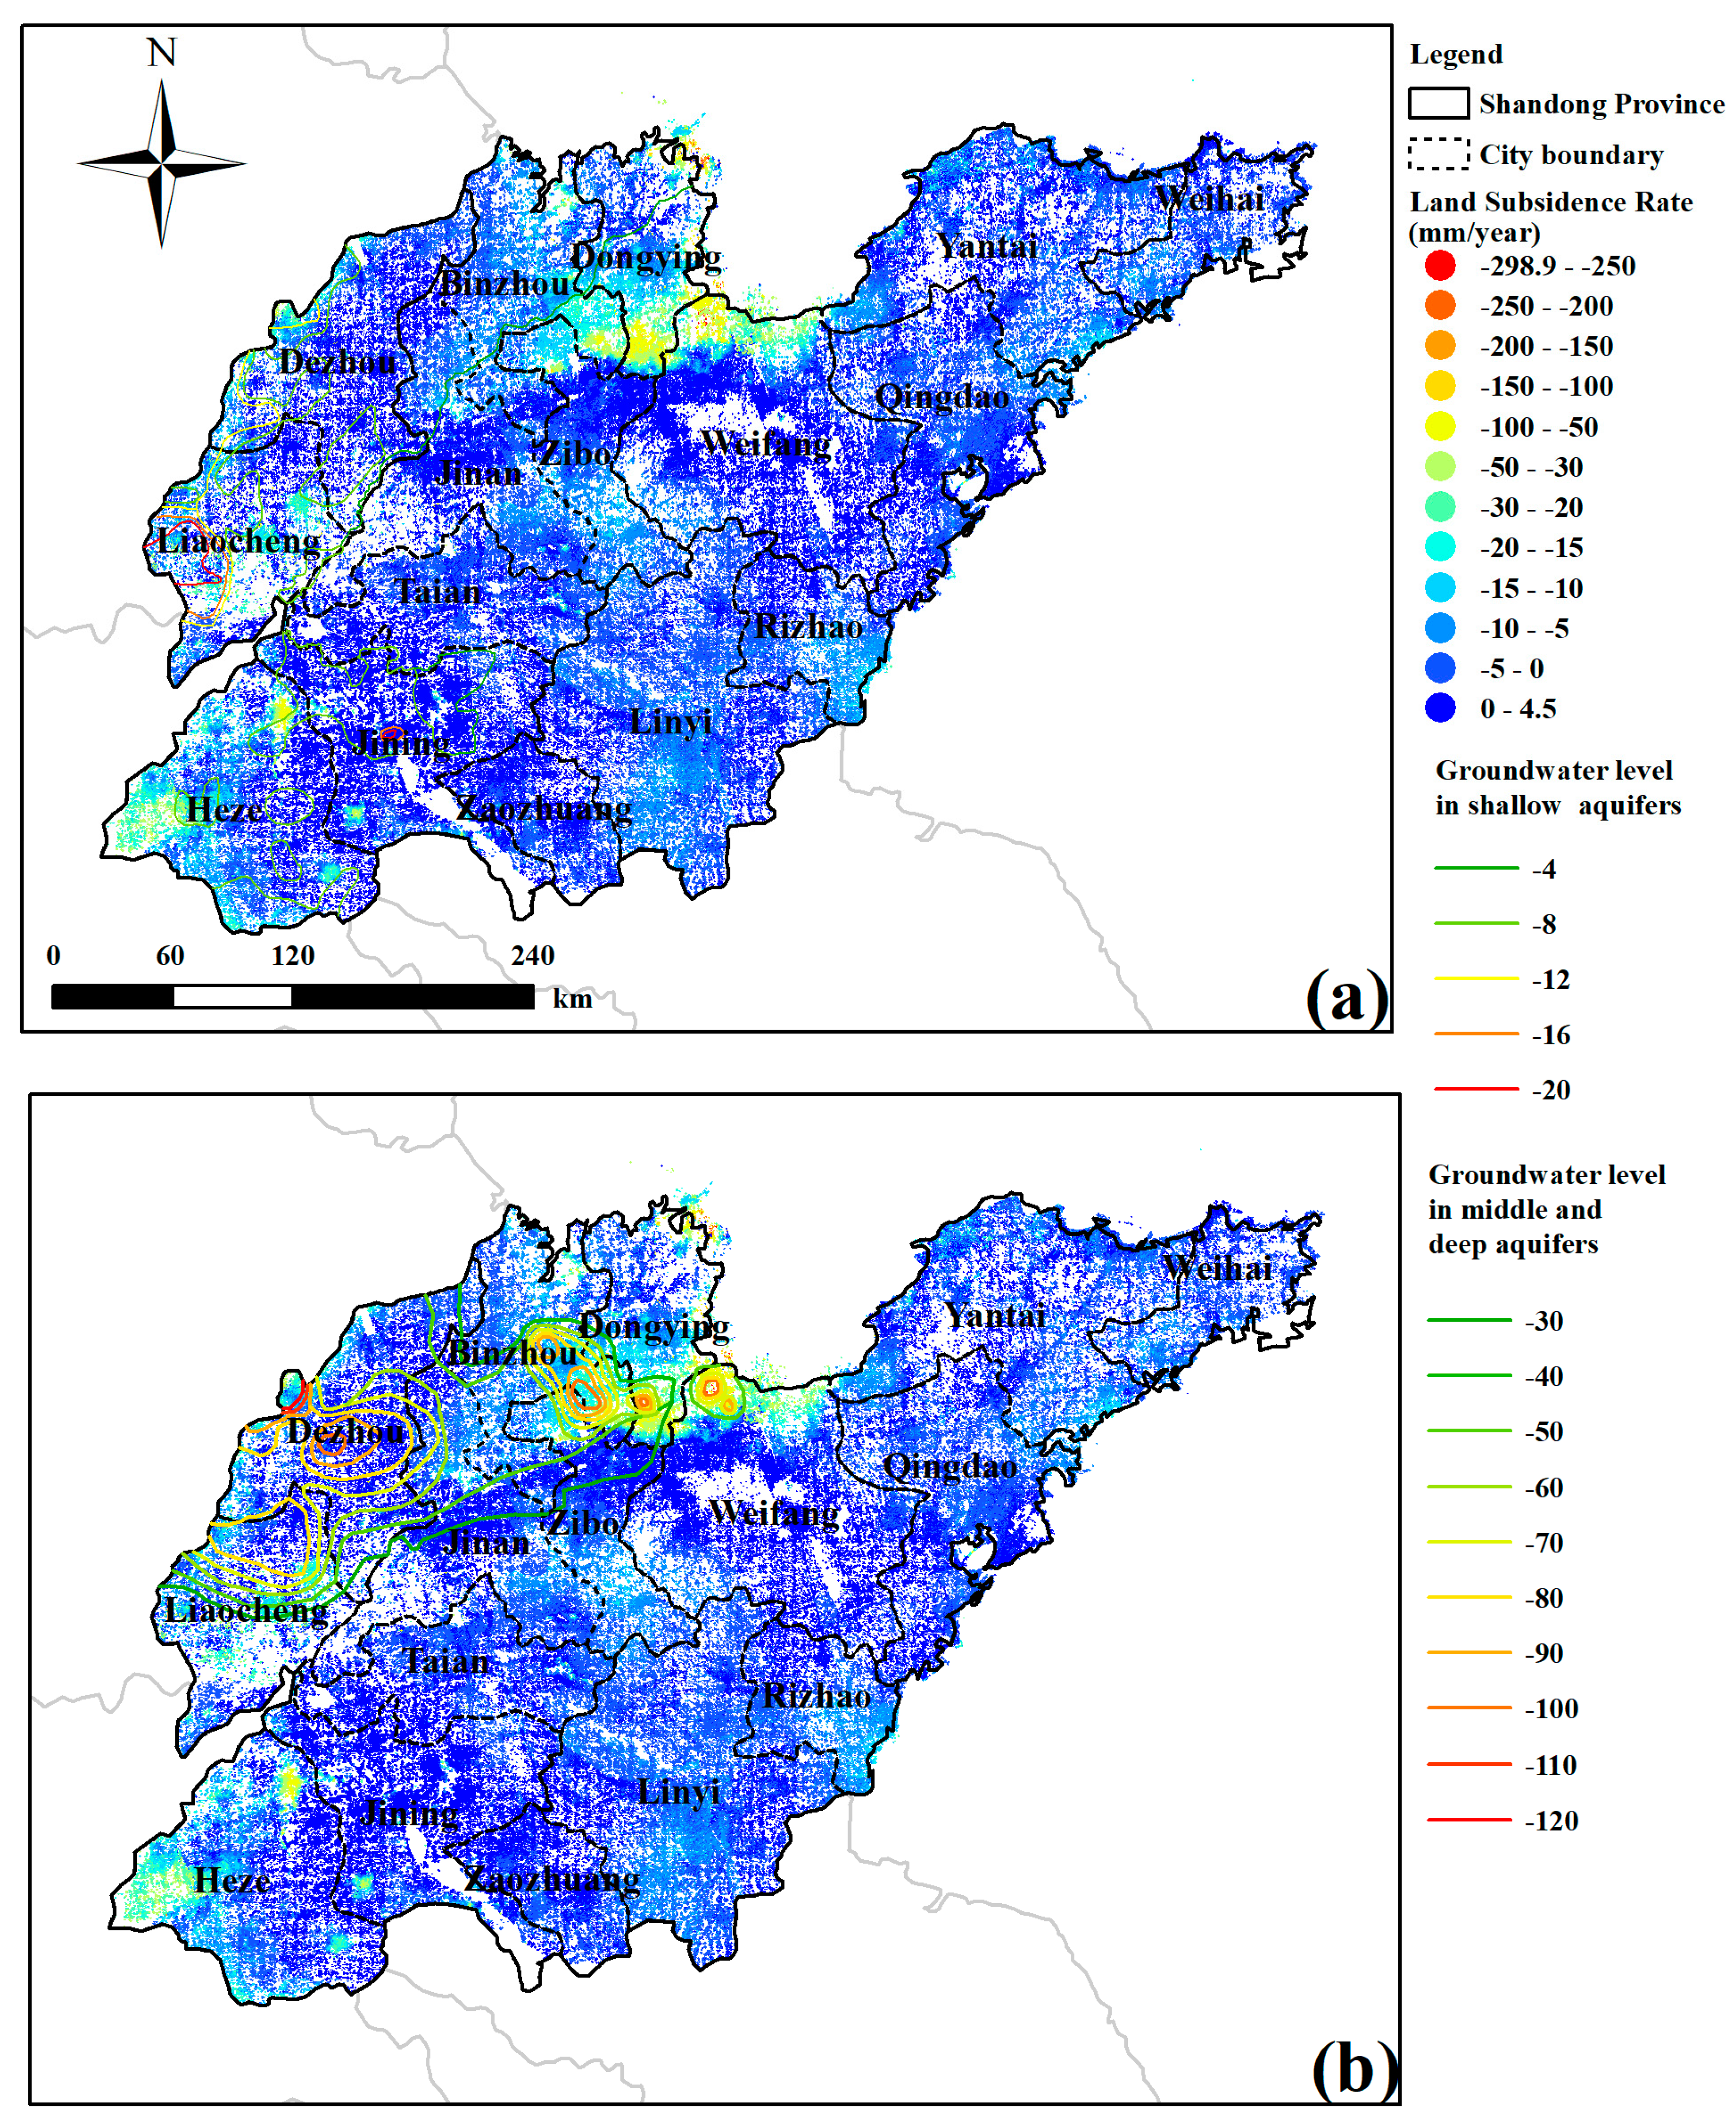
4.1. Land Subsidence in SDP Measured by PS-InSAR
4.2. Accuracy Assessment of PS-InSAR Monitoring Results
5. Discussion
5.1. Response Relationship between Land Subsidence and Groundwater Exploitation
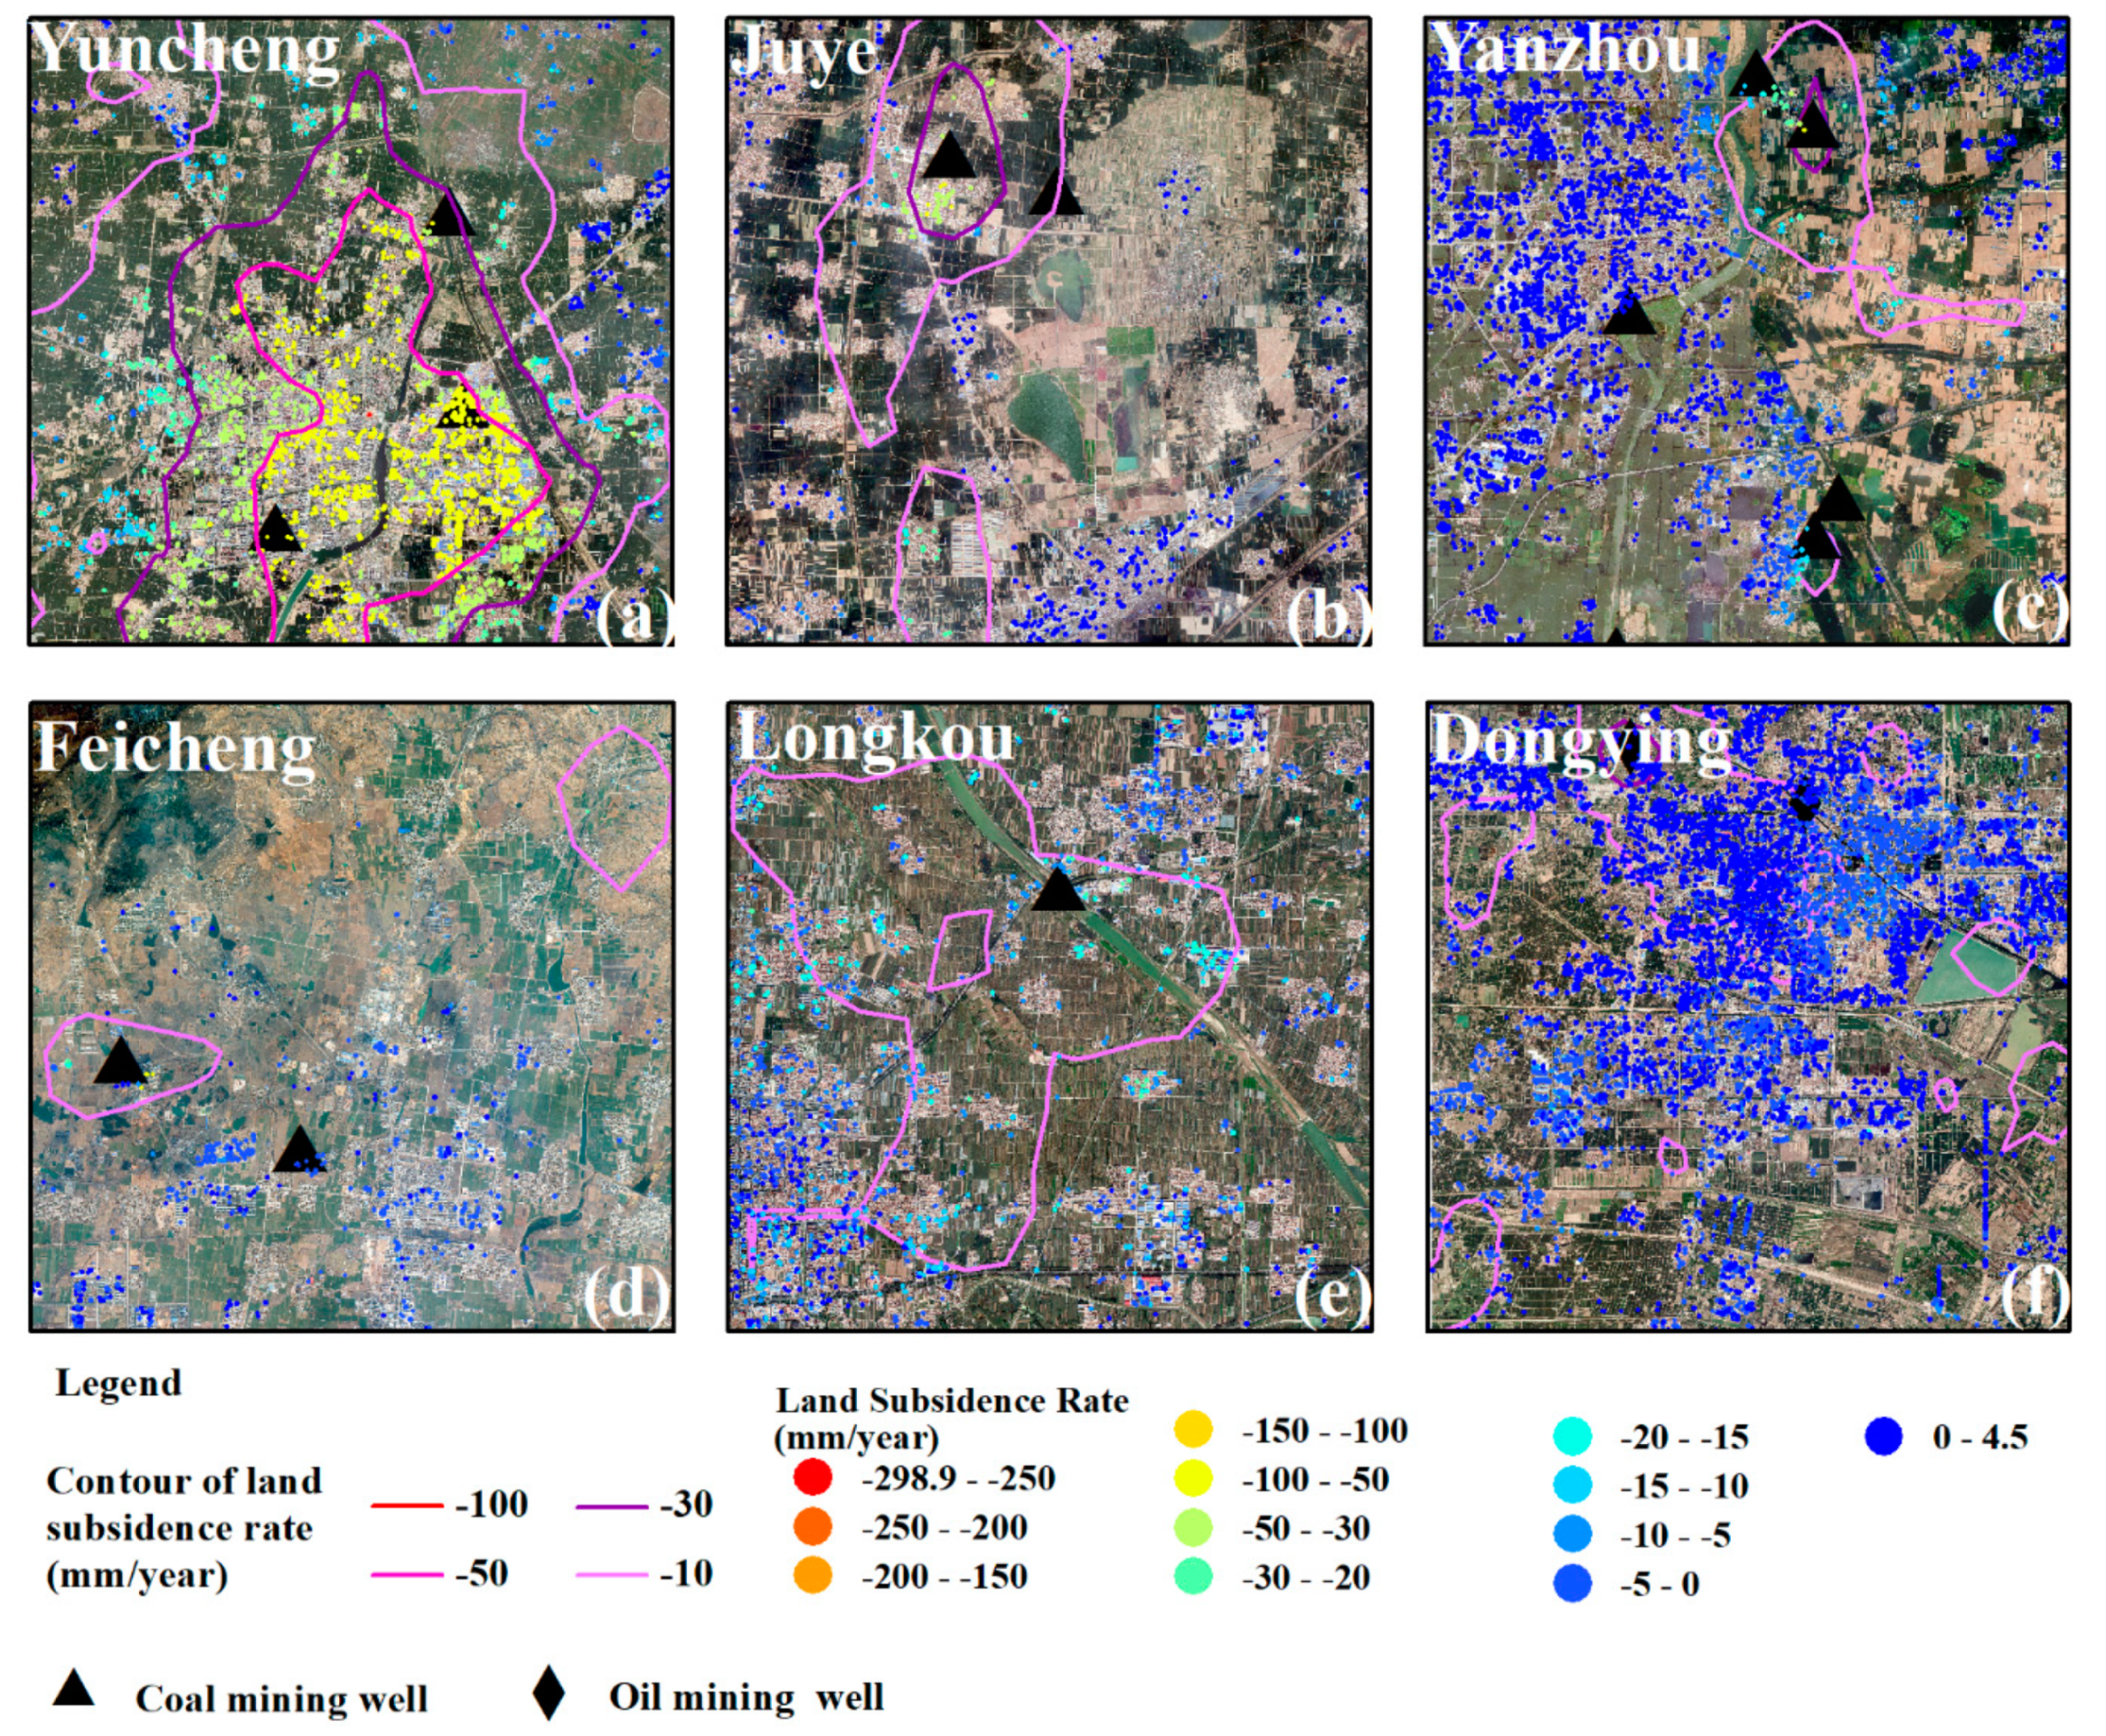
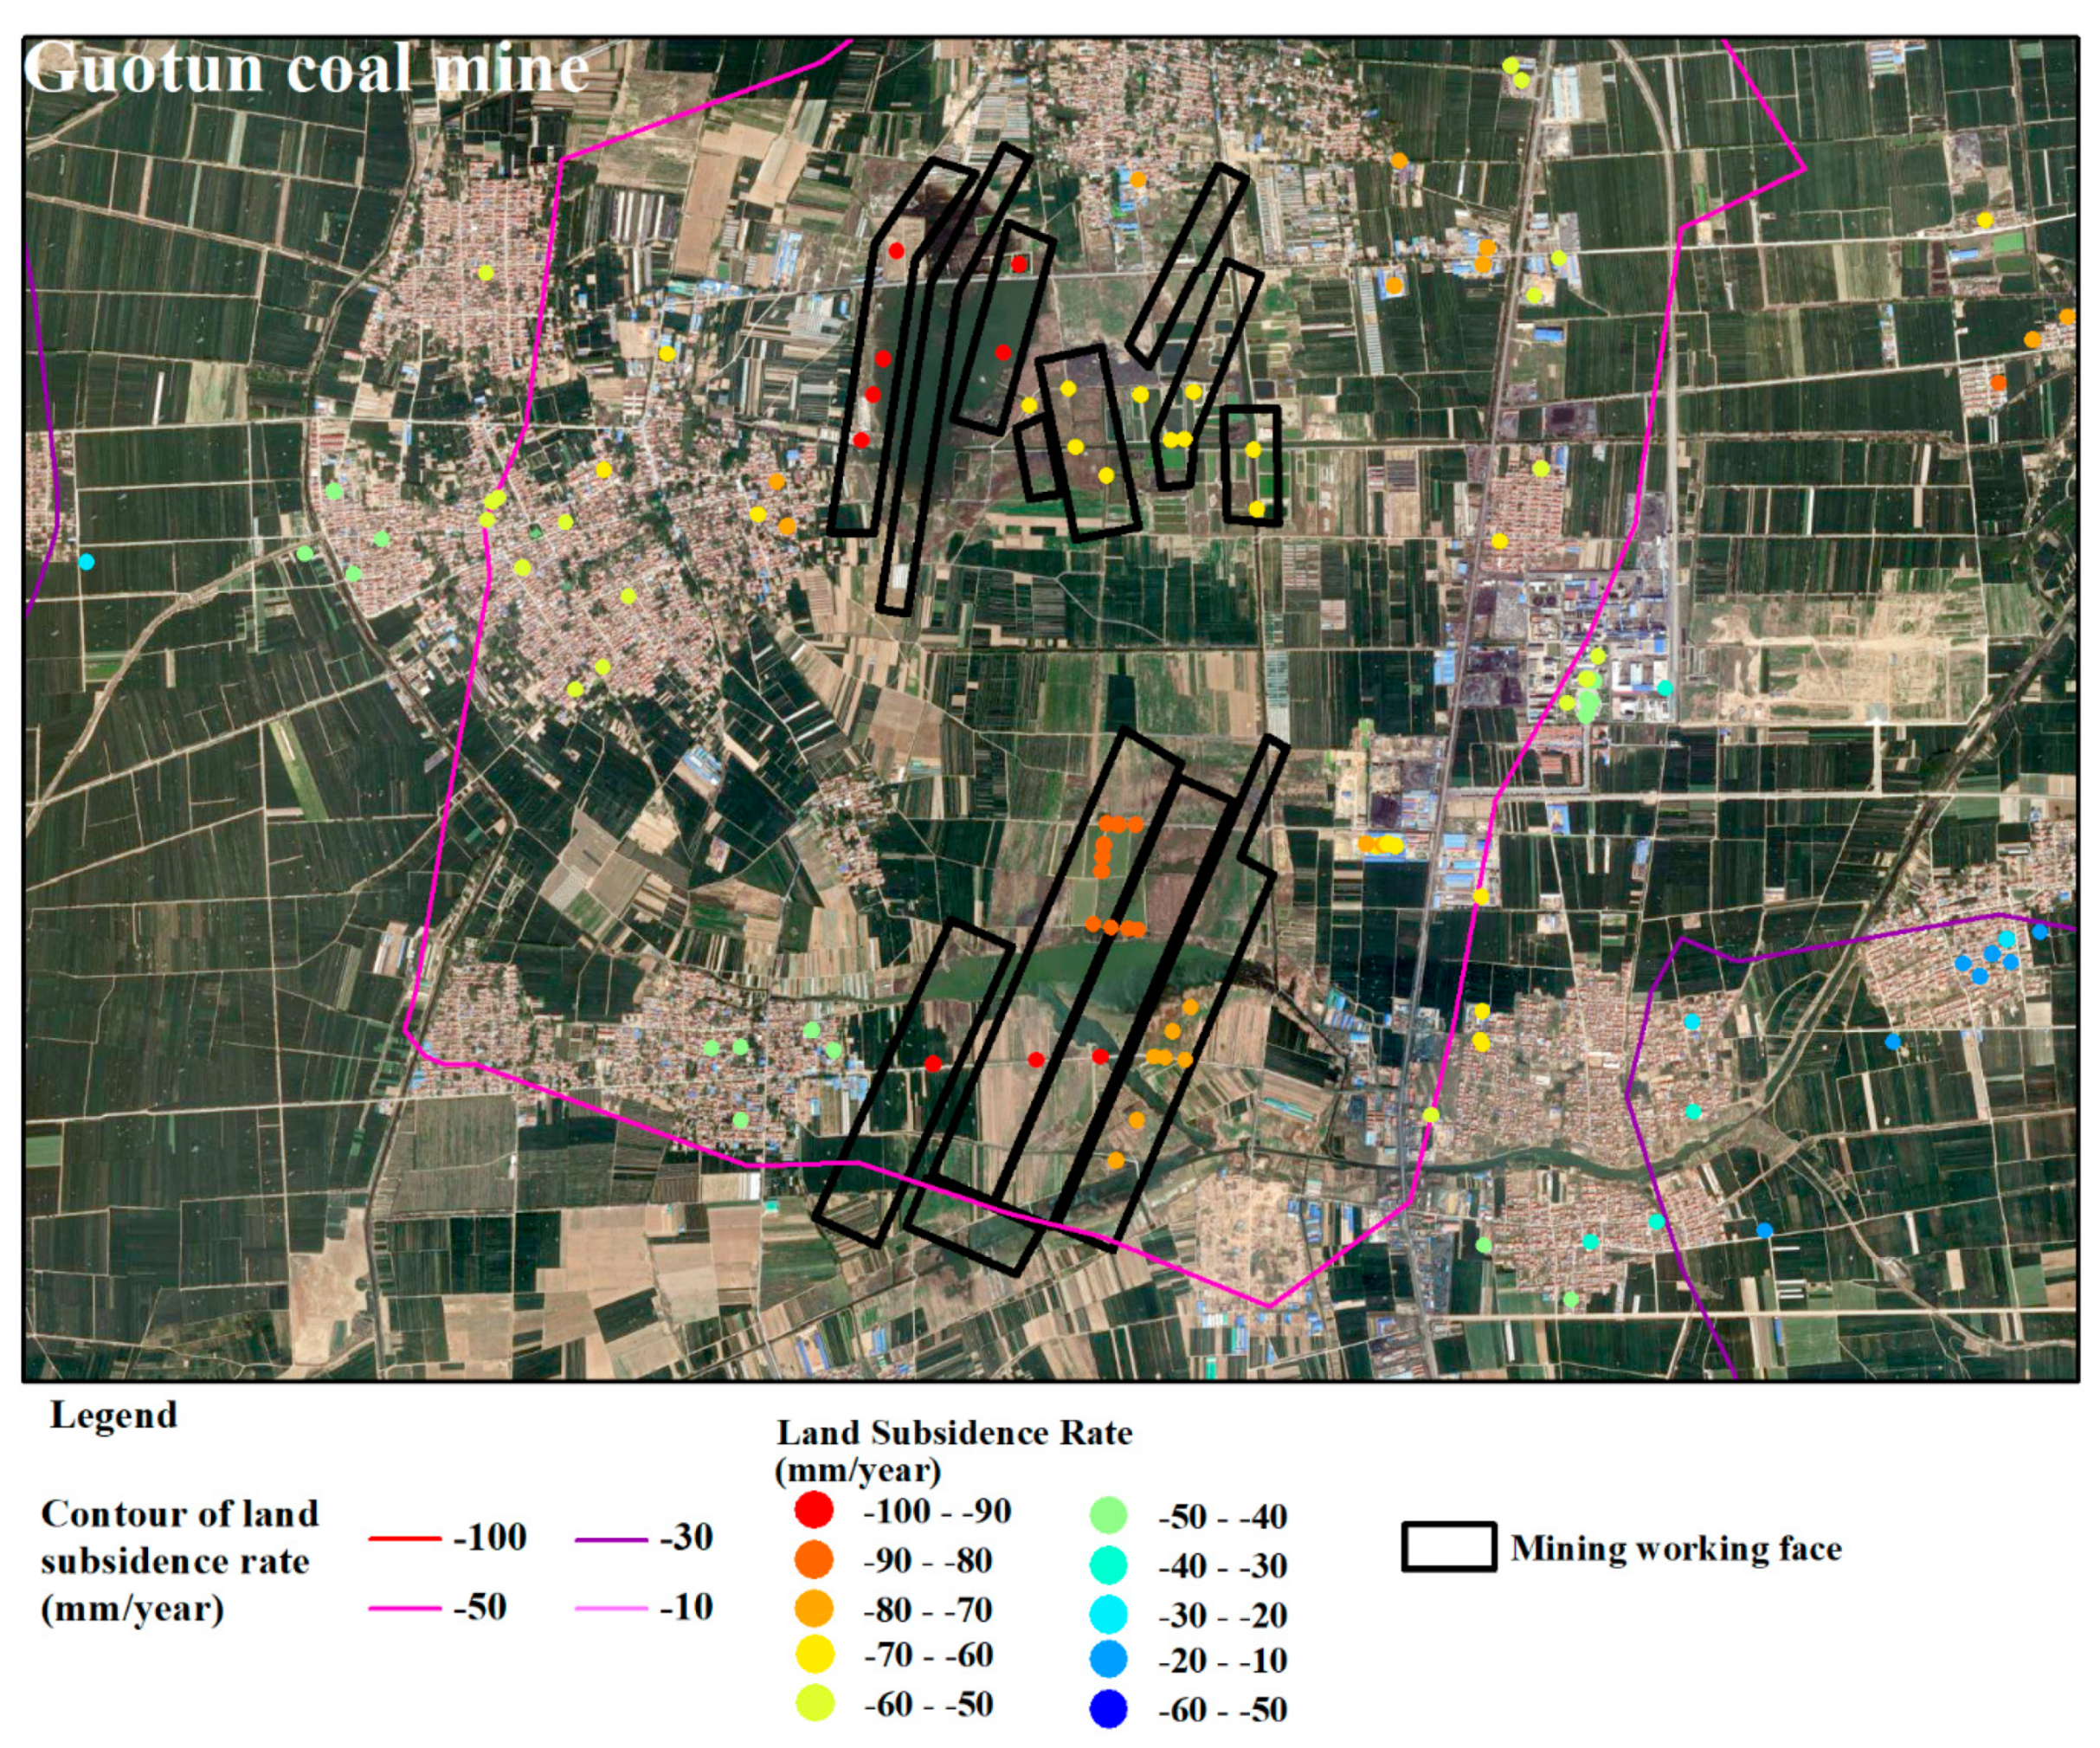
5.2. Response Relationship between Land Subsidence and Underground Mining of Mineral Resources
5.3. Response Relationship between Land Subsidence and Static and Dynamic Loads of Jiaozhou Bay Bridge
5.4. Future Works
- The spatial resolution of Sentinel-1 images is too low, which limits the density of PS points detected in study area. We will obtain the land subsidence InSAR monitoring results covering the whole SDP by using SAR images with higher spatial resolution in our future study.
- We will apply InSAR technology to Sentinel-1 images collected from the descending orbit between March 2017 and December 2020 to derive land subsidence information for SDP. This may improve the reliability of outcomes.
- We will quantitatively evaluate the contribution rate of the influencing factors to land subsidence by using machine learning models in future work [11].
- We will use other InSAR technology to Sentinel-1 images to obtain the land subsidence monitoring information in SDP from March 2017 to December 2020 to verify the reliability of the existing PS-InSAR results.
- We will integrate multiple platform SAR images to obtain a long-time series of land subsidence monitoring information covering the whole SDP for decades and implement quantitative research.
- We will integrate Ground-Penetrating Radar and PS-InSAR to analyze the cause of the land subsidence of important infrastructure in study area [36].
6. Conclusions
- (1)
- During the study period, the maximum land subsidence rate reached −298.9 mm/year. We found a huge discrepancy in the spatial distribution of land subsidence across SDP. The areas that experienced serious land subsidence were mainly distributed in the GSP area. The PS-InSAR monitoring results agree well with the GPS monitoring results and leveling benchmark monitoring results observed in the same period, and the PCC values between the PS-InSAR monitoring results and the GPS measurement results and leveling benchmark monitoring results were 0.97 and 0.98, respectively.
- (2)
- We found that the spatial distribution of the groundwater level in middle and deep aquifer was more consistent with land subsidence rate than that of the groundwater level in shallow aquifer and that the mining working face has experienced more serious land subsidence than the surrounding area. Based on those findings, we think that the overexploitation of groundwater in middle and deep aquifers and mining of underground mineral resources are the main inducing factors of land subsidence. The GSP was more prone to land subsidence than GSM and GSJD when experiencing the same groundwater exploitation and the same underground resource exploitation conditions. This phenomenon can be attributed to the different hydrogeological structure of the strata in the three areas.
- (3)
- We found that the type of bridge material is an important inducing factor causing the large variation in the land subsidence of the bridge body within a small geographical range. With the maximum land subsidence rate exceeding −30 mm/year, the middle of the JBB experienced serious land subsidence.
Author Contributions
Funding
Data Availability Statement
Acknowledgments
Conflicts of Interest
References
- Li, X.; Yan, L.; Lu, L.; Huang, G.; Zhao, Z.; Lu, Z. Adjacent-Track InSAR Processing for Large-Scale Land Subsidence Monitoring in the Hebei Plain. Remote Sens. 2021, 13, 795. [Google Scholar] [CrossRef]
- Li, H.; Zhu, L.; Dai, Z.; Gong, H.; Guo, T.; Guo, G.; Wang, J.; Teatini, P. Spatiotemporal modeling of land subsidence using a geographically weighted deep learning method based on PS-InSAR. Sci. Total Environ. 2021, 799, 149244–149257. [Google Scholar] [CrossRef] [PubMed]
- Jones, C.E.; An, K.; Blom, R.G.; Kent, J.D.; Ivins, E.R.; Bekaert, D. Anthropogenic and geologic influences on subsidence in the vicinity of New Orleans, Louisiana. J. Geophys. Res. Solid Earth 2016, 121, 3867–3887. [Google Scholar] [CrossRef]
- Castellazzi, P.; Arroyo-Dominguez, N.; Martel, R.; Calderhead, A.I.; Normand, J.C.L.; Garfias, J.; Rivera, A. Land subsidence in major cities of Central Mexico: Interpreting InSAR-derived land subsidence mapping with hydrogeological data. Int. J. Appl. Earth Obs. Geoinf. 2016, 47, 102–111. [Google Scholar] [CrossRef]
- Castellazzi, P.; Longuevergne, L.; Martel, R.; Rivera, A.; Brouard, C.; Chaussard, E. Quantitative mapping ofgroundwater depletion at the water management scale using a combined GRACE/InSAR approach. Remote Sens. Environ. 2018, 205, 408–418. [Google Scholar] [CrossRef]
- Samsonov, S.V.; d’Oreye, N.; Gonzalez, P.J.; Tiampo, K.F.; Ertolahti, L.; Clague, J.J. Rapidly accelerating subsidence in the Greater Vancouver region from two decades of ERS-ENVISAT-RADARSAT-2 DInSARmeasurements. Remote Sens. Environ. 2014, 143, 180–191. [Google Scholar] [CrossRef] [Green Version]
- Samsonov, S.V.; González, P.J.; Tiampo, K.F.; D’Oreye, N. Modeling of fast ground subsidence observed in southern Saskatchewan (Canada) during 2008–2011. Nat. Hazards Earth Syst. Sci. 2014, 14, 247–257. [Google Scholar] [CrossRef] [Green Version]
- Fabris, M.; Achilli, V.; Menin, A. Estimation of Subsidence in Po Delta Area (Northern Italy) by Integration of GPS Data, High-Precision Leveling and Archival Orthometric Elevations. Int. J. Geosci. 2014, 5, 571–585. [Google Scholar] [CrossRef] [Green Version]
- Teatini, P.; Ferronato, M.; Gambolati, G.; Bertoni, W.; Gonella, M. A century of land subsidence in Ravenna, Italy. Environ. Geol. 2005, 47, 831–846. [Google Scholar] [CrossRef]
- Tosi, L.; Teatini, P.; Carbognin, L.; Frankenfield, J. A new project to monitor land subsidence in the northern Venice coastland (Italy). Environ. Geol. 2006, 52, 889–898. [Google Scholar] [CrossRef]
- Fiorentini, N.; Maboudi, M.; Leandri, P.; Losa, M.; Gerke, M. Surface Motion Prediction and Mapping for Road Infrastructures Management by PS-InSAR Measurements and Machine Learning Algorithms. Remote Sens. 2020, 12, 3976. [Google Scholar] [CrossRef]
- Wu, H.-N.; Shen, S.-L.; Yang, J. Identification of Tunnel Settlement Caused by Land Subsidence in Soft Deposit of Shanghai. J. Perform. Constr. Facil. 2017, 31. [Google Scholar] [CrossRef] [Green Version]
- Strozzi, T.; Caduff, R.; Wegmüller, U.; Raetzo, H.; Hauser, M. Widespread surface subsidence measured with satellite SAR interferometry in the Swiss alpine range associated with the construction of the Gotthard BaseTunnel. Remote Sens. Environ. 2017, 190, 1–12. [Google Scholar] [CrossRef]
- Peduto, D.; Nicodemo, G.; Maccabiani, J.; Ferlisi, S. Multi-scale analysis of settlement-induced building damage using damage surveys and DInSAR data: A case study in The Netherlands. Eng. Geol. 2017, 218, 117–133. [Google Scholar] [CrossRef]
- Parsons, T. The Weight of Cities: Urbanization Effects on Earth’s Subsurface. AGU Adv. 2021, 2, e2020AV000277. [Google Scholar] [CrossRef]
- Shirzaei, M.; Bürgmann, R. Global climate change and local land subsidence exacerbate inundation risk to the San Francisco Bay Area. Sci. Adv. 2018, 4, eaap9234. [Google Scholar] [CrossRef] [PubMed] [Green Version]
- Wang, J.; Yi, S.; Li, M.; Wang, L.; Song, C. Effects of sea level rise, land subsidence, bathymetric change and typhoon tracks on storm flooding in the coastal areas of Shanghai. Sci. Total Environ. 2018, 621, 228–234. [Google Scholar] [CrossRef]
- Zhang, W.; Duan, Z.; Zeng, Z.; Shi, H. Evaluation on Economic Losses Resulted from Land Subsidence in Shanghai: 1921~2000. J. Tongji Univ. 2003, 31, 6. (In Chinese) [Google Scholar]
- Zhang, W.; Wang, R. Risk evaluation of the economic losses induced by land subsidence in shanghai from 2001 to 2020. Adv. Water Sci. 2005, 16, 6. (In Chinese) [Google Scholar]
- Water Resources Bulletin of Shandong Province. Available online: http://wr.shandong.gov.cn/ (accessed on 9 June 2022). (In Chinese)
- Xu, Y.; Gong, H.; Chen, B.; Zhang, Q.; Li, Z. Long-term and seasonal variation in groundwater storage in the North China Plain based on GRACE. Int. J. Appl. Earth Obs. Geoinf. 2021, 104, 102560. [Google Scholar] [CrossRef]
- Nie, J.; Guo, C.; Tian, J.; Wang, B.; Cheng, C. Analysis of land subsidence in Shandong province based on GNSS. Geomat. Sci. Eng. 2019, 39, 2. (In Chinese) [Google Scholar]
- Huang, G.; Fan, H.; Lu, L.; Yu, W. Land Subsidence Monitoring in Dezhou City Based on Sbas-Insar Technology. ISPRS Int. Arch. Photogramm. Remote Sens. Spat. Inf. Sci. 2020, XLIII-B3-2, 299–304. [Google Scholar] [CrossRef]
- Peng, M.; Zhao, C.; Zhang, Q.; Lu, Z.; Bai, L.; Bai, W. Multi-Scale and Multi-Dimensional Time Series InSAR Characterizing of Surface Deformation over Shandong Peninsula, China. Appl. Sci. 2020, 10, 2294. [Google Scholar] [CrossRef] [Green Version]
- Zhong, C.; Wang, Q.; Wang, X.; Zhang, S.; Niu, Y. Surface Displacement Monitoring and Inducing Factors Analysis of Dongying City Base on InSAR. J. Geod. Geodyn. 2021, 41, 7. (In Chinese) [Google Scholar]
- Zheng, L.; Zhu, L.; Wang, W.; Guo, L.; Chen, B. Land Subsidence Related to Coal Mining in China Revealed by L-Band InSAR Analysis. Int. J. Environ. Res. Public Health 2020, 17, 1170. [Google Scholar] [CrossRef] [Green Version]
- Tang, Q. Study on Ground Monitoring Subsidence in Mining Area Based on SBAS-In SAR Technique. Surv. Mapp. Geol. Miner. Resour. 2019, 35, 18–20. (In Chinese) [Google Scholar]
- Liu, Y.; Liu, J.; Xia, X.; Bi, H.; Huang, H.; Ding, R.; Zhao, L. Land subsidence of the Yellow River Delta in China driven by river sediment compaction. Sci. Total Environ. 2020, 750, 142165. [Google Scholar] [CrossRef] [PubMed]
- Zhao, X.; Chen, B.; Gong, H.; Zhou, C.; Li, X.; Lei, K.; Ke, Y. Land subsidence along the Beijing–Tianjin Intercity Railway during the period of the South-to-North Water Diversion Project. Int. J. Remote Sens. 2020, 41, 4447–4469. [Google Scholar] [CrossRef]
- Xu, L.; Huang, H.; Liu, Y.; Bi, H.; Wang, G.; Yan, L.; Dong, H. Impact of Artificial Construction on Land Subsidence in the Yellow River Delta Region. Coast. Eng. 2005, 3682, 11. [Google Scholar]
- Zhou, C.; Gong, H.; Chen, B.; Li, X.; Li, J.; Wang, X.; Gao, M.; Si, Y.; Guo, L.; Shi, M. Quantifying the contribution of multiple factors to land subsidence in the Beijing Plain, China with machine learning technology. Geomorphology 2019, 335, 48–61. [Google Scholar] [CrossRef]
- Mao, J.; Meng, L.; Su, Y.; Xu, J.; Ding, S. The study of ground settlement monitoring in Dongying area based on GPS Geotechnical. Investig. Surv. 2014, 10, 4. (In Chinese) [Google Scholar]
- Ferretti, A.; Prati, C.; Rocca, F. Nonlinear Subsidence Rate Estimation Using permanent scatterers in differential SAR interferometry. IEEE Trans. Geosci. Remote Sens. 2000, 38, 2202–2212. [Google Scholar] [CrossRef] [Green Version]
- Berardino, P.; Fornaro, G.; Lanari, R.; Sansosti, E. A new algorithm for surface deformation monitoring based on small baseline differential SAR interferograms. IEEE Trans. Geosci. Remote Sens. 2002, 40, 2375–2383. [Google Scholar] [CrossRef] [Green Version]
- Ferretti, A.; Prati, C.; Rocca, F. Permanent scatterers in SAR interferometry. IEEE Trans. Geosci. Remote Sens. 2001, 39, 8–20. [Google Scholar] [CrossRef]
- Fiorentini, N.; Maboudi, M.; Leandri, P.; Losa, M. Can Machine Learning and PS-InSAR Reliably Stand in for Road Profilometric Surveys? Sensors 2021, 21, 3377. [Google Scholar] [CrossRef]
- Thapaa, S.; Chatterjeea, R.; Singhb, K.; Kumar, D. Land Subsidence Monitoring Using Ps-Insar Technique for L-Band Sar Data. Int. Arch. Photogramm. Remote Sens. Spatial Inf. Sci. 2016, XLI-B7, 995–997. [Google Scholar] [CrossRef] [Green Version]
- Zhang, J.; Huang, H.; Liu, Y.; Liu, Y.; Ma, L. Monitoring and Analysis of Ground Subsidence in the Modern Yellow River. Delta Area Based on PSInSAR Technique. Sci. Geogr. Sin. 2013, 33, 831–836. [Google Scholar]
- Wu, Q.; Pang, J.; Qi, S.; Li, Y.; Han, C.; Liu, T.; Huang, L. Impacts of coal mining subsidence on the surface landscape in Longkou city, Shandong Province of China. Environ. Earth Sci. 2009, 59, 783. [Google Scholar] [CrossRef]
- Liu, H.; Huang, H. Characterization and mechanism of regional land subsidence in the Yellow River Delta, China. Nat. Hazards 2013, 68, 687–709. [Google Scholar] [CrossRef]
- Huang, F.; Wang, G.H.; Yang, Y.Y.; Wang, C.B. Overexploitation status of groundwater and induced geological hazards in China. Nat. Hazards 2014, 73, 727–741. [Google Scholar] [CrossRef]
- Wang, L.; Hui, Z. Development of circular economy and optimization of industrial structure for Shandong Province. Energy Procedia 2011, 5, 1603–1610. [Google Scholar] [CrossRef] [Green Version]
- Chen, G.; Liu, H.; Zhang, J.; Liu, P.; Dong, S. Factors affecting summer maize yield under climate change in Shandong Province in the Huanghuaihai Region of China. Int. J. Biometeorol. 2012, 56, 621–629. [Google Scholar] [CrossRef] [PubMed]
- Zuo, D.; Cai, S.; Xu, Z.; Li, F.; Sun, W.; Yang, X.; Kan, G.; Liu, P. Spatiotemporal patterns of drought at various time scales in Shandong Province of Eastern China. Theor. Appl. Climatol. 2018, 131, 271–284. [Google Scholar] [CrossRef]
- Xiao, D.; Qi, Y.; Shen, Y.; Tao, F.; Moiwo, J.P.; Liu, J.; Wang, R.; Zhang, H.; Liu, F. Impact of warming climate and cultivar change on maize phenology in the last three decades in North China Plain. Theor. Appl. Climatol. 2016, 124, 653–661. [Google Scholar] [CrossRef]
- Shandong Province Bureau of Statistics. Available online: http://tjj.shandong.gov.cn/col/col6279/index.html (accessed on 9 June 2022). (In Chinese)
- Yi, L.; Fang, Z.; He, X.; Chen, S.; Wang, W.; Yu, Q. Land subsidence in Tianjin, China. Environ. Earth Sci. 2011, 62, 1151–1161. [Google Scholar] [CrossRef]
- Guo, H.; Zhang, Z.; Cheng, G.; Li, W.; Li, T.; Jiao, J.J. Groundwater-derived land subsidence in the North China Plain. Environ. Earth Sci. 2015, 74, 1415–1427. [Google Scholar] [CrossRef]
- Chen, B.; Gong, H.; Lei, K.; Li, J.; Zhou, C.; Gao, M.; Guan, H.; Lv, W. Land subsidence lagging quantification in the main exploration aquifer layers in Beijing plain, China. Int. J. Appl. Earth Obs. Geoinf. 2019, 75, 54–67. [Google Scholar] [CrossRef]
- Zhang, X.; Ge, D.; Ma, W.; Zhang, L.; Wang, Y.; Guo, X. Study the land subsidence along JingHu highway (Beijing-Hebei) using PS-InSAR technique. In Proceedings of the 2011 IEEE International Geoscience and Remote Sensing Symposium, Vancouver, BC, Canada, 24–29 July 2011. [Google Scholar]
- Duan, X.; Zheng, T. Study on division and prevention countermeasures of geological hazards in Shandong province. Shandong Land Resour. 2007, 23, 4. (In Chinese) [Google Scholar]
- Zhu, J.Y.; Guo, H.P. Relation between Land Subsidence and Deep Groundwater Exploitation in Cangzhou City. Adv. Mater. Res. 2013, 864–867, 2213–2217. [Google Scholar] [CrossRef]
- Lei, K.; Gong, H.; Li, X.; Chen, B.; Li, J.; Liu, S. The Application of PS-InSAR Technology on Land Subsidence in Cangzhou Region. Adv. Mater. Res. 2011, 268–270, 1934–1939. [Google Scholar] [CrossRef]
- Cao, Q.; Chen, B.; Gong, H.; Zhou, C.; Luo, Y.; Gao, L.; Wang, X.; Shi, M.; Zhao, X.; Zuo, J. Monitoring of land subsidence in Beijing-Tianjin-Hebei Urban by combination of SBAS and IPTA. J. Nanjing Univ. 2019, 55, 11. (In Chinese) [Google Scholar]
- Deng, X.; Qu, G.; Zhang, J.; Xi, H.; Wang, H. Land subsidence monitoring in Dongying with integrated lift rail PS-InSAR. J. Shandong Univ. Technol. 2021, 35, 7. (In Chinese) [Google Scholar]
- Wang, S.; Song, X.; Wang, Q.; Xiao, G.; Liu, C.; Liu, J. Shallow groundwater dynamics in North China Plain. J. Geogr. Sci. 2009, 19, 175–188. [Google Scholar] [CrossRef] [Green Version]
- Ma, Y.; Feng, S.; Song, X. Evaluation of optimal irrigation scheduling and groundwater recharge at representative sites in the North China Plain with SWAP model and field experiments. Comput. Electron. Agric. 2015, 116, 125–136. [Google Scholar] [CrossRef]
- Zhu, M.; Shen, T.; Lyu, F.; Ge, C.; Bai, S.; Jia, Z.; Wang, D. InSAR deformation data decomposition and information analysis of Jiaozhou bay bridge, Qingdao. J. Remote Sens. 2020, 24, 883–893. (In Chinese) [Google Scholar]


| Track | Number of Images | Data Range | Orbit Direction | Polarization |
|---|---|---|---|---|
| Track 40 | 112 | 14 March 2017–23 December 2020 | Ascending | VV |
| Track 142 | 165 | 20 May 2017–30 December 2020 | Ascending | VV |
| Track 98 | 57 | 30 March 2017–27 December 2020 | Ascending | VV |
| Track 69 | 170 | 4 March 2017–25 December 2020 | Ascending | VV |
| Track 171 | 54 | 4 April 2017–20 December 2020 | Ascending | VV |
Publisher’s Note: MDPI stays neutral with regard to jurisdictional claims in published maps and institutional affiliations. |
© 2022 by the authors. Licensee MDPI, Basel, Switzerland. This article is an open access article distributed under the terms and conditions of the Creative Commons Attribution (CC BY) license (https://creativecommons.org/licenses/by/4.0/).
Share and Cite
Li, F.; Liu, G.; Gong, H.; Chen, B.; Zhou, C. Assessing Land Subsidence-Inducing Factors in the Shandong Province, China, by Using PS-InSAR Measurements. Remote Sens. 2022, 14, 2875. https://doi.org/10.3390/rs14122875
Li F, Liu G, Gong H, Chen B, Zhou C. Assessing Land Subsidence-Inducing Factors in the Shandong Province, China, by Using PS-InSAR Measurements. Remote Sensing. 2022; 14(12):2875. https://doi.org/10.3390/rs14122875
Chicago/Turabian StyleLi, Fengkai, Guolin Liu, Huili Gong, Beibei Chen, and Chaofan Zhou. 2022. "Assessing Land Subsidence-Inducing Factors in the Shandong Province, China, by Using PS-InSAR Measurements" Remote Sensing 14, no. 12: 2875. https://doi.org/10.3390/rs14122875
APA StyleLi, F., Liu, G., Gong, H., Chen, B., & Zhou, C. (2022). Assessing Land Subsidence-Inducing Factors in the Shandong Province, China, by Using PS-InSAR Measurements. Remote Sensing, 14(12), 2875. https://doi.org/10.3390/rs14122875