Abstract
Soil moisture (SM), an important variable in water conversion between the atmosphere and terrestrial ecosystems, plays a crucial role in ecological processes and the evolution of terrestrial ecosystems. Analyzing and exploring SM’s processes and influencing factors in different permafrost regions of the Qinghai-Tibet Plateau (QTP) can better serve the regional ecological security, disaster warning, water management, etc. However, the changes and future trends of SM on the QTP in recent decades are uncertain, and the main factors affecting SM are not fully understood. The study used SM observations, the Global Land Evapotranspiration Amsterdam Model (GLEAM) SM products, meteorological and vegetation data, Mann–Kendall test, Theil–Sen estimation, Ensemble Empirical Mode Decomposition (EEMD), and correlation methods to analyze and explore the characteristics and influencing factors of SM change in different permafrost regions of the QTP. The results show that: (1) At the pixel scale, GLEAM SM products can better reflect SM changes in the QTP in the warm season. The seasonal permafrost region is closer to the real SM than the permanent region, with a median correlation coefficient (R) of 0.738, median bias of 0.043 m3 m−3, and median unbiased root mean square errors (ubRMSE) of 0.031 m3 m−3. (2) The average SM in the QTP warm season increased at a rate of 0.573 × 10⁻³ m3 m−3 yr−1 over the recent 40 years, and the trend accelerated from 2005–2020. In 64.31% of the region, the soil was significantly wetted, mainly distributed in the permafrost region, which showed that the wetting rate in the dry region was faster than in the wet region. However, the wetting trend does not have a long-term continuity and has a pattern of “wetting–drying-wetting” on interannual and decadal levels, especially in the seasonal permafrost region. (3) More than 65% of the SM wetting trend on the QTP is caused by temperature, precipitation, and vegetation. However, there is apparent spatial heterogeneity in the different permafrost regions and vegetation cover conditions, and the three factors have a more substantial explanatory power for SM changes in the seasonal permafrost region. With the global climate change, the synergistic SM–Climate–Vegetation effect on the QTP tends to be more evident in the seasonal permafrost region.
1. Introduction
Soil moisture (SM) is an important comprehensive variable of climate and terrestrial ecosystems [1,2]. It plays a crucial role in regulating the circulation of energy and water between the Earth’s surface and atmosphere [3,4] and has a reciprocal feedback effect on climate [5,6]. SM is a key factor in vegetation growth [7,8] and largely determines the organization and function of an ecosystem [9,10]. Increased evapotranspiration and precipitation events caused by increasing temperatures in the context of global warming [11] largely influence water cycle elements and SM changes [4]. The strong changes and instability in SM can have important feedback effects on regional climate and vegetation growth by affecting sensible heat [12,13], resulting in a wet-dry transition in climate [14], an increase in extreme climatic events [3], and exacerbated vegetation degradation [15]. Therefore, studying the SM dynamic processes is important for regional ecological security, disaster forecasting, and water resources management in long time series at the regional scale.
The Qinghai-Tibet Plateau (QTP), the highest altitude and largest permafrost distribution area in the middle and low latitudes of the Earth and is known as the world’s “third pole” [16,17]. Its thermal and dynamic effects have a significant impact on regional climate and the global environment, and It is the “sensitive zone” and “amplifier” of global climate change [18]. In the past few decades, due to global warming, the temperature of the QTP has increased at twice the rate of global warming, and this increasing trend is predicted to continue [19,20]. Not only are air temperatures rising on the QTP, but so are its shallow soil temperatures [21,22]. Meanwhile, precipitation and actual evapotranspiration also showed an increasing trend [23]. The accelerated climate change has caused many environmental changes, such as permafrost degradation, active layer deepening [19,21], glacier retreat, and snow melting [24], which significantly impact the hydrology and water resources in the QTP [4,18]. It also seriously affects the surface energy balance of permafrost regions [3] and plant growth processes [8,22,25,26].
The changing SM in the QTP can impact Asian monsoons by influencing sensible heat and thus affecting climate change in Asia [4,27,28]. Precipitation is the main source of QTP SM, and the specific change of SM is affected by vegetation type, evapotranspiration, soil texture, and other factors [26,27,28,29]. Whether the soil in permafrost areas is frozen directly affects the heat–moisture exchange between the land and atmosphere [1,15]. Permafrost, an impervious layer, maintains surface SM by preventing infiltration, and the thawing of permafrost in the warm season can also replenish SM [18,29,30,31]. Therefore, for soil water resources management, hydrological processes, and climate predictions, especially in the context of global warming, understanding the differences in SM changes in the permafrost and seasonal permafrost regions of the QTP, and their relationship with climate and vegetation, is essential for in-depth studies on the response of the QTP to climate change and understanding the soil–vegetation–atmosphere correlation process [6,26,32]. However, the traditional measured data cannot accurately inform the spatial variation of SM on a large scale, and long-time series data are needed for illustration. The QTP has a unique geographical environment and harsh climatic conditions, with few ground observation stations and limited SM observation information for long time series [33,34]. The acquisition of SM products using satellite remote sensing techniques or assimilation data is an important means of studying long-term changes in SM in large areas [4,34]. Due to the spatial heterogeneity of SM [35], there is great uncertainty in simulations and observations of SM on the QTP [4,36,37]. Complex hydrological responses to climate warming are reflected in the result variance when using different simulation and observation data [36,37,38,39,40]. Soil hydrological processes in permafrost regions have not been adequately quantified [41].
In the last decade, researchers have made great advances in SM inversion algorithms and produced many SM remote sensing products [42,43,44,45,46,47,48]. According to previous evaluations of existing soil moisture products [40,49,50,51,52], ESA CCI SM active and passive combination products capture long-term changes in SM, representing the global trends in SM [53] with high accuracy in the QTP (median unbiased root mean square error (ubRMSE) value of 0.043 and 0.05 m3 m−3 respectively, and correlation coefficient (R) value of 0.66 and 0.63, respectively) [51,54]; it is closest to the absolute value of SM observations [27]. Although there is a significant correlation between ESA CCI SM products and measured precipitation (R = 0.50) [4], less than 30% of short-term drought could only be detected at the in situ site scale of QTP [52]. At the same time, there are many missing gaps in ESA CCI SM data in the northwest QTP, which lead to discontinuity in climate applications [4]. Therefore, this shows that there is still uncertainty in the different research applications of ESA CCI SM products in the QTP. In addition, most SM data have a short time span, which makes it impossible to study long-term changes in the past or potential influencing factors.
The global land evaporation Amsterdam model (GLEAM) [46,55] is a dataset containing SM, land evaporation, and potential evapotranspiration in the surface and root zone and its time scale spans 1980 to 2020. The validation and evaluation of this data by Martens et al. [46] showed that the GLEAM V3a dataset was reasonably accurate compared to SM measured in the field due to the use of the highly accurate multi-source weighted aggregate precipitation (MSWEP) dataset [56]. Its accuracy of surface SM (0–10 cm) was higher than that of root SM (10–100 cm). Compared to the satellite-based SM dataset (ESA CCI SM), GLEAM SM has higher quality in most regions of the world (73%), especially in areas with limited terrain and sparse vegetation [46]. This dataset provides the possibility for more accurate research on the response of SM changes to climate change or land air feedback on a long-time scale; however, whether it performs better than other products in QTP needs further evaluation.
Based on the above research status, the main objectives of this study are: (1) to evaluate the quality and applicability of GLEAM SM products on the QTP, and to find more reliable datasets for more rational studies of SM changes over long time scales; (2) to study the trends and change processes of SM on the QTP in the last 40 years, and to analyze the spatial differences of SM dynamic trends under different permafrost regions and vegetation cover types; (3) to explore the influence of potential climatic and vegetation factors on the dynamic change pattern of SM, and to quantify the response of SM on the QTP to global changes under different permafrost regions and vegetation cover types. This study can provide a clearer understanding of the coupling mechanism between the SM–climate–vegetation in the QTP and provide a scientific basis for decision-making in regional ecological security, disaster warning, and mitigation of grassland degradation in the context of global change.
2. Materials and Methods
2.1. Study Area
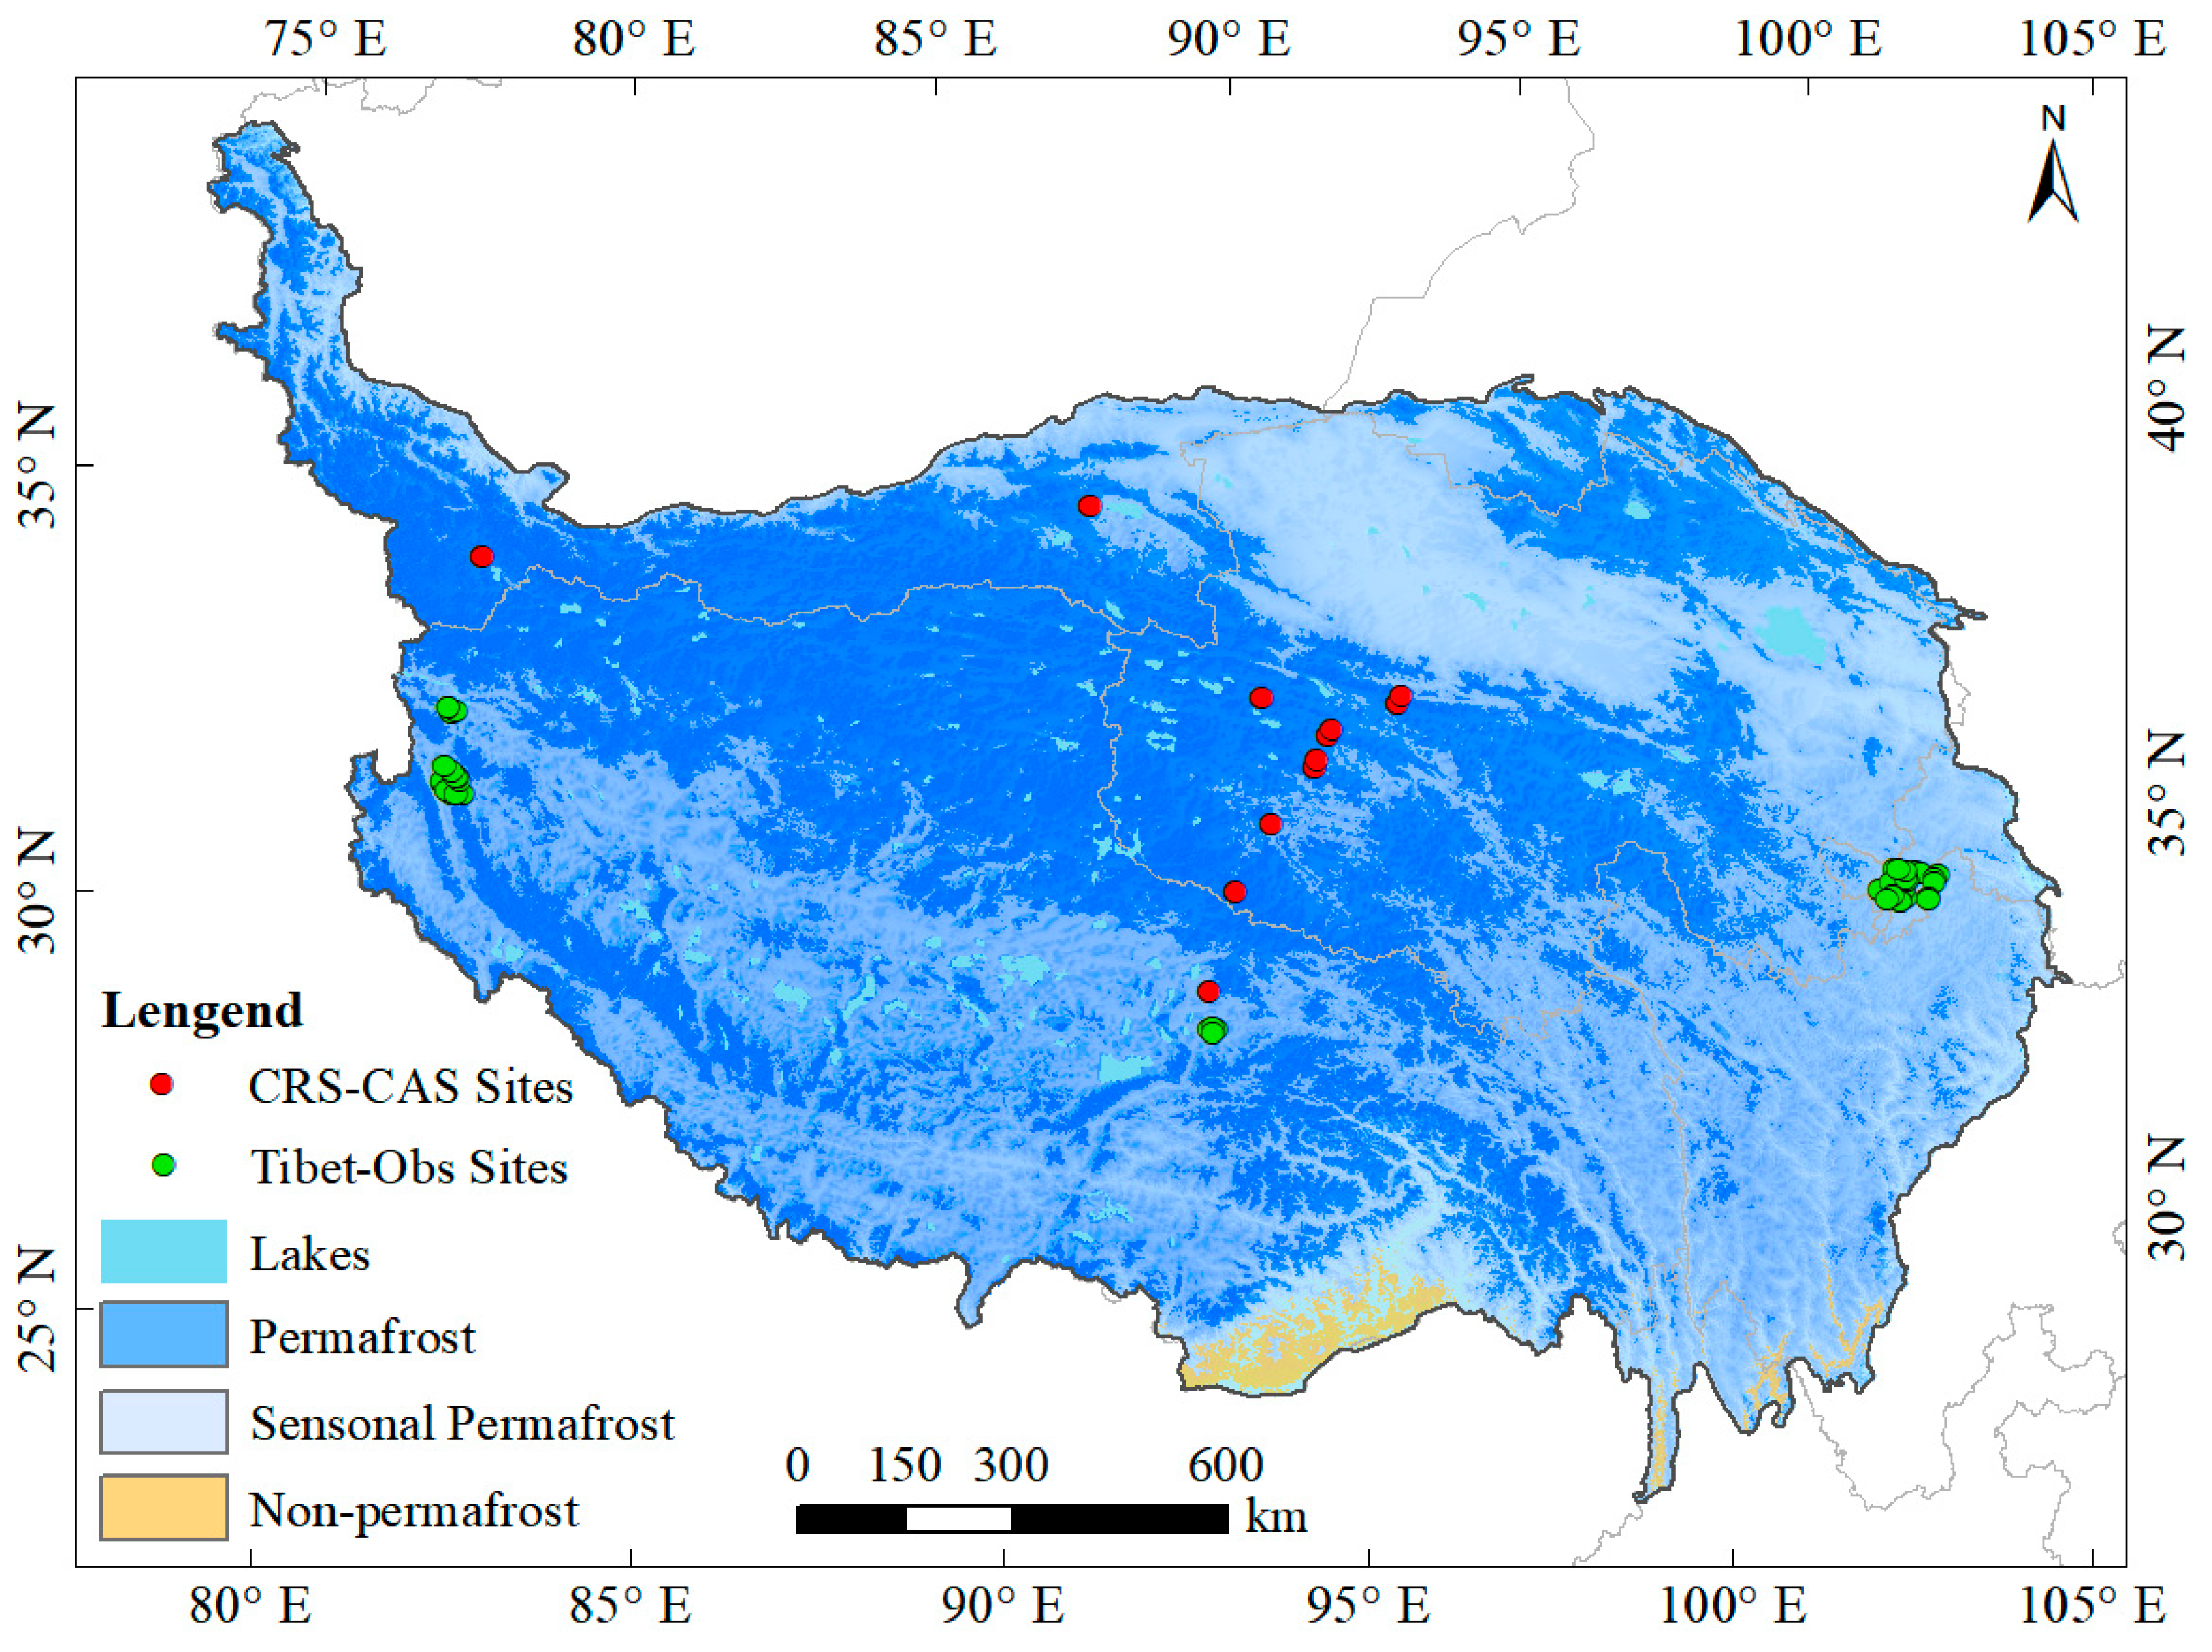
The QTP extends from the Pamir Plateau and the Karakorum Mountains in the west to the Transverse Ranges in the east, from the southern source of the Himalayas in the south, and from the Kunlun Mountains, Alpine Mountains, and Qilian Mountains in the north, with a total area of about 2.57 × 10⁶ km2, and is the highest natural geographical unit in the world, with an average elevation greater than 4000 m [57] (Figure 1). The wide distribution of permafrost, glaciers, and alpine snow make the QTP the source of many great rivers in Asia; thus, it is also known as the “Water tower of Asia” [58]. The areas of perennial and seasonal permafrost on the Qinghai-Tibet Plateau are 1.06 × 10⁶ km2 and 1.456 × 10⁶ km2 (excluding glaciers and lakes), respectively, accounting for 40.2% and 56.0% of the total plateau area [16,18]. Abundant underground ice in the permafrost region is an important solid water resource in QTP, which coordinates water resource structure and water balance and changes of “Asia Water Tower”, and has a significant impact on ecology and water security in the alpine region [59,60,61], and is an important ecological security barrier in China and Asia [62].

Figure 1.
The spatial distribution of ground-based observation sites in the permafrost and seasonal permafrost regions of the Qinghai-Tibet Plateau.
2.2. Data and Preparing
2.2.1. Observation Data
The measured SM data includes two sets, both from the National Tibetan Plateau Third Pole Environment Data Center (https://data.tpdc.ac.cn, accessed on 6 May 2022)): (1) The SM and temperature (SMST) observation data of the Qinghai-Tibet Plateau (Tibet-Obs) [63,64] consists of 61 sites from three regional-scale SMST monitoring networks, i.e., the Maqu (26 sites), Naqu (11 sites), and Ngari (including 4 sites in Ali and 20 sites in Shiquanhe(SQH)) networks. Each network contains multiple SMST in situ monitoring sites, and the surface SM (5 cm) observation data are recorded every 15 min. These stations cover different climate and surface conditions of the QTP. (2) A synthesis dataset of permafrost for the Qinghai-Tibet Plateau [65,66] that contains the soil temperature and humidity at different depths (0–300 cm) of 12 active layer observation stations in the permafrost region of the monitoring network of the cryosphere research station of the Chinese Academy of Sciences (CRS-CAS). All observation data have been strictly quality controlled (The accuracy of active layer temperature is ±0.1 °C to ±0.2 °C, and the accuracy of soil moisture content is ±2.5%). In order to test the changes of SM during the complete permafrost freeze–thaw cycle while maintaining data consistency [58], we selected four observation sites with different climatic and environmental conditions in the permafrost and seasonal permafrost regions (Figure 1, Table 1). Among them, the daily average value of SM in four monitoring networks was used for the Tibet OBS Data. In the CRS-CAS dataset, four stations with different surface conditions and recorded SM at 0–10 cm depth, QT09 (XDT), CH06, qt08, and AYK, were selected for the study.

Table 1.
The geographical and environmental conditions of the study area.
2.2.2. Soil Moisture Estimate Data
The Global Land Evapotranspiration Amsterdam Model (GLEAM) is a set of algorithms dedicated to estimating terrestrial evapotranspiration and root zone SM from satellite data. The algorithm is based on satellite-observed SM, vegetation optical depth, snow-water equivalent, reanalysis of air temperature, radiation, and a multi-source precipitation product, to invert land potential evapotranspiration based on the Priestley–Taylor formula. It estimates the root SM by combining the observed surface SM and empirical drainage algorithms [46,55]. Since its development in 2011, the model has been regularly revised to improve data quality by incorporating new geophysical variables from satellite observations and improving the representation of physical processes [46]. Many researchers have successfully applied it to the studies of spatial-temporal variations of terrestrial evapotranspiration, drought characteristics, and SM variations on a large range [3,67,68]. GLEAM product currently has three versions; the latest edition of the data set can be downloaded from the website (http://geoservices.falw.vu.nl, accessed on 6 May 2022). In this study, we evaluated the applicability of GLEAM V3.5a surface SM product (0–10 cm) on the QTP and used it to study SM changes over the QTP from 1980 to 2020.
2.2.3. Meteorological and Vegetation Data
Temperature and precipitation data (1979–2018) were obtained from the China Meteorological Science Data Center (http://data.cma.cn, accessed on 6 May 2022). The data is based on the daily observations of more than 2400 meteorological stations in China and generated by interpolation processing with Australian ANUSPLIN interpolation software, with a spatial resolution of 0.1°. Vegetation data is NDVI time series data from 1982 to 2020, obtained by data fusion of GIMMS NDVI3g products from 1982 to 2015 and MOD13C1 products from 2000 to 2020 [69], with a spatial resolution of 0.083°. The vegetation type data is 1:1 million vegetation types and zoning in China [70]. Permafrost map is provided by National Tibetan Plateau Data Center (http://data.tpdc.ac.cn, accessed on 6 May 2022) [71]
A summary of the above data is presented in Table 2. The main properties of surface soil moisture (SMsurf) and root-soil moisture (SMroot) of GLEAM SM are similar, and SMsurf has higher accuracy [3,46]. Therefore, GLEAM-SMsurf data from 0–10 cm were used by extracting the daily and annual scale (warm season average) data of the QTP. The vegetation type data were combined into a total of six categories: forest, scrub, alpine steppe, alpine meadow, alpine desert, and others.
Table 2.
Overview of datasets used in this study.
2.3. Methods
2.3.1. Accuracy Evaluation
To quantify the consistency between GLEAM SM products and observed SM, four commonly used error indicators [72], were calculated, namely, root mean square error (RMSE), mean deviation (Bias), correlation coefficient (R), and unbiased RMSE (ubRMSE) [40,73]. In addition, the satellite SM retrieval algorithm cannot accurately estimate SM under freezing conditions [74] because soil freezing leads to significant changes in the soil dielectric constant, which makes the soil dielectric model inapplicable [75]. Therefore, the conclusions of this study are mainly derived from the evaluation of the non-freezing period (May–September), although we evaluated the full freeze-thaw cycle of GLEAM SM products.
2.3.2. Mann–Kendall Trend Test
The Mann–Kendall (MK) test method is a non-parametric statistical test to detect trends and mutation points of time series [76]. The method does not require samples to obey specific distribution characteristics, is less affected by outliers, and detects slight changes in regions and more accurate trends [69]. It is generally combined with the Theil–Sen analysis to analyze trends in the studied elements [77]. In this paper, a combination of both methods was used to analyze the spatial-temporal trends of SM.
2.3.3. Ensemble Empirical Mode Decomposition
In order to reflect SM change processes, this paper introduces the EEMD (Ensemble Empirical Mode Decomposition) method with the feature of temporal localization. This method is an adaptive time-frequency data processing method improved on Empirical Mode Decomposition (EMD) [78], which considers temporal and spatial adaptive properties [79]. EEMD Method performs signal decomposition according to the time-scale characteristics of the data, i.e., local stabilization processing, without setting any predefined basis functions [80]. EEMD captures the evolution of SM over a local time period without over-exaggerating trends due to the length of the series and extreme value points, thus obtaining a more stable SM trend [7,81]. Therefore, it is more advantageous in dealing with nonlinear and non-stationary time series [82,83,84].
The algorithm for EEMD is as follows.
Add the perturbed white noise to the original time series x(t):
where is the signal with added white noise after times. Then, the intrinsic mode functions (IMFs, also called EEMD components) is obtained by EEMD decomposition . To eliminate the influence of artificial white noise, the average sum of the IMFs components obtained by EEMD decomposition for N times is taken as the final IMFs component [85,86], expressed as:
where represents the component obtained after the EEMD decomposition of the original signal. The influence of white noise on the analysis of signals follow the following statistical law:
where connotes the standard deviation (the deviation between the input signal and the reconstructed result of the corresponding IMFs component). The symbol, α, represents the magnitude of the Gaussian white noise. When the noise margin remains the same, with a greater total number, the closer the final decomposition result is to the true value. Finally, the original signal can be decomposed into:
where is the trend term (RES) of data after n intrinsic mode functions (IMFs), representing the general trend of the signals. Each component represents the fluctuations of the original signal at different time scales, with oscillating periods from small to large.
Since IMFs has symmetry, it has the same number of local maxima and minima, as well as the same number of crossing zero points. Therefore, the average period can be determined by counting the number of peaks (local maxima) [85]. The average perimeter of the IMFs component can be calculated according to the following equation:
where is the number of peak points.
At the same time, EEMD can also be used to conduct a significance test given the reliability of each IMFs component. At a given significance level, the decomposition yields that the IMFs component is on the confidence curve relative to the period distribution, indicating that it passes the significance test and can be considered as having actual physically meaningful information within the significance level. The EEMD calculation process is implemented with the python programming.
A perturbed white noise with a signal-to-noise ratio of 0.2 for the original signal was used in this study, and the sample number was 205. The original SM time series during 1980–2020 is split into six IMFs according to the EEMD approach. IMFs 1–5 represent each oscillation component with specific periods from high to low frequency. The trend (corresponding to the last IMFs) is obtained after removing the oscillation components from the original time series.
3. Results
3.1. Accuracy Evaluation of GLEAM SM Products
3.1.1. Comparison of GLEAM SM Products and Observation Data
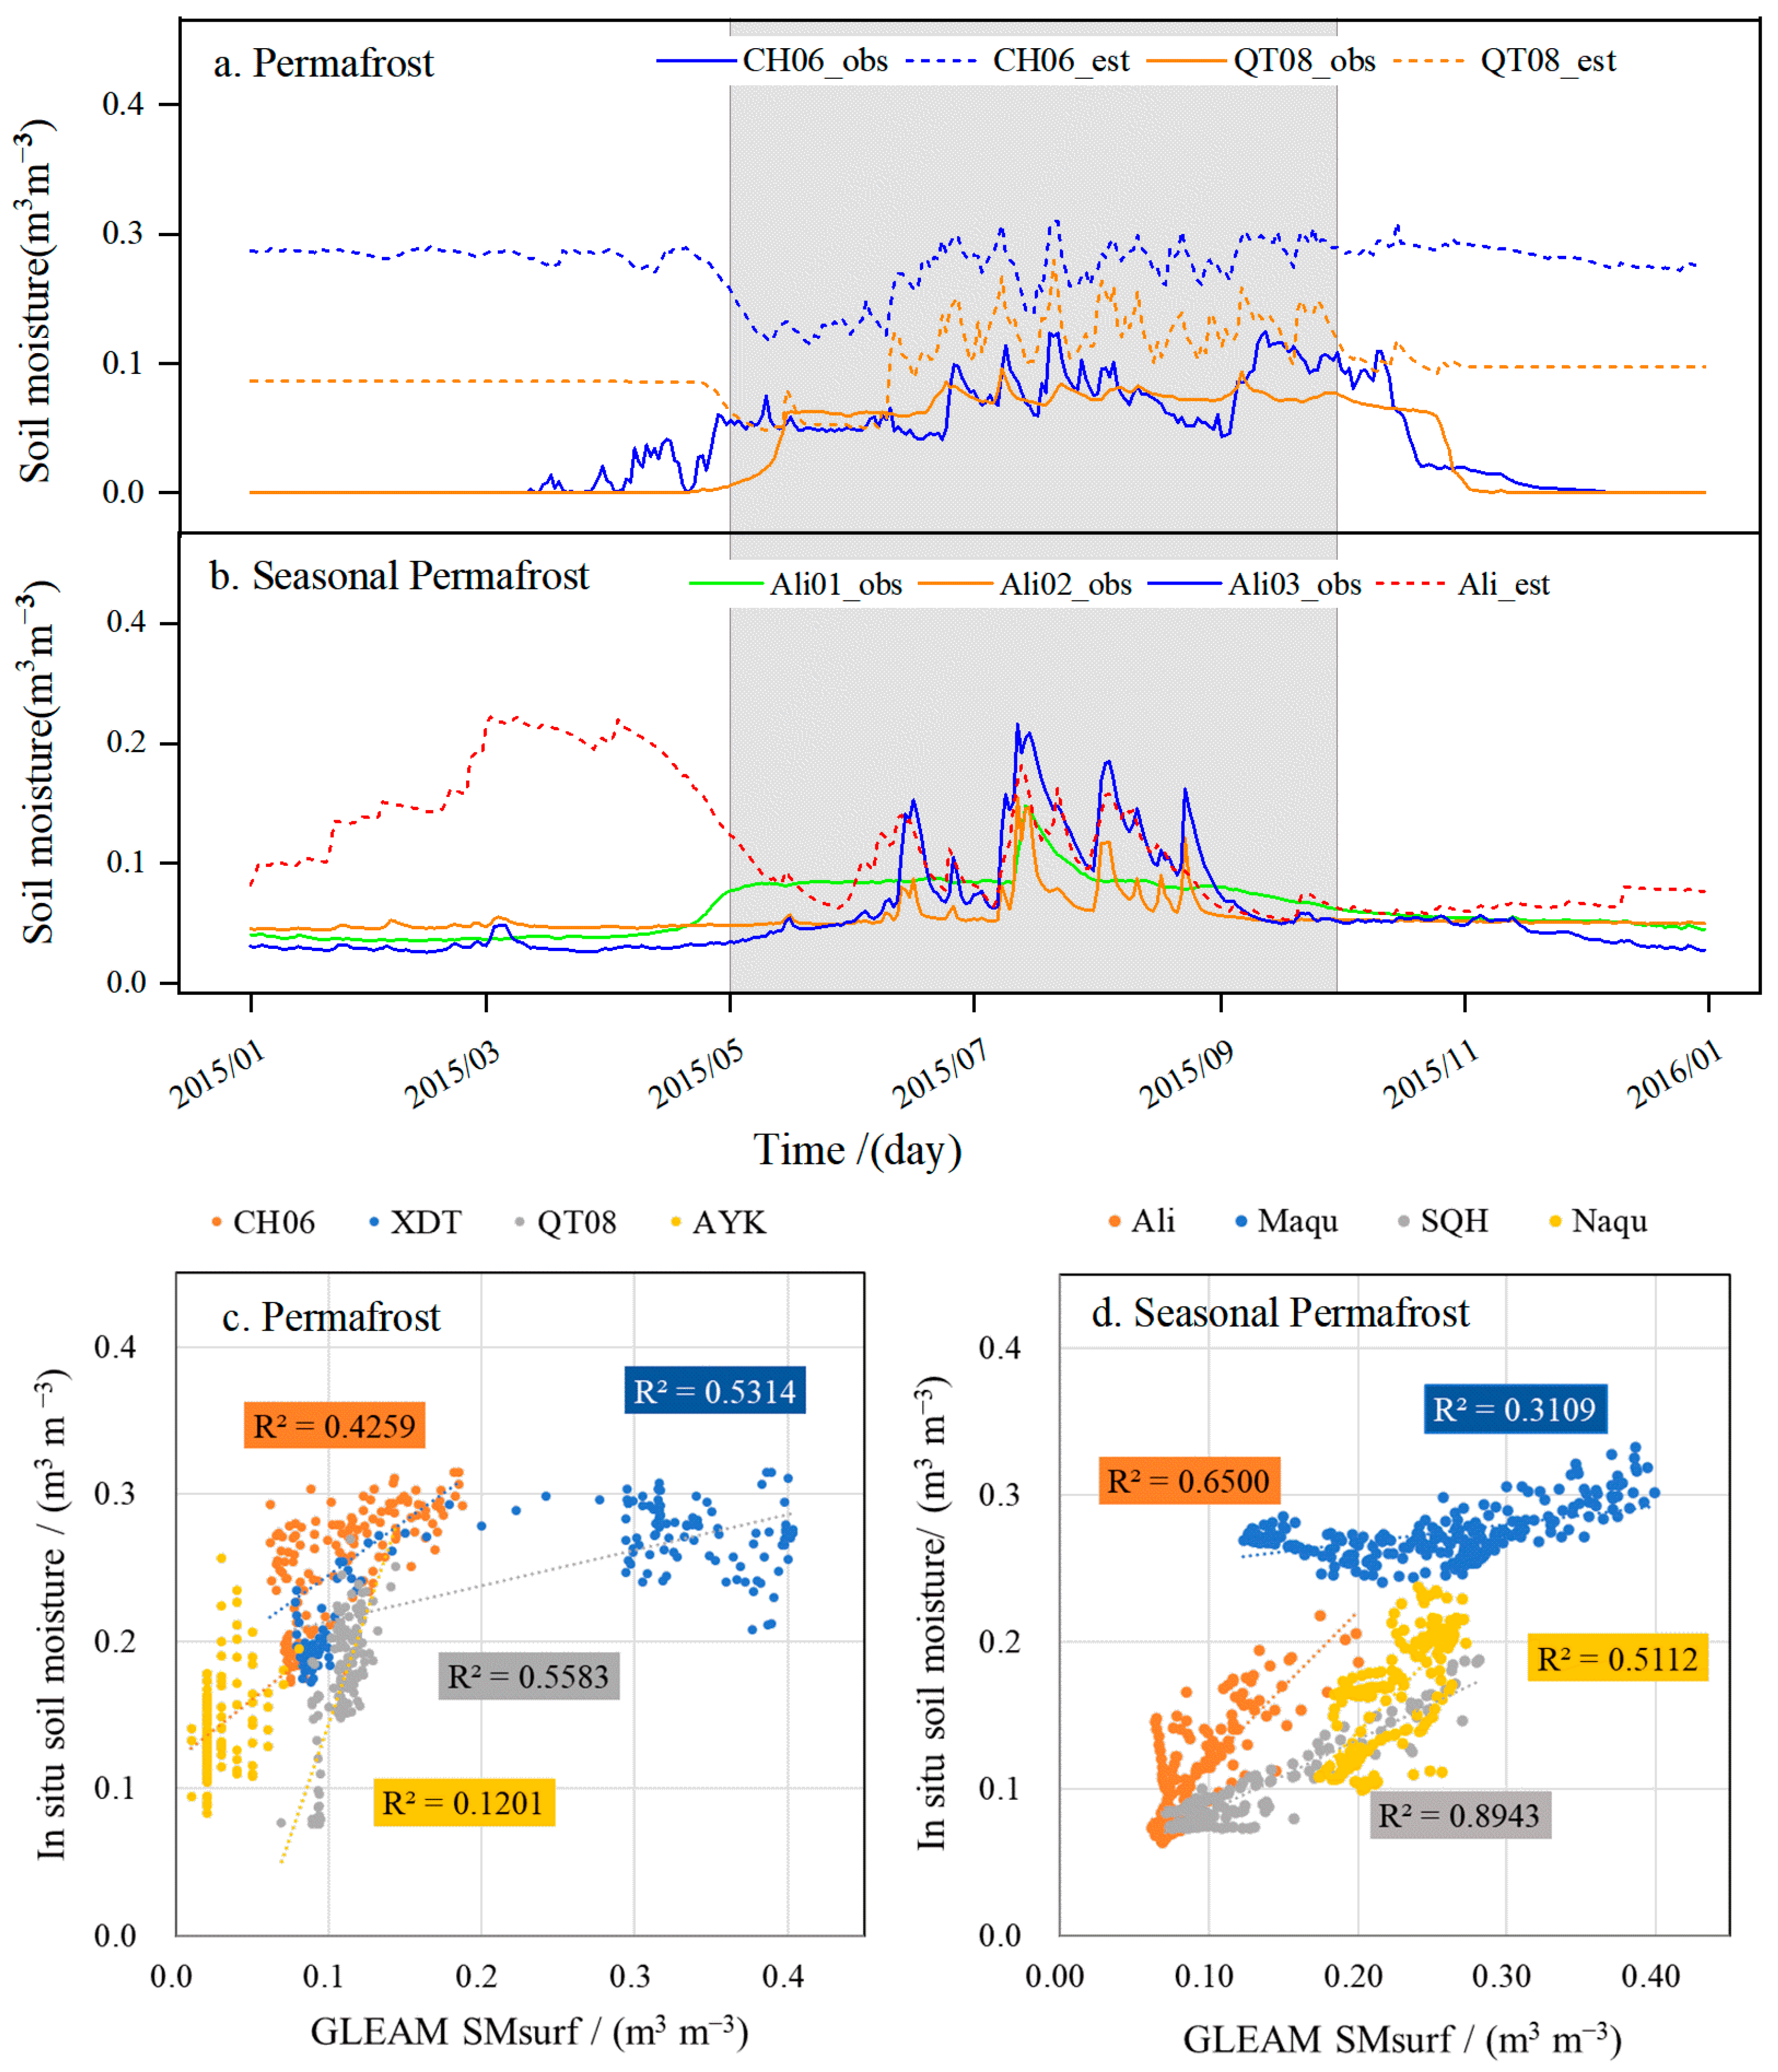
According to the comparison of daily SM between in situ site records and GLEAM SM products (Figure 2), the consistency between the two was strongest in the warm season (May to September), while GLEAM SM was significantly overestimated in the cold season. Figure 2 and Table 3 show the scatterplots of GLEAM SM and in situ SM observations in the warm season, as well as the calculated correlation coefficients (R), root mean square error (RMSE), Bias, and unbiased RMSE (ubRMSE). The results show that the GLEAM SM products of most stations had good correlation with the observations (with a median ubRMSE value of 0.031 m3 m−3, and with a median R-value of 0.738). The highest R-value of nearly 0.95 was at the Shizquanhe (SQH) station in the seasonal permafrost region. SQH had a ubRMSE of 0.031 m3 m−3 and a Bias of 0.031 m3 m−3. The AYK station (near 60°N) in the permafrost region performed poorly with an R-value of only 0.347. Although the XiDaTan (XDT) station in the permafrost region had a high correlation coefficient (R = 0.729), the RMSE and ubRMSE of the station were both 0.095 m3 m−3, which is not up to the official accuracy (ubRMSE < 0.05 m3 m−3) [46].
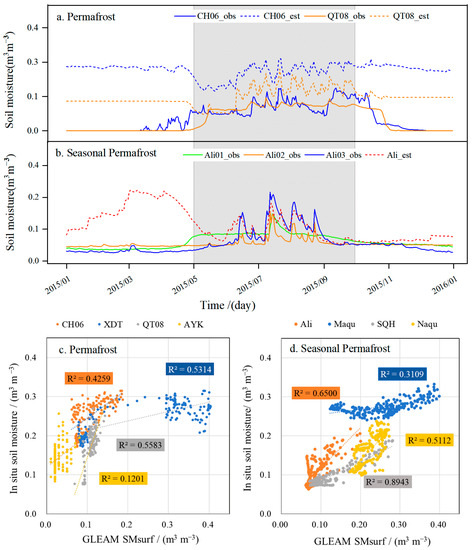
Figure 2.
Time series and scatter plots of daily soil moisture versus GLEAM SMsurf at the observation site. (a) Time series of stations in the permafrost region. (b) Time series of stations in the seasonal permafrost region. (c) Scatterplot of permafrost region. (d) Scatterplot of stations in the seasonal permafrost region. Note: (a,b) are labeled with the suffix “_obs” for the actual SM data at the site and the suffix “_est” for the GLEAM SM product at the site location; (a,b) have similar time series consistency between actual SM and GLEAM SM at each site in different types of permafrost regions; some sites were chosen as representatives.
Table 3.
Correlation analysis of observed soil moisture and GLEAM SM products in permafrost regions 1.
In general, GLEAM SM products in the warm season were somewhat overestimated compared to measured SM, but had a higher correlation and lower error in seasonal permafrost regions, resulting in higher data accuracy. Compared with the assessment results [50,53] for ESA CCI SM products on the QTP (ubRMSE value of 0.043 m3 m−3 and 0.05 m3 m−3, respectively), the median ubRMSE value (0.031 m3 m−3) of GLEAM SM at in situ sites was lower, closer to the real SM. The data accuracy of GLEAM SM was higher than that of ESA CCI SM, and GLEAM SM products had stronger spatial continuity. Therefore, SMsurf, a surface SM product of GLEAM V3.5a, was used later in this study to analyze SM trends and the causes of wetting or drying in the QTP during the warm season (May–September) from 1980 to 2020.
3.1.2. Comparison of Hydrological Characteristics of GLEAM SM and Precipitation
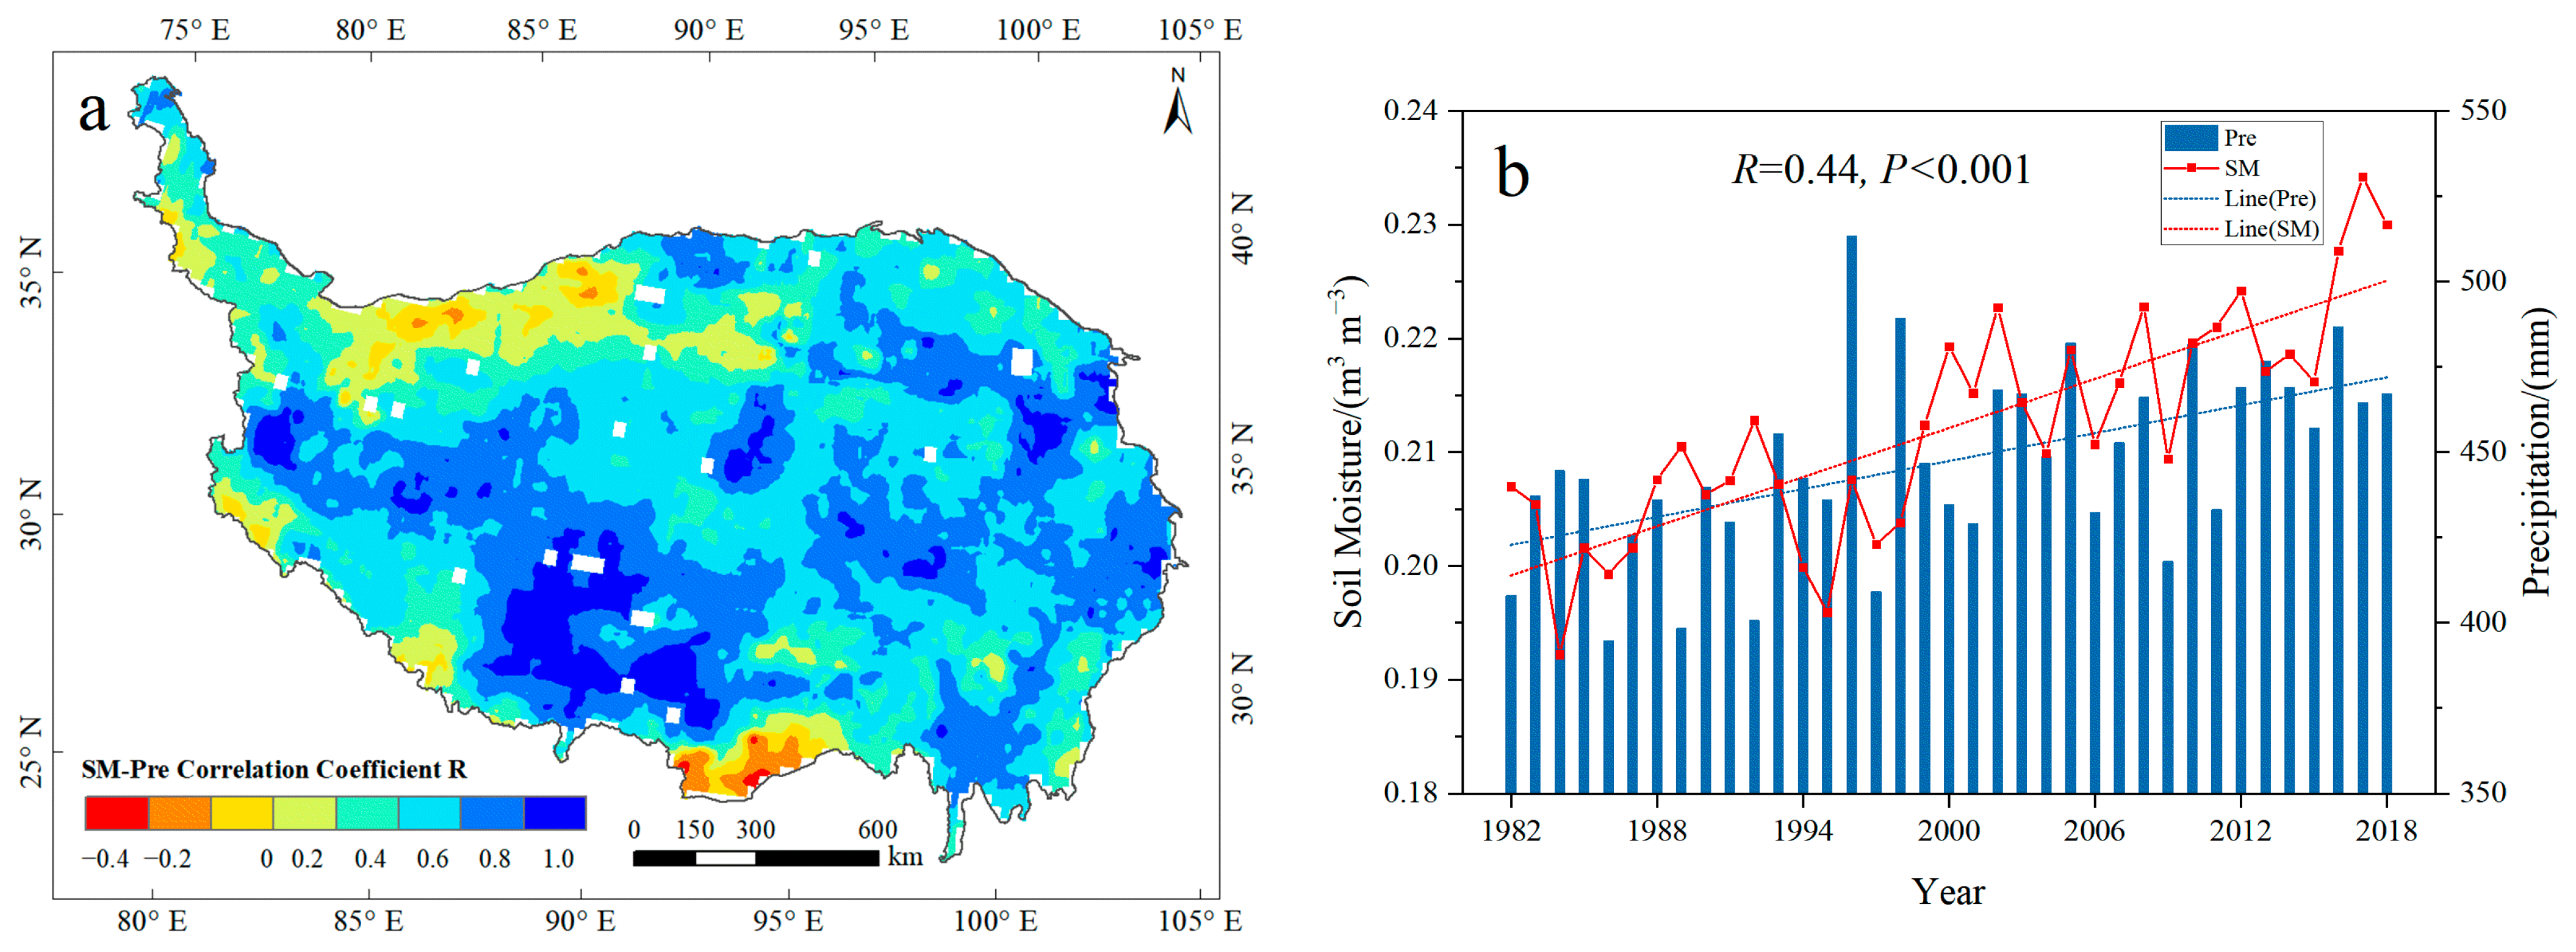
At specific temporal and spatial scales, changes in SM are influenced, to some extent, by precipitation. It is usually a precipitation anomaly event when SM is anomalous [2]. Therefore, the relationship between average SM and precipitation anomalies during the warm season was calculated from temporal and spatial scales (Figure 3). The spatial distribution of SM and precipitation showed a gradual decrease from the south-east to the north-west on the Qinghai-Tibet Plateau in the recent 40 years. The spatial correlation between them was significant in the warm season (R = 0.50), consistent with previous studies [4,36,87]. There was a strong spatial consistency between SM and precipitation, except for the desert areas in the north-west and the forested areas in the south. SM and precipitation were positively correlated in more than 97% of the plateau (Figure 3a), and 56.4% of the regions were significantly positively correlated (R > 0.50, p < 0.05). Thus, the changes in SM and precipitation were quite similar, so it can be concluded that there is an apparent hydrological consistency between GLEAM SM and precipitation in QTP.

Figure 3.
Correlation analysis of soil moisture (SM) and precipitation (Pre) at spatial and temporal scales. (a) Spatial correlation; (b) annual correlation.
The interannual variation of SM and precipitation in the last 40 years of the warm season gave a correlation coefficient of 0.44 (Figure 3b). SM variation increased more strongly than precipitation variation, indicating that the increase of SM does not only depend on precipitation. Furthermore, the correlation was stronger for the negative values of SM and precipitation than for the positive values. For example, after the positive precipitation anomalies in 1988, 1999, and 2010, the SM still increased slightly. This further indicates that SM does not necessarily increase with precipitation due to other hydrological factors, such as permafrost ablation, and the response has a lag time.
3.2. Trend Characteristics and Spatial Heterogeneity of Soil Moisture
3.2.1. Dynamic Trends of Soil Moisture
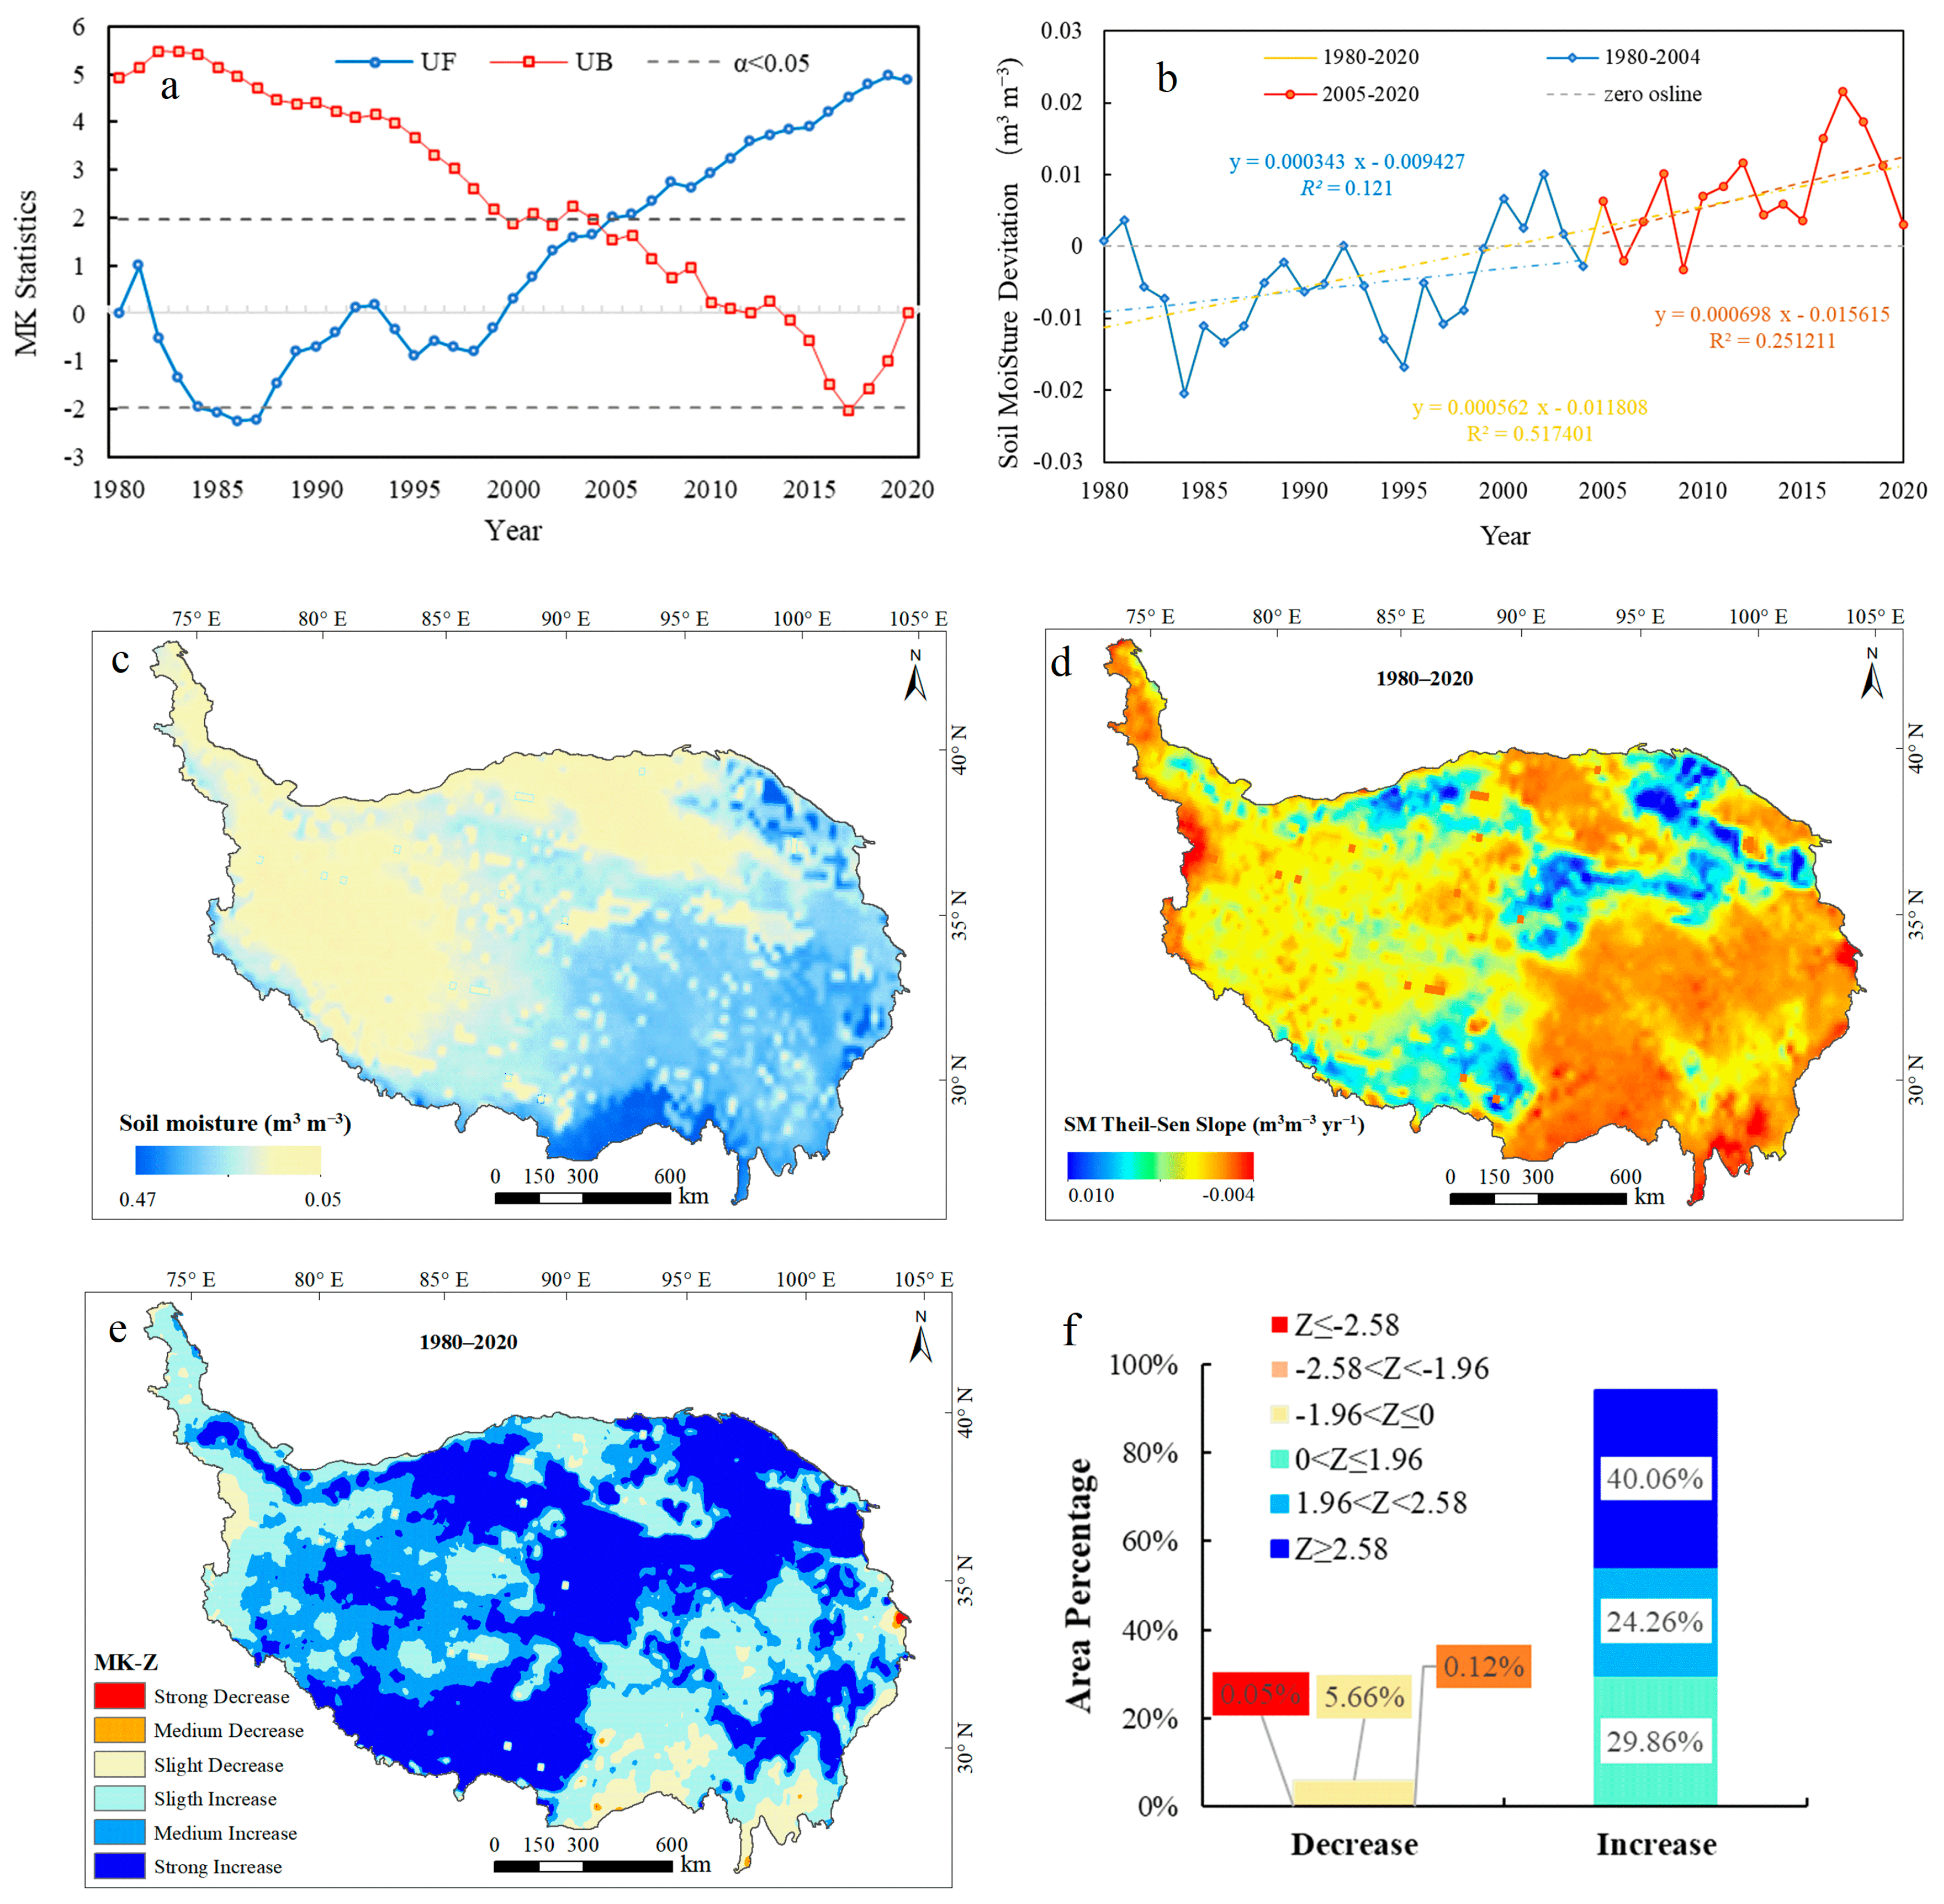
The mean SM in the warm season of the Qinghai-Tibet Plateau from 1980 to 2020 ranged from 0.192 to 0.234 m3 m−3, with an average of 0.213 m3 m−3. The spatial distribution of SM showed a decrease from south-east to north-west, while the lowest SM was found in the Qaidam Basin (Figure 4c). The MK mutation test on the SM of the Qinghai-Tibet Plateau showed an increasing trend from 1980 to 2020 (Figure 4a,b). In 2005–2020 (UF curve exceeding 95% confidence interval), SM increased significantly at a rate of 0.698 × 10⁻³ m3 m−3 yr−1, which was twice that of 1980–2004 (0.343 × 10⁻³ m3 m−3 yr−1). Since 2004, SM in the Qinghai-Tibet Plateau has been higher than the multi-year average, meaning that the soil is generally wet. Combined with the MK trend test (Figure 4d), the Theil–Sen slope of average SM over the QTP was estimated to be 0.573 × 10⁻³ m3 m−3 yr−1, with a 95% confidence interval of −0.618–3.977 × 10⁻³ m3 m−3 yr−1. Linear regression results indicated that the rate of SM change was 0.562 × 10⁻³ m3 m−3 yr−1 in the QTP during the study period, with a coefficient of determination greater than 0.51. Overall, there is an increasing trend in SM across the plateau [54,88], which is consistent with the general trend of increasing precipitation [61] and decreasing evaporation [68].
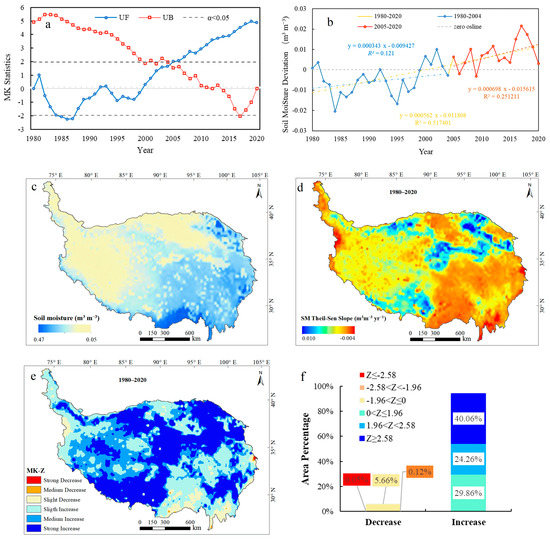
Figure 4.
Trends of soil moisture (SM) at interannual and pixel scales over the Qinghai-Tibet Plateau from 1980 to 2020. (a) The Mann–Kendall (MK) mutation test, (b) the linear trend of SM, (c) the spatial pattern of SM, (d) the spatial distribution of the Theil–Sen slope, (e) the spatial distribution and reclassification of the MK significance test, and (f) the area percentage statistics of (e).
3.2.2. Spatial Heterogeneity of Soil Moisture Dynamics Trends
Regional differences exist in the spatial distribution of the SM trend detected by the MK test. (Figure 4d,e). The SM significantly increased (p < 0.01) in 64.31% of the plateau, including the hinterland of the Plateau, the Himalayas, and the Qilian Mountains, indicating that the soil of the QTP was dominated by wet trends from 1980 to 2020. There was no significant increase (p < 0.05) in 29.86% of the regions, mainly distributed in the humid region in the southeast of the Plateau, the Qaidam Basin in the north, and the arid region in the west, which are perennial seasonal permafrost regions. Only 5.83% of the entire plateau showed a decreasing SM trend, mainly in the south-eastern part of the plateau, the south-western edge, and part of the eastern edge of the Qilian Mountains. This is consistent with the research results [88], which showed that the soil in the drier region in the middle Qinghai-Tibet Plateau had a significant trend of wetting, while the humid region usually had no significant change. At the same time, the average rate of soil wetting (0.681 × 10⁻³ m3 m−3 yr−1) was significantly faster than that of soil drying (−0.179 × 10⁻³ m3 m−3 yr−1).
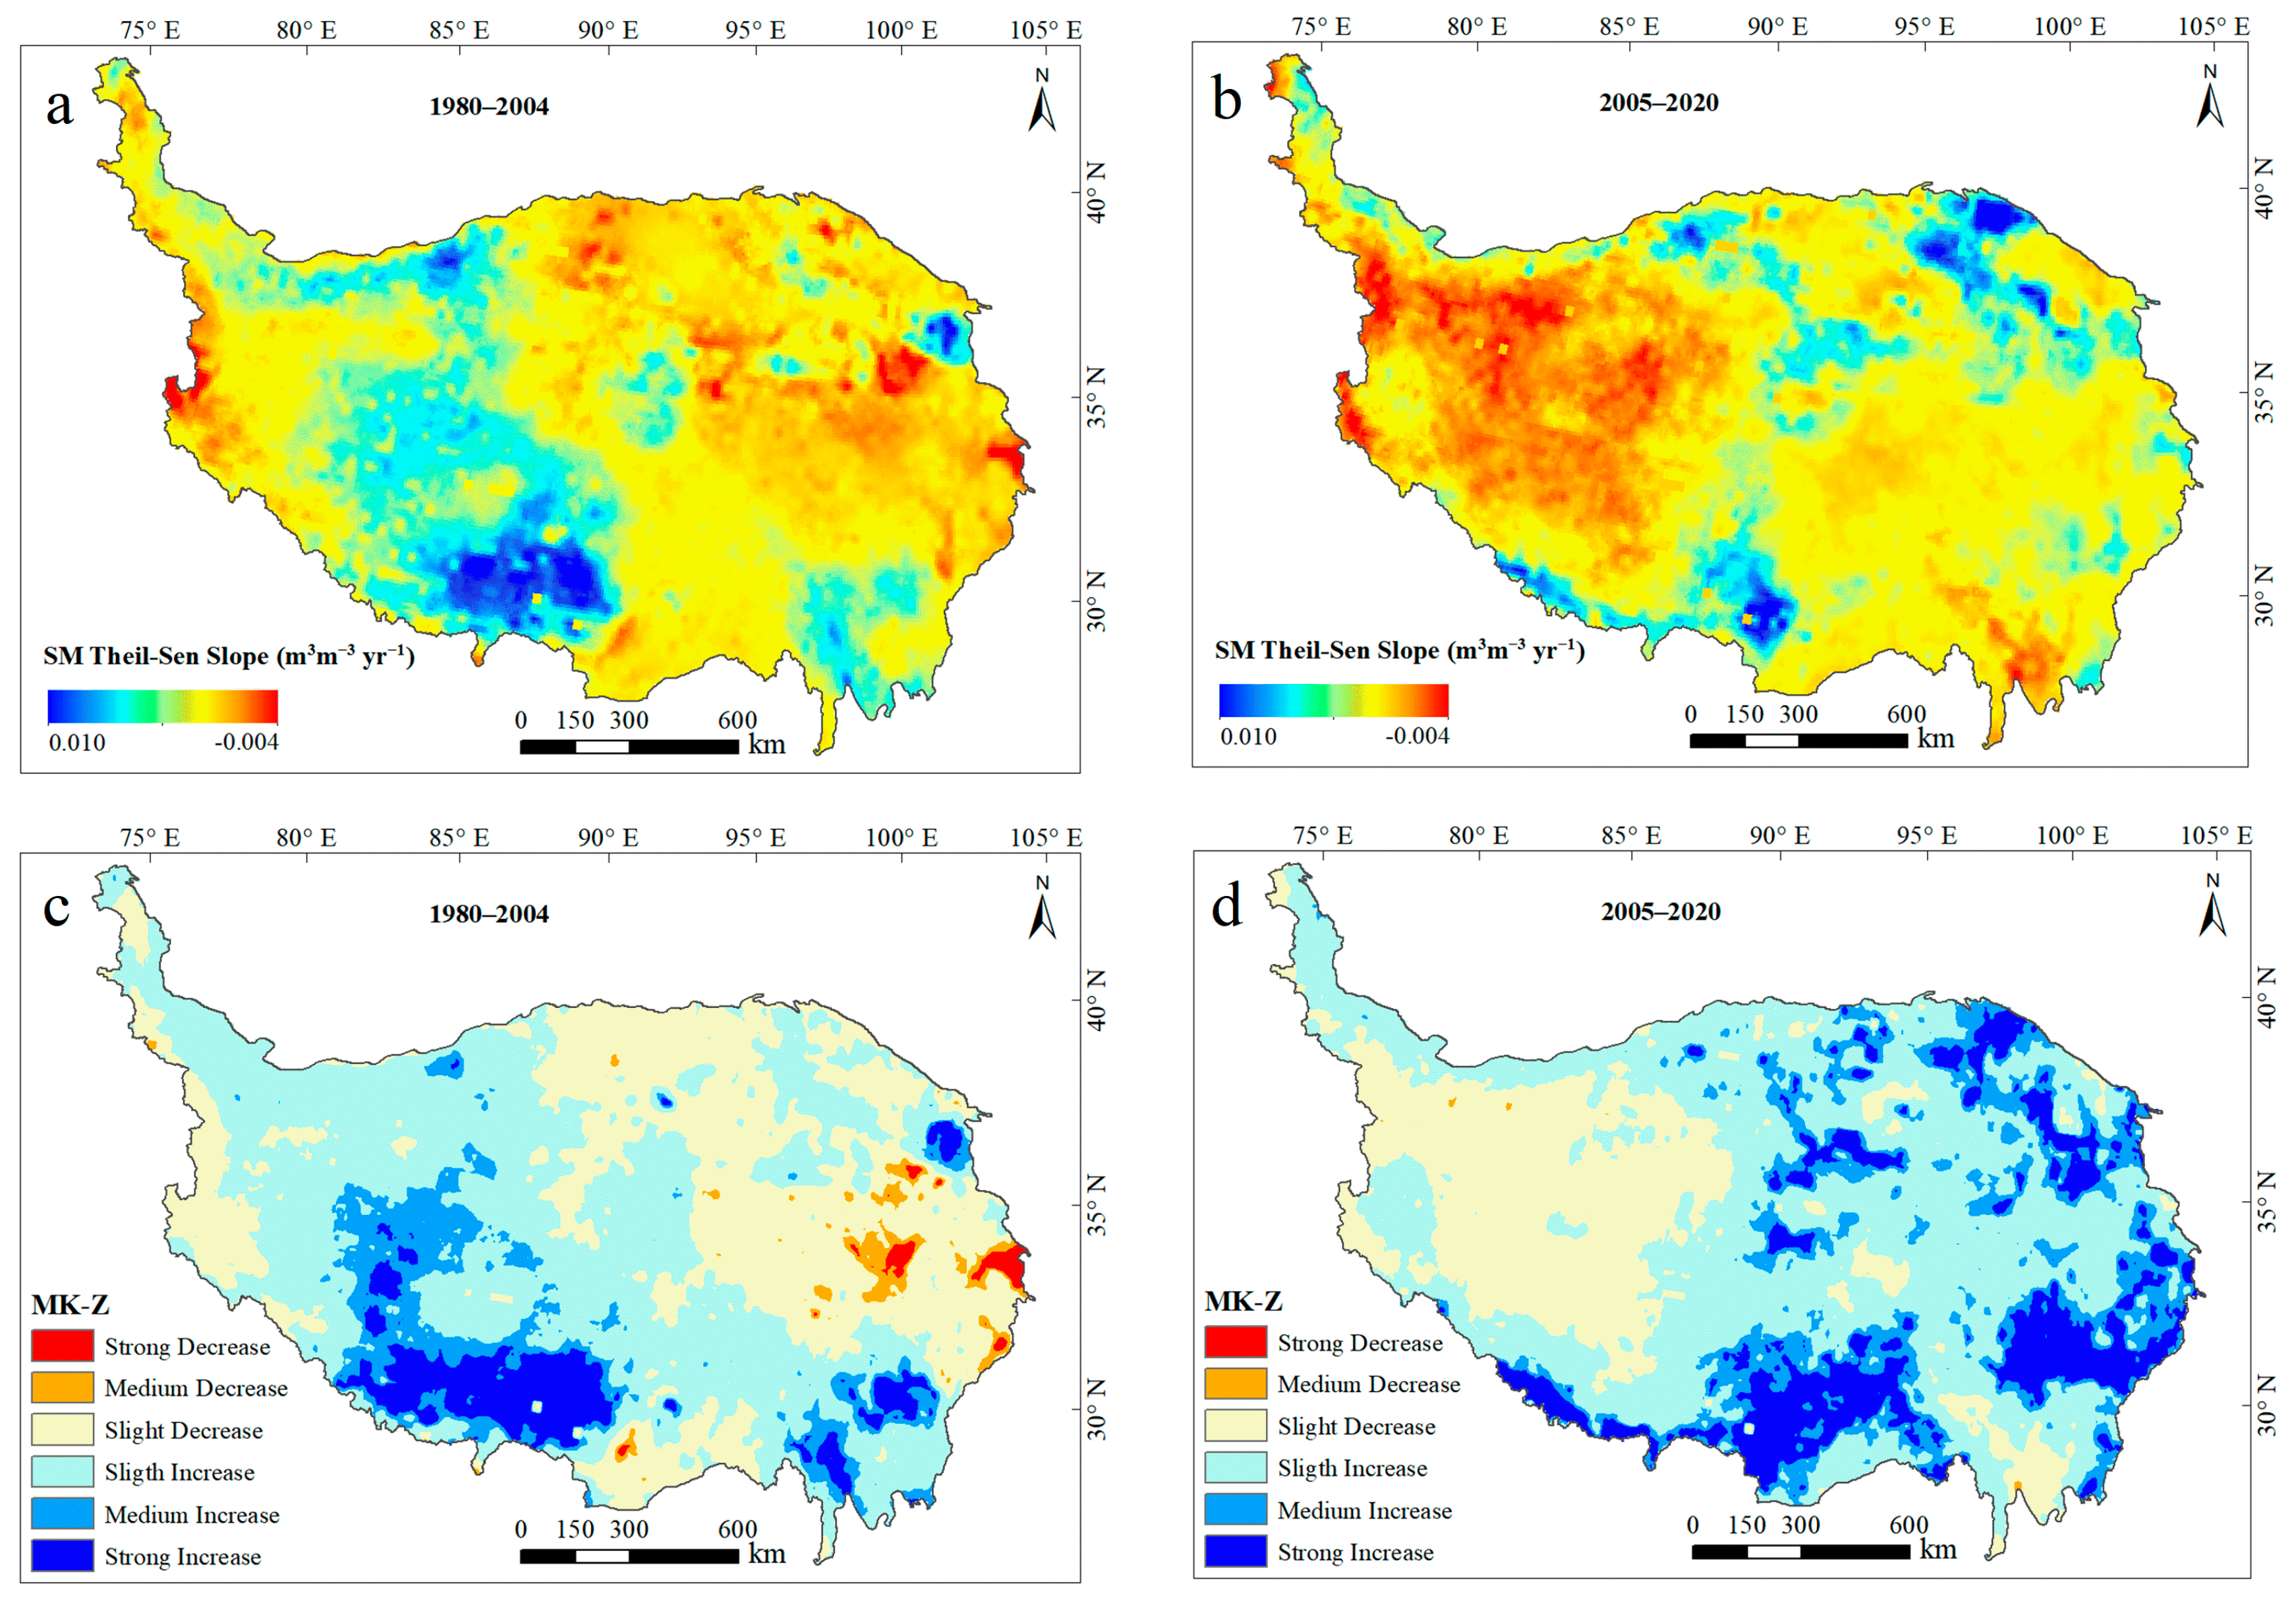
According to the Z-value significance of the MK test and the spatial mean of the SM Theil–Sen slope on the QTP, the Theil–Sen slope was classified into six classes (Figure 4e). The 40.06% regional SM wetting rate of the Qinghai-Tibet Plateau was significantly faster than the average of the whole plateau. The segmented MK test (Figure 5) showed that the SM changes on the Qinghai-Tibet Plateau from 1980 to 2004 were characterized by wetting in the southwest region and drying in the northeast, while the situation reversed after 2005. This may be related to warmer temperatures and more permafrost melting to replenish surface moisture. In general, the SM wetting area was larger than that of desiccation before and after 2005, and the SM in the plateau hinterland was mainly affected by continuous wetting.
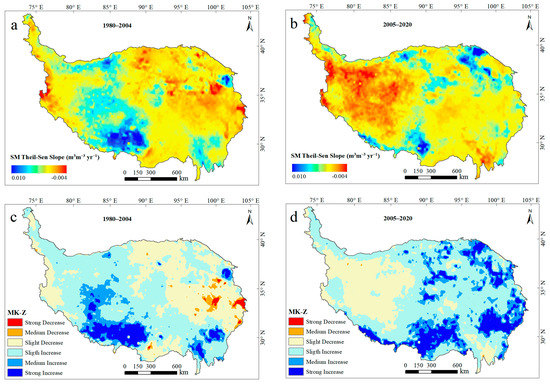
Figure 5.
Spatial differences of soil moisture (SM) dynamics between 1980–2004 and 2005–2020. (a) Theil–Sen slope in 1980–2004, (b) Theil–Sen slope in 2005–2020, (c) reclassification of the MK test in 1980–2004, (d) reclassification of MK test in 2005–2020.
3.2.3. Soil Moisture Dynamics under Different Vegetation Conditions
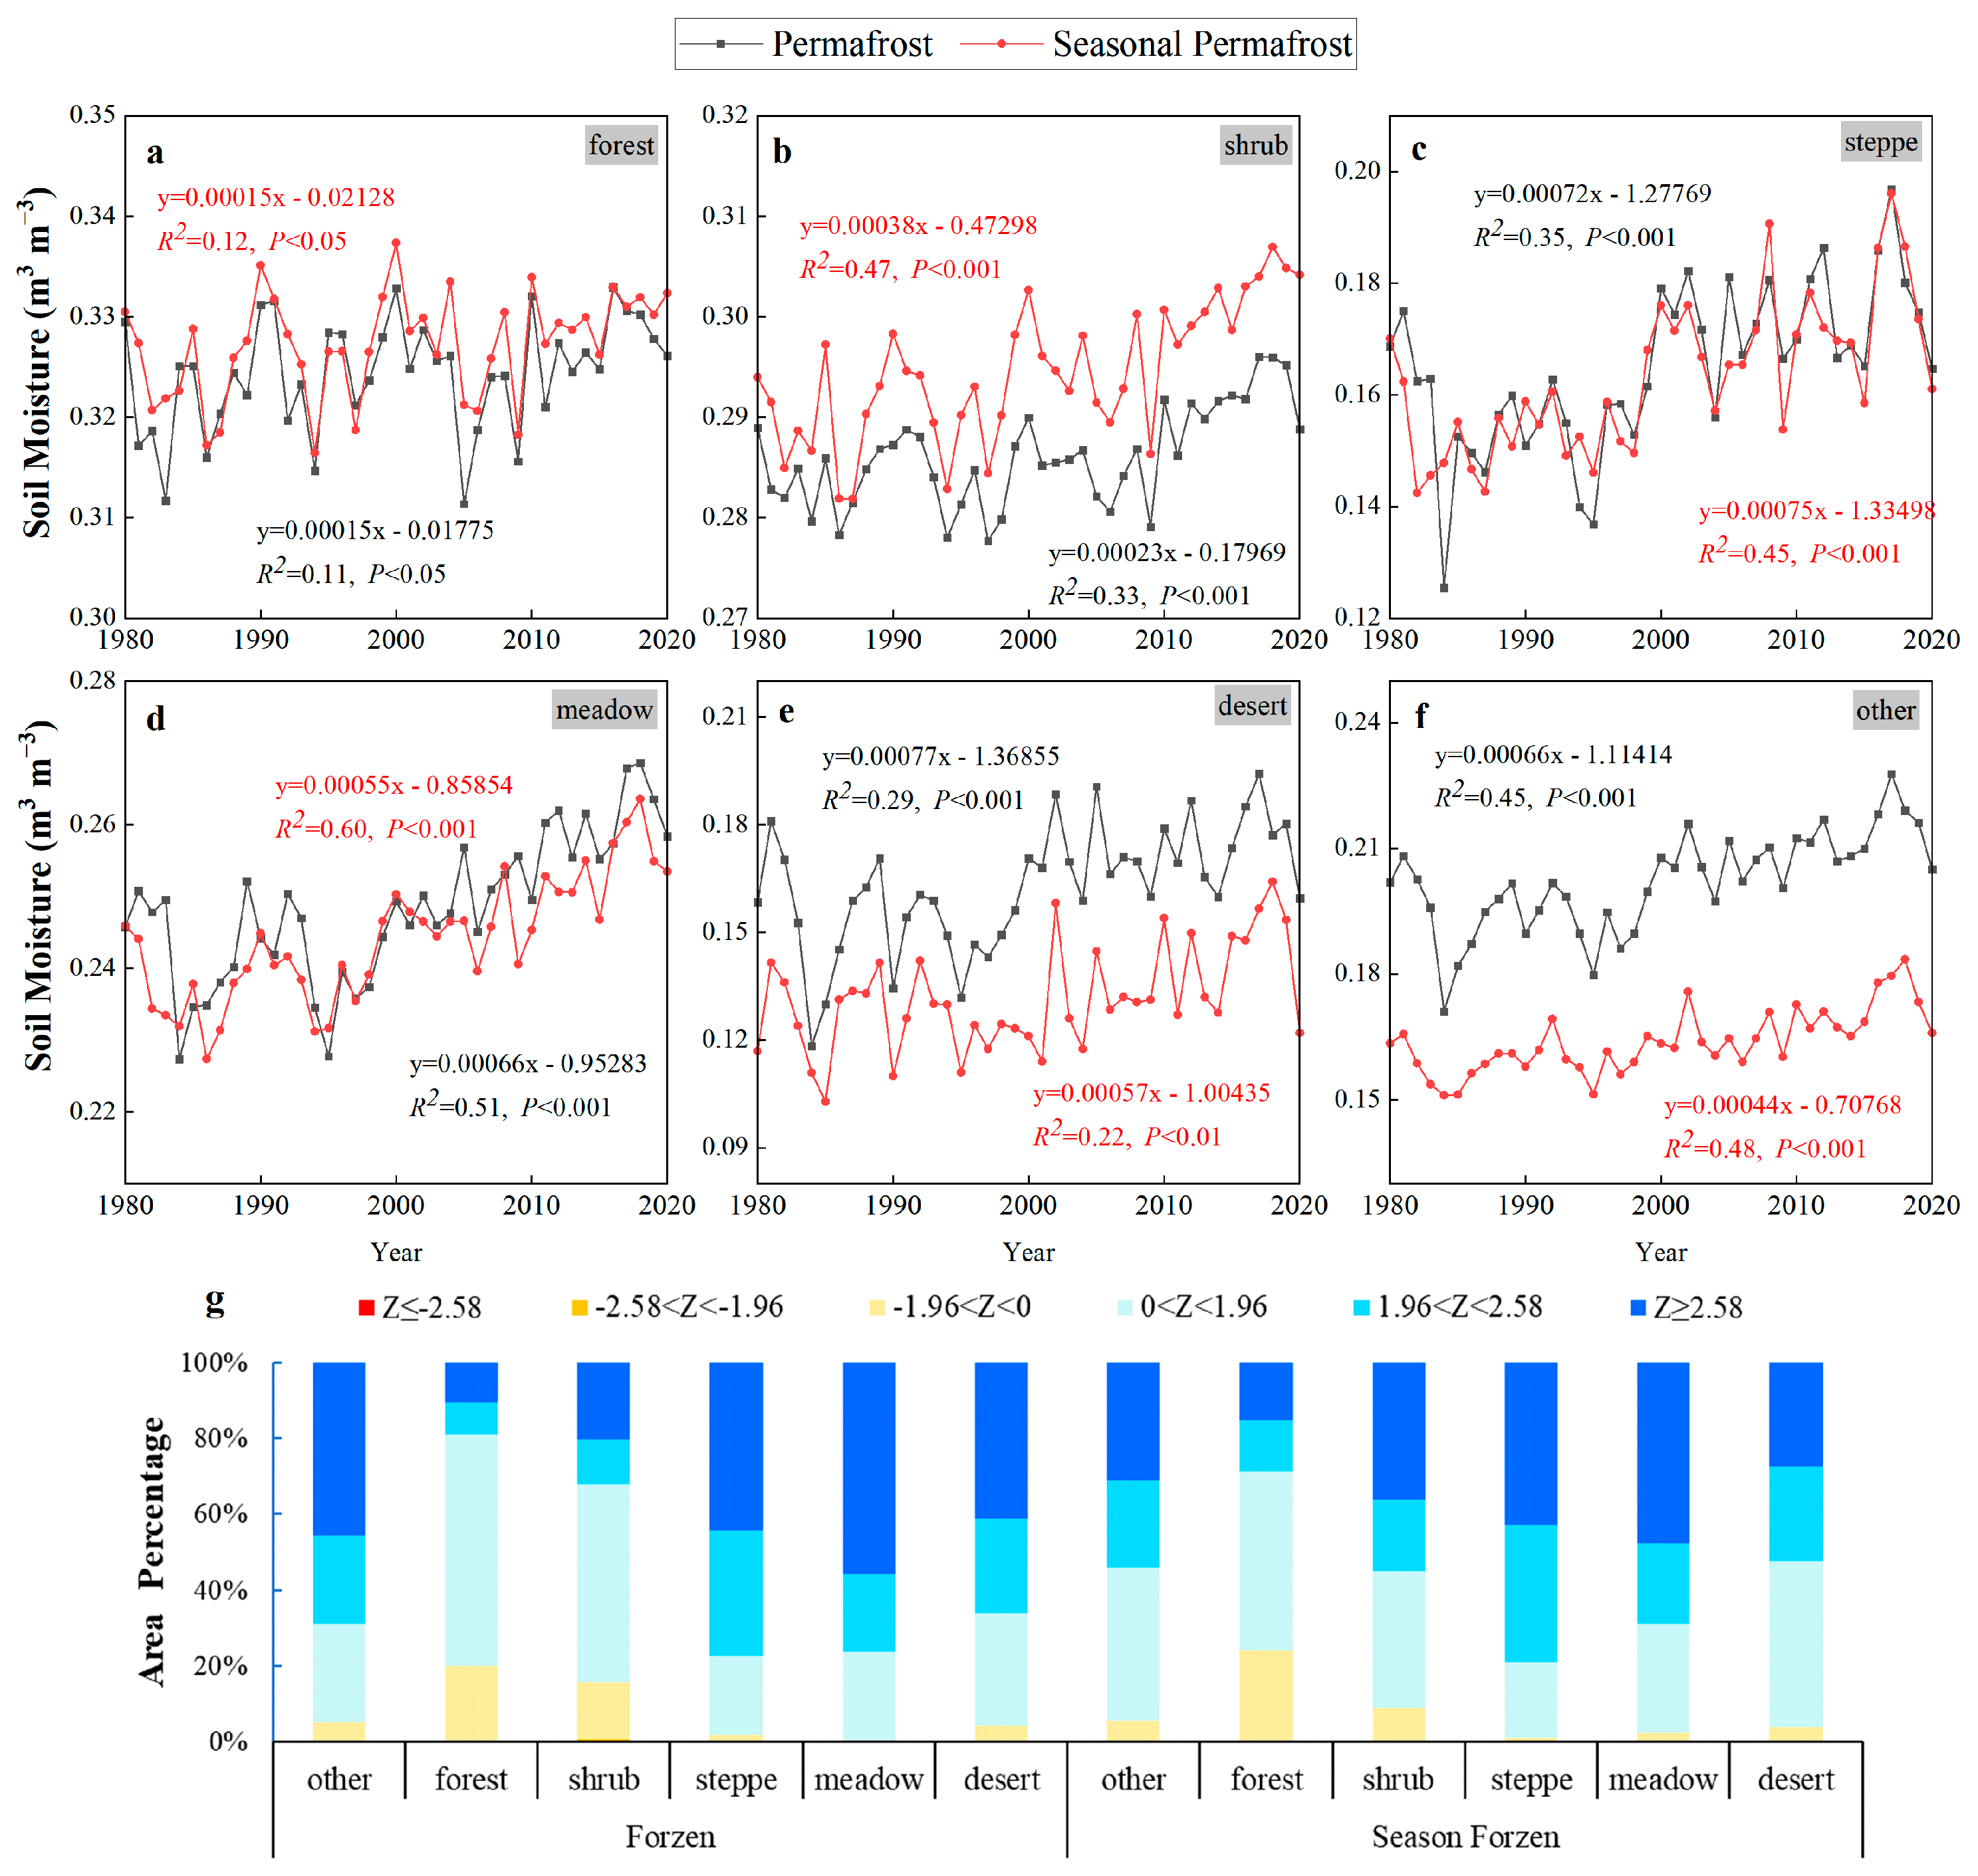
In the QTP, the humid soil area is mainly covered by forest, shrub, and alpine meadow, while the dry soil area is mainly covered by steppe, sparse vegetation, and desert (Figure 4c). The multi-year SM mean values for forest, scrub, grassland, meadow, desert, and non-vegetated areas were 0.326, 0.290, 0.164, 0.246, 0.147, and 0.183 m3 m−3, respectively. All vegetation types showed an upward trend from 1980 to 2020 (Figure 6). Under the same vegetation type cover conditions, the SM rises faster in all permafrost regions than in seasonal permafrost region. The SM increase rate in the alpine desert in permafrost region was the highest (0.77 × 10⁻³ m3 m−3 yr−1), followed by steppe (0.72 × 10⁻³ m3 m−3 yr−1) and meadow (0.66 × 10⁻³ m3 m−3 yr−1), and shrub and forest region SM increased slowly. Compared with bare land, forest, and shrub had higher SM values but slower rise rates, while alpine steppe, alpine meadow, and highland desert types had lower SM but significantly faster rise rates than forest and scrub. This is strongly related to the different water storage and connotation functions [89] and evapotranspiration capacity [68] of different vegetation types. Generally, water storage and conservation function of forest and scrub are better than that of alpine grassland, but their evapotranspiration of forest and shrub vegetation is far greater than that of grassland. The tall canopy structure can also trap soil evaporation [18], leading to a more stable SM of forest and shrub vegetation [90]. In addition, the differences in SM rates of different vegetation types in permafrost and seasonal permafrost regions showed that the height and coverage of the vegetation canopy significantly affected the permafrost ablation process and the soil wetting trend [41,68]. In particular, except for the forest, the areas with positive Theil–Sen slopes of the six vegetation types are more than 50%, and the area of the largest steppe is close to 80% (Figure 6g). On the whole, the wetting speed of the permafrost region was faster, and the positive area accounted for a larger proportion. Therefore, the trend of soil wetting is spatially dominant.
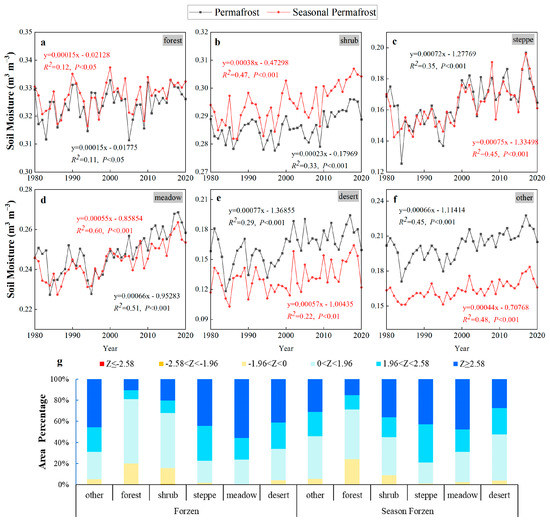
Figure 6.
Soil moisture linear trends and area percentage statistics of MK tests for different vegetation types in permafrost and seasonal permafrost regions. (a) Forest, (b) shrub, (c) steppe, (d) meadow, (e) desert, (f) other, (g) area percentage statistics of the MK test.
4. Discussion
4.1. Trend Analysis Based on EEMD
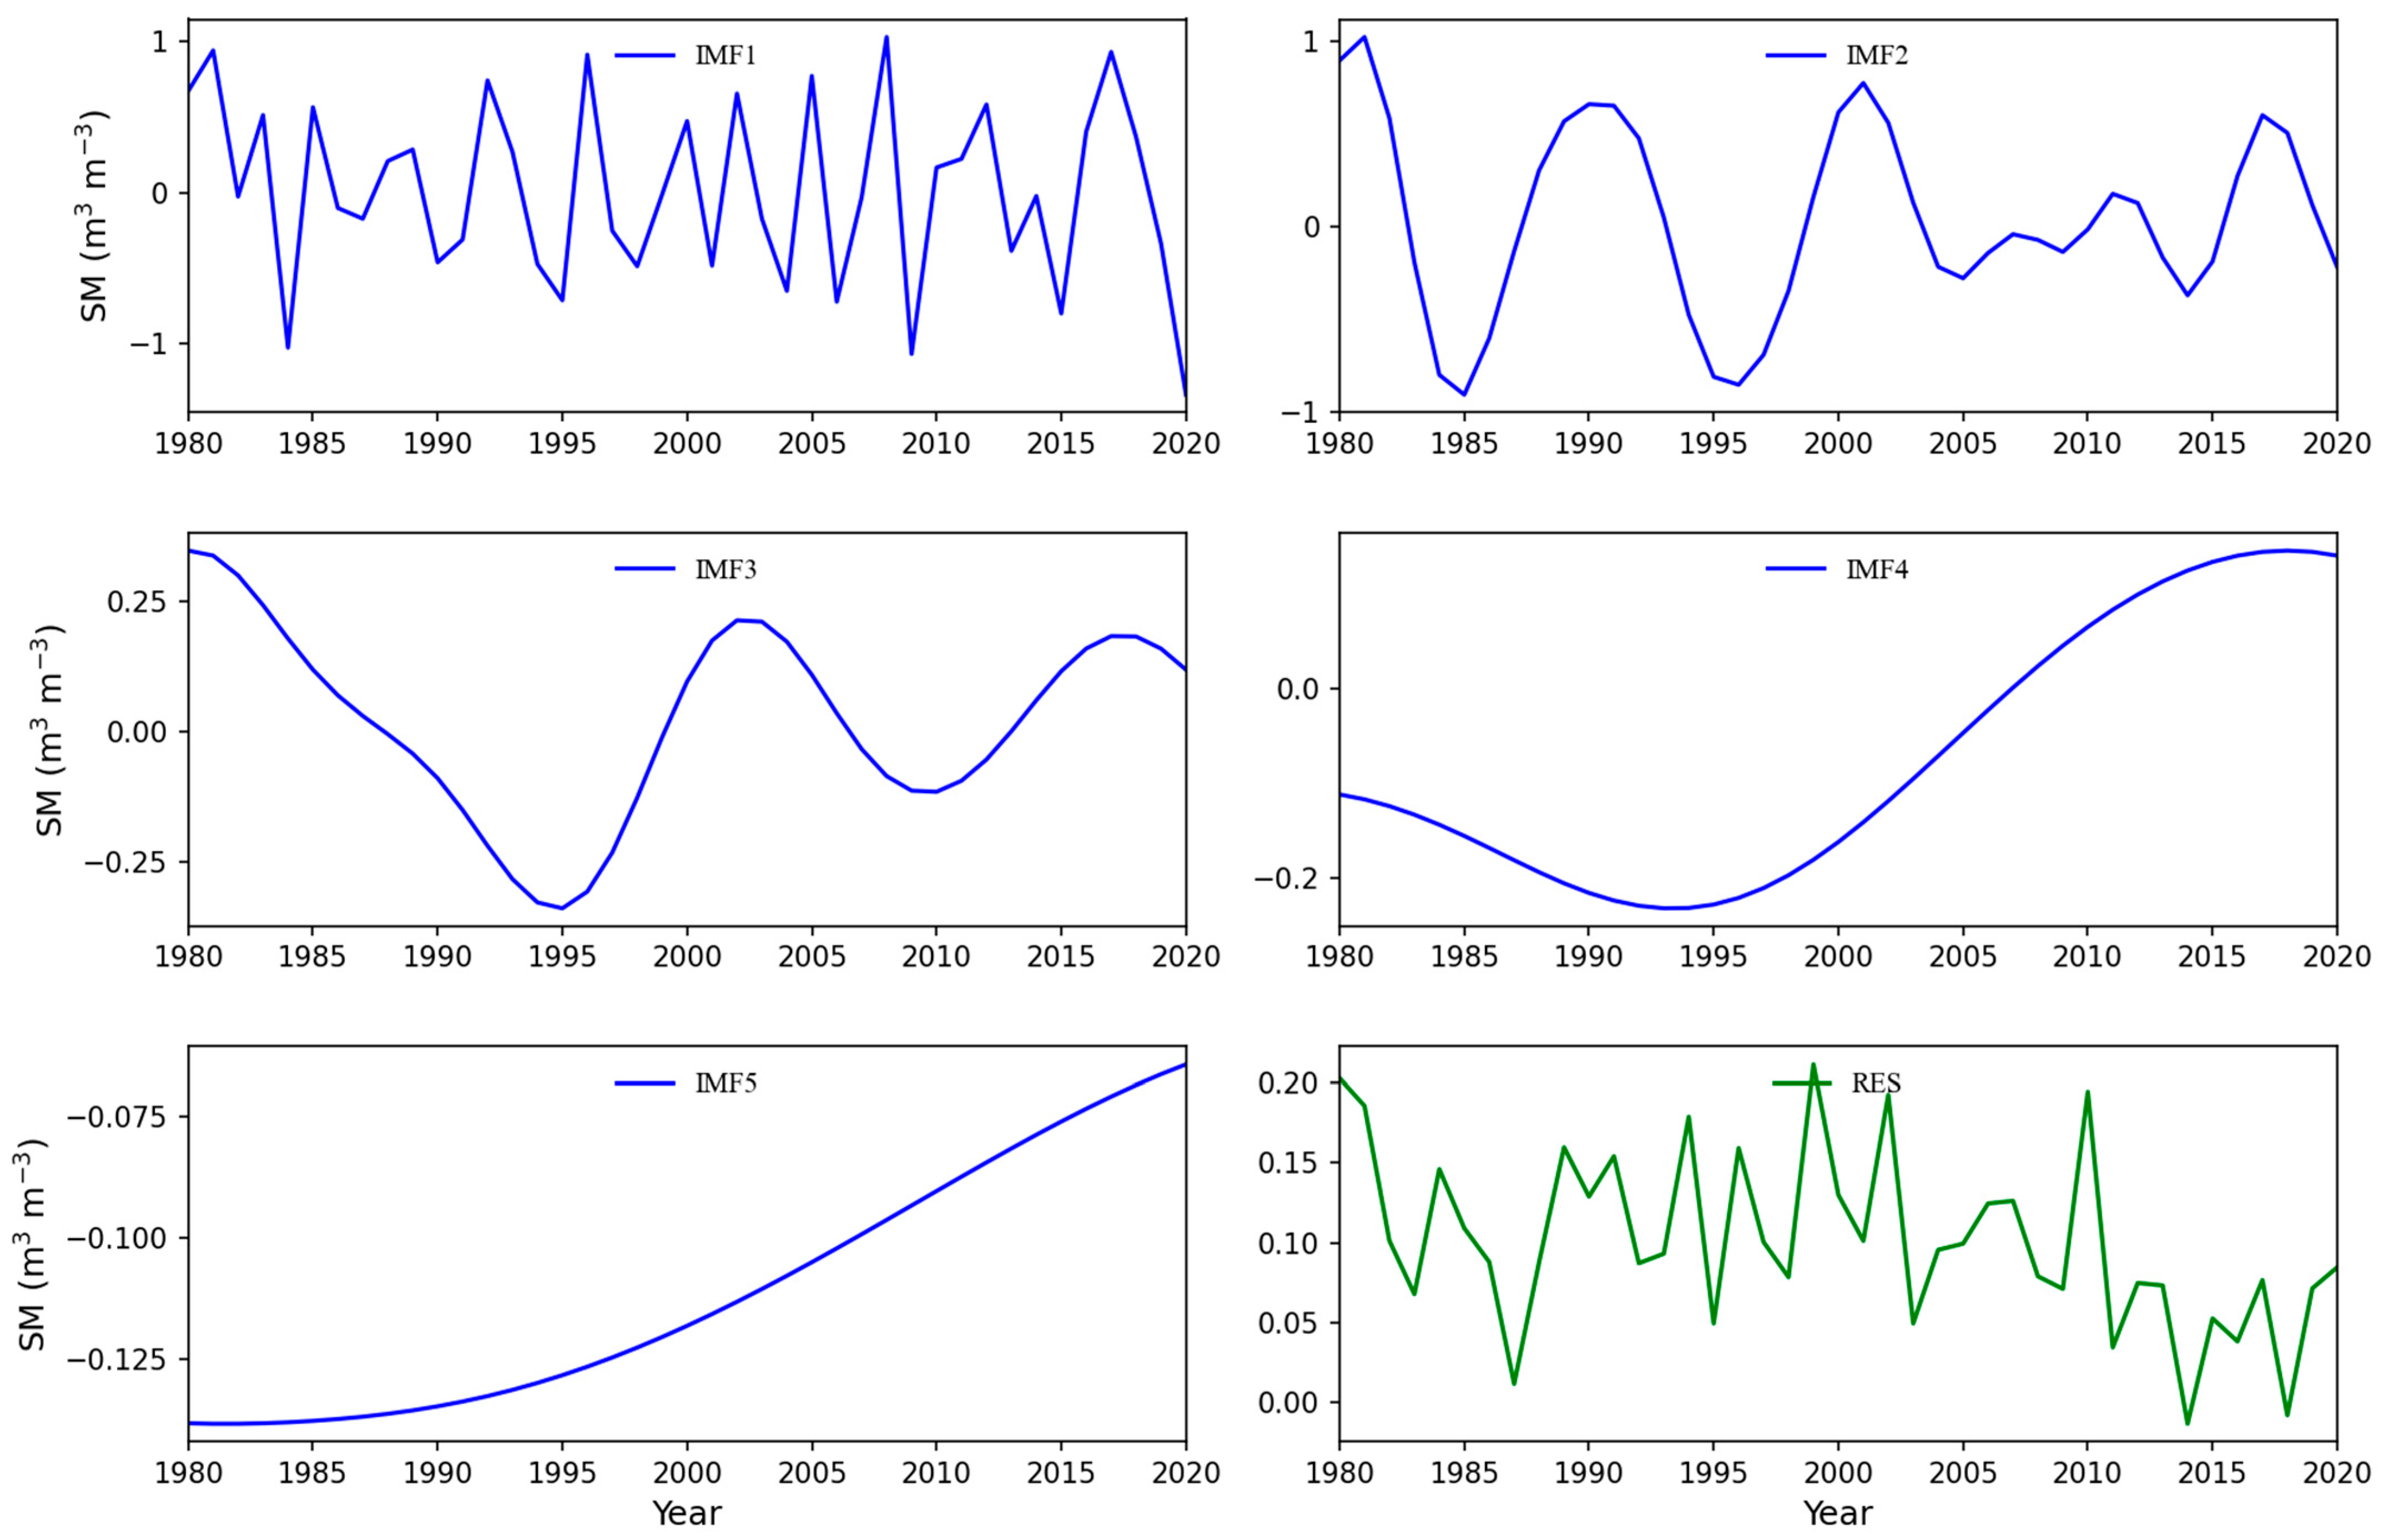
In this study, EEMD was used to decompose the time series of the SM mean in the annual warm season of the QTP from 1980 to 2020, and five eigenmode functions (IMF 1-5) and their trend term (Res) were obtained (Figure 7 and Table 4). The SM mean change period of the QTP on the interannual scale was 3.42 years (IMF1) and 8.20 years (IMF2), and the interdecadal scale was 20.50 years (IMF3) and 39.05 years (IMF4). The mean period of IMF5 is uncertain due to the time length limitation. The residual component, which represents the total trend of the original signal, showed a decreasing trend from 1980 to 2020. The mean change period of the QTP SM is very close to the mean change period of the global SM (3.25 years (IMF1) and 7.8 years (IMF2) on the interannual scale and 18.5 years (IMF3) on the interdecadal scale) [32]. Within the same time period, each IMF component showed either strong or weak non-uniform changes over time, indicating that these quasi-periodic oscillations at different time scales contain periodic changes in the external forcing of the climate system and nonlinear feedback effects of the climate system.
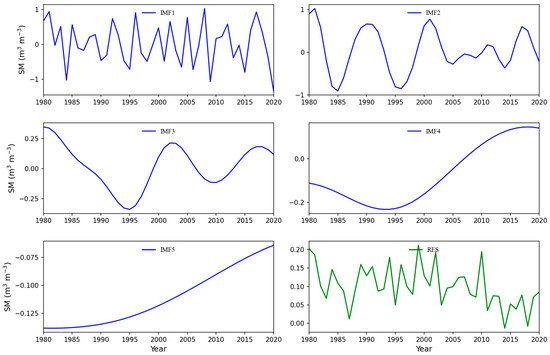
Figure 7.
IMF components and residuals of the warm season mean SM on the Qinghai-Tibet Plateau from 1980 to 2020.
Table 4.
Variance contribution and correlation coefficients of the IMF components of the warm season soil moisture (SM) series from 1980 to 2020 on the Qinghai-Tibet Plateau.
The contribution of each component of EEMD to the original data can be calculated by the variance contribution rate, among which the variance contribution rate of IMF1 reached 35.89% (R = 0.79, p < 0.001). The oscillation signal was evident. The SM amplitude showed a decreasing-increasing-decreasing trend, especially in the early 1980s, late 1990s, and late 2110s, when the SM amplitude was significantly higher than in other periods. The variance contribution of IMF2 was 24.91% (R = 0.79, p < 0.001), and the amplitude gradually decreased and then increased after entering the 21st century, reflecting the “wetting–drying–wetting” change process of SM in the quasi-8a cycle. The variance contribution of the IMF3 component was 3.34% (R = 0.51, p < 0.001) in the quasi-20a interdecadal period, and the amplitude of SM change gradually decreased while the instability of change increased. The contribution of the trend term component was as high as 33.69%, characterizing the overall nonlinear drying trend of the mean SM on the QTP from 1980 to 2020, which is in line with the global SM drying trend [32]. However, this region-wide drying trend of QTP was not significant (R = 0.09, p > 0.2). Overall, the warm season QTP SM change was mainly dominated by the quasi-3a and 8a interannual oscillations and the interdecadal oscillations of quasi-20a (p ≤ 0.001), without long-term continuity. Calculating the Hurst index of the residual terms of the mean original SM series and EEMD decomposition of the QTP, 0.427 and 0.412, respectively, further indicates that the SM drying trend of the QTP was not persistent. It is clearly different from the persistent drying trend shown by the global SM change [32]. Therefore, the SM trends are not the same in different regions due to the complex topography, local climate, permafrost environment, vegetation type, and other factors of the Qinghai-Tibet Plateau (Figure 4). At the same time, we also carried out EEMD trend analysis in different permafrost type regions and found that the SM drying trend was more significant in seasonal permafrost regions than in permafrost regions, which will not be discussed in detail in this paper.
4.2. Analysis of the Causes of Soil Wetting Trends
4.2.1. Synergistic Effects of Soil Wetting with Climate and Vegetation Change
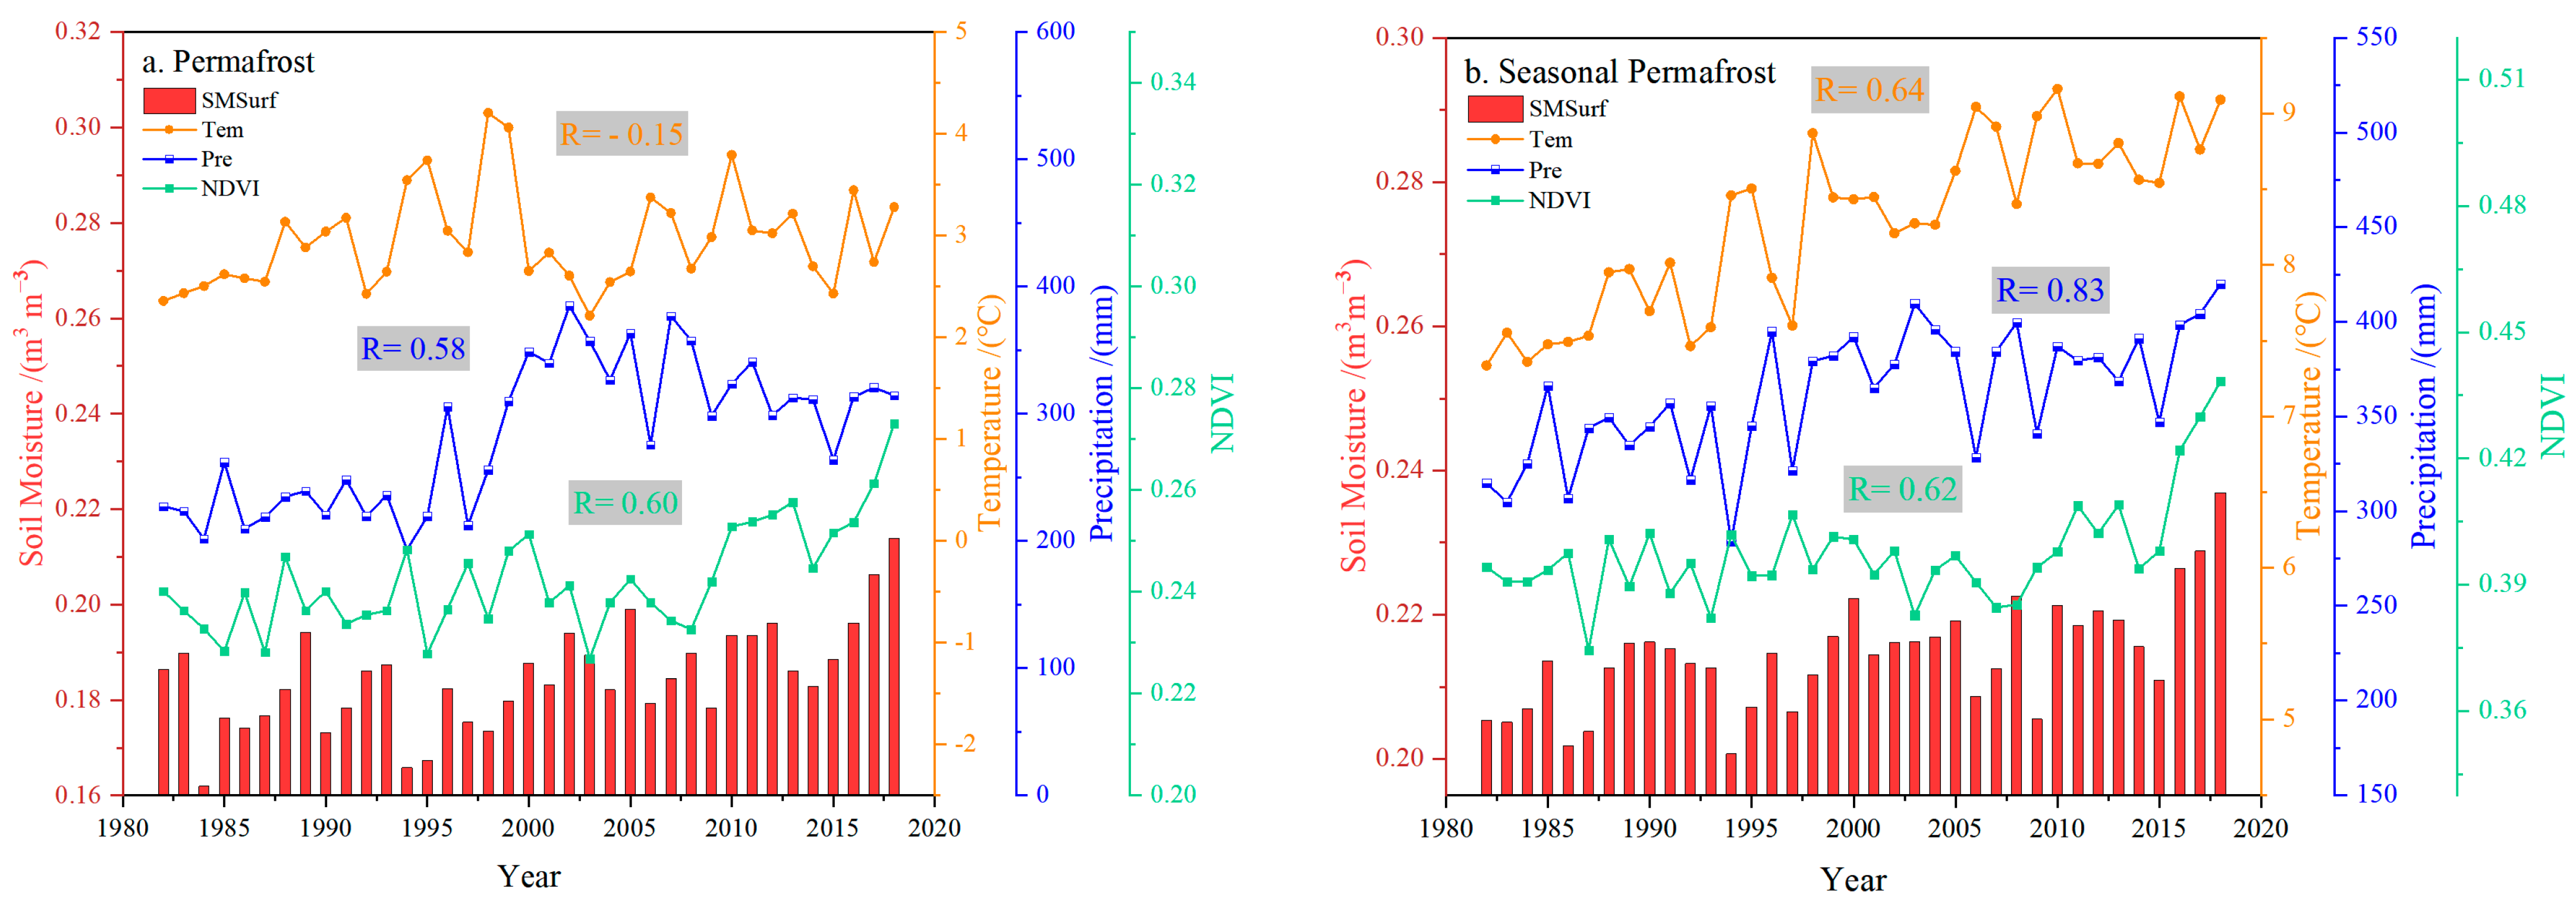
According to the hydrological consistency test between precipitation and SM, the warm season precipitation in the hinterland, north-western part of the plateau, and some regions of the Transverse Range, showed an increasing trend in the last 40 years. It also showed a decreasing trend in the south-eastern part, consistent with the regional variation of SM that we derived. This indicates that the trend of SM wetting on the Qinghai-Tibet Plateau is highly correlated with the increase in precipitation in the last 40 years. However, the correlation coefficient of both SM and precipitation by zonal statistics was 0.58 in the permafrost region. At the same time, it reached 0.83 in the seasonal permafrost region, and there was a higher correlation between the two in the seasonal permafrost region (Figure 8). Based on the relationship between permafrost and SM, it can be speculated that permafrost, as an impermeable layer, prevents the infiltration of SM, and during the warm season thaw, the thawed water is quickly absorbed by the soil, and the deep SM migrates to the shallow soil [18]. The existence of permafrost can stabilize soil SM content and reduce the correlation between surface SM and precipitation [91]. Therefore, SM in the permafrost region is relatively stable and less affected by precipitation [82].
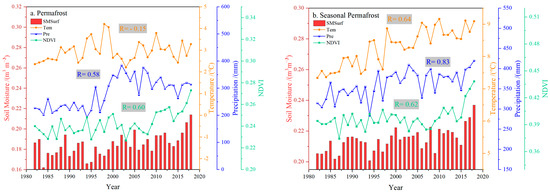
Figure 8.
Comparison of linear trends of SM with temperature (Tem), precipitation (Pre), and NDVI in permafrost region (a) and seasonal permafrost region (b).
In addition to precipitation, factors such as temperature and vegetation conditions also affect SM [4,26]. The temperature distribution of the QTP is closely related to the distribution of permafrost regions, where the temperature is low year-round, with the average warm season temperature ranging from 2.2–2.4 °C over the last 40 years, and the SM is also low and stable year-round. The average temperature in the warm season of the seasonal permafrost region ranges from 7.3–9.2 °C, and the variation of SM increased with the increase in air temperature (correlation R = 0.64). Such a pattern indicates that the evapotranspiration rate in permafrost regions may be lower than that in seasonal permafrost regions [92].
From the perspective of vegetation characteristics, the increase in NDVI of vegetation in both permafrost and seasonal permafrost regions had a strong correlation with SM changes (R ≥ 0.60). However, the effect of vegetation on permafrost regions was relatively small, which may be related to the water-holding capacity and evapotranspiration rate of different vegetation types, and the short and sparse alpine vegetation in permafrost regions had a limited effect on SM [26].
With global warming, the melting of the cryosphere is a key factor that cannot be ignored for SM changes in QTP where permafrost is widely distributed [92]. The increase of QTP SM is consistent with the general trend of increasing precipitation and decreasing evaporation [54]. The thickening of the active layer and the improvement of drainage in the permafrost regions have caused the SM of the shallow to vary with the infiltration of precipitation [29]. Vegetation, as a link between soil and climate, influences SM changes through different types of vegetation evapotranspiration [92] canopy interception [11] and water storage functions [18]. This synergistic effect of SM with climate and vegetation changes in the QTP seasonal permafrost regions tends to become more pronounced.
4.2.2. Effects of Climate and Vegetation Changes on Soil Moisture
To clarify the effects of precipitation (PRE), temperature (TEM), and NDVI on SM, the time series data of SM with PRE, TEM, and NDVI from 1982–2018 were performed partial correlation analysis at the pixel scale, respectively (Figure 9). The partial correlation coefficients (Rp) between SM and precipitation ranged from −0.41–0.94, and the area ratio of positive to negative correlation was about 9:2. The SM was mainly positively correlated with precipitation over most of the plateau. The areas of negative correlation were mainly located in the arid desert zone in the north-western part of the plateau and the forest zone in the south-eastern plateau. The Rp between SM and TEM ranged −0.71–0.85, and the area ratio of positive to negative correlations was about 4:6. The positive correlations were distributed in soil wet areas such as the Himalayas in the south-western part of the plateau, and there were also sporadically in the water resource areas in the hinterland of the plateau, such as the Transverse Mountains. These results reflect that temperature has a two-sided influence on SM changes in the plateau. The positive correlation between SM and NDVI is mainly positive, with Rp values ranging from −0.78–0.83. Spatially, the positively (negatively) correlated areas were in good agreement with the spatial distribution of soil wetting (drying) trends in the plateau, and the areas positively correlated with vegetation NDVI are all soil wetting areas, which indicates that vegetation is the key factor of SM change in the plateau.
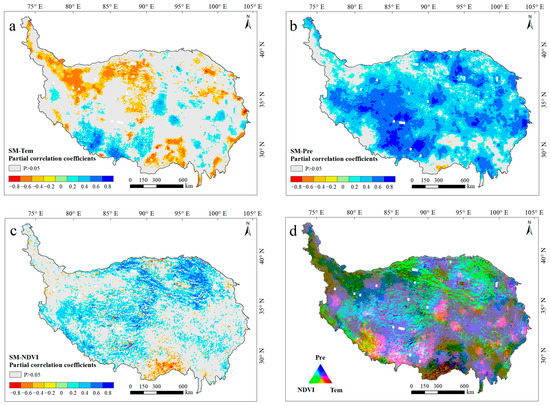
Figure 9.
Partial correlation coefficients between precipitation (Pre), mean temperature (Tem), mean NDVI, and SM in the warm season from 1982 to 2018 (a–c), and partial correlation coefficient RGB synthesis (d).
The partial correlation coefficients of SM with temperature, precipitation, and NDVI were RGB synthesized to reflect the coupling effects of the three on SM (Figure 4d). At the pixel scale, precipitation plays a dominant role in SM change on the plateau, and the area ratio affected by precipitation, temperature, and NDVI was about 20:8:9. The results indicate that SM on the QTP is mainly influenced by the coupling of precipitation, temperature, and vegetation. Around the Qaidam Basin and the Qilian Mountains, vegetation influences SM more than precipitation and temperature, while SM in the Himalayas is influenced by temperature more than precipitation and vegetation. Most of the remaining areas are mainly influenced by the coupling of the three, and in comparison, precipitation plays a greater role than temperature and vegetation.
The partial correlation value can distinguish the influence degree of each factor on SM. However, it covers the case that the partial correlation coefficient between the influencing factor and SM is close; that is, the change of SM may be influenced by the coupling of precipitation, temperature, and NDVI. Moreover, it only reflects relationships at the pixel (local) scale. Therefore, it is necessary to study the causes of soil wetting trends on the average scale of the whole plateau. Before that, the time series of average precipitation, temperature, NDVI, and SM across the plateau are to be normalized by their standard deviations.
4.2.3. Quantitative Analysis of the Causes of Soil Moisture Changes in Permafrost Regions
Using the above method, SM response models based on three factors of climate change (precipitation and temperature) and vegetation change (NDVI) were developed. The results showed (Table 5) that the changes of SM in the warm season of the QTP were significantly and positively correlated with precipitation, temperature, and NDVI, finding that the correlations with precipitation and NDVI were stronger, reaching 0.774 and 0.751, respectively, which were the main factors of SM changes in the QTP. The stepwise regression results showed that the wetting trend of soil on the QTP was caused by the increase of precipitation, temperature, and vegetation together. Their combined explanatory power was over 65% according to the standardized coefficients, of which the contributions of precipitation and vegetation NDVI were 49.1% and 38.2%, respectively, while the contribution of temperature was less than 5%. This might be because the increase in soil evaporation and vegetation transpiration caused by the increase in temperature was much lower than that of precipitation and other water supplies [4].
Table 5.
Partial correlation and stepwise regression of average SM in the warm season with time series of precipitation (Pre), average temperature (Tem), and average NDVI in the warm season of the Qinghai-Tibet Plateau in 1982–2018. Significant mark of partial correlation coefficient: ‘***’, 0.001.
In the permafrost region, the combined explanatory power of precipitation, temperature, and vegetation on SM was 51%, and precipitation had the highest contribution of 47.2%. Under the cover conditions of different vegetation types, the SM variation in the alpine steppe was influenced by precipitation, temperature, and NDVI together, and the combined explanatory power of the three was only 33%, but it was significantly and negatively correlated with temperature, with a contribution of 23.7%. The SM changes of other vegetation types were mainly influenced by precipitation and NDVI. The alpine desert type had the strongest correlation with precipitation and NDVI, with the combined explanatory power of both exceeding 44% and the contribution of precipitation exceeding 53.3%, which is the key factor of SM change.
In the seasonal permafrost region, SM had the strongest correlation with precipitation and vegetation, up to 0.790 and 0.779, respectively, explaining 69.1% of the SM change, and both contributed more than 41% to SM change. In addition to forests, SM changes in other vegetation-type areas were also mainly influenced by precipitation and NDVI. Among them, alpine meadow SM changes were the most correlated with precipitation and NDVI, with the combined explanatory power exceeding 62%. Even the correlation between NDVI and alpine meadow SM (R = 0.75) was stronger than that of precipitation (R = 0.71), which explains why different vegetations may play a more important role in SM change than precipitation [93].
Overall, in the seasonal permafrost region, SM responded more strongly to climate change [6]. The increase in temperature promotes soil evaporation and vegetation transpiration to some extent [92], but it may also cause an increase in ground temperature, which is conducive to permafrost thawing and SM increase. The effect of height and cover of different vegetation types on surface insulation and cold retention should not be neglected [26] and is a key factor for SM changes on the QTP in addition to the effect of precipitation.
Based on the above reasons, the sensitivity of SM changes to precipitation and temperature in the permafrost and seasonal permafrost regions on the Qinghai-Tibet Plateau differs significantly, especially in the transition area between the permafrost and seasonal permafrost regions. It should be pointed out that, in this paper, the annual average of the warm season was chosen to analyze the overall trend of SM change. It was found that the response of SM to precipitation in the multi-year permafrost region was not as obvious as that in the seasonal permafrost region. The presence of multi-year permafrost was the main difference. However, the response process of SM to precipitation is also influenced by soil texture, temperature, initial moisture content, precipitation intensity, precipitation frequency, etc [3]. There are also uncertainties in the remotely sensed SM products and interpolated precipitation data [4], and more climate data are needed to improve the accuracy of the results for the detailed change patterns and quantitative description of SM permafrost and seasonal permafrost regions.
5. Conclusions
In this paper, we evaluated the accuracy and applicability of the GLEAM SM product using the measured SM dataset in the Qinghai-Tibet Plateau. After that, based on the GLEAM SM products, we used the Theil–Sen trend, Mann-Kendall test, EEMD analysis, and other methods to reveal the dynamic variation trends and spatial differences of SM in the warm season of the QTP at spatial-temporal scales from 1980 to 2020. At last, we quantified the causes attributed to SM variation in recent decades using partial correlation and stepwise regression methods. The conclusions are as follows.
- (1)
- GLEAM SM products can better reflect SM changes in the Qinghai-Tibet Plateau in the warm season. The average correlation coefficient with measured SM, Bias, and average ubRMSE in the permafrost region were 0.619, 0.079 m3 m−3, and 0.049 m3 m−3, respectively. In the seasonal permafrost region, the average correlation coefficient with measured SM was 0.809 with a maximum of 0.946, the Bias was 0.025 m3 m−3, and the average ubRMSE was 0.033 m3 m−3. Overall, there is some overestimation of the GLEAM SM product in the warm season; however, it is closer to the real SM in the seasonal permafrost region than in the permafrost region, and the data accuracy is higher than other SM products.
- (2)
- In the past 40 years, the QTP SM has shown a significant wetting trend, with an average rate of 0.573 × 10⁻³ m3 m−3 yr−1. Under the influence of global warming, this rising trend accelerated after 2005. The area showing significant wetting accounts for 64.31% of the QTP, mainly distributed in the perennial permafrost distribution area. Soil wetting is faster in dry areas such as the alpine desert, meadow, and steppe dry areas, while the SM rises more slowly in wet areas such as woodlands. However, the wetting trend of SM on the QTP does not have a long-term continuity of more than 20 years and is dominated by interannual and interdecadal oscillations, showing the variation process of “wetting–drying–wetting”, in which the oscillations are more significant in seasonal permafrost regions.
- (3)
- Soil wetting trends on the QTP are jointly determined by temperature, precipitation, and vegetation, and the combined explanatory power of the three is over 65%; however, there is apparent spatial heterogeneity in different permafrost regions and vegetation cover conditions. In the permafrost region, the combined explanatory power of the three was 51%, and precipitation had the highest contribution of 47.2%. In the seasonal permafrost region, the combined explanatory power was 69.1%, and the contribution of both precipitation and vegetation exceeded 41%, with vegetation being the key factor of SM changes on the QTP. Overall, with global climate change, the synergistic effect of soil moisture–vegetation–climate on the QTP tends to become more pronounced in the seasonal permafrost region.
Author Contributions
Conceptualization, H.L. and F.L.; methodology, H.L. and C.Z. (Cungui Zhang); software, S.Z. and C.Z. (Chaokun Zhang); validation, H.L., S.Z. and C.Z. (Chaokun Zhang); formal analysis, H.L.; investigation, S.Z. and C.Z. (Chaokun Zhang); resources, F.L.; data curation, W.M. and J.L.; writing—original draft preparation, H.L.; writing—review and editing, F.L. and C.Z. (Cungui Zhang); visualization, H.L., W.M. and J.L.; supervision, F.L.; project administration, F.L. and C.Z. (Cungui Zhang); funding acquisition, F.L. All authors have read and agreed to the published version of the manuscript.
Funding
This research was supported by the National key research and development plan (2019YFA0606902), and the Chinese Academy of Sciences Strategic Pilot Class A Special Project (XDA2009000002).
Data Availability Statement
The data presented in this study are available on request from the corresponding author.
Acknowledgments
We are particularly indebted to Qiang Zhou, and Qiong Chen from the Qinghai Normal University for their constructive suggestions on an earlier draft of this paper. We thank the GLEAM dataset produced by Akash Koppa and Dominik Rains, the National Tibetan Plateau Third Pole Environment Data Center for providing soil moisture Observation data, the China Meteorological Data Service Centre (CMDC) and the Chinese Academy of Sciences Resources and Environmental Science and Data Center (REDC) for providing meteorological data and vegetation type data, the National Aeronautics and Space Administration (NASA) for providing MODIS and AVHRR NDVI products.
Conflicts of Interest
The authors declare no conflict of interest.
References
- Seneviratne, S.I.; Corti, T.; Davin, E.L.; Hirschi, M.; Jaeger, E.B.; Lehner, I.; Orlowsky, B.; Teuling, A.J. Investigating soil moisture–climate interactions in a changing climate: A review. Earth-Sci. Rev. 2010, 99, 125–161. [Google Scholar] [CrossRef]
- Taylor, C.M.; de Jeu, R.A.M.; Guichard, F.; Harris, P.P.; Dorigo, W.A. Afternoon rain more likely over drier soils. Nature 2012, 489, 423–426. [Google Scholar] [CrossRef] [PubMed] [Green Version]
- Schwingshackl, C.; Hirschi, M.; Seneviratne, S.I. Quantifying Spatiotemporal Variations of Soil Moisture Control on Surface Energy Balance and Near-Surface Air Temperature. J. Clim. 2017, 30, 7105–7124. [Google Scholar] [CrossRef]
- Meng, X.; Li, R.; Luan, L.; Lyu, S.; Zhang, T.; Ao, Y.; Han, B.; Zhao, L.; Ma, Y. Detecting hydrological consistency between soil moisture and precipitation and changes of soil moisture in summer over the Tibetan Plateau. Clim. Dyn. 2018, 51, 4157–4168. [Google Scholar] [CrossRef] [Green Version]
- Nicolai-Shaw, N. Climate Research Applications of Remote-Sensing Based Soil Moisture: Spatial Representativeness, Predictability and Drought Response; ETH Zurich: Zurich, Switzerland, 2016. [Google Scholar]
- Wang, C.; Dong, W.; Wei, Z. Anomaly feature of seasonal frozen soil variationson the Qinghai-Tibet Plateau. J. Geogr. Sci. 2002, 12, 102–110. [Google Scholar]
- Jiang, K.; Pan, Z.; Pan, F.; Wang, J.; Han, G.; Song, Y.; Zhang, Z.; Huang, N.; Ma, S.; Chen, X. Influence patterns of soil moisture change on surface-air temperature difference under different climatic background. Sci. Total Environ. 2022, 822, 153607. [Google Scholar] [CrossRef] [PubMed]
- Li, C.; Peng, F.; Xue, X.; You, Q.; Lai, C.; Zhang, W.; Cheng, Y. Productivity and Quality of Alpine Grassland Vary with Soil Water Availability under Experimental Warming. Front. Plant Sci. 2018, 9, 1790. [Google Scholar] [CrossRef] [Green Version]
- Yang, Z.; Gao, J.; Zhao, L.; Xu, X.; Ouyang, H. Linking thaw depth with soil moisture and plant community composition: Effects of permafrost degradation on alpine ecosystems on the Qinghai-Tibet Plateau. Plant Soil 2012, 367, 687–700. [Google Scholar] [CrossRef]
- Sun, Y.; Wang, Y.; Yang, W.; Sun, Z.; Zhao, J. Variation in soil hydrological properties on shady and sunny slopes in the permafrost region, Qinghai–Tibetan Plateau. Environ. Earth Sci. 2019, 78, 100. [Google Scholar] [CrossRef]
- Jiang, P.; Ding, W.; Yuan, Y.; Ye, W. Diverse response of vegetation growth to multi-time-scale drought under different soil textures in China’s pastoral areas. J. Environ. Manag. 2020, 274, 110992. [Google Scholar] [CrossRef]
- Gallego-Elvira, B.; Taylor, C.M.; Harris, P.P.; Ghent, D.; Veal, K.L.; Folwell, S.S. Global observational diagnosis of soil moisture control on the land surface energy balance. Geophys. Res. Lett. 2016, 43, 2623–2631. [Google Scholar] [CrossRef] [Green Version]
- Evans, J.P.; Meng, X.; McCabe, M.F. Land surface albedo and vegetation feedbacks enhanced the millennium drought in south-east Australia. Hydrol. Earth Syst. Sci. 2017, 21, 409–422. [Google Scholar] [CrossRef] [Green Version]
- Cheng, S.; Huang, J. Enhanced soil moisture drying in transitional regions under a warming climate. J. Geophys. Res. Atmos. 2016, 121, 2542–2555. [Google Scholar] [CrossRef]
- Schuur, E.A.; Mack, M.C. Ecological Response to Permafrost Thaw and Consequences for Local and Global Ecosystem Services. Annu. Rev. Ecol. Evol. Syst. 2018, 49, 279–301. [Google Scholar] [CrossRef]
- Zou, D.; Zhao, L.; Sheng, Y.; Chen, J.; Hu, G.; Wu, T.; Wu, J.; Xie, C.; Wu, X.; Pang, Q.; et al. A new map of permafrost distribution on the Tibetan Plateau. Cryosphere 2017, 11, 2527–2542. [Google Scholar] [CrossRef] [Green Version]
- Zhao, L.; Zou, D.; Hu, G.; Du, E.; Pang, Q.; Xiao, Y.; Li, R.; Sheng, Y.; Wu, X.; Sun, Z.; et al. Changing climate and the permafrost environment on the Qinghai–Tibet (Xizang) plateau. Permafr. Periglac. Processes 2020, 31, 396–405. [Google Scholar] [CrossRef]
- Cheng, G.; Wu, Q.; Li, R.; Li, X.; Sheng, Y.; Hu, G.; Zhao, L.; Jin, H.; Zou, D.; Wu, X. Characteristic, changes and impacts of permafrost on Qinghai-Tibet Plateau. Chin. Sci. Bull. 2019, 64, 2783–2795. [Google Scholar]
- Jianping, L.I.; Fei, Z.; Cheng, S.U.; Juan, F.; Jing, W. Pathways of Influence of the Northern Hemisphere Mid–high Latitudes on East Asian Climate: A Review. Adv. Atmos. Sci. 2019, 36, 902–921. [Google Scholar]
- Wang, K.; Zhang, T.; Mu, C.; Zhong, X.; Peng, X.; Cao, B.; Lu, L.; Zheng, L.; Wu, X.; Liu, J. From the Third Pole to the Arctic: Changes and impacts of the climate and cryosphere. J. Glaciol. Geocryol. 2020, 42, 104–123. [Google Scholar]
- Ma, Q.; Jin, H.; Bense, V.F.; Luo, D.; Marchenko, S.S.; Harris, S.A.; Lan, Y. Impacts of degrading permafrost on streamflow in the source area of Yellow River on the Qinghai-Tibet Plateau, China. Adv. Clim. Change Res. 2019, 10, 225–239. [Google Scholar] [CrossRef]
- Chen, S.; Liu, W.; Qin, X.; Liu, Y.; Zhang, T.; Chen, K.; Hu, F.; Ren, J.; Qin, D. Response characteristics of vegetation and soil environment to permafrost degradation in the upstream regions of the Shule River Basin. Environ. Res. Lett. 2012, 7, 45406. [Google Scholar] [CrossRef] [Green Version]
- Kuang, X.; Jiao, J.J. Review on climate change on the Tibetan Plateau during the last half century. J. Geophys. Res. Atmos. 2016, 121, 3979–4007. [Google Scholar] [CrossRef]
- Wu, P.; Liang, S.; Wang, X.-S.; Feng, Y.; McKenzie, J. A New Assessment of Hydrological Change in the Source Region of the Yellow River. Water 2018, 10, 877. [Google Scholar] [CrossRef] [Green Version]
- Wang, R.; Dong, Z.; Zhou, Z. Effect of decreasing soil frozen depth on vegetation growth in the source region of the Yellow River for 1982–2015. Theor. Appl. Climatol. 2020, 140, 1185–1197. [Google Scholar] [CrossRef]
- Jin, X.; Jin, H.; Iwahana, G.; Marchenko, S.S.; Luo, D.; Li, X.; Liang, S. Impacts of climate-induced permafrost degradation on vegetation: A review. Adv. Clim. Change Res. 2021, 12, 29–47. [Google Scholar] [CrossRef]
- Zeng, J.; Li, Z.; Chen, Q.; Bi, H.; Qiu, J.; Zou, P. Evaluation of remotely sensed and reanalysis soil moisture products over the Tibetan Plateau using in-situ observations. Remote Sens. Env. 2015, 163, 91–110. [Google Scholar] [CrossRef]
- Chen, H.; Wu, J.; Li, C.; Li, Z.; Qin, G. Applicability evaluation of satellite soil moisture products in Qinghai-Tibet Plateau. Acta Ecol. Sin. 2020, 40, 9195–9207. [Google Scholar]
- Luo, D.; Jin, H.; Bense, V.F.; Jin, X.; Li, X. Hydrothermal processes of near-surface warm permafrost in response to strong precipitation events in the Headwater Area of the Yellow River, Tibetan Plateau. Geoderma 2020, 376, 114531. [Google Scholar] [CrossRef]
- Wang, W.; Wu, T.; Zhao, L.; Li, R.; Zhu, X.; Wang, W.; Yang, S.; Qin, Y.; Hao, J. Exploring the ground ice recharge near permafrost table on the central Qinghai-Tibet Plateau using chemical and isotopic data. J. Hydrol. 2018, 560, 220–229. [Google Scholar] [CrossRef]
- Fu, W.; Zhang, X.; Zhao, J.; Du, S.; Horton, R.; Hou, M. Artificial warming-mediated soil freezing and thawing processes can regulate soybean production in Northeast China. Agric. For. Meteorol. 2018, 262, 249–257. [Google Scholar] [CrossRef]
- Deng, Y.; Wang, S.; Bai, X.; Luo, G.; Wu, L.; Cao, Y.; Li, H.; Li, C.; Yang, Y.; Hu, Z.; et al. Variation trend of global soil moisture and its cause analysis. Ecol. Indic. 2020, 110, 105939. [Google Scholar] [CrossRef]
- Fan, K.; Zhang, Q.; Shi, P.; Sun, P.; Yu, H. Evaluation of remote sensing and reanalysis soil moisture products on the Tibetan Plateau. Acta Geogr. Sin. 2018, 73, 1778–1791. [Google Scholar]
- Deng, Y.; Wang, S.; Bai, X.; Wu, L.; Cao, Y.; Li, H.; Wang, M.; Li, C.; Yang, Y.; Hu, Z.; et al. Comparison of soil moisture products from microwave remote sensing, land model, and reanalysis using global ground observations. Hydrol. Processes 2020, 34, 836–851. [Google Scholar] [CrossRef]
- Zeng, Y.; Su, Z.; van der Velde, R.; Wang, L.; Xu, K.; Wang, X.; Wen, J. Blending Satellite Observed, Model Simulated, and In Situ Measured Soil Moisture over Tibetan Plateau. Remote Sens. 2016, 8, 268. [Google Scholar] [CrossRef] [Green Version]
- Fan, K.; Zhang, Q.; Sun, P.; Song, C.; Zhu, X.; Yu, H.; Shen, Z. Variation, causes and future estimation of surface soil moisture on the Tibetan Plateau. Acta Ecol. Sinica 2019, 74, 520–533. [Google Scholar]
- Gao, Z.; Niu, F.; Lin, Z.; Luo, J.; Yin, G.; Wang, Y. Evaluation of thermokarst lake water balance in the Qinghai-Tibet Plateau via isotope tracers. Sci. Total Environ. 2018, 636, 1–11. [Google Scholar] [CrossRef] [PubMed]
- Su, F.; Zhang, L.; Ou, T.; Chen, D.; Yao, T.; Tong, K.; Qi, Y. Hydrological response to future climate changes for the major upstream river basins in the Tibetan Plateau. Glob. Planet. Chang. 2016, 136, 82–95. [Google Scholar] [CrossRef]
- Gao, Y.; Li, X.; Leung, R.L.; Chen, D.; Xu, J. Aridity changes in the Tibetan Plateau in a warming climate. Environ. Res. Lett. 2015, 10, 34013. [Google Scholar] [CrossRef]
- Li, C.; Lu, H.; Yang, K.; Han, M.; Wright, J.; Chen, Y.; Yu, L.; Xu, S.; Huang, X.; Gong, W. The Evaluation of SMAP Enhanced Soil Moisture Products Using High-Resolution Model Simulations and In-Situ Observations on the Tibetan Plateau. Remote Sens. 2018, 10, 535. [Google Scholar] [CrossRef] [Green Version]
- Niu, F.; Gao, Z.; Lin, Z.; Luo, J.; Fan, X. Vegetation influence on the soil hydrological regime in permafrost regions of the Qinghai-Tibet Plateau, China. Geoderma 2019, 354, 113892. [Google Scholar] [CrossRef]
- Njoku, E.G.; Chan, S.K. Vegetation and surface roughness effects on AMSR-E land observations. Remote Sens. Environ. 2006, 100, 190–199. [Google Scholar] [CrossRef]
- Owe, M.; de Jeu, R.; Holmes, T. Multisensor historical climatology of satellite-derived global land surface moisture. J. Geophys. Res. Earth Surf. 2008, 113. [Google Scholar] [CrossRef]
- Wagner, W.; Hahn, S.; Kidd, R.; Melzer, T.; Bartalis, Z.; Hasenauer, S.; Figa-Saldaña, J.; Rosnay, P.D.; Jann, A.; Schneider, S.; et al. The ASCAT Soil Moisture Product: A Review of its Specifications, Validation Results, and Emerging Applications. Meteorol. Z. 2013, 22, 5–33. [Google Scholar] [CrossRef] [Green Version]
- Dorigo, W.A.; Gruber, A.; de Jeu, R.; Wagner, W.; Stacke, T.; Loew, A.; Albergel, C.; Brocca, L.; Chung, D.; Parinussa, R.M.; et al. Evaluation of the ESA CCI soil moisture product using ground-based observations. Remote Sens. Environ. 2015, 162, 380–395. [Google Scholar] [CrossRef]
- Martens, B.; Miralles, D.G.; Lievens, H.; van der Schalie, R.; de Jeu, R.A.M.; Fernández-Prieto, D.; Beck, H.E.; Dorigo, W.A.; Verhoest, N.E.C. GLEAM v3: Satellite-based land evaporation and root-zone soil moisture. Geosci. Model Dev. 2017, 10, 1903–1925. [Google Scholar] [CrossRef] [Green Version]
- Hersbach, H.; Bell, B.; Berrisford, P.; Hirahara, S.; Horányi, A.; Muñoz-Sabater, J.; Nicolas, J.; Peubey, C.; Radu, R.; Schepers, D.; et al. The ERA5 global reanalysis. Q. J. R. Meteorol. Soc. 2020, 146, 1999–2049. [Google Scholar] [CrossRef]
- Beaudoing, H.; Rodell, M.; Nasa/Gsfc/Hsl. GLDAS Noah Land Surface Model L4 3 Hourly 0.25 × 0.25 Degree, Version 2.1; Goddard Earth Sciences Data and Information Services Center (GES DISC): Greenbelt, MD, USA, 2020. [Google Scholar]
- Su, Z.; Wen, J.; Dente, L.; van der Velde, R.; Wang, L.; Ma, Y.; Yang, K.; Hu, Z. The Tibetan Plateau observatory of plateau scale soil moisture and soil temperature (Tibet-Obs) for quantifying uncertainties in coarse resolution satellite and model products. Hydrol. Earth Syst. Sci. 2011, 15, 2303–2316. [Google Scholar] [CrossRef] [Green Version]
- Su, Z.; de Rosnay, P.; Wen, J.; Wang, L.; Zeng, Y. Evaluation of ECMWF’s soil moisture analyses using observations on the Tibetan Plateau. J. Geophys. Res. Atmos. 2013, 118, 5304–5318. [Google Scholar] [CrossRef] [Green Version]
- Xing, Z.; Fan, L.; Zhao, L.; de Lannoy, G.; Frappart, F.; Peng, J.; Li, X.; Zeng, J.; Al-Yaari, A.; Yang, K.; et al. A first assessment of satellite and reanalysis estimates of surface and root-zone soil moisture over the permafrost region of Qinghai-Tibet Plateau. Remote Sens. Environ. 2021, 265, 112666. [Google Scholar] [CrossRef]
- Yuan, X.; Ma, Z.; Pan, M.; Shi, C. Microwave remote sensing of short-term droughts during crop growing seasons. Geophys. Res. Lett. 2015, 42, 4394–4401. [Google Scholar] [CrossRef]
- Zhu, L.; Wang, H.; Tong, C.; Liu, W.; Du, B. Evaluation of ESA Active, Passive and Combined Soil Moisture Products Using Upscaled Ground Measurements. Sensors 2019, 19, 2718. [Google Scholar] [CrossRef] [PubMed] [Green Version]
- Cheng, M.; Zhong, L.; Ma, Y.; Zou, M.; Hu, Y. A Study on the Assessment of Multi-Source Satellite Soil Moisture Products and Reanalysis Data for the Tibetan Plateau. Remote Sens. 2019, 11, 1196. [Google Scholar] [CrossRef] [Green Version]
- Miralles, D.G.; Holmes, T.R.H.; De Jeu, R.A.M.; Gash, J.H.; Meesters, A.G.C.A.; Dolman, A.J. Global land-surface evaporation estimated from satellite-based observations. Hydrol. Earth Syst. Sci. 2011, 15, 453–469. [Google Scholar] [CrossRef] [Green Version]
- Beck, H.E.; van Dijk, A.I.J.M.; Levizzani, V.; Schellekens, J.; Miralles, D.G.; Martens, B.; de Roo, A. MSWEP: 3-hourly 0.25° global gridded precipitation (1979–2015) by merging gauge, satellite, and reanalysis data. Hydrol. Earth Syst. Sci. 2017, 21, 589–615. [Google Scholar] [CrossRef] [Green Version]
- Zhang, Y.; Li, B.; Zheng, D. A discussion on the boundary and area of the Tibetan Plateau in China. Geogr. Res. 2002, 21, 1–8. [Google Scholar]
- Immerzeel, W.W.; Bierkens, M.F.P. Asian water towers: More on monsoons—Response. Science 2010, 330, 585. [Google Scholar] [CrossRef]
- Zhao, L.; Ding, Y.J.; Liu, G.Y.; Wang, S.L.; Jin, H.J. Estimates of the Reserves of Ground Ice in Permafrost Regions on the Tibetan Plateau. J. Glaciol. Geocryol. 2010, 32, 1–9. [Google Scholar]
- Chang, J.; Wang, G.X.; Chunjie, L.I.; Mao, T.X. Seasonal dynamics of suprapermafrost groundwater and its response to the freeing-thawing processes of soil in the permafrost region of Qinghai-Tibet Plateau. Sci. China Earth Sci. 2015, 58, 727–738. [Google Scholar] [CrossRef]
- Zhao, L.; Hu, G.; Zou, D.; Wu, X.; Liu, S. Permafrost Changes and Its Effects on Hydrological Processes on Qinghai-Tibet Plateau. Bull. Chin. Acad. Sci. (Chin. Version) 2019, 34, 1233–1246. [Google Scholar]
- Duan, H.; Xue, X.; Wang, T.; Kang, W.; Liao, J.; Liu, S. Spatial and Temporal Differences in Alpine Meadow, Alpine Steppe and All Vegetation of the Qinghai-Tibetan Plateau and Their Responses to Climate Change. Remote Sens. 2021, 13, 669. [Google Scholar] [CrossRef]
- Zhang, P.; Zheng, D.; van der Velde, R.; Wen, J.; Zeng, Y.; Wang, X.; Wang, Z.; Chen, J.; Su, Z. A 10-Year (2009–2019) Surface Soil Moisture Dataset Produced Based on in situ Measurements Collected from the Tibet-Obs; 4TU.ResearchData: Delft, The Netherlands, 2020. [Google Scholar]
- Zhang, P.; Zheng, D.; van der Velde, R.; Wen, J.; Zeng, Y.; Wang, X.; Wang, Z.; Chen, J.; Su, Z. Status of the Tibetan Plateau observatory (Tibet-Obs) and a 10-year (2009–2019) surface soil moisture dataset. Earth Syst. Sci. Data 2021, 13, 3075–3102. [Google Scholar] [CrossRef]
- Zhao, L.; Zou, D.; Hu, G.; Wu, T.; Du, E.; Liu, G.; Xiao, Y.; Li, R.; Pang, Q.; Qiao, Y.; et al. A synthesis dataset of permafrost thermal state for the Qinghai–Tibet (Xizang) Plateau, China. Earth Syst. Sci. Data 2021, 13, 4207–4218. [Google Scholar] [CrossRef]
- Zhao, L.; Hu, G.; Zou, D.; Wu, T.; Erji, D.; Liu, G.; Xiao, Y.; Li, R.; Pang, Q.; Qiao, Y.; et al. A Synthesis Dataset of Permafrost for the Qinghai-Xizang (Tibet) Plateau, China (2002–2018); National Tibetan Plateau Data Center: Beijing, China, 2021. [Google Scholar]
- Ren, L.; Wei, L.; Jiang, S.; Shi, J.; Yuan, F.; Zhang, L.; Liu, R. Drought monitoring utility assessment of CHIRPS and GLEAM satellite products in China. Transl. Chin. Soc. Agric. Eng. 2019, 35, 146–154. [Google Scholar]
- Jiang, B.; Tian, J.; Su, H. Estimation of monthly evapotranspiration and soil moisture in the Central Asia. Prog. Geogr. 2020, 39, 433–442. [Google Scholar] [CrossRef]
- Li, H.; Zhang, C.; Wang, S.; Ma, W.; Liu, F.; Chen, Q.; Zhou, Q.; Xia, X.; Niu, B. Response of vegetation dynamics to hydrothermal conditions on the Qinghai-Tibetan Plateau in the last 40 years. Acta Ecol. Sin. 2022, 42, 1–14. [Google Scholar]
- Hou, X. 1:1 Million Vegetation Map of China; National Tibetan Plateau Data Center: Beijing, China, 2019. [Google Scholar]
- Zhao, L. A new map of permafrost distribution on the Tibetan Plateau (2017); National Tibetan Plateau Data Center: Beijing, China, 2019. [Google Scholar]
- Entekhabi, D.; Reichle, R.H.; Koster, R.D.; Crow, W.T. Performance Metrics for Soil Moisture Retrievals and Application Requirements. J. Hydrometeorol. 2010, 11, 832–840. [Google Scholar] [CrossRef]
- Pan, M.; Sahoo, A.K.; Wood, E.F. Improving soil moisture retrievals from a physically-based radiative transfer model. Remote Sens. Environ. 2014, 140, 130–140. [Google Scholar] [CrossRef]
- Song, E.; Liu, S.; He, R.; Cai, J.; Luo, K. Forward modeling on the seasonal frozen soil region detection by ground penetrating radar. Geophys. Geochem. Explor. 2018, 42, 962–969. [Google Scholar]
- Du, E.; Zhao, L.; Wu, T.; Li, R.; Yue, G.; Wu, X.; Li, W.; Jiao, Y.; Hu, G.; Qiao, Y.; et al. The relationship between the ground surface layer permittivity and active-layer thawing depth in a Qinghai–Tibetan Plateau permafrost area. Cold Reg. Sci. Technol. 2016, 126, 55–60. [Google Scholar] [CrossRef]
- Yue, S.; Pilon, P.; Cavadias, G. Power of the Mann–Kendall and Spearman’s rho tests for detecting monotonic trends in hydrological series. J. Hydrol. 2002, 259, 254–271. [Google Scholar] [CrossRef]
- Fernandes, R.; Leblanc, S.G. Parametric (modified least squares) and non-parametric (Theil–Sen) linear regressions for predicting biophysical parameters in the presence of measurement errors. Remote Sens. Environ. 2005, 95, 303–316. [Google Scholar] [CrossRef]
- Huang, N.E.; Shen, Z.; Long, S.R.; Wu, M.L.C.; Liu, H.H. The empirical mode decomposition and the Hilbert spectrum for nonlinear and non-stationary time series analysis. Proc. R. Soc. A Math. Phys. Eng. Sci. 1998, 454, 903–995. [Google Scholar] [CrossRef]
- Wu, Z.; Huang, N.E. Ensemble empirical model decomposition: A noise-assisted data analysis method. Adv. Adapt. Data Anal. 2009, 1, 1–41. [Google Scholar] [CrossRef]
- Qin, Z.; Zou, X.; Weng, F. Comparison between linear and nonlinear trends in NOAA-15 AMSU-A brightness temperatures during 1998–2010. Clim. Dyn. 2012, 39, 1763–1779. [Google Scholar] [CrossRef]
- Prasad, R.; Deo, R.C.; Li, Y.; Maraseni, T. Soil moisture forecasting by a hybrid machine learning technique: ELM integrated with ensemble empirical mode decomposition. Geoderma 2018, 330, 136–161. [Google Scholar] [CrossRef]
- Huang, N.E. An Adaptive Data Analysis Method for Nonlinear and Nonstationary Time Series: The Empirical Mode Decomposition and Hilbert Spectral Analysis. In Wavelet Analysis and Applications; Qian, T., Vai, M.I., Xu, Y., Eds.; Birkhäuser: Basel, Switzerland, 2007; pp. 363–376. ISBN 978-3-7643-7777-9. [Google Scholar]
- Wu, Z.; Huang, N.E.; Wallace, J.M.; Smoliak, B.V.; Chen, X. On the time-varying trend in global-mean surface temperature. Clim. Dyn. 2011, 37, 759. [Google Scholar] [CrossRef] [Green Version]
- Hao, H.; Yu, F.; Li, Q. Soil Temperature Prediction Using Convolutional Neural Network Based on Ensemble Empirical Mode Decomposition. IEEE Access 2021, 9, 4084–4096. [Google Scholar] [CrossRef]
- Wu, Z.; Huang, N.E. A study of the characteristics of white noise using the empirical mode decomposition method. Proc. R. Soc. A Math. Phys. Eng. Sci. 2004, 460, 1597–1611. [Google Scholar] [CrossRef]
- Huang, N.E. Ensemble empirical mode decomposition: A noise assisted dataanalysis method Center for Ocean land Atmosphere Studies. In Handbook of Systemic Autoimmune Diseases; World Scientific: Singapore, 2006; Volume 85. [Google Scholar]
- Xu, Z.X.; Gong, T.L.; Li, J.Y. Decadal trend of climate in the Tibetan Plateau-regional temperature and precipitation. Hydrol. Processes 2008, 22, 3056–3065. [Google Scholar] [CrossRef]
- Fan, K.; Zhang, Q.; Sun, P.; Song, C.; Yu, H.; Zhu, X.; Shen, Z. Effect of soil moisture variation on near-surface air temperature over the Tibetan Plateau. Acta Geogr. Sin. 2020, 75, 82–97. [Google Scholar]
- Zhang, S.; Yang, H.; Yang, D.; Jayawardena, A.W. Quantifying the effect of vegetation change on the regional water balance within the Budyko framework. Geophys. Res. Lett. 2016, 43, 1140–1148. [Google Scholar] [CrossRef]
- Yuan, W.; Liu, S.; Liu, H.; Randerson, J.T.; Yu, G.; Tieszen, L.L. Impacts of precipitation seasonality and ecosystem types on evapotranspiration in the Yukon River Basin, Alaska. Water Resour. Res. 2010, 46. [Google Scholar] [CrossRef] [Green Version]
- Zhang, Y.; Ohata, T.; Kadota, T. Land-surface hydrological processes in the permafrost region of the eastern Tibetan Plateau. J. Hydrol. 2003, 283, 41–56. [Google Scholar] [CrossRef]
- Chang, Y.; Qin, D.; Ding, Y.; Zhao, Q.; Zhang, S. A modified MOD16 algorithm to estimate evapotranspiration over alpine meadow on the Tibetan Plateau, China. J. Hydrol. 2018, 561, 16–30. [Google Scholar] [CrossRef]
- Qin, Y.; Wu, T.; Wu, X.; Li, R.; Xie, C.; Qiao, Y.; Hu, G.; Zhu, X.; Wang, W.; Shang, W. Assessment of reanalysis soil moisture products in the permafrost regions of the central of the Qinghai–Tibet Plateau. Hydrol. Processes 2017, 31, 4647–4659. [Google Scholar] [CrossRef]

Publisher’s Note: MDPI stays neutral with regard to jurisdictional claims in published maps and institutional affiliations. |
© 2022 by the authors. Licensee MDPI, Basel, Switzerland. This article is an open access article distributed under the terms and conditions of the Creative Commons Attribution (CC BY) license (https://creativecommons.org/licenses/by/4.0/).