Technical Note

Impact of Lock-In Time Constant on Remote Monitoring of Trace Gas in the Atmospheric Column Using Laser Heterodyne Radiometer (LHR)

1
School of Advanced Manufacturing Engineering, Hefei University, Hefei 230601, China
2
Laboratoire de Physico-Chimie de l’Atmosphère, Université du Littoral Côte d’Opale, 59140 Dunkerque, France
3
Anhui Institute of Optics and Fine Mechanics, Chinese Academy of Sciences, Hefei 230031, China
*
Author to whom correspondence should be addressed.
Remote Sens. 2022, 14(12), 2923; https://doi.org/10.3390/rs14122923
Submission received: 17 May 2022 / Revised: 14 June 2022 / Accepted: 16 June 2022 / Published: 18 June 2022
(This article belongs to the Special Issue Advances in Infrared Observation of Earth's Atmosphere)

Abstract

:
The time constant selected for lock-in amplification (LIA) has a crucial impact on observed line shapes in laser heterodyne spectroscopy, in particular in the case of ground-based remote monitoring of trace gas in the atmospheric column using laser heterodyne radiometer (LHR). Conventional simulation could not allow validation of LHR spectra measured in a real and complex atmospheric environment exhibiting large temporal and spatial variability (humidity, temperature, pressure, etc) that impact significantly the measured LHR spectra profiles. High-precision spectral measurement is thus crucial to avoid any spectral distortion resulting from the measurement. In this paper, the impact of LIA time constant on spectral line shape is investigated for LHR operating in continuous laser tuning mode, based on analysis of laboratory heterodyne spectra, in terms of signal-to-noise ratio (SNR), line width broadening, absorption depth and line shift. With respect to the given frequency scanning speed in continuous mode and to the halfwidth of the absorption feature to scan, a reasonable scanning time ΔTscan, the time needed for scanning laser frequency through the halfwidth ΔνHWHM of the absorption line, equal to or longer than 14 times of the LIA time constant τ is concluded in order to efficiently reduce the noise while without significant shift and distortion of the line shape. Experimental validation was carried out using a laser heterodyne absorption spectroscopy approach in the laboratory. Four different combinations of time constants τ and scanning time ΔTscan were used to record heterodyne spectra of a CH4 absorption line near 1242.00 cm−1 in continuous laser tuning mode. An optimal combination of a scanning time of 137 ms with a time constant of 1 ms was obtained. This optimal combination was used for ground-based measurements of CH4 and N2O in the atmospheric column by LHR. The extracted LHR spectrum is in good agreement with a referenced TCCON (Total Carbon Column Observing Network) FT-IR (Fourier-transform infrared) spectrum.

Graphical Abstract

1. Introduction

Since the last decade, there has been a growing development of laser heterodyne radiometers (LHR) [1,2,3,4,5] for ground-based remote sensing of greenhouse gases (GHGs, such as nitrous oxide (N2O), methane (CH4), water vapor (H2O), carbon dioxide (CO2) and ozone (O3) in the atmospheric column. Though the vertical air transport in the troposphere is smaller than in the longitudinal direction [6] but is nonetheless of critical importance for the study of pollutant transport, climate change, global environmental parameters and anthropogenic effects on atmospheric chemistry [7,8]. Vertical concentration profiles of key atmospheric trace gases are essential in validating chemical transport models, satellite observations, and provide evidence for environmental assessment and policy formulation [9,10]. LHR exhibits its unique advantages in comparison with conventionally used Fourier-transform spectrometer (FTS) for ground-based measurements of vertical concentration distribution, which include high spectral resolution (<10−3 cm−1, mainly determined by the selected electronic filter bandwidths), high sensitivity (within a factor of ~2 of the quantum noise limit) [2], high spatial resolution owing to a very small field of view (~0.4 mrad, compared to ~2.4 mrad of the conventionally used FTS) and cost-effective compact instrumental dimension.
In an LHR system, a lock-in amplifier (LIA) is usually used to recover weak heterodyne signals buried in noise [11,12] through phase-sensitive detection (PSD) of signals and rejection of noises by a low-pass filter (whose cut-off frequency is determined by the LIA time constant τ) [13]. Meanwhile, the used LIA time constant might significantly impact the line shape of the recorded LHR spectrum [3]. The impact of the LIA time constant on laser heterodyne spectrum measurements was discussed for LHR operating in point-by-point tuning mode of laser frequency, where a time interval (between two sampling points) longer than ~6 times of the LIA time constant τ should be used to avoid deformation of LHR spectrum line shape [4,5].
In this paper, we report on an investigation on the impact of LIA time constant τ on LHR spectrum line shape in continuous tuning mode of the laser frequency. Continuous tuning mode is particularly interesting in fast extraction of high-precision line shape of LHR spectrum compared with point-by-point tuning mode [14]. Relationship between scanning time ΔTscan (the time needed for scanning laser frequency through the halfwidth ΔνHWHM of the absorption line, which depends upon the frequency scanning speed νsc) and the LIA time constant τ in continuous tuning mode of laser frequency has been experimentally investigated, which was then validated by laser heterodyne absorption experiment performed on the LHR measurement of the CH4 absorption spectrum.

2. Materials and Methods

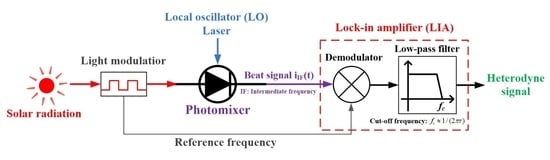
2.1. Principle of Laser Heterodyne Radiometer

The principle of LHR is schematically shown in Figure 1. In an LHR, the electromagnetic field of the sunlight ES(t) = AS0(ω)cos(ωt) at frequency ω is mixed in a photomixer with an electromagnetic field EL(t) = AL0L)cos(ωLt) at frequency ωL from a local oscillator (LO). A beat note at an intermediate frequency (IF, |ω-ωL|), produced from the photomixing, is amplified by a low-noise amplifier and filtered by a band-pass filter. This heterodyne signal is then square-law detected and fed into an LIA, the output of the LIA is sampled by a laptop for further data processing. The heterodyne absorption spectrum of atmospheric species can be recovered by scanning the LO frequency across the absorption line (leading to a change in intensity of the resulting radio frequency (RF) beat signal). The shape of the ground-recovered atmospheric absorption spectrum contains information on the vertical distributions of the target absorbers. It is possible to retrieve trace gas abundances at different altitudes through a retrieval algorithm based on an appropriate inversion model [3,4,5].

2.2. Analytical Model

In continuous tuning mode, deformation of the LHR spectrum line shape is mainly introduced in the process of signal demodulation of the LIA, in which the whole LHR spectrum passes through a low-pass filter of the LIA, the cut-off frequency and order of the low-pass filter may have different degrees of influence on the LHR spectrum.
The cut-off frequency (fc) of the low-pass (LP) filter is driven by the LIA time constant τ (in [s]) as fc = 1/(2πτ) [15]. The time constant τ is a very critical parameter for the use of LIA, which impacts noise suppression and the line shape of the measured LHR spectrum. The longer time constant τ can significantly filter out noise, while it also results in a blue-shift of the spectral line center (shifting to the frequency scan direction/decrease in wavelength) and then distorts the line shape (becoming broadened and asymmetric) [15,16].
The frequency shift δν can be approximately expressed by [17]:
δ ν = d ν d t τ = υ s c τ
where dν/dt = νsc is the frequency scanning speed in [cm−1/s]. In continuous periodical scanning, the frequency scanning speed is the ratio of the frequency scanning range Δνscan to the scanning period T (in [s]) that is the reciprocal of the scanning frequency.
In order to avoid deformation of the LHR spectrum line shape, the LIA time constant τ has to be appropriately chosen with respect to the time ΔTscan. Simulations of the impact of τ have been performed in order to investigate the optimal τ with respect to the experimentally applied frequency scanning speed. The effective transfer function of the LP filter (Figure 2) can be expressed by Equation (2).
According to Kirchhoff’s Laws and the definition of capacitance:
V i n ( t ) V o u t ( t ) = R C · d V o u t ( t ) d t
where R is the resistance and C is the capacitance of the LP filter. For simplicity, assuming that samples of the input and output are taken at evenly spaced points in time separated by Δt, Equation (2) can be expressed in terms of Vout at time k, Vin at time k and dVout of Vout at time k and k−1, respectively:
V i n ( k ) V o u t ( k ) = R C · V o u t ( k ) V o u t ( k 1 ) Δ t
Rearranging terms in Equation (3) gives a recurrence relation:
V o u t ( k ) = V i n ( k ) · ( Δ t R C + Δ t ) + V o u t ( k 1 ) · ( R C R C + Δ t )
The first term on the right side of Equation (4) is the contribution from the input, and the second term is the inertia from the previous output. This differential model of the LP filter described in Equation (4) provides a way to determine the output data based on the input and the previous output values.
Based on Equation (4), the effect of the LP filter for frequency scan in continuous tuning mode is simulated by using a pseudocode algorithm with the help of Matlab. In the simulation, Vin is a Hitran simulation spectrum of CH4 around 1233.45 cm−1 with an HWHM line width of 0.014 cm−1, and Vout is the simulation output resulting from different experimental parameters: scanning period T, scanning speed υsc, scanning time ΔTscan (ΔνHWHMsc) over a spectral range of Δνscan = 1 cm−1, and time constant τ. The simulation results are overviewed in Table 1 and presented in Figure 3.
As can be seen in Figure 3, when the scanning time ΔTscan is 9–23 times of time constant τ, the output spectrum (red) is almost consistent with the input spectrum (black) and the noise can be efficiently rejected without causing obvious shift and distortion of the line shape. The scanning time ΔTscan (Table 1 in blue bold) as a function of the optimum time constant τ (Table 1 in red bold) is plotted in Figure 4. The mathematical relationship between the time constant τ and the scanning time ΔTscan is obtained from a linear fit (r2 = 99.25):
Δ T s c a n = Δ ν H W H M / υ s c 14 · τ
Based on Equation (5), with respect to the given frequency scanning speed in the continuous mode and to the halfwidth of the spectrum to scan, the reasonable scanning time ΔTscan should be equal to or longer than 14 times of the LIA time constant τ in order to efficiently reduce the noise without significant shift and distortion of the line shape.

2.3. Experimental System Description

An experimental investigation has been performed on measurements of heterodyne spectra under different τ and υsc combinations, based on a blackbody simulating sunlight emission.
The developed proof of concept (PoC) LHR prototype operating in the mid-infrared (mid-IR) near 8 µm is schematically shown in Figure 5. As a typical LHR, it includes a sunlight collection system associated with a sun-tracker, a local oscillator (tunable laser source), a photomixer to generate the beating signal at RF, an RF receiver, a signal modulation and demodulation module, as well as a frequency metrology module (in our case, direct absorption of the target molecule in a 12.5 cm long single-pass reference cell was used). To characterize and optimize the performance of the developed PoC LHR, a stable blackbody (BB) source was used as sunlight. Heterodyne measurements of CH4 absorption spectra were performed in the laboratory using a 12.5 cm single-pass absorption cell.
Radiation from the blackbody (BB, MODELS 67030, Newport Inc. Florida, USA) at 1000 °C was collected and collimated with off-axis parabolic mirror (OAPM) 1 (f1 = 120 mm), then focused and directed by OAPM 2 (f2 = 75 mm) towards a 12.5 cm long single-pass cell (Figure 5a) that was filled with CH4 mixture in air at atmospheric pressure. The BB beam was filtered by an optical filter in germanium in order to let only the transmission of BB radiation at wavelengths longer than 7 µm and shorter than 12 µm in our case to minimize source shot noise [18]. The beam emerging from the filter was amplitude modulated at 1 kHz using a chopper (Model MC1F10HP, Thorlabs, Inc. Newton, NJ, USA) located at the real focal point of OAPM2 and then directed to a 5%R/95%T beam splitter (BS, in CaF2). The BB beam (at ω) was superimposed with a LO laser beam (at ωL) from an external cavity quantum cascade laser (EC-QCL, TLS-41000-MHF, Daylight solutions Inc. San Diego, CA, USA) [19] which was beam size-expanded by two OAPMs (f3 = 12.7 mm and f4 = 38.1 mm), intensity-controlled and polarization-adjusted using a wideband IR polarizer (2–12 µm, PGC-5, Innpho. Inc. Verona, NJ, USA). The combined beams were focused onto a VIGO photomixer (PVI-4TE-10.6, VIGO System S.A. Ozarow Mazowiecki, Poland) by OAPM 5 (f5 = 12.7 mm). The beat note signal at |ω−ωL| in the RF domain, generated from the photomixer, entered the RF receiver through a 27–33 MHz band-pass (BP) filter (Model 15542, Mini-Circuits®) followed by 2-stage low-noise amplifiers (Model ZFL-500LN+, Mini-Circuits®) with a gain of 24 dB each. After that, the amplified beat signal was connected to a square-law Schottky diode (Model 8472B, Keysight Inc. Colorado Springs, CO, USA) for measurement of the RF signal power that is proportional to the square of the input beat signal amplitude. The output signal from the square-law detector was demodulated with a lock-in amplifier (LIA, Model 5110, AMETEK Inc.Berwyn, PA, USA with time constant range: 1 ms–300 s.). A National Instruments data acquisition card (PCI 6251, NI Inc. Austin, TX, USA) was used to digitalize the output signal from the LIA via a custom-written LabVIEW program. The data were then transferred to a laptop for further data processing.
One part of the EC-QCL beam (transmitted by the BS) is directed to either a 12.5 cm long custom-made Fabry-Pérot etalon (with a free spectral range, FSR = 0.0333 cm−1) for relative frequency calibration or to a single-pass cell filled with target gas sample for determination of the EC-QCL absolute frequency.
The LO laser frequency was scanned across an appropriate CH4 absorption line (around 1233.46 cm−1) by applying a sine-wave (with an amplitude of +3 VPP and an offset of +1.6 VD (limited by the EC-QCL structure) from a function generator to the PZT (Piezoelectric ceramic transducer) element of the EC-QCL. Heterodyne spectra of CH4 absorption of the incident BB radiation (Figure 6, black) were recorded using four combinations of different τ and υsc (Table 2) and fitted to a Lorentz profile (Figure 6, blue and red).

3. Results

3.1. Experimental Results

Based on the analysis of the heterodyne absorption spectra shown in Figure 6 (black), signal-to-noise ratio (SNR), line width broadening (Δνb), absorption depth, line shift (δν), and noise level (1σ) of these spectra were analyzed and summarized in Table 3, the optimal time constants (τ) at given scanning speeds of LO frequency (υsc) and scanning times (ΔTscan) were obtained from the current work, as shown in Table 3 in bold and Figure 6 in red.
As can be seen, the selection of the LIA time constant τ should be well matched to the scanning speed of the LO frequency as well as the scanning time. When the time constant is too small, the noise could not be efficiently removed. While a longer (than the optimal one) time constant would result in reduced absorption depth, a shift in absorption center frequency and distortion of absorption line shape.
Comparing the above four optimal combinations for heterodyne measurements, it is seen that the combination of the scanning speed of the LO frequency of 0.3935 cm−1/s (the scanning time of 137 ms) and the LIA time constant of 1 ms could provide a relatively low noise level and the highest absorption depth without an obvious shift in absorption center frequency and distortion of the line shape. This relatively fast scanning time ΔTscan of 137 ms makes it easier to acquire a fast extraction of the high-precision line shape of LHR spectrum. This combination was therefore selected for our further LHR measurements.

3.2. Field Measurement

Using the optimal combination of the scanning time of 137 ms and the time constant of 1 ms, the developed LHR instrument was deployed to a field campaign in Dunkerque (51.05°N/2.34°E) for ground-based remote sensing of greenhouse gases in the atmospheric column.
The LO laser frequency was scanned around 1262.00 cm−1 to probe absorption lines of N2O (at 1261.9871 cm−1) and CH4 (at 1261.6450 and 1262.2249 cm−1). An RF filter of 225–270 MHz pass-band was used to remove 1/f noise as well as other extraneous noises outside of the bandwidth, and this pass-band resulted in a ~0.003 cm−1 double-sideband spectral resolution for the remote measurements.
The measured CH4 and N2O heterodyne spectrum in the atmospheric column is presented in Figure 7 (blue curve), accompanied by a referenced TCCON (Total Carbon Column Observing Network) FT-IR (Fourier-transform infrared) spectrum (Figure 7 (red curve)) measured using a Bruker IFS 125HR FTS (resolution: 0.02 cm−1) of the TCCON observation network [21] on the QualAir platform of University of Paris 6. As can be seen, the LHR spectrum, with higher SNR, is in good agreement with the referenced FT-IR spectrum. Due to interference of nearby water vapor absorption that changes with time and space [22], wings on either side of the LHR spectrum are sometimes slightly different from those of the referenced FT-IR spectrum. The overall spectral line shapes of both two spectra are well consistent. In comparison to FTS, LHR is more suitable for field deployment owing to its room-temperature operation capacity, compact size, and lightweight (0.6 × 0.9 m2/25 kg for the present LHR vs. 2 × 4 m2/700 kg for a traditional FTS).

4. Discussion

Study and experimental investigation of the impact of LIA time constant on observed LHR line shape in continuous tuning laser frequency mode are carried out. Based on the present work, the scanning time ΔTscan of laser frequency across the halfwidth of the absorption line ΔνHWHM, the scanning speed of the LO laser frequency υsc and the LIA time constant τ should be appropriately matched such that ΔTscan = ΔνHWHMsc ≥ 14τ in order to obtain high-precision heterodyne spectrum (with minimum line shift and line shape distortion). This relationship was validated by laser heterodyne measurements of CH4 absorption spectra in the laboratory using four combinations of different time constants τ and scanning time ΔTscan in continuous tuning mode. The optimal combination of the scanning time of 137 ms and the time constant of 1 ms, which can efficiently reduce the noise without introducing obvious line shift and distortion, was therefore selected for ground-based measurements of CH4 and N2O in the atmospheric column. The extracted LHR spectrum is in good agreement with a referenced TCCON FT-IR spectrum.

Author Contributions

Conceptualization, F.S., W.C. and Z.C.; methodology, F.S., W.C. and T.T.; software, F.S., G.W., T.T. and Z.X.; validation, F.S. and W.C.; formal analysis, F.S.; investigation, F.S.; resources, F.S.; data curation, F.S.; writing—original draft preparation, F.S.; writing—review and editing, F.S.; visualization, F.S.; supervision, W.C. and X.G.; project administration, F.S. and W.C.; funding acquisition, F.S. and W.C. All authors have read and agreed to the published version of the manuscript.

Funding

This research was funded by the Talent fund of Hefei University under Grant, grant number 22040421002, University Natural Science Research Program of Anhui Province, grant number KJ2021A0979, Key disciplines of Hefei University: Information and Communication Engineering, grant number 2018xk03, French national research agency (ANR) under the CaPPA, grant number ANR-10-LABX-005 and the CPER ECRIN contracts.

Data Availability Statement

Not applicable.

Conflicts of Interest

The authors declare no conflict of interest.

References

  1. Lu, X.; Huang, Y.; Wu, P.; Liu, D.; Ma, H.; Wang, G.; Cao, Z. Distributed Feedback Interband Cascade Laser Based Laser Heterodyne Radiometer for Column Density of HDO and CH4 Measurements at Dunhuang, Northwest of China. Remote Sens. 2022, 14, 1489. [Google Scholar] [CrossRef]
  2. Shen, F.J.; Wang, G.X.; Wang, J.J.; Tan, T.; Wang, G.S.; Jeseck, P.; Té, Y.V.; Gao, X.M.; Chen, W.D. Transportable mid-infrared laser heterodyne radiometer operating in the shot-noise dominated regime. Opt. Lett. 2021, 46, 3171–3174. [Google Scholar] [CrossRef]
  3. Lu, X.J.; Cao, Z.S.; Tan, T.; Huang, Y.B.; Gao, X.M.; Rao, R.Z. Instrument line shape function of laser heterodyne spectrometer. Acta Phys. Sin. 2019, 68, 064208. [Google Scholar] [CrossRef]
  4. Tsai, T.; Rose, R.A.; Weidmann, D.; Wysocki, G. Atmospheric vertical profiles of O3, N2O, CH4, CCl2F2, and H2O retrieved from external-cavity quantum-cascade laser heterodyne radiometer measurements. Appl. Opt. 2012, 51, 8779–8792. [Google Scholar] [CrossRef] [PubMed] [Green Version]
  5. Wang, J.J.; Wang, G.S.; Tan, T.; Zhu, G.; Sun, C.Y.; Cao, Z.S.; Chen, W.D.; Gao, X.M. Mid-infrared laser heterodyne radiometer (LHR) based on a 3.53 μm room-temperature interband cascade laser. Opt. Exp. 2019, 27, 9610–9619. [Google Scholar] [CrossRef] [PubMed]
  6. Brasseur, G.P.; Jacob, D.J. Modeling of Atmospheric Chemistry; Cambridge University Press: Cambridge, UK, 2017; pp. 84–204. [Google Scholar]
  7. Ehhalt, D.H. Concentrations and distributions of atmospheric trace gases. Ber. Bunsenges. Phys. Chem. 1992, 96, 229–240. [Google Scholar] [CrossRef]
  8. Tsai, T. External cavity quantum cascade lasers for spectroscopic applications. Doctoral Dissertation, Princeton University, Princeton, NJ, USA, 2012. [Google Scholar]
  9. Mahieu, E.; Duchatelet, P.; Demoulin, P.; Walker, K.A.; Dupuy, E.; Froidevaux, L.; Randall, C.; Catoire, V.; Strong, K.; Boone, C.D.; et al. Validation of ACE-FTS v2.2 measurements of HCl, HF, CCl3F and CCl2F2 using space-, balloon- and ground-based instrument observations. Atmos. Chem. Phys. 2008, 8, 6199–6221. [Google Scholar] [CrossRef] [Green Version]
  10. Marquart, S.; Ponater, M.; Mager, F.; Sausen, R. Future development of contrail cover, optical depth, and radiative forcing: Impacts of increasing air traffic and climate change. J. Clim. 2003, 16, 2890–2904. [Google Scholar] [CrossRef]
  11. Scofield, J.H. Frequency domain description of a lock-in amplifier. Am. J. Phys. 1994, 62, 129–133. [Google Scholar] [CrossRef]
  12. Wang, G.X.; Rebou, S.; Choque, J.; Fertein, E.; Chen, W.D. Circular regression-based dual-phase lock-in amplifier for coherent recovery of weak signal. Sensors 2017, 17, 2615. [Google Scholar] [CrossRef] [PubMed] [Green Version]
  13. SRS. About Lock-in Amplifiers. Available online: http://www.thinksrs.com/downloads/PDFs/ApplicationNotes/AboutLIAs.pdf (accessed on 16 May 2015).
  14. Rohart, F.; Mejri, S.; Sow, P.; Tokunaga, S.K.; Chardonnet, C.; Darquié, B.; Dinesan, H.; Fasci, E.; Castrillo, A.; Gianfrani, L. Absorption line shape recovery beyond the detection bandwidth limit: Application to the precision spectroscopic measurement of the Boltzmann constant. Phys. Rev. A Am. Phys. Soc. 2014, 90, 042506–042630. [Google Scholar] [CrossRef] [Green Version]
  15. Pelant, I.; Valenta, J. Luminescence Spectroscopy of Semiconductors. Oxford Scholarship Online. 2012. Available online: https://oxford.universitypressscholarship.com/view/10.1093/acprof:oso/9780199588336.001.0001/acprof-9780199588336 (accessed on 1 May 2012).
  16. Brodersen, S. Noise filter effects in recording spectroscopes. J. Opt. Soc. Am. 1953, 43, 1216–1220. [Google Scholar] [CrossRef]
  17. Demtröder, W. Laser Spectroscopy: Basic Concepts and Instrumentation; Springer: Berlin/Heidelberg, Germany, 1996. [Google Scholar]
  18. Kostiuk, T.; Mumma, M.J. Remote sensing by IR heterodyne spectroscopy. Appl. Opt. 1983, 22, 2644–2654. [Google Scholar] [CrossRef] [PubMed]
  19. Shen, F.J.; Akil, J.; Wang, G.X.; Poupin, C.; Cousin, R.; Siffert, S.; Fertein, E.; Ba, T.; Chen, W.D. Real-time monitoring of N2O production in a catalytic reaction process using mid-infrared quantum cascade laser. J. Quant. Spectrosc. Radiat. Transf. 2018, 221, 1–7. [Google Scholar] [CrossRef]
  20. Gordon, I.E.; Rothman, L.S.; Hill, C.; Kochanov, R.V.; Tan, Y.; Bernath, P.F.; Birk, M.; Boudon, V.; Campargue, A.; Chance, K.V.; et al. The HITRAN2016 molecular spectroscopic database. J. Quant. Spectrosc. Rad. Transf. 2017, 203, 3–69. [Google Scholar] [CrossRef]
  21. Té, Y.; Jeseck, P.; Franco, B.; Mahieu, E.; Jones, N.P.; Paton-Walsh, C.; Griffith, D.W.T.; Buchholz, R.R.; Hadji-Lazaro, J.; Hurtmans, D.; et al. Seasonal variability of surface and column carbon monoxide over the megacity Paris, high-altitude Jungfraujoch and Southern Hemispheric Wollongong stations. Atmos. Chem. Phys. 2016, 16, 10911–10925. [Google Scholar] [CrossRef] [Green Version]
  22. Kämpfer, N. Monitoring Atmospheric Water Vapour: Ground-Based Remote Sensing and In Situ Methods; Springer: New York, NY, USA, 2013; Volume 13, pp. 1–7. [Google Scholar]
Figure 1. Basic principle of a typical laser heterodyne radiometer (LHR). RF: Radio frequency; IF: Intermediate frequency; LIA: Lock-in amplifier; LO: Local oscillator.
Remotesensing 14 02923 g001
Figure 2. Scheme of a LP filter. R is the resistor and C is the capacitor.
Remotesensing 14 02923 g002
Figure 3. Simulation of output spectra from the LP filter using different parameters (see Table 1), in comparison to the Hitran simulation of input spectrum of CH4 near 1233.45 cm−1.
Remotesensing 14 02923 g003
Figure 4. Plot of ΔTscan, vs. time constant τ, associated with a linear fit.
Remotesensing 14 02923 g004
Figure 5. (a) Schematic of the developed LHR prototype. BB: Blackbody; EC-QCL: external cavity quantum cascade laser; OAPM: Off-axis parabolic mirror; BS: Beam splitter; BP Filter: Band-pass filter; DAQ: Data acquisition card. (b) Picture of the mid-IR LHR receiver (without sun-tracker part). Red dot line: sunlight beam path; orange dot line: blackbody beam path; yellow dot line: He-Ne laser beam path; blue dot line: EC-QCL beam path; green dot line: combined LO-BB beams to the photomixer.
Remotesensing 14 02923 g005
Figure 6. BB-based heterodyne spectra of CH4 absorption at different scanning speed (υsc) (i.e., different given scanning time ΔTscan) combined with different time constants (τ), respectively. Line shape fits were performed using the Lorentz profile (red or blue).
Remotesensing 14 02923 g006
Figure 7. Atmospheric absorption spectrum of CH4 and N2O recorded with a Bruker IFS 125HR Fourier-transform spectrometer (FTS) in Paris (in red), with our LHR in Dunkerque (in blue).
Remotesensing 14 02923 g007
Table 1. Simulation of LP filter effect on absorption line shape with different τ. HWHM: Half Width at Half Maximum.
Halfwidth ΔνHWHM (cm−1)0.0140.0140.0140.0140.0140.0140.0140.0140.0140.014
Scanning range Δνscan (cm1)1111111111
Scanning period T (s)0.30.511.522.5351030
Scan frequency ν (Hz)3.33210.670.50.40.330.20.10.033
Scanning speed υsc (cm1/s) = Δνscan/T3.33 2 10.670.50.40.330.20.10.033
Scanning time ΔTscan (ms)4.176.9513.920.8527.834.7541.769.5139417
τ (ms)0.10.10.10.10.10.30.30.311
0.30.30.30.30.311133
111113331010
333331010103030
1010101010303030100100
3030303030----300
--100-------
Table 2. Used time constants at a given scanning speed of the LO frequency υsc. (Note: the spectral half width ΔνHWHM of the used CH4 line around 1233.46 cm−1 is 0.0538 cm−1 [20] at ambient pressure).
Scanning Frequency (mHz)2050100250
Scanning period T (s)251052
Scanning range Δνscan (cm−1)0.7870.7870.7870.787
halfwidth ΔνHWHM (cm−1)0.05380.05380.05380.0538
Scanning speed υsc (cm−1/s) = Δνscan/T0.031480.07870.15740.3935
Scanning time ΔTscan (ms) = ΔνHWHMsc1709684342137
τ (ms)10030101
30010030 10
100030010030
-1000300-
Table 3. Analysis of BB-based heterodyne spectra of CH4 absorption at different scanning speeds of the LO frequency (υsc) (i.e., different given scanning time ΔTscan) with different time constants (τ). 1σ: Standard deviation.
υsc
(cm−1/s)
ΔTscan
(ms)
τ
(ms)
SNRΔνb
(cm−1)
Absorption Depthδν
(cm−1)
Fit Residual
(1σ)
0.03148170910050.05450.01260.00320.0026
30080.06560.01140.00950.0015
100080.07110.00620.03250.0008
0.07876843050.05480.012580.00310.00230
10060.06400.012440.00810.00210
300 0.07220.011540.02430.00180
100060.12220.005700.08210.00089
0.15743421050.05500.012510.00160.00230
3060.06270.012040.00480.00209
10070.06720.011010.01810.00156
30070.08120.008240.04900.00115
0.3935137170.05410.012610.00040.00174
1090.05990.011810.00410.00129
3080.07330.007360.01200.00096
Publisher’s Note: MDPI stays neutral with regard to jurisdictional claims in published maps and institutional affiliations.

