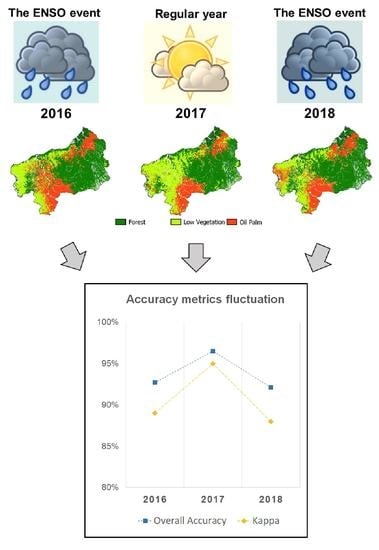
Inter-Annual Climate Variability Impact on Oil Palm Mapping
Abstract
:1. Introduction
2. Materials and Methods
2.1. Area of Study and Period
2.2. Satellite Imagery
2.3. Preprocessing
2.4. Reference Data and Classification Algorithm
3. Results
3.1. Classification Performance of Maps from Single Data Source and Data Fusion
3.2. Inter-Annual Comparison of Classification Performance
4. Discussion
5. Conclusions
Supplementary Materials
Author Contributions
Funding
Data Availability Statement
Acknowledgments
Conflicts of Interest
References
- De Petris, S.; Boccardo, P.; Borgogno-Mondino, E. Detection and characterization of oil palm plantations through MODIS EVI time series. Int. J. Remote Sens. 2019, 40, 7297–7311. [Google Scholar] [CrossRef]
- Vijay, V.; Pimm, S.L.; Jenkins, C.N.; Smith, S.J. The Impacts of Oil Palm on Recent Deforestation and Biodiversity Loss. PLoS ONE 2016, 11, e0159668. [Google Scholar] [CrossRef]
- Gutiérrez-Vélez, V.H.; DeFries, R.; Pinedo-Vásquez, M.; Uriarte, M.; Padoch, C.; Baethgen, W.; Fernandes, K.; Lim, Y. High-yield oil palm expansion spares land at the expense of forests in the Peruvian Amazon. Environ. Res. Lett. 2011, 6, 044029. [Google Scholar] [CrossRef]
- Cheng, Y.; Yu, L.; Xu, Y.; Liu, X.; Lu, H.; Cracknell, A.P.; Kanniah, K.; Gong, P. Towards global oil palm plantation mapping using remote-sensing data. Int. J. Remote Sens. 2018, 39, 5891–5906. [Google Scholar] [CrossRef]
- Pohl, C. Mapping palm oil expansion using SAR to study the impact on the CO2 cycle. IOP Conf. Ser. Earth Environ. Sci. 2014, 20, 12012. [Google Scholar] [CrossRef] [Green Version]
- Razali, S.M.; Marín, A.; Nuruddin, A.A.; Shafri, H.Z.M.; Hamid, H.A. Capability of Integrated MODIS Imagery and ALOS for Oil Palm, Rubber and Forest Areas Mapping in Tropical Forest Regions. Sensors 2014, 14, 8259–8282. [Google Scholar] [CrossRef] [Green Version]
- Lee, J.S.H.; Wich, S.; Widayati, A.; Koh, L.P. Detecting industrial oil palm plantations on Landsat images with Google Earth Engine. Remote Sens. Appl. Soc. Environ. 2016, 4, 219–224. [Google Scholar] [CrossRef] [Green Version]
- Jin, Y.; Sung, S.; Lee, D.K.; Biging, G.S.; Jeong, S. Mapping Deforestation in North Korea Using Phenology-Based Multi-Index and Random Forest. Remote Sens. 2016, 8, 997. [Google Scholar] [CrossRef] [Green Version]
- Wardlow, B.D.; Egbert, S.L. A comparison of MODIS 250-m EVI and NDVI data for crop mapping: A case study for southwest Kansas. Int. J. Remote Sens. 2010, 31, 805–830. [Google Scholar] [CrossRef]
- Nooni, I.K.; Duker, A.; Van Duren, I.; Addae-Wireko, L.; Jnr, E.O. Support vector machine to map oil palm in a heterogeneous environment. Int. J. Remote Sens. 2014, 35, 4778–4794. [Google Scholar] [CrossRef]
- Sabajo, C.R.; le Maire, G.; June, T.; Meijide, A.; Roupsard, O.; Knohl, A. Expansion of oil palm and other cash crops causes an increase of the land surface temperature in the Jambi province in Indonesia. Biogeosciences 2017, 14, 4619–4635. [Google Scholar] [CrossRef] [Green Version]
- Ramdani, F.; Moffiet, T.; Hino, M. Local surface temperature change due to expansion of oil palm plantation in Indonesia. Clim. Chang. 2014, 123, 189–200. [Google Scholar] [CrossRef]
- Li, M.; Liew, S.C.; Kwoh, L.K. Producing cloud free and cloud-shadow free mosaic from cloudy IKONOS images. In Proceedings of the IGARSS 2003—2003 IEEE International Geoscience and Remote Sensing Symposium, Toulouse, France, 21–25 July 2003; pp. 3946–3948. [Google Scholar] [CrossRef]
- Tseng, D.-C.; Tseng, H.-T.; Chien, C.-L. Automatic cloud removal from multi-temporal SPOT images. Appl. Math. Comput. 2008, 205, 584–600. [Google Scholar] [CrossRef]
- Cheng, Y.; Yu, L.; Xu, Y.; Lu, H.; Cracknell, A.P.; Kanniah, K.; Gong, P. Mapping oil palm extent in Malaysia using ALOS-2 PALSAR-2 data. Int. J. Remote Sens. 2017, 39, 432–452. [Google Scholar] [CrossRef]
- Li, L.; Dong, J.; Tenku, S.N.; Xiao, X. Mapping Oil Palm Plantations in Cameroon Using PALSAR 50-m Orthorectified Mosaic Images. Remote Sens. 2015, 7, 1206–1224. [Google Scholar] [CrossRef] [Green Version]
- Oon, A.; Ngo, K.D.; Azhar, R.; Ashton-Butt, A.; Lechner, A.; Azhar, B. Assessment of ALOS-2 PALSAR-2L-band and Sentinel-1 C-band SAR backscatter for discriminating between large-scale oil palm plantations and smallholdings on tropical peatlands. Remote Sens. Appl. Soc. Environ. 2018, 13, 183–190. [Google Scholar] [CrossRef]
- Hong, G.; Zhang, A.; Zhou, F.; Brisco, B. Integration of optical and synthetic aperture radar (SAR) images to differentiate grassland and alfalfa in Prairie area. Int. J. Appl. Earth Obs. Geoinf. ITC J. 2014, 28, 12–19. [Google Scholar] [CrossRef]
- Lambin, E.F.; Ehrlich, D. Combining vegetation indices and surface temperature for land-cover mapping at broad spatial scales. Int. J. Remote Sens. 1995, 16, 573–579. [Google Scholar] [CrossRef]
- Lambin, E.F.; Ehrlich, D. International Journal of Remote Sensing The surface temperature-vegetation index space for land cover and land-cover change analysis. Int. J. Remote Sens. 1996, 17, 463–487. [Google Scholar] [CrossRef]
- Lopes, M.; Frison, P.; Durant, S.M.; Bühne, H.S.T.; Ipavec, A.; Lapeyre, V.; Pettorelli, N. Combining optical and radar satellite image time series to map natural vegetation: Savannas as an example. Remote Sens. Ecol. Conserv. 2020, 6, 316–326. [Google Scholar] [CrossRef]
- Sarzynski, T.; Giam, X.; Carrasco, L.; Lee, J.S.H. Combining Radar and Optical Imagery to Map Oil Palm Plantations in Sumatra, Indonesia, Using the Google Earth Engine. Remote Sens. 2020, 12, 1220. [Google Scholar] [CrossRef] [Green Version]
- Yusoff, N.M.; Muharam, F.M.; Khairunniza-Bejo, S. Towards the use of remote-sensing data for monitoring of abandoned oil palm lands in Malaysia: A semi-automatic approach. Int. J. Remote Sens. 2016, 38, 432–449. [Google Scholar] [CrossRef]
- Ramdani, F. Recent expansion of oil palm plantation in the most eastern part of Indonesia: Feature extraction with polarimetric SAR. Int. J. Remote Sens. 2018, 40, 7371–7388. [Google Scholar] [CrossRef]
- Vicente-Serrano, S.M.; Aguilar, E.; Martínez, R.; Martín-Hernández, N.; Azorin-Molina, C.; Sanchez-Lorenzo, A.; El Kenawy, A.; Tomás-Burguera, M.; Moran-Tejeda, E.; López-Moreno, J.I.; et al. The complex influence of ENSO on droughts in Ecuador. Clim. Dyn. 2016, 48, 405–427. [Google Scholar] [CrossRef] [Green Version]
- Poveda, G.; Álvarez, D.M.; Rueda, Ó.A. Hydro-climatic variability over the Andes of Colombia associated with ENSO: A review of climatic processes and their impact on one of the Earth’s most important biodiversity hotspots. Clim. Dyn. 2010, 36, 2233–2249. [Google Scholar] [CrossRef]
- Fatin, M.N.; Razali, S.M.; Ahmad, A.A.; Shafri, Z.M.S.M. Oil palm dry season analysis based on moderate-resolution imaging spectroradiometer (MODIS) satellite indices. Int. J. Remote Sens. 2019, 40, 7663–7678. [Google Scholar] [CrossRef]
- Furumo, P.R.; Aide, T.M. Characterizing commercial oil palm expansion in Latin America: Land use change and trade. Environ. Res. Lett. 2017, 12, 024008. [Google Scholar] [CrossRef]
- Rival, L. The meanings of forest governance in Esmeraldas, Ecuador. Oxf. Dev. Stud. 2003, 31, 479–501. [Google Scholar] [CrossRef]
- Ortiz, S.Y.C.; Valencia, K.L.P.; Estacio, J.R. Presión-Estado-Respuesta en la gestión de las áreas protegidas de la provincia de Esmeraldas. Gestión Ambient. 2019, 17, 21–22. [Google Scholar]
- Movimiento Mundial por los Bosques Tropicales, El Amargo Fruto de la Palma Aceitera: Despojo y Deforestación. Movimiento Mundial por los Bosques Tropicales. 2001. Available online: http://wrm.org.uy/es/files/2013/04/El_amargo_fruto_de_la_palma_aceitera.pdf (accessed on 10 January 2021).
- USAID. Innovación Productiva en el Ecuador Aceite de Palma. Innov. Product. Ecuad. 2013, 4, 1689–1699. Available online: https://core.ac.uk/download/pdf/235988344.pdf (accessed on 10 January 2021).
- Ministerio de Agricultura y Ganadería. Cifras Agroproductivas. Available online: http://sipa.agricultura.gob.ec/index.php/cifras-agroproductivas (accessed on 5 January 2021).
- Provincia de Esmeraldas-Geografía del Ecuador Enciclopedia del Ecuador. Available online: http://www.enciclopediadelecuador.com/geografia-del-ecuador/provincia-de-esmeraldas/ (accessed on 5 January 2021).
- Funk, C.; Peterson, P.; Landsfeld, M.; Pedreros, D.; Verdin, J.; Shukla, S.; Husak, G.; Rowland, J.; Harrison, L.; Hoell, A.; et al. The climate hazards infrared precipitation with stations—A new environmental record for monitoring extremes. Sci. Data 2015, 2, 150066. [Google Scholar] [CrossRef] [PubMed] [Green Version]
- Provincia de Esmeraldas (Ecuador)-EcuRed. Available online: https://www.ecured.cu/Provincia_de_Esmeraldas_(Ecuador) (accessed on 6 January 2021).
- Erfanian, A.; Wang, G.; Fomenko, L. Unprecedented drought over tropical South America in 2016: Significantly under-predicted by tropical SST. Sci. Rep. 2017, 7, 5811. [Google Scholar] [CrossRef] [PubMed] [Green Version]
- Petrova, D.; Rodó, X.; Sippy, R.; Ballester, J.; Mejía, R.; Beltrán-Ayala, E.; Borbor-Cordova, M.J.; Vallejo, G.M.; Olmedo, A.J.; Stewart-Ibarra, A.M.; et al. The 2018–2019 weak El Niño: Predicting the risk of a dengue outbreak in Machala, Ecuador. Int. J. Clim. 2020, 41, 3813–3823. [Google Scholar] [CrossRef]
- MODIS Web. Available online: https://modis.gsfc.nasa.gov/data/dataprod/ (accessed on 5 January 2021).
- Mas, J.-F. Aplicaciones del sensor MODIS para el monitoreo del territorio. Educ. Divulg. 2011, 7, 2. [Google Scholar]
- Jönsson, P.; Eklundh, L. TIMESAT—A program for analyzing time-series of satellite sensor data. Comput. Geosci. 2004, 30, 833–845. [Google Scholar] [CrossRef] [Green Version]
- Htitiou, A.; Boudhar, A.; Lebrini, Y.; Hadria, R.; Lionboui, H.; Benabdelouahab, T. A comparative analysis of different phenological information retrieved from Sentinel-2 time series images to improve crop classification: A machine learning approach. Geocarto Int. 2020, 37, 1426–1449. [Google Scholar] [CrossRef]
- Miettinen, J.; Liew, S.C. Separability of insular Southeast Asian woody plantation species in the 50 m resolution ALOS PALSAR mosaic product. Remote Sens. Lett. 2010, 2, 299–307. [Google Scholar] [CrossRef]
- Shimada, M.; Itoh, T.; Motooka, T.; Watanabe, M.; Shiraishi, T.; Thapa, R.; Lucas, R. New global forest/non-forest maps from ALOS PALSAR data (2007–2010). Remote Sens. Environ. 2014, 155, 13–31. [Google Scholar] [CrossRef]
- Karlsen, S.R.; Tolvanen, A.; Kubin, E.; Poikolainen, J.; HøGda, K.A.; Johansen, B.; Danks, F.S.; Aspholm, P.; Wielgolaski, F.E.; Makarova, O. MODIS-NDVI-based mapping of the length of the growing season in northern Fennoscandia. Int. J. Appl. Earth Obs. Geoinf. 2008, 10, 253–266. [Google Scholar] [CrossRef]
- Garroutte, E.L.; Hansen, A.J.; Lawrence, R.L. Using NDVI and EVI to Map Spatiotemporal Variation in the Biomass and Quality of Forage for Migratory Elk in the Greater Yellowstone Ecosystem. Remote Sens. 2016, 8, 404. [Google Scholar] [CrossRef] [Green Version]
- Lewińska, K.E.; Ivits, E.; Schardt, M.; Zebisch, M. Alpine Forest Drought Monitoring in South Tyrol: PCA Based Synergy between scPDSI Data and MODIS Derived NDVI and NDII7 Time Series. Remote Sens. 2016, 8, 639. [Google Scholar] [CrossRef] [Green Version]
- Bojanowski, J.; Kowalik, W.; Bochenek, Z. Noise reduction of NDVI time-series: A robust method based on Savitzky-Golay filter. Rocz. Geomatyki 2009, 7, 13–21. [Google Scholar]
- Wen, G.; Marshak, A.; Song, W.; Knyazikhin, Y.; Mõttus, M.; Wu, D. A Relationship Between Blue and Near-IR Global Spectral Reflectance and the Response of Global Average Reflectance to Change in Cloud Cover Observed From EPIC. Earth Space Sci. 2019, 6, 1416–1429. [Google Scholar] [CrossRef]
- Argenti, F.; Lapini, A.; Bianchi, T.; Alparone, L. A Tutorial on Speckle Reduction in Synthetic Aperture Radar Images. IEEE Geosci. Remote Sens. Mag. 2013, 1, 6–35. [Google Scholar] [CrossRef] [Green Version]
- SNAP–STEP. Available online: http://step.esa.int/main/toolboxes/snap/ (accessed on 8 January 2021).
- Lopes, M.; Frison, P.-L.; Crowson, M.; Warren-Thomas, E.; Hariyadi, B.; Kartika, W.D.; Agus, F.; Hamer, K.C.; Stringer, L.; Hill, J.K.; et al. Improving the accuracy of land cover classification in cloud persistent areas using optical and radar satellite image time series. Methods Ecol. Evol. 2020, 11, 532–541. [Google Scholar] [CrossRef]
- Kempeneers, P.; Sedano, F.; Seebach, L.; Strobl, P.; San-Miguel-Ayanz, J. Data Fusion of Different Spatial Resolution Remote Sensing Images Applied to Forest-Type Mapping. IEEE Trans. Geosci. Remote Sens. 2011, 49, 4977–4986. [Google Scholar] [CrossRef]
- Orynbaikyzy, A.; Gessner, U.; Conrad, C. Crop type classification using a combination of optical and radar remote sensing data: A review. Int. J. Remote Sens. 2019, 40, 6553–6595. [Google Scholar] [CrossRef]
- Torbick, N.; Salas, W.; Xiao, X.; Ingraham, P.; Fearon, M.; Biradar, C.; Zhao, D.; Liu, Y.; Li, P.; Zhao, Y. Integrating SAR and optical imagery for regional mapping of paddy rice attributes in the Poyang Lake Watershed, China. Can. J. Remote Sens. 2011, 37, 17–26. [Google Scholar] [CrossRef] [Green Version]
- Ghazaryan, G.; Dubovyk, O.; Löw, F.; Lavreniuk, M.; Kolotii, A.; Schellberg, J.; Kussul, N. A rule-based approach for crop identification using multi-temporal and multi-sensor phenological metrics. Eur. J. Remote Sens. 2018, 51, 511–524, Correction in Eur. J. Remote Sens. 2018, 51. [Google Scholar] [CrossRef]
- Zhang, X.; Wu, B.; Ponce-Campos, G.E.; Zhang, M.; Chang, S.; Tian, F. Mapping up-to-Date Paddy Rice Extent at 10 M Resolution in China through the Integration of Optical and Synthetic Aperture Radar Images. Remote Sens. 2018, 10, 1200. [Google Scholar] [CrossRef] [Green Version]
- Laurin, G.V.; Liesenberg, V.; Chen, Q.; Guerriero, L.; Del Frate, F.; Bartolini, A.; Coomes, D.; Wilebore, B.; Lindsell, J.; Valentini, R. Optical and SAR sensor synergies for forest and land cover mapping in a tropical site in West Africa. Int. J. Appl. Earth Obs. Geoinf. ITC J. 2013, 21, 7–16. [Google Scholar] [CrossRef]
- Kaplan, G.; Avdan, Z.Y.; Avdan, U. Mapping and Monitoring Wetland Dynamics Using Thermal, Optical, and SAR Remote Sensing Data. Wetl. Manag. Assess. Risk Sustain. Solut. 2019, 87, 88–89. [Google Scholar] [CrossRef] [Green Version]
- Zhang, G.; Xiao, X.; Dong, J.; Kou, W.; Jin, C.; Qin, Y.; Zhou, Y.; Wang, J.; Menarguez, M.A.; Biradar, C. Mapping paddy rice planting areas through time series analysis of MODIS land surface temperature and vegetation index data. ISPRS J. Photogramm. Remote Sens. 2015, 106, 157–171. [Google Scholar] [CrossRef] [PubMed] [Green Version]
- Xiao, H.; Weng, Q. The impact of land use and land cover changes on land surface temperature in a karst area of China. J. Environ. Manag. 2007, 85, 245–257. [Google Scholar] [CrossRef] [PubMed]
- Gislason, P.O.; Benediktsson, J.A.; Sveinsson, J.R. Random Forests for land cover classification. Pattern Recognit. Lett. 2006, 27, 294–300. [Google Scholar] [CrossRef]
- Pal, M. Random forest classifier for remote sensing classification. Int. J. Remote Sens. 2005, 26, 217–222. [Google Scholar] [CrossRef]
- Sheykhmousa, M.; Mahdianpari, M.; Ghanbari, H.; Mohammadimanesh, F.; Ghamisi, P.; Homayouni, S. Support Vector Machine Versus Random Forest for Remote Sensing Image Classification: A Meta-Analysis and Systematic Review. IEEE J. Sel. Top. Appl. Earth Obs. Remote Sens. 2020, 13, 6308–6325. [Google Scholar] [CrossRef]
- Ministerio de Agricultura y Ganadería. Mapa de Zonas Homogéneas de Accesibilidad; Ministerio de Agricultura y Ganadería: Carchi, Ecuador, 2015; p. 81.
- Chabalala, Y.; Adam, E.; Ali, K.A. Machine Learning Classification of Fused Sentinel-1 and Sentinel-2 Image Data towards Mapping Fruit Plantations in Highly Heterogenous Landscapes. Remote Sens. 2022, 14, 2621. [Google Scholar] [CrossRef]
- Randazzo, G.; Cascio, M.; Fontana, M.; Gregorio, F.; Lanza, S.; Muzirafuti, A. Mapping of Sicilian Pocket Beaches Land Use/Land Cover with Sentinel-2 Imagery: A Case Study of Messina Province. Land 2021, 10, 678. [Google Scholar] [CrossRef]
- Foody, G.M. Status of land cover classification accuracy assessment. Remote Sens. Environ. 2002, 80, 185–201. [Google Scholar] [CrossRef]
- Landis, J.R.; Koch, G.G. The Measurement of Observer Agreement for Categorical Data. Biometrics 1977, 33, 159–174. [Google Scholar] [CrossRef] [PubMed] [Green Version]
- Foody, G.M. Explaining the unsuitability of the kappa coefficient in the assessment and comparison of the accuracy of thematic maps obtained by image classification. Remote Sens. Environ. 2020, 239, 111630. [Google Scholar] [CrossRef]
- Kamiran, N.; Sarker, M.L.R. Exploring the Potential of High Resolution Remote Sensing Data for Mapping Vegetation and the Age Groups of Oil Palm Plantation. IOP Conf. Ser. Earth Environ. Sci. 2014, 18, 12181. [Google Scholar] [CrossRef] [Green Version]
- Santos, C.; Messina, J.P. Multi-Sensor Data Fusion for Modeling African Palm in the Ecuadorian Amazon. Photogramm. Eng. Remote Sens. 2008, 74, 711–723. [Google Scholar] [CrossRef]
- Sharma, L.D.; Kumar, M.; Gupta, J.K.; Rana, M.S.; Dangwal, V.S.; Dhar, G.M. MODIS Land Surface Temperature Products Users’ Guide. Indian J. Chem. Technol. 2001, 8, 169–175. [Google Scholar]
- Carranza, E.J.M.; Laborte, A.G. Random forest predictive modeling of mineral prospectivity with small number of prospects and data with missing values in Abra (Philippines). Comput. Geosci. 2015, 74, 60–70. [Google Scholar] [CrossRef]
- Hais, M.; Kučera, T. The influence of topography on the forest surface temperature retrieved from Landsat TM, ETM + and ASTER thermal channels. ISPRS J. Photogramm. Remote Sens. 2009, 64, 585–591. [Google Scholar] [CrossRef]
- Sano, E.E.; Ferreira, L.G.; Huete, A.R. Synthetic Aperture Radar (L band) and Optical Vegetation Indices for Discriminating the Brazilian Savanna Physiognomies: A Comparative Analysis. Earth Interact. 2005, 9, 1–15. [Google Scholar] [CrossRef]
- Olofsson, P.; Foody, G.M.; Stehman, S.V.; Woodcock, C.E. Making better use of accuracy data in land change studies: Estimating accuracy and area and quantifying uncertainty using stratified estimation. Remote Sens. Environ. 2013, 129, 122–131. [Google Scholar] [CrossRef]

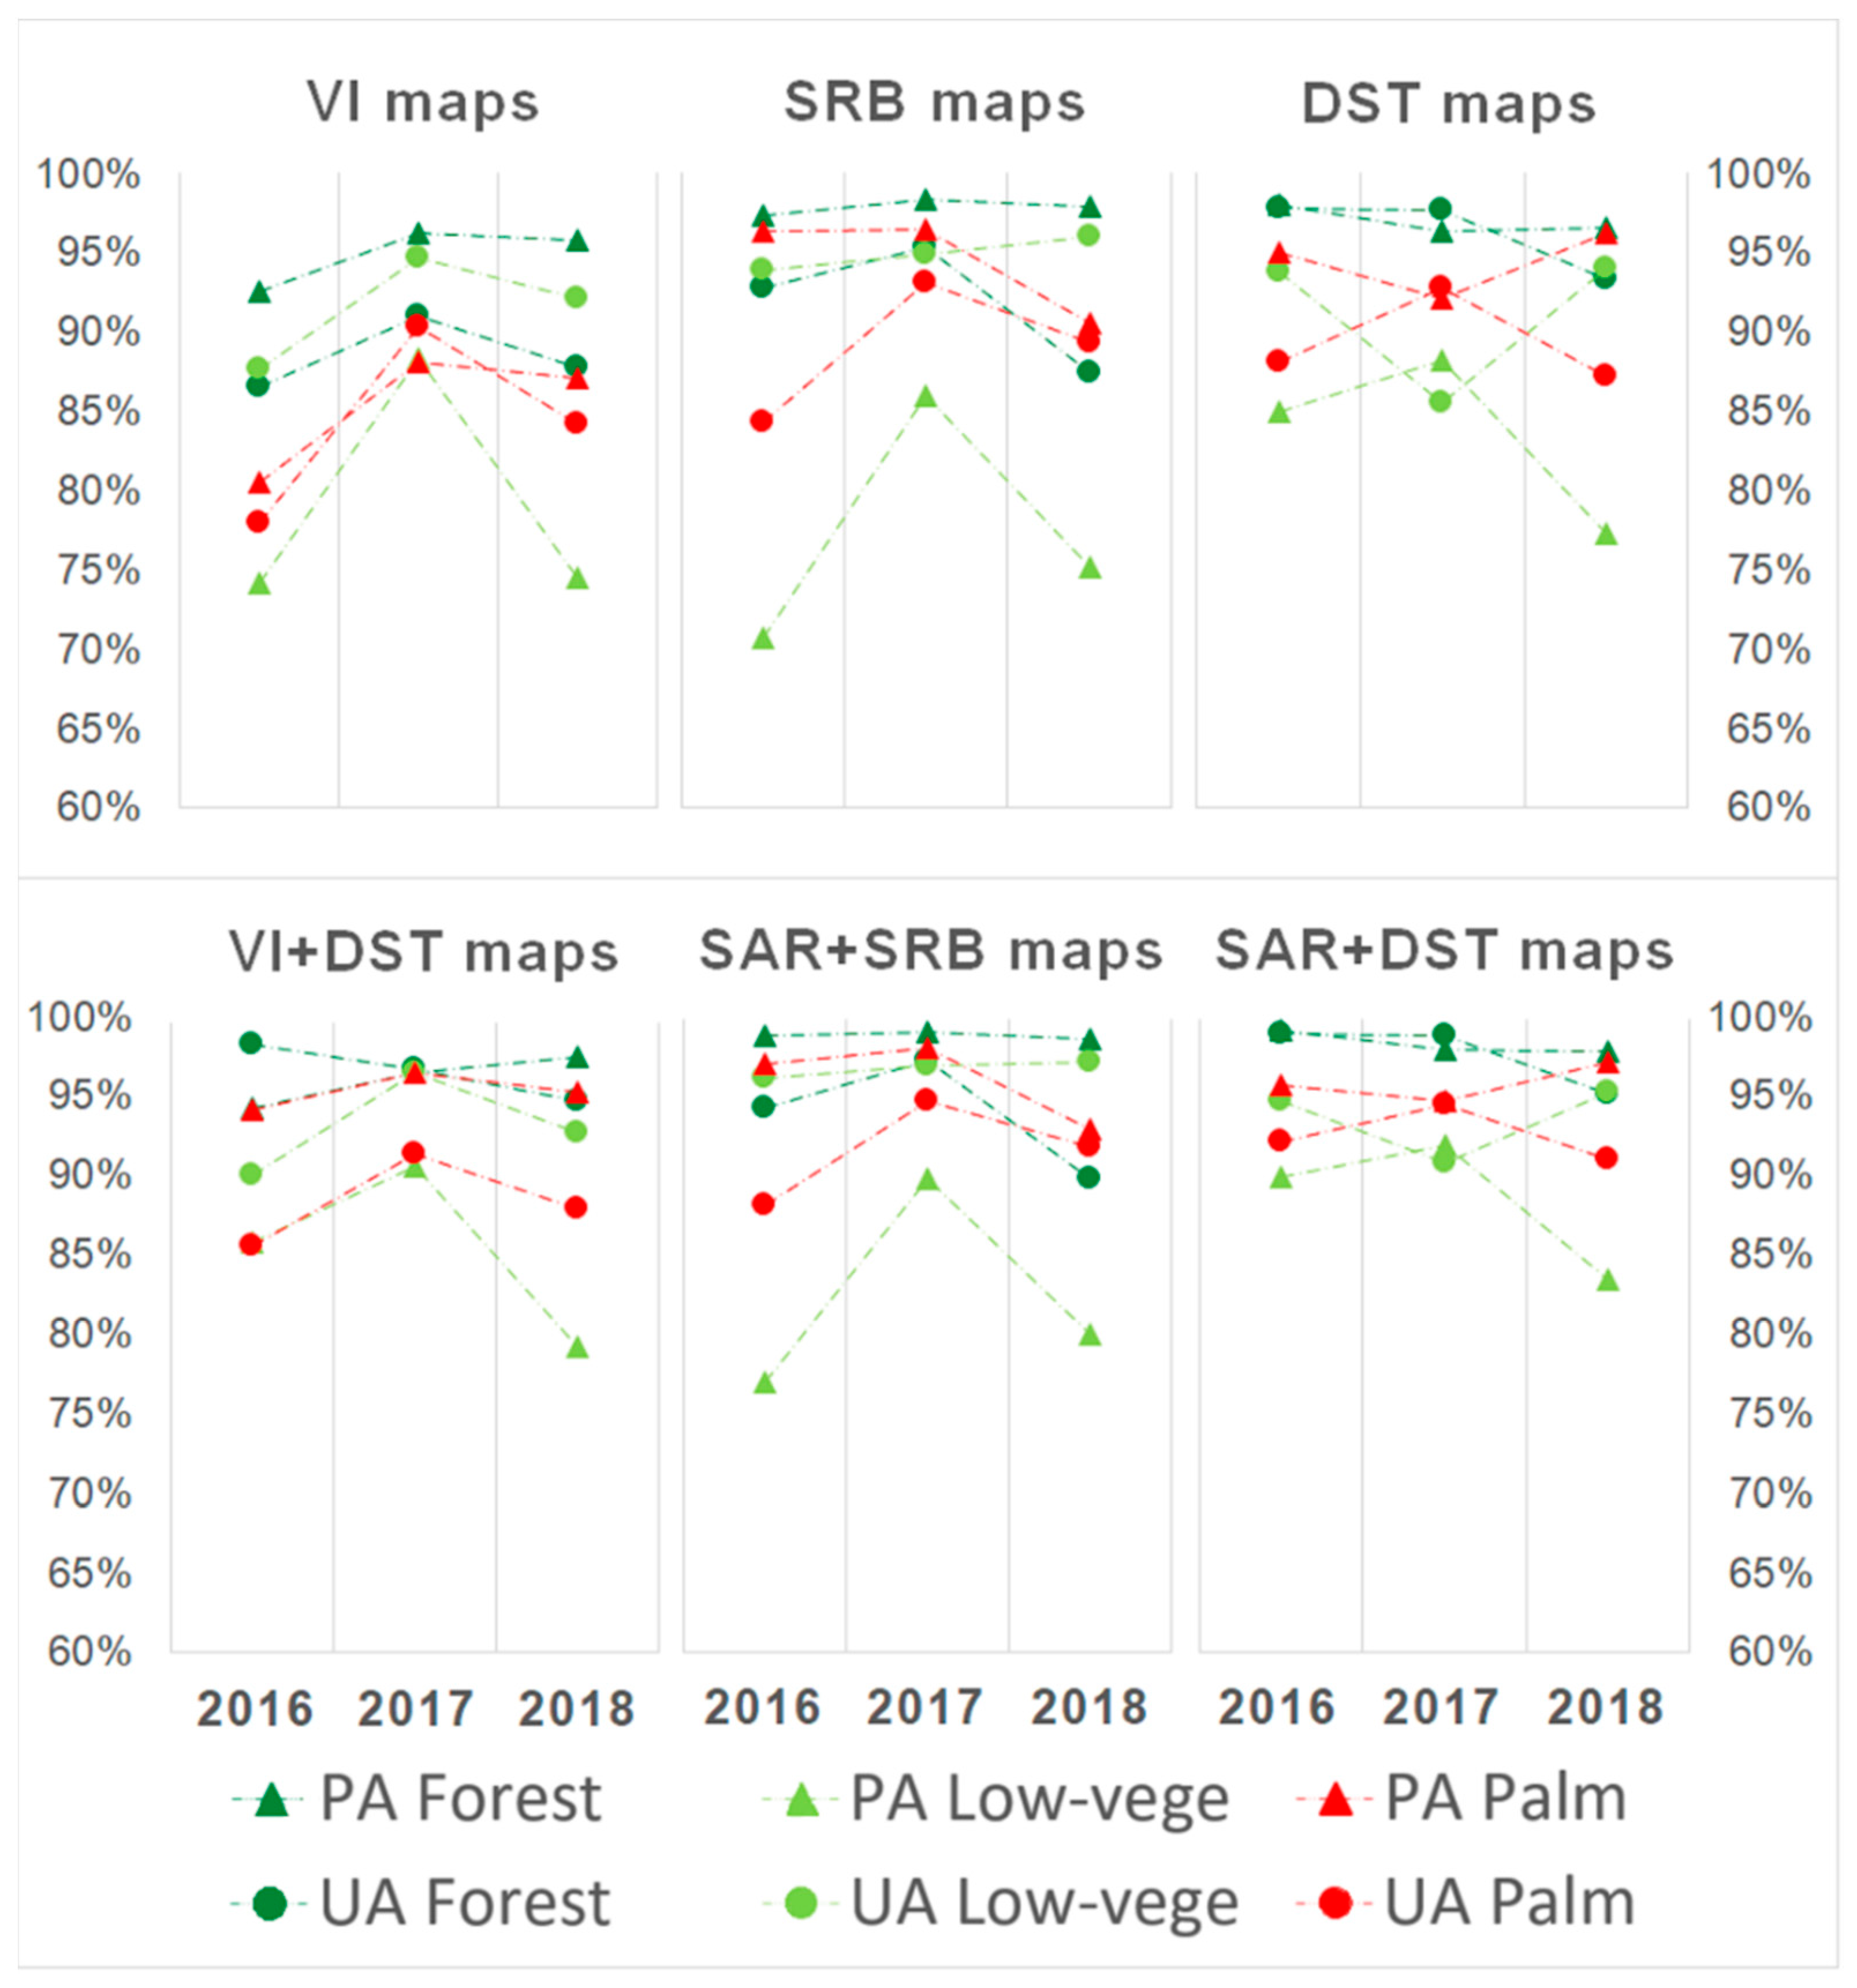
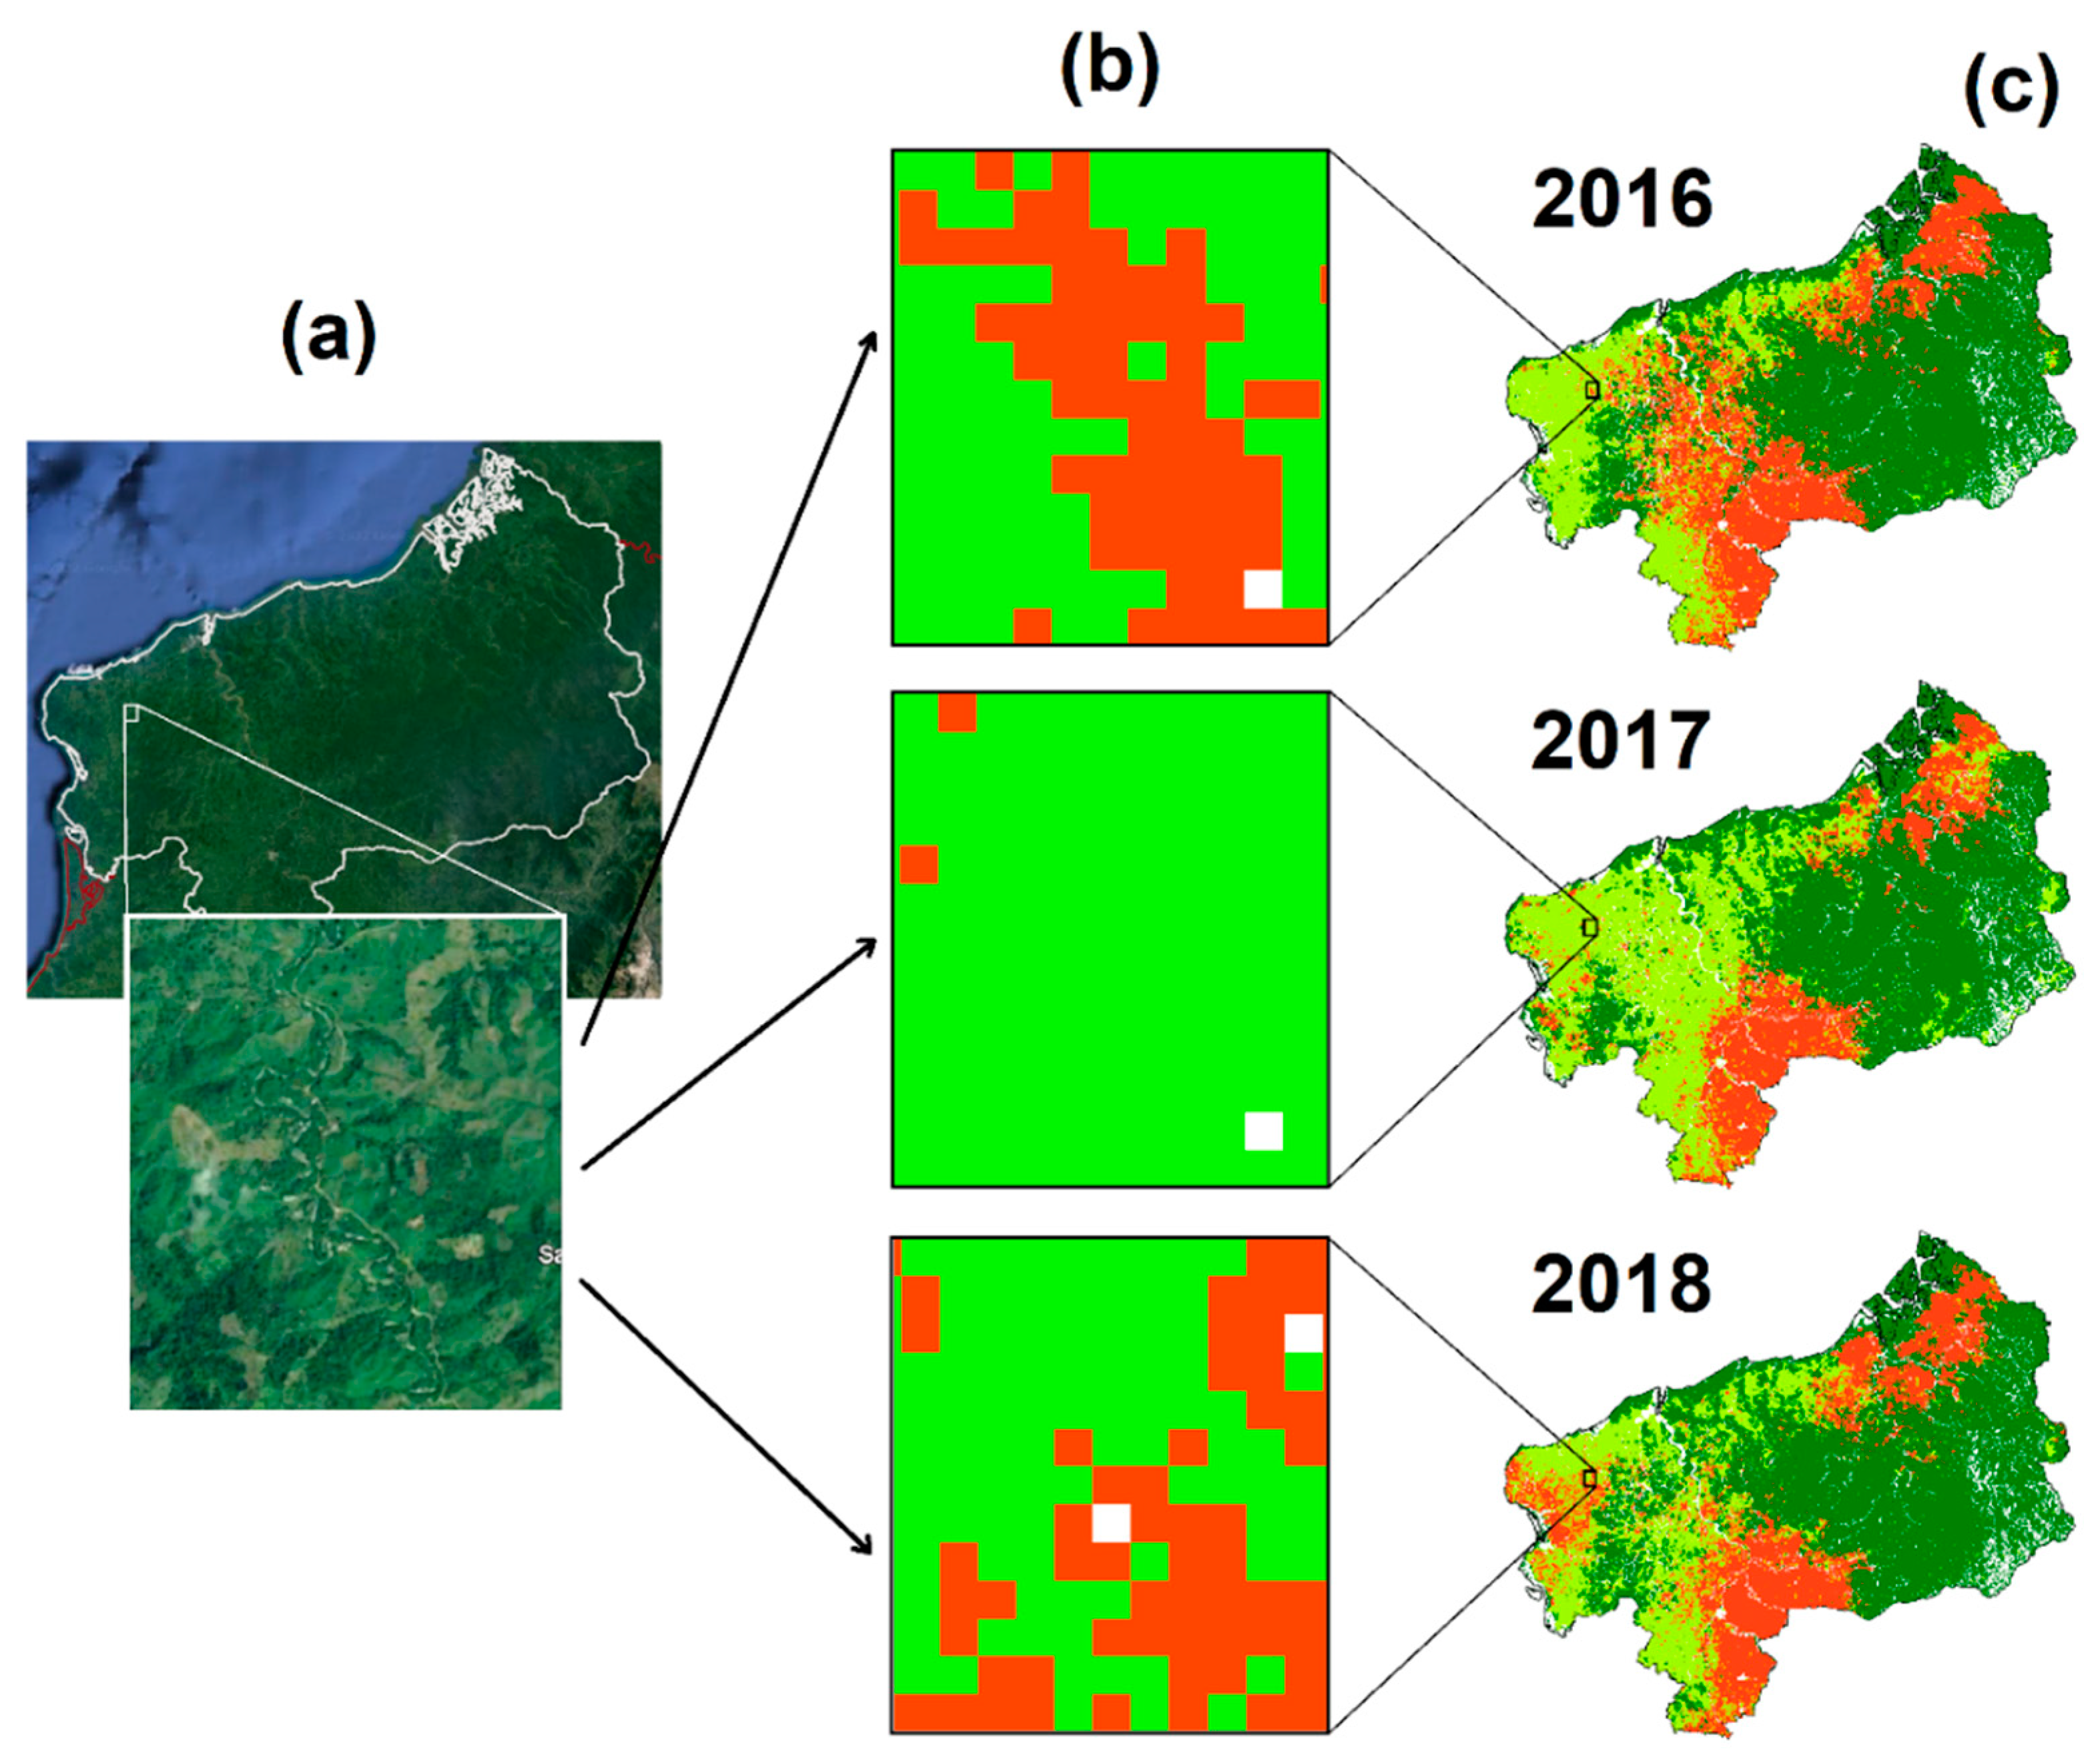
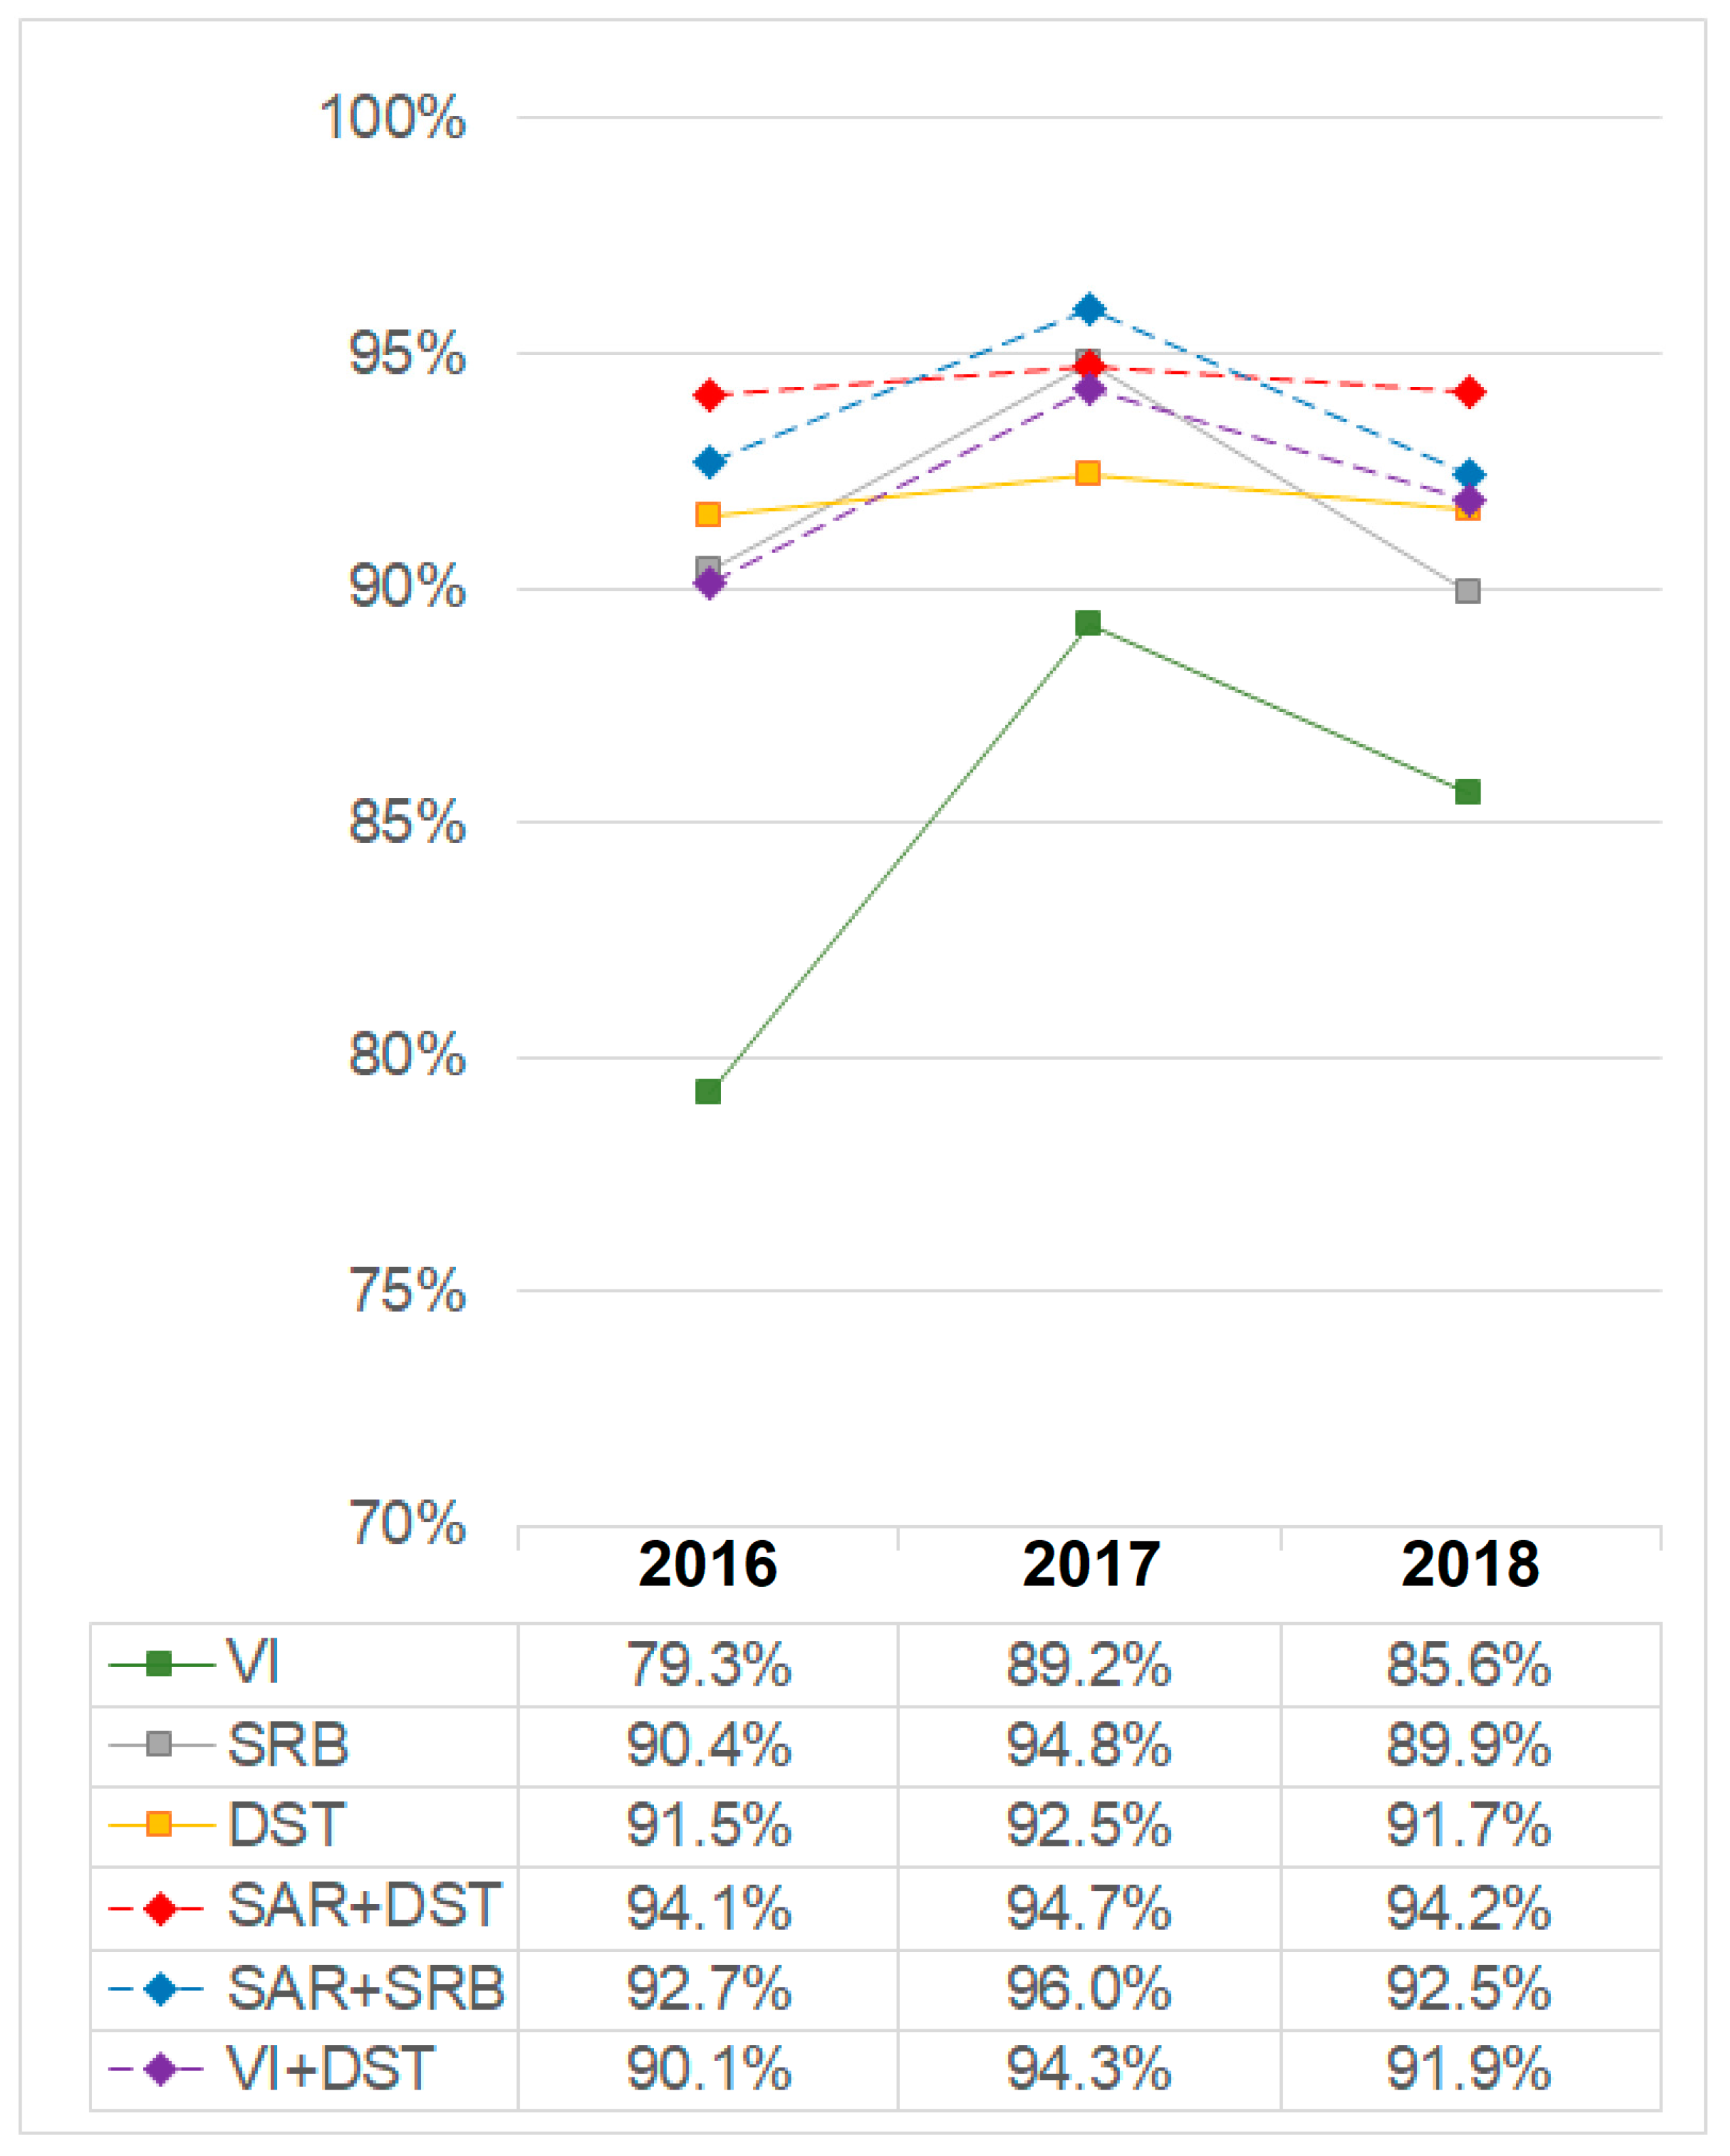
| Sensor | Product | EM Region | Image Characteristics | Spatial and Temporal Resolution | # Scenes per Year | Acquisition Time (Julian Days) |
|---|---|---|---|---|---|---|
| MODIS Terra | MOD13Q1 | Optical | Vegetation Index (VI) | 250 m—16 days | 23 | 001,017,033,049,065,081,097,113,129,145,161,177,193,209,225,241,257,273,289,305,321,337,353 |
| MOD09A1 | Optical | Land Surface Reflectance (LSR) | 500 m—8 days | 46 | 001,009,017,025,033,041,049,057,065,073,081,089,097,105,113,121,129,137,145,153,161,169,177,185,193,201,209,217,225,233,241,249,257,265,273,281,289,297,305,313,321,329,337,345,353,361 | |
| MOD11A2 | Thermal | Land Surface Temperature and Emissivity (LST) | 1 km—8 days | 46 | ||
| MODIS Aqua | MYD13Q1 | Optical | VI | 250 m—16 days | 23 | 009,025,041,057,073,089,105,121,137,153,169,185,201,217,233,249,265,281,297,313,329,345,361 |
| MYD09A1 | Optical | LSR | 500 m—8 days | 46 | 001,009,017,025,033,041,049,057,065,073,081,089,097,105,113,121,129,137,145,153,161,169,177,185,193,201,209,217,225,233,241,249,257,265,273,281,289,297,305,313,321,329,337,345,353,361 | |
| MYD11A2 | Thermal | LST | 1 km—8 days | 46 | ||
| PALSAR 2 | FNF | Microwave | Dual polarization (HH and HV) | 25 m—1 per year | 1 | Ranging from 180 to 295 |
| OA (%) | Kappa | PA Forest (%) | UA Forest (%) | PA Low Vegetation (%) | UA Low Vegetation (%) | PA Palm (%) | UA Palm (%) | |||
|---|---|---|---|---|---|---|---|---|---|---|
| Optical, Thermal, and Microwave Feature Maps | VI maps | 2016 | 84.1 | 0.75 | 92.6 | 86.6 | 74.2 | 87.7 | 80.6 | 77.9 |
| 2017 | 91.7 | 0.87 | 96.2 | 91 | 88.4 | 94.7 | 88.1 | 90.3 | ||
| 2018 | 87.6 | 0.81 | 95.8 | 87.8 | 74.5 | 92.1 | 87 | 84.2 | ||
| PHENO maps | 2016 | 67.2 | 0.49 | 83.1 | 75.1 | 35.7 | 75.6 | 71.4 | 54.8 | |
| 2017 | 88 | 0.81 | 95.3 | 85 | 86.4 | 95 | 79.2 | 87.3 | ||
| 2018 | 70.8 | 0.54 | 87.3 | 87.8 | 74.5 | 92.1 | 87.1 | 84.2 | ||
| SRB maps | 2016 | 90.1 | 0.85 | 97.3 | 92.7 | 70.7 | 93.9 | 96.4 | 84.4 | |
| 2017 | 94.6 | 0.92 | 98.4 | 95.4 | 86 | 94.9 | 96.5 | 93.1 | ||
| 2018 | 89.8 | 0.84 | 97.9 | 87.4 | 75.2 | 96 | 90.5 | 89.3 | ||
| DST maps | 2016 | 93.7 | 0.9 | 98 | 97.8 | 84.9 | 93.7 | 94.9 | 88.1 | |
| 2017 | 92.9 | 0.89 | 96.3 | 97.6 | 88.2 | 85.5 | 92.1 | 92.8 | ||
| 2018 | 91.4 | 0.87 | 96.6 | 93.3 | 77.3 | 94 | 96.2 | 87.2 | ||
| NST maps | 2016 | 87.9 | 0.78 | 85.9 | 98.6 | 75.4 | 86.4 | 94.8 | 86.3 | |
| 2017 | 82.8 | 0.74 | 77.7 | 92.4 | 74.6 | 64.7 | 96 | 87.6 | ||
| 2018 | 76.5 | 0.65 | 81.7 | 66.9 | 56.6 | 77.8 | 90.4 | 83.6 | ||
| SAR maps | 2016 | 87.1 | 0.8 | 96.8 | 90.9 | 71.3 | 86.6 | 86.9 | 82 | |
| 2017 | 87.1 | 0.8 | 97.2 | 92.1 | 74.1 | 83.2 | 83.8 | 82.7 | ||
| 2018 | 84.8 | 0.77 | 93.7 | 90.8 | 70.7 | 79.8 | 84.2 | 80 | ||
| Data-Fusion Combination Maps | SAR + VI maps | 2016 | 90.8 | 0.86 | 98.3 | 92.9 | 78.5 | 92.8 | 90.4 | 86.2 |
| 2017 | 95.3 | 0.93 | 98.6 | 95 | 90.9 | 96.9 | 93.9 | 93.9 | ||
| 2018 | 93.1 | 0.89 | 97.9 | 94.6 | 85.7 | 93.3 | 92.6 | 90.9 | ||
| SAR + PHENO maps | 2016 | 81.1 | 0.7 | 98.5 | 83.4 | 45.8 | 98.1 | 86.4 | 72.2 | |
| 2017 | 87.9 | 0.81 | 99.4 | 93.3 | 89.9 | 98 | 92.5 | 94.5 | ||
| 2018 | 86.8 | 0.79 | 98.1 | 85.7 | 65.5 | 95.4 | 89 | 83.8 | ||
| SAR + SRB maps | 2016 | 92.7 | 0.89 | 98.9 | 94.3 | 77 | 96.2 | 97.2 | 88.2 | |
| 2017 | 96.5 | 0.95 | 99.2 | 89.9 | 98.2 | 97.3 | 97.1 | 94.8 | ||
| 2018 | 92.1 | 0.88 | 98.7 | 89.9 | 80 | 97.3 | 93 | 91.9 | ||
| SAR + DST maps | 2016 | 95.8 | 0.94 | 99.3 | 99 | 90 | 94.7 | 95.9 | 92.3 | |
| 2017 | 95.5 | 0.93 | 98 | 98.9 | 92 | 90.9 | 94.8 | 94.6 | ||
| 2018 | 93.9 | 0.91 | 97.9 | 95.2 | 83.5 | 95.3 | 97.3 | 91.1 | ||
| VI + DST maps | 2016 | 92.3 | 0.88 | 94.5 | 98.6 | 86 | 90.3 | 94.4 | 85.8 | |
| 2017 | 95.3 | 0.93 | 96.9 | 97 | 90.8 | 96.8 | 96.8 | 91.7 | ||
| 2018 | 92.3 | 0.88 | 97.8 | 95 | 79.4 | 93 | 95.6 | 88.2 |
Publisher’s Note: MDPI stays neutral with regard to jurisdictional claims in published maps and institutional affiliations. |
© 2022 by the authors. Licensee MDPI, Basel, Switzerland. This article is an open access article distributed under the terms and conditions of the Creative Commons Attribution (CC BY) license (https://creativecommons.org/licenses/by/4.0/).
Share and Cite
Troya, F.; Bernardino, P.N.; Somers, B. Inter-Annual Climate Variability Impact on Oil Palm Mapping. Remote Sens. 2022, 14, 3104. https://doi.org/10.3390/rs14133104
Troya F, Bernardino PN, Somers B. Inter-Annual Climate Variability Impact on Oil Palm Mapping. Remote Sensing. 2022; 14(13):3104. https://doi.org/10.3390/rs14133104
Chicago/Turabian StyleTroya, Fernando, Paulo N. Bernardino, and Ben Somers. 2022. "Inter-Annual Climate Variability Impact on Oil Palm Mapping" Remote Sensing 14, no. 13: 3104. https://doi.org/10.3390/rs14133104
APA StyleTroya, F., Bernardino, P. N., & Somers, B. (2022). Inter-Annual Climate Variability Impact on Oil Palm Mapping. Remote Sensing, 14(13), 3104. https://doi.org/10.3390/rs14133104


