Technical Note

Evaluation of Field Applicability of High-Speed 3D Digital Image Correlation for Shock Vibration Measurement in Underground Mining

Department of Geotechnical Engineering Research, Korea Institute of Civil Engineering and Building Technology (KICT), Goyang-si 10223, Korea
*
Author to whom correspondence should be addressed.
Remote Sens. 2022, 14(13), 3133; https://doi.org/10.3390/rs14133133
Submission received: 12 June 2022 / Revised: 23 June 2022 / Accepted: 24 June 2022 / Published: 29 June 2022

Abstract

:
When combined with high-speed photography technology, the digital image correlation (DIC) method provides an excellent photographic image processing capability that can be used to convert the evolving full-field surface properties of structures to sets of two-dimensional (2D) or three-dimensional (3D) coordinate values. In this study, the applicability of the DIC method and high-speed cameras in underground mining was investigated by measuring the displacement and vibration of rock pillars caused by blasting. This technique is used extensively in engineering and is increasingly being applied to new fields. As a result of comparing the DIC results for blast vibration with the measured values of the contact sensor through field tests, the maximum displacement and vibration speed were found to be 86% and 93% accurate, respectively. In addition, the obtained values appeared similar to those predicted through numerical analysis. Field test results indicate that both methods yielded similar results. Therefore, it is concluded that it is feasible to use the DIC and high-speed camera to measure ground displacements and vibrations from blasting in underground mining. In addition, the system conditions required for blast vibration measurement were considered by comparing the accuracy with the existing measurement methods.

1. Introduction

With the recent advancements in computer and optical technologies, research is increasingly being conducted on the use of the digital image correlation (DIC) method in various engineering fields. DIC is a technique used to numerically express the change in an object by comparing the image patterns before and after the change in the object and, hence, determine the correlation between the deformed and undeformed images of the object. The greatest advantage of the displacement measurement method using the DIC technique is that it is possible to measure the displacement of a point or a wide surface with a noncontact method using cameras, without the need to install a measurement sensor at the measurement location [1]. In addition, high-precision measurement can be achieved even in an environment wherein it is difficult to install measurement gauges provided that it is possible to acquire images. Conventionally, this DIC technique was limited to material experiments and deformation analysis of machinery. However, its use has gradually been extended to many other fields, including civil engineering.
Over the past decade, DIC has grown as an area of research for measuring deformation, shape, and motion [1,2,3,4]. In the field of mechanical performance testing of new materials and structures, DIC is a universal technique and has excellent applicability [5,6,7]. In addition, it is also a novel means of obtaining crack near-field measurement [5,6] and model updating [7]. In the field of civil engineering, DIC was applied to measure the cracking process on concrete and the bending behavior of beams [8,9,10]. In addition, the behavior of the concrete wall was measured through a large-scale model experiment [10,11].
If the shape of the measurement target is complex or the measurement range is large, it is not possible to obtain all data of the desired ROI [12]. In many cases, it is difficult to achieve the required accuracy, and a high-resolution camera is often required [13]. In recent years, with the advancement of high-speed camera performance, such as the achieving of maximum frame rates at full resolution, an increasing number of structural dynamic characteristics can be measured using the high-speed DIC (HS-DIC) method [14,15,16,17,18]. However, the cost of a high-speed camera is usually in excess of 10,000 USD, and this measurement often requires two or more cameras to capture the full-field vibration measurement through the stereo vision method. Due to the costliness of such a high-speed camera, research on a stereo DIC system using a single camera is in progress. When using a single camera, there is no time synchronization error due to triggers between cameras, and there are advantages such as cost-effectiveness and miniaturization, but this approach was found to be effective against micro-deformation [19,20,21,22,23].
Against this background, the DIC method using a high-speed camera is still effective for vibration measurement, and new research is being attempted to apply it to the blasting field using a high-speed camera and DIC. For instance, the DIC technique was employed in laboratory experiments for the dynamic response analysis of surrounding rocks based on the blast hole stemming condition [14]. Xu et al. investigated the crack propagation process in cylindrical concrete specimens subjected to blast loads with a pair of high-speed stereo cameras to analyze the crack propagation characteristics using a 3D DIC technique [24]. In addition, studies analyzing the fracture behavior of brittle rocks through DIC technology and indoor experiments were actively conducted [25,26,27]. Most of the studies that analyzed crack propagation or behavioral characteristics during rock fracture using DIC were conducted through indoor experiments. Some studies have also shown the applicability of vibration measurement by shock waves. A commercial high-speed 3D-DIC system that has been developed with collaboration from the United States Air Force Research Labs allows for an almost limitless measurement point density unseen before in vibration measurements [28]. An ongoing study into the feasibility of DIC vibration measurement was conducted by the Structural Sciences Center of the Air Force Research labs [28,29,30]. A successful modal survey of a lightly damped, clamped–clamped metallic structure was also demonstrated [14]. Measurements of random nonlinear displacement and strain responses of a clamped thin panel subjected to Mach 2 turbulent flow and a shock wave impingement were also achieved. Through these results, the possibility of field applications was suggested.
However, there are still few research cases that analyzed the applicability of using stereo cameras and DICs in actual mine tunnels. Blasting work for room and pillar mining, which is a method used for underground coal mining, may cause deformation and destruction of rock pillars near mining tunnels. This subsequently results in the collapse of mining cavities and protruding rock pillars. In this study, a DIC technique was adopted, and its performance was compared with that of a blasting seismograph for underground mining using the measurement data of displacement and vibration of the rock pillar due to blasting. The conventional measurement method can be insufficient to monitor the stability of the mining tunnel wall or rock pillars due to blasting with the point measurement method. However, if the entire mining tunnel wall can be measured on a plane basis using the image taken with the camera and the DIC technique, the stability of the entire tunnel walls due to blasting can be monitored. This paper contains the results of performing basic experiments to measure mining tunnel monitoring from point to plane, considering the application of technology in the future. Therefore, this study evaluated the feasibility of the DIC technique using a high-speed camera for a noncontact measurement approach to measure blast-induced displacements/vibrations.

2. Methodology

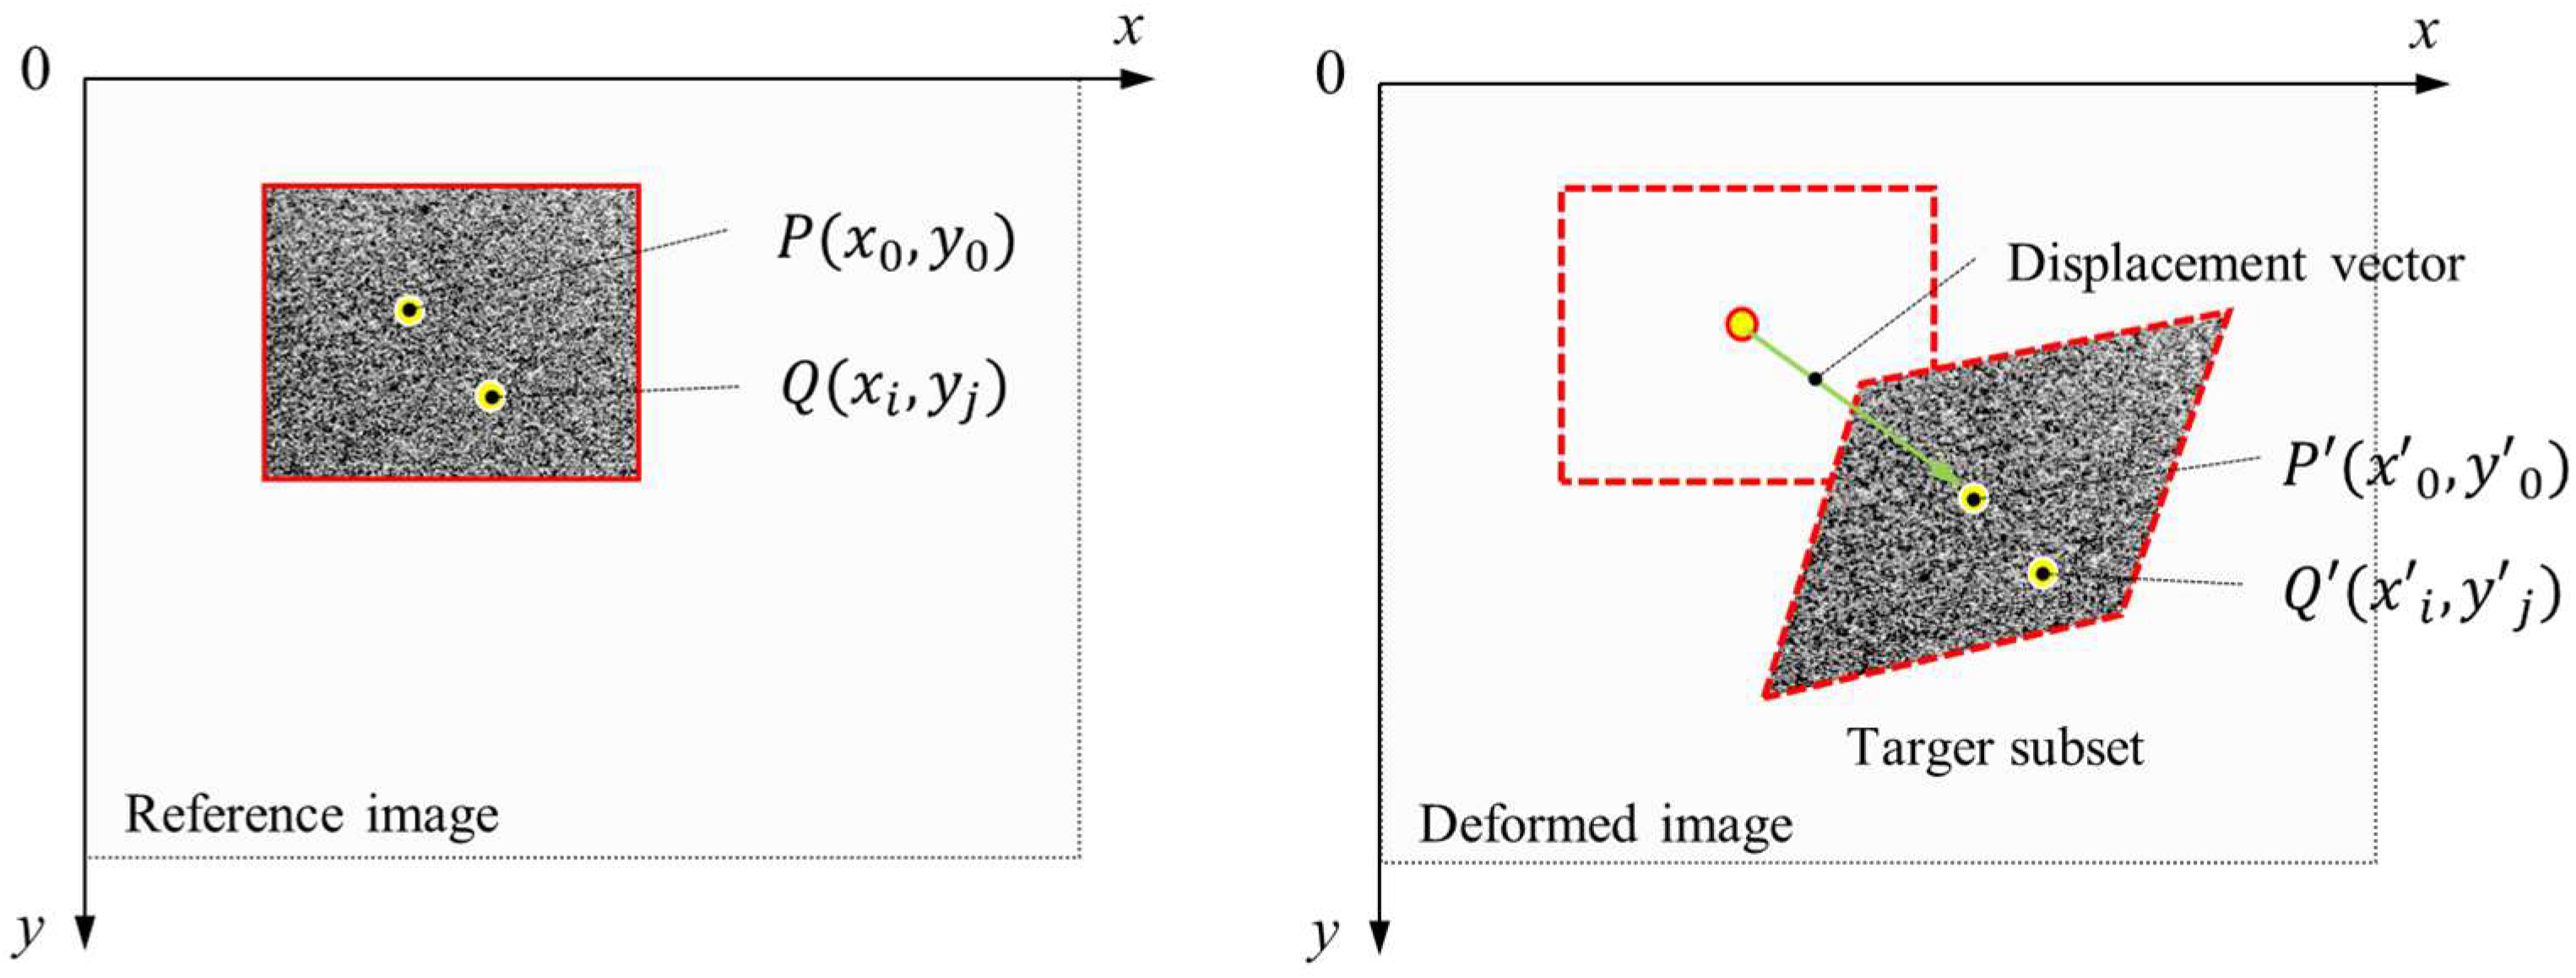
2.1. Overview of DIC Technique

DIC is a technique that can measure the displacement and strain of an entire structure by comparing images of the structure or specimen before and after its deformation (Figure 1). Sutton et al. [1] measured the deformation of a specimen with a camera and digitized it to measure the strain of the specimen to determine the physical properties of the material. Black patterns on a white background are commonly used to make it easier to recognize movement paths as images. The movement paths can then be identified by comparing the pixels of different images obtained using a fixed camera for DIC measurements.
The general DIC calculation is based primarily on the sum-of-squared differences (SSD) criterion, as expressed in Equation (1), and the calculation is performed by applying the change in the brightness of the surroundings and resolution of local patterns on the surface. In this study, it was used to calculate the distance traveled by the image pattern (facet) before deformation with respect to the local part of the region to be analyzed.
C S S D = [ g ( x i , y i ) f ( x i , y i ) ] 2 ,
where C S S D is the correlation coefficient, g is the grayscale value of the transformed image, f is the grayscale value of the reference image, x i and y i are the pixel coordinates of the transformed image, and x i and y i are the pixel coordinate values of the reference image. Sutton et al. [1] improved the DIC technique and investigated a new method for increasing the measurement accuracy to obtain subpixel accuracy. Subpixel precision measurements play an important role in the development of the DIC technique. Chao and Sutton [31] developed a 3D-DIC system that can be applied to general structural experiments using a stereo vision system and the DIC technique. The 3D-DIC system can measure both the in-plane and the out-of-plane displacements of specimens or structures, thereby extending expanding the application range of the DIC technique to general physical tests.

2.2. Numerical Simulation
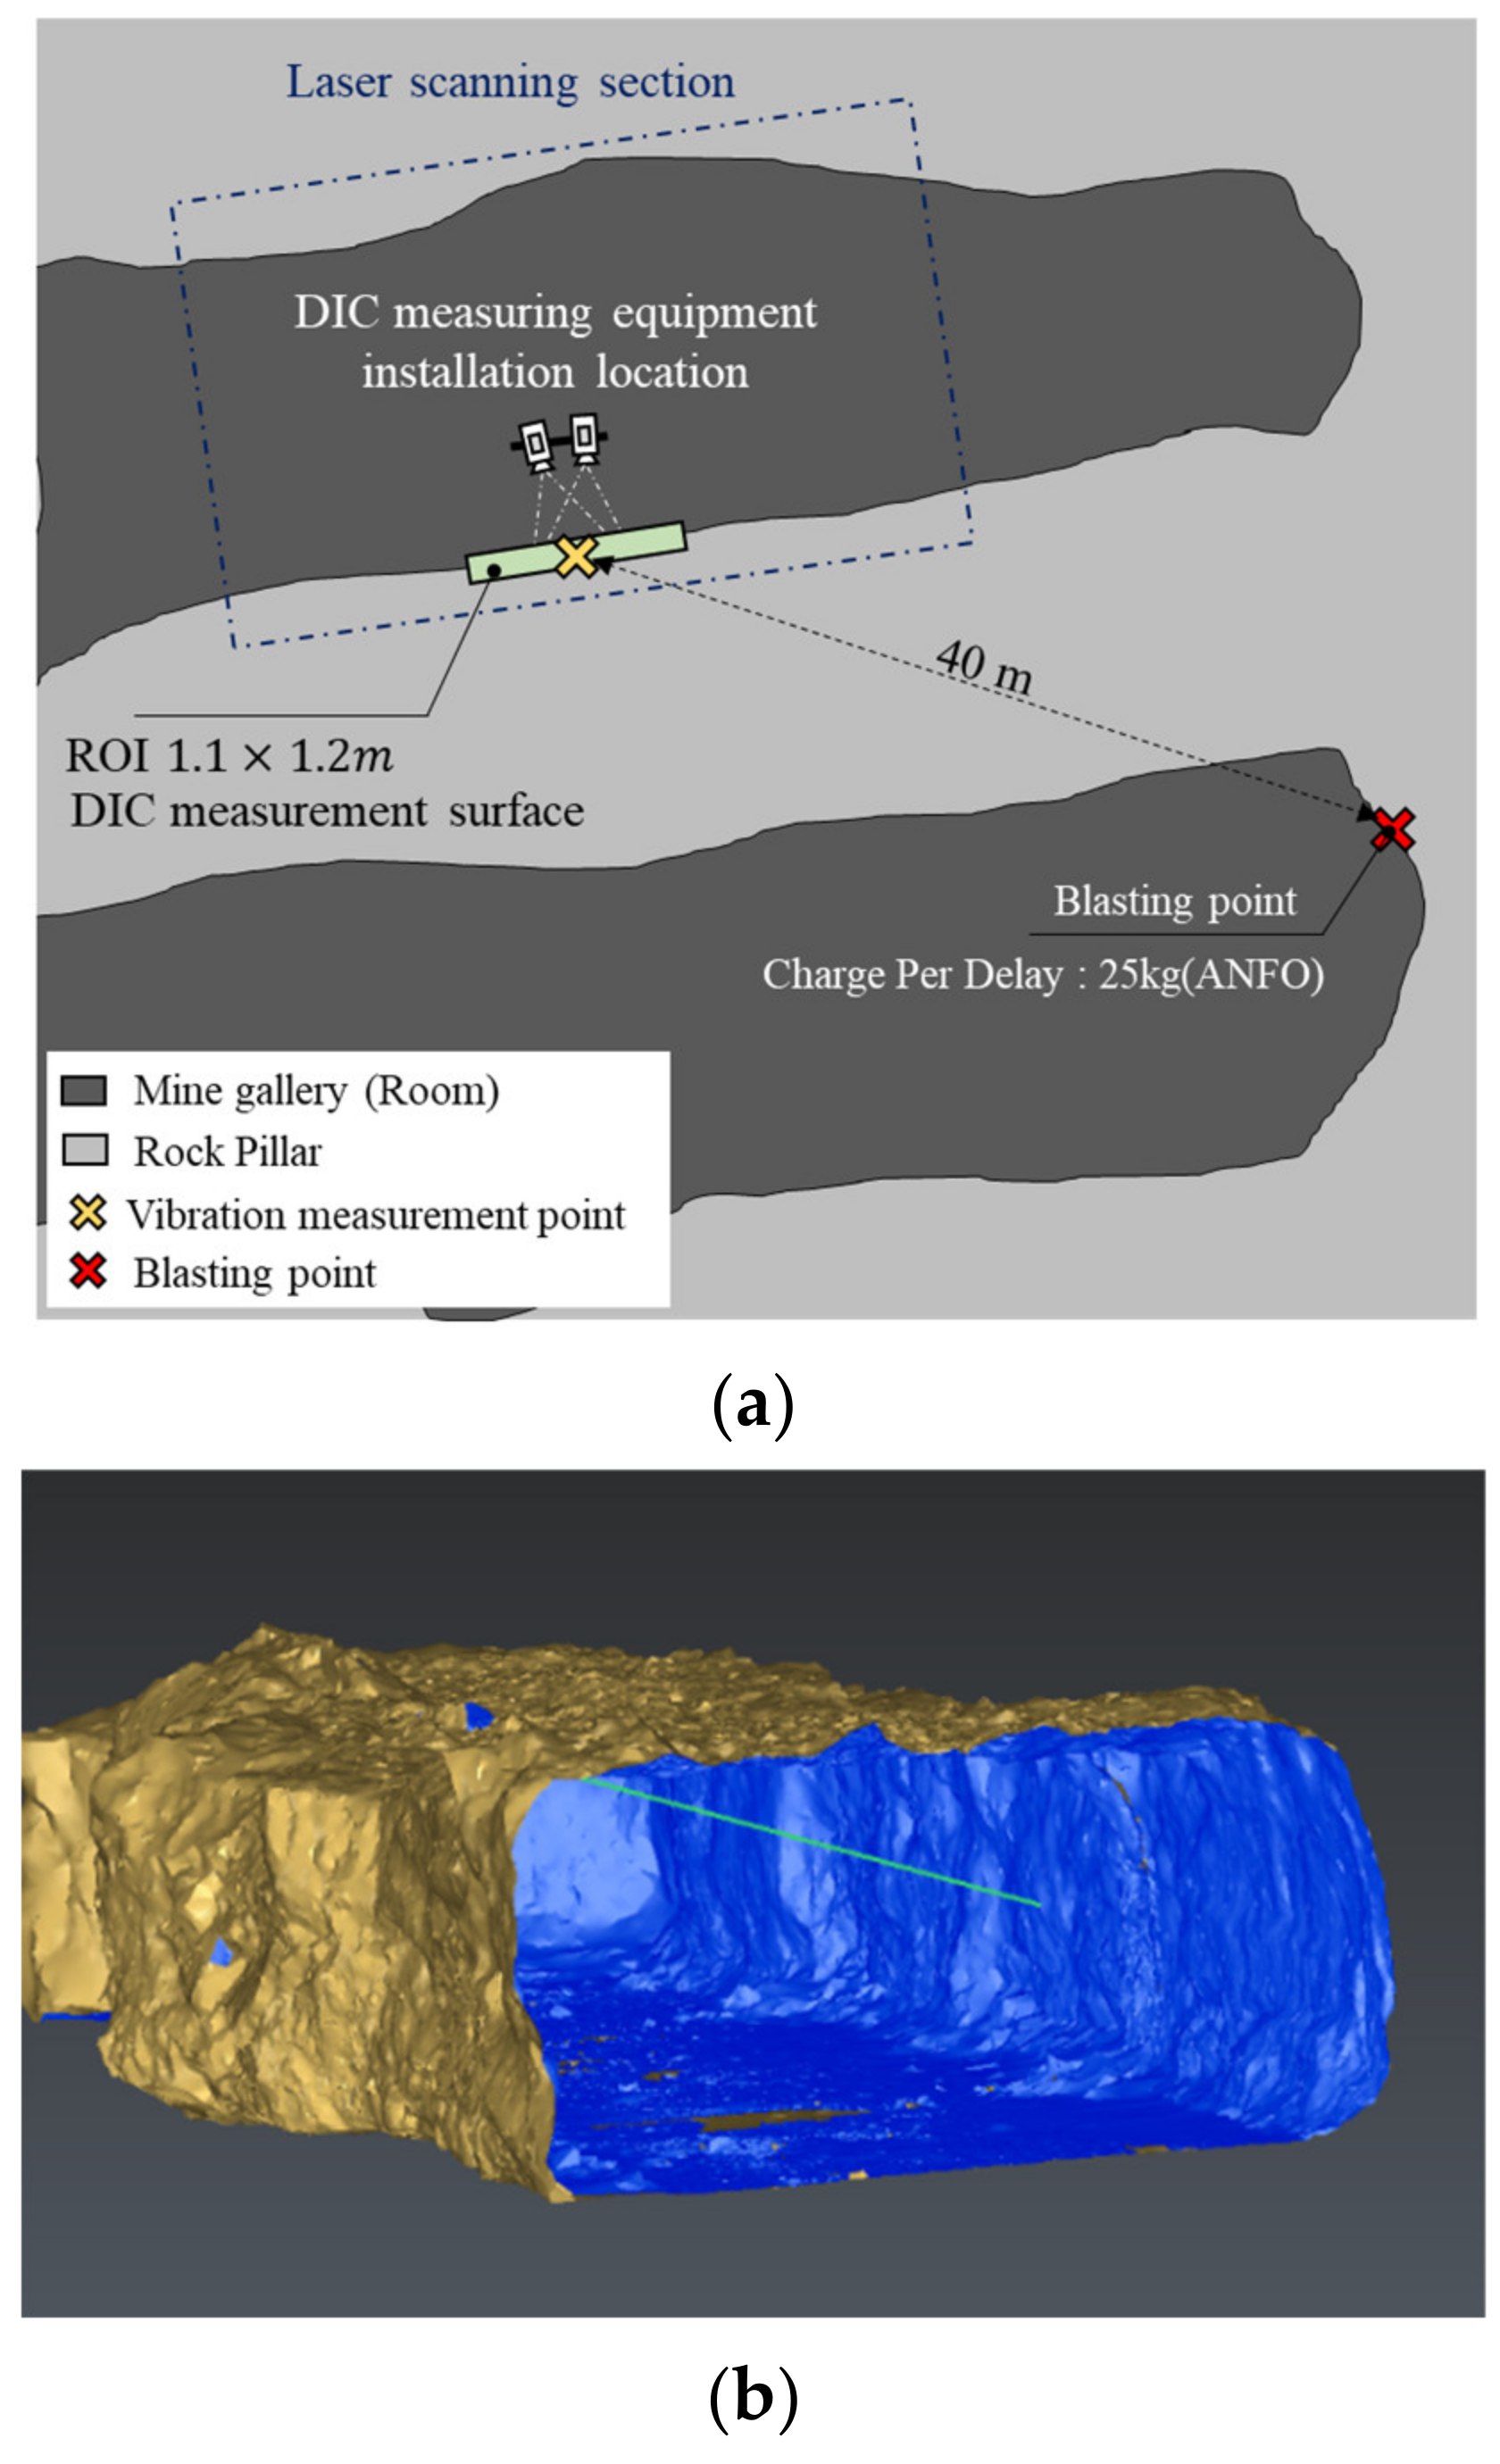
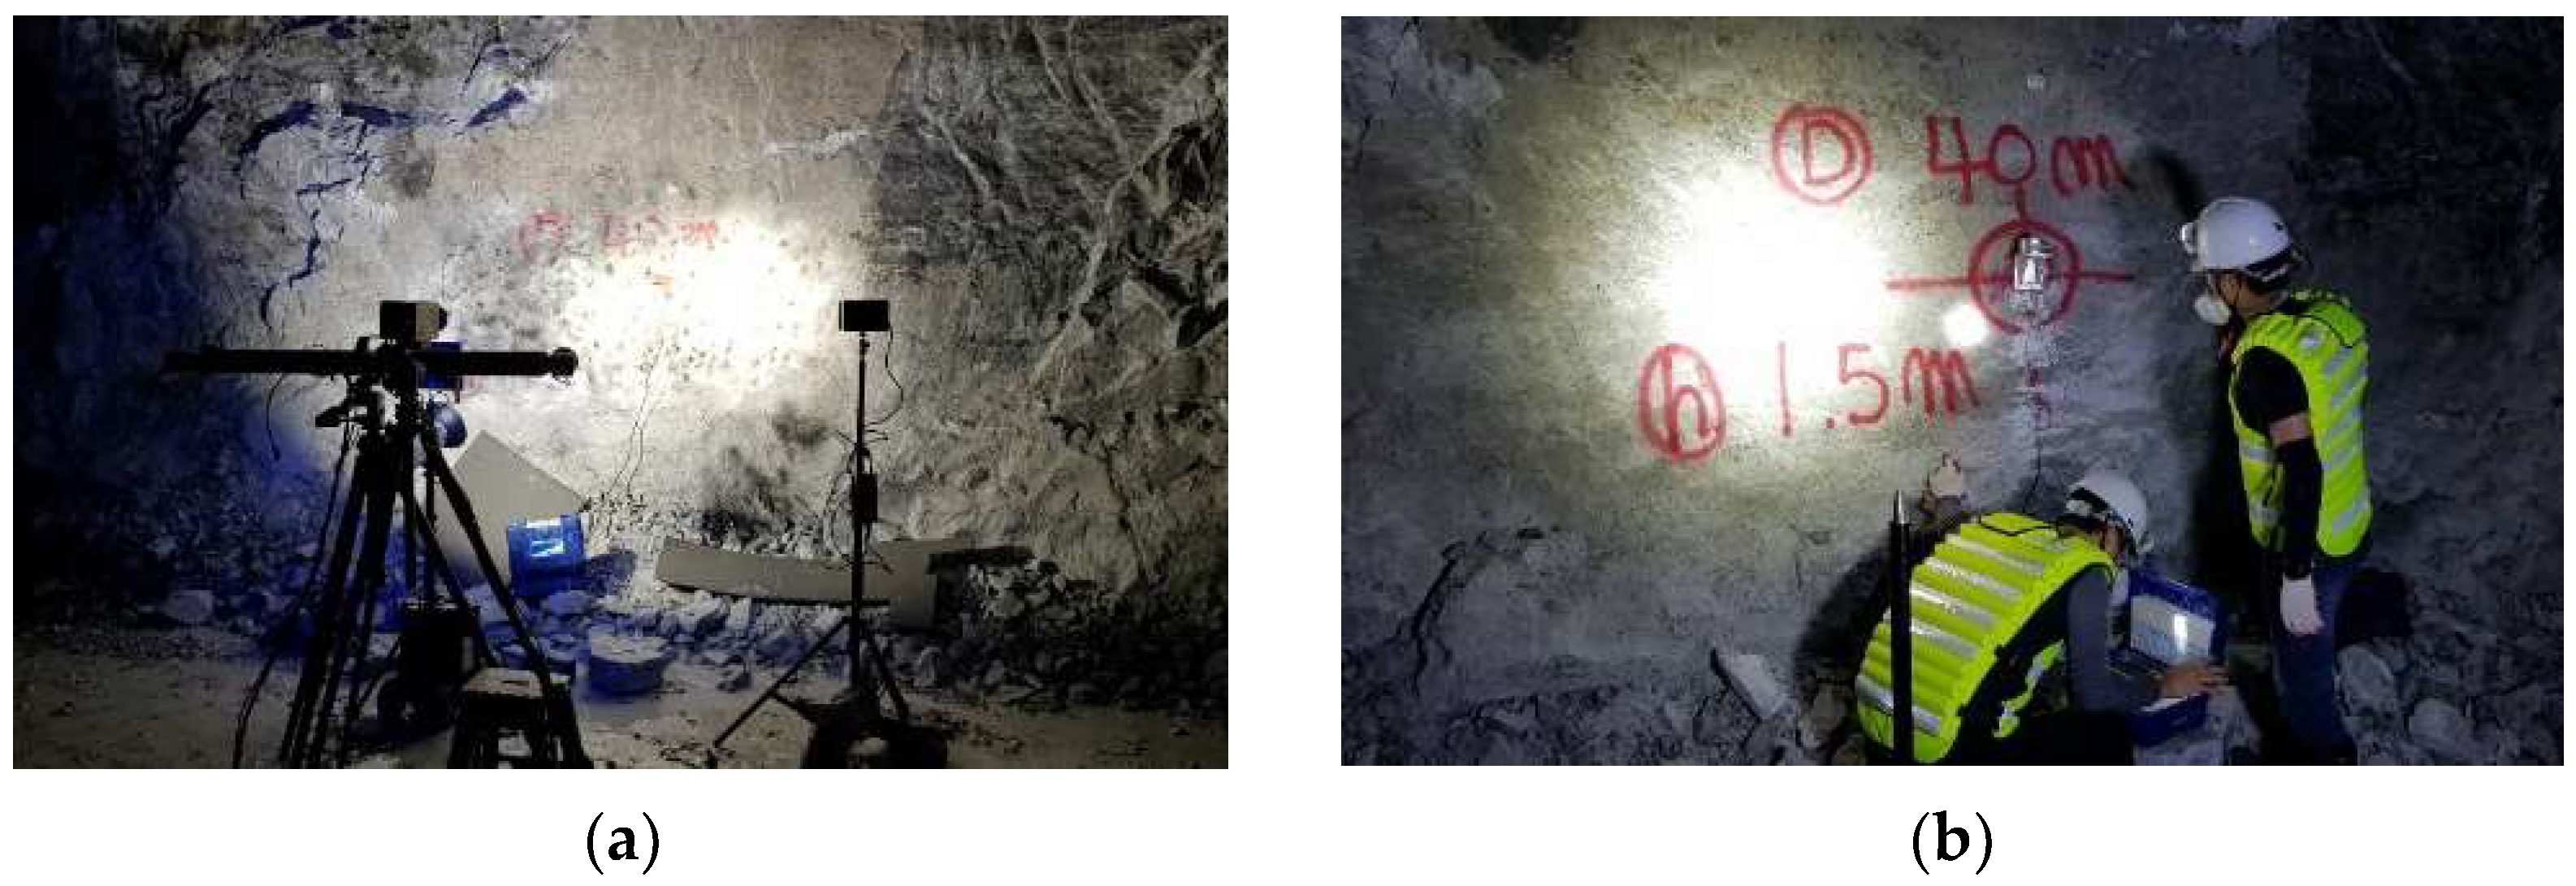
Nonlinear hydrocode was used for blast modeling. Because a hydrocode is suitable for simulating high-velocity impacts, particularly an explosion, the present study used the nonlinear hydrocode, AUTODYN, which incorporates finite element analysis, computational fluid dynamics, a mesh-free or meshless (smoothed particle hydrodynamics, SPH) capability, and coupling between these techniques and material physics.
For the modeling of the source of explosion, the Jones–Wilkins–Lee (JWL) equation of state (EOS) was used. It is more commonly adopted than other EOSs in hydrodynamic calculations [32]. The JWL EOS and parameters of ammonium nitrate fuel oil (ANFO) are as follows:
P = A [ 1 ω R 1 V ] e x p R 1 V + B [ 1 ω R 2 V ] e x p R 2 V + ω e V ,
where V is the specific volume, e (6.000 × 10⁶ kJ/m3) is the specific internal energy, and A (3.738 × 10⁵ MPa), B (3.747 MPa), R1 (4.15), R2 (0.9), and ω (0.35) are TNT constants determined from the cylindrical expansion test. In the present study, the Riedel, Hiermaier, and Thoma (RHT) model, which was originally developed for modeling the behavior of concrete subjected to dynamic loading [33], was used to model the rock pillar. This model is particularly useful for modeling the dynamic loading of brittle materials, such as concrete and rock. Table 1 presents the parameters of the RHT model used in this study.

3. Experiment Setup

The experimental mine was a limestone mine, with a capacity of one million tons per year. It was converted from an open-pit to an underground mine and currently has 12 developed sections. The underground depth is increased by approximately 10 m every year, and its deterioration in profitability has been compensated for by redeveloping the areas wherein mining has been completed. Because of the process of roof recovery and additional blasting of the existing mine galleries, excessive local rock displacement is likely to occur at the site, and the collapse of roof areas and protrusion of rocks on the side walls of the pillars are often observed.
The wall of the rock pillar, which is approximately 40 m away from the blasting face, was set as the measurement point (Figure 2). The blasting design at the time of the measurement is presented in Table 2.
Figure 3a shows the experimental system configuration for measuring displacements and vibrations in adjacent rock pillars as a result of mine blasting. It consists of a stereo camera, high-speed cameras, a personal computer for controlling the cameras, and software for image extraction and result monitoring. For high-precision measurements, 3D ARAMIS, which is a noncontact measurement system based on DIC (developed by GOM), was used, and the CR-S3500 4000 frames per second (fps) high-definition (HD) ultra-high-speed camera (manufactured by Optronis) was used to measure blast-induced vibrations. In addition, the region of interest (ROI) was limited to 1.1 × 1.2 m, and the blasting seismograph was attached to the wall at the center of the ROI to acquire data for comparison. The camera set was fixed to the floor of the measurement site with a clamp and prepared to move as one unit when vibration occurred.
Unless otherwise noted, the below-described analysis software, calibration, cameras, and settings were utilized for all DIC experiments. GOM optical measurement techniques ARAMIS for static analysis and IVIEW for dynamic analysis were used as DIC software in this investigation. The IVIEW program has been improved by a collaborative effort between AFRL, Trilion, and GOM to accommodate the huge volumes of images required for random vibration measurements. A GOM-specific 250 × 200 mm2 panel with a 150.01 mm calibration scale was employed as the calibration object. Two Photron SA5 cameras with 32 GB onboard memory and 28 mm lenses set at an aperture of 2.8 were used. The camera calibration that results usually yields a measurement volume of 450 mm3. The calibration process was repeated until the variation was less than 0.025 pixels. Any value less than 0.02 was regarded as extraordinary. According to preliminary tests, a camera angle of 20° to 30° is appropriate, with 25° being best. Furthermore, the common facet size is 20 × 20 pixels, which was proven to be optimal in prior investigations.
The DIC settings above resulted in a 0.01 mm minimum out-of-plane displacement measurement resolution. The camera resolution for specimen measurement is determined by striking a balance between keeping the area of interest near the center of the camera frame (as errors and the algorithm’s ability to track motion tend to decrease near the frame edge) and sufficiently filling the field of view with the area of interest to maximize pixel density and, thus, measurement resolution. The frame rate is typically 4000 frames per second, resulting in 96,000 frames for a 24 s recording. A pair of 305 mm2 Litepanels, which are panel arrays made of 1152 light-emitting diode bulbs providing a constant distribution of lighting while minimizing constrained specimen heating and prestress, provided specimen illumination. The DIC speckle pattern employed for this work was a flat white spray paint foundation with random black permanent marker dots, which was shown to be the most effective pattern for vibration testing on the length scale of the specimen [29]. Figure 3b shows the blasting vibration measuring equipment used for blasting vibration in the tunnel. A vibration meter was used to measure blast vibration in absolute units, such as displacement and speed over time. Blastmate Series III (Instantel, Ottawa, ON, Canada), which can simultaneously measure vibration displacement component, vibration velocity component, and frequency, was used as the vibrometer. This equipment is currently commonly used for measuring blast vibration in tunnels, and it can be used for comparisons with high-speed DIC, a noncontact measurement method.

4. Test Results

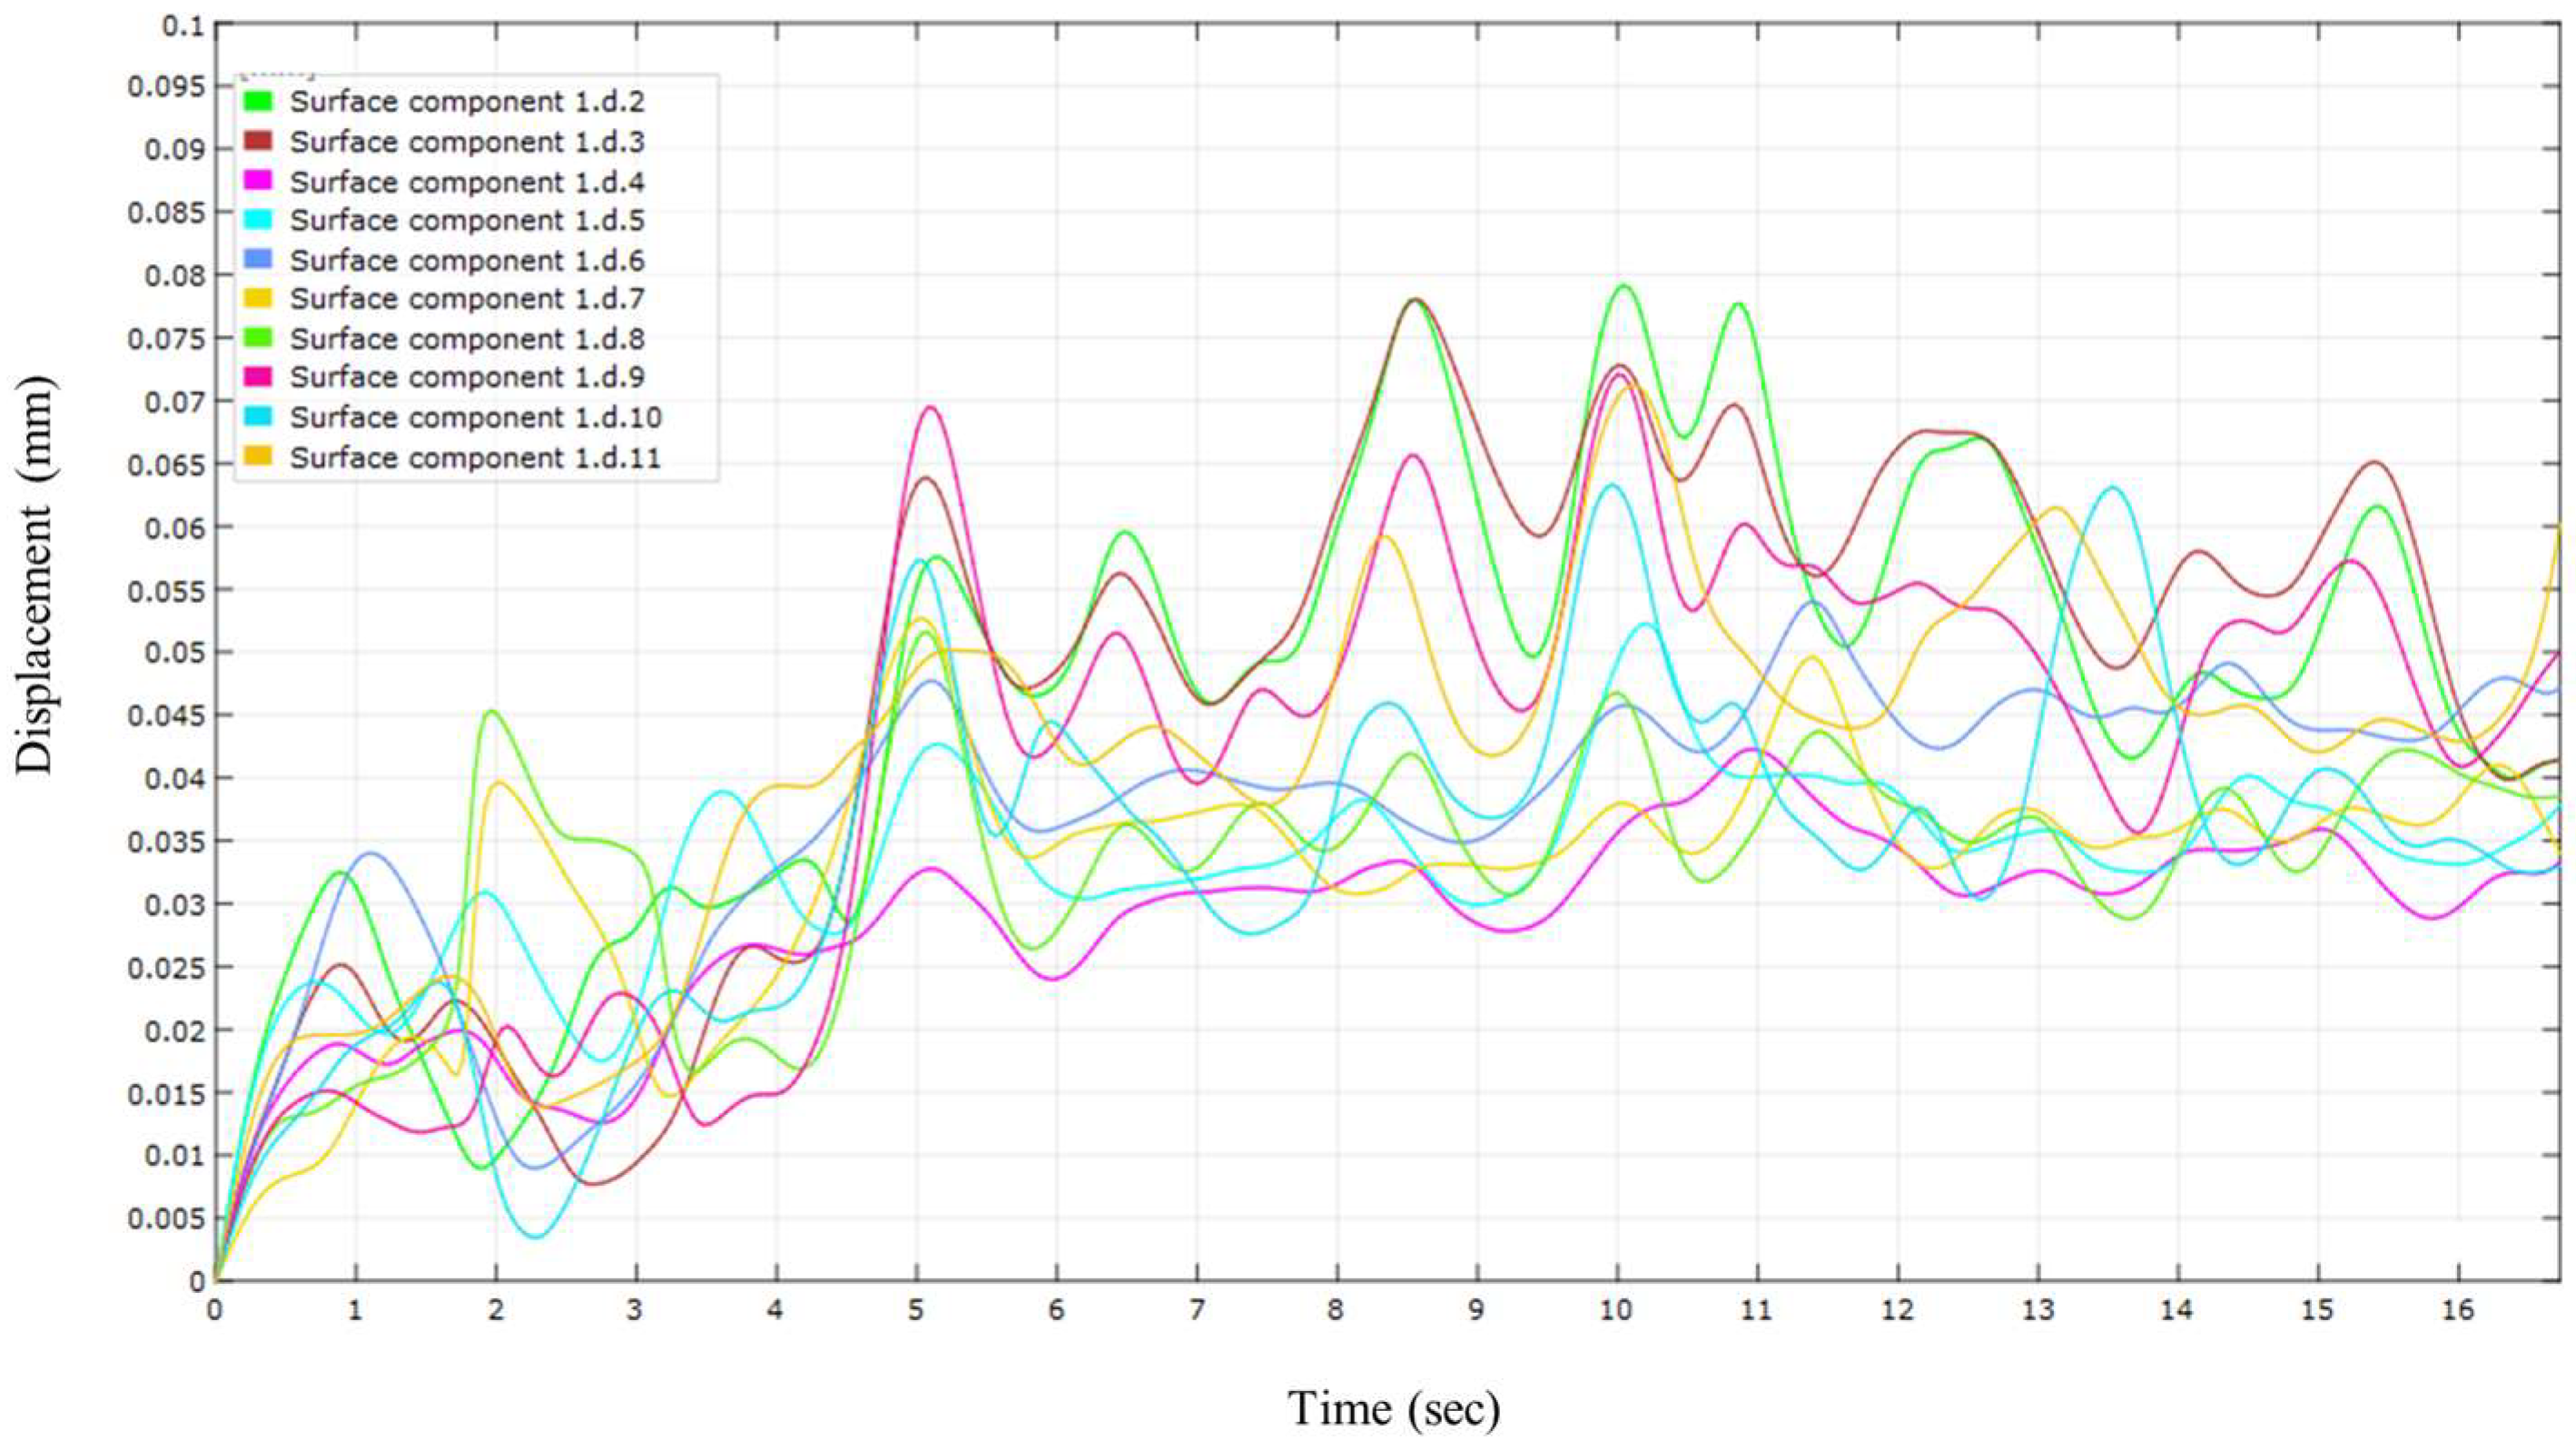
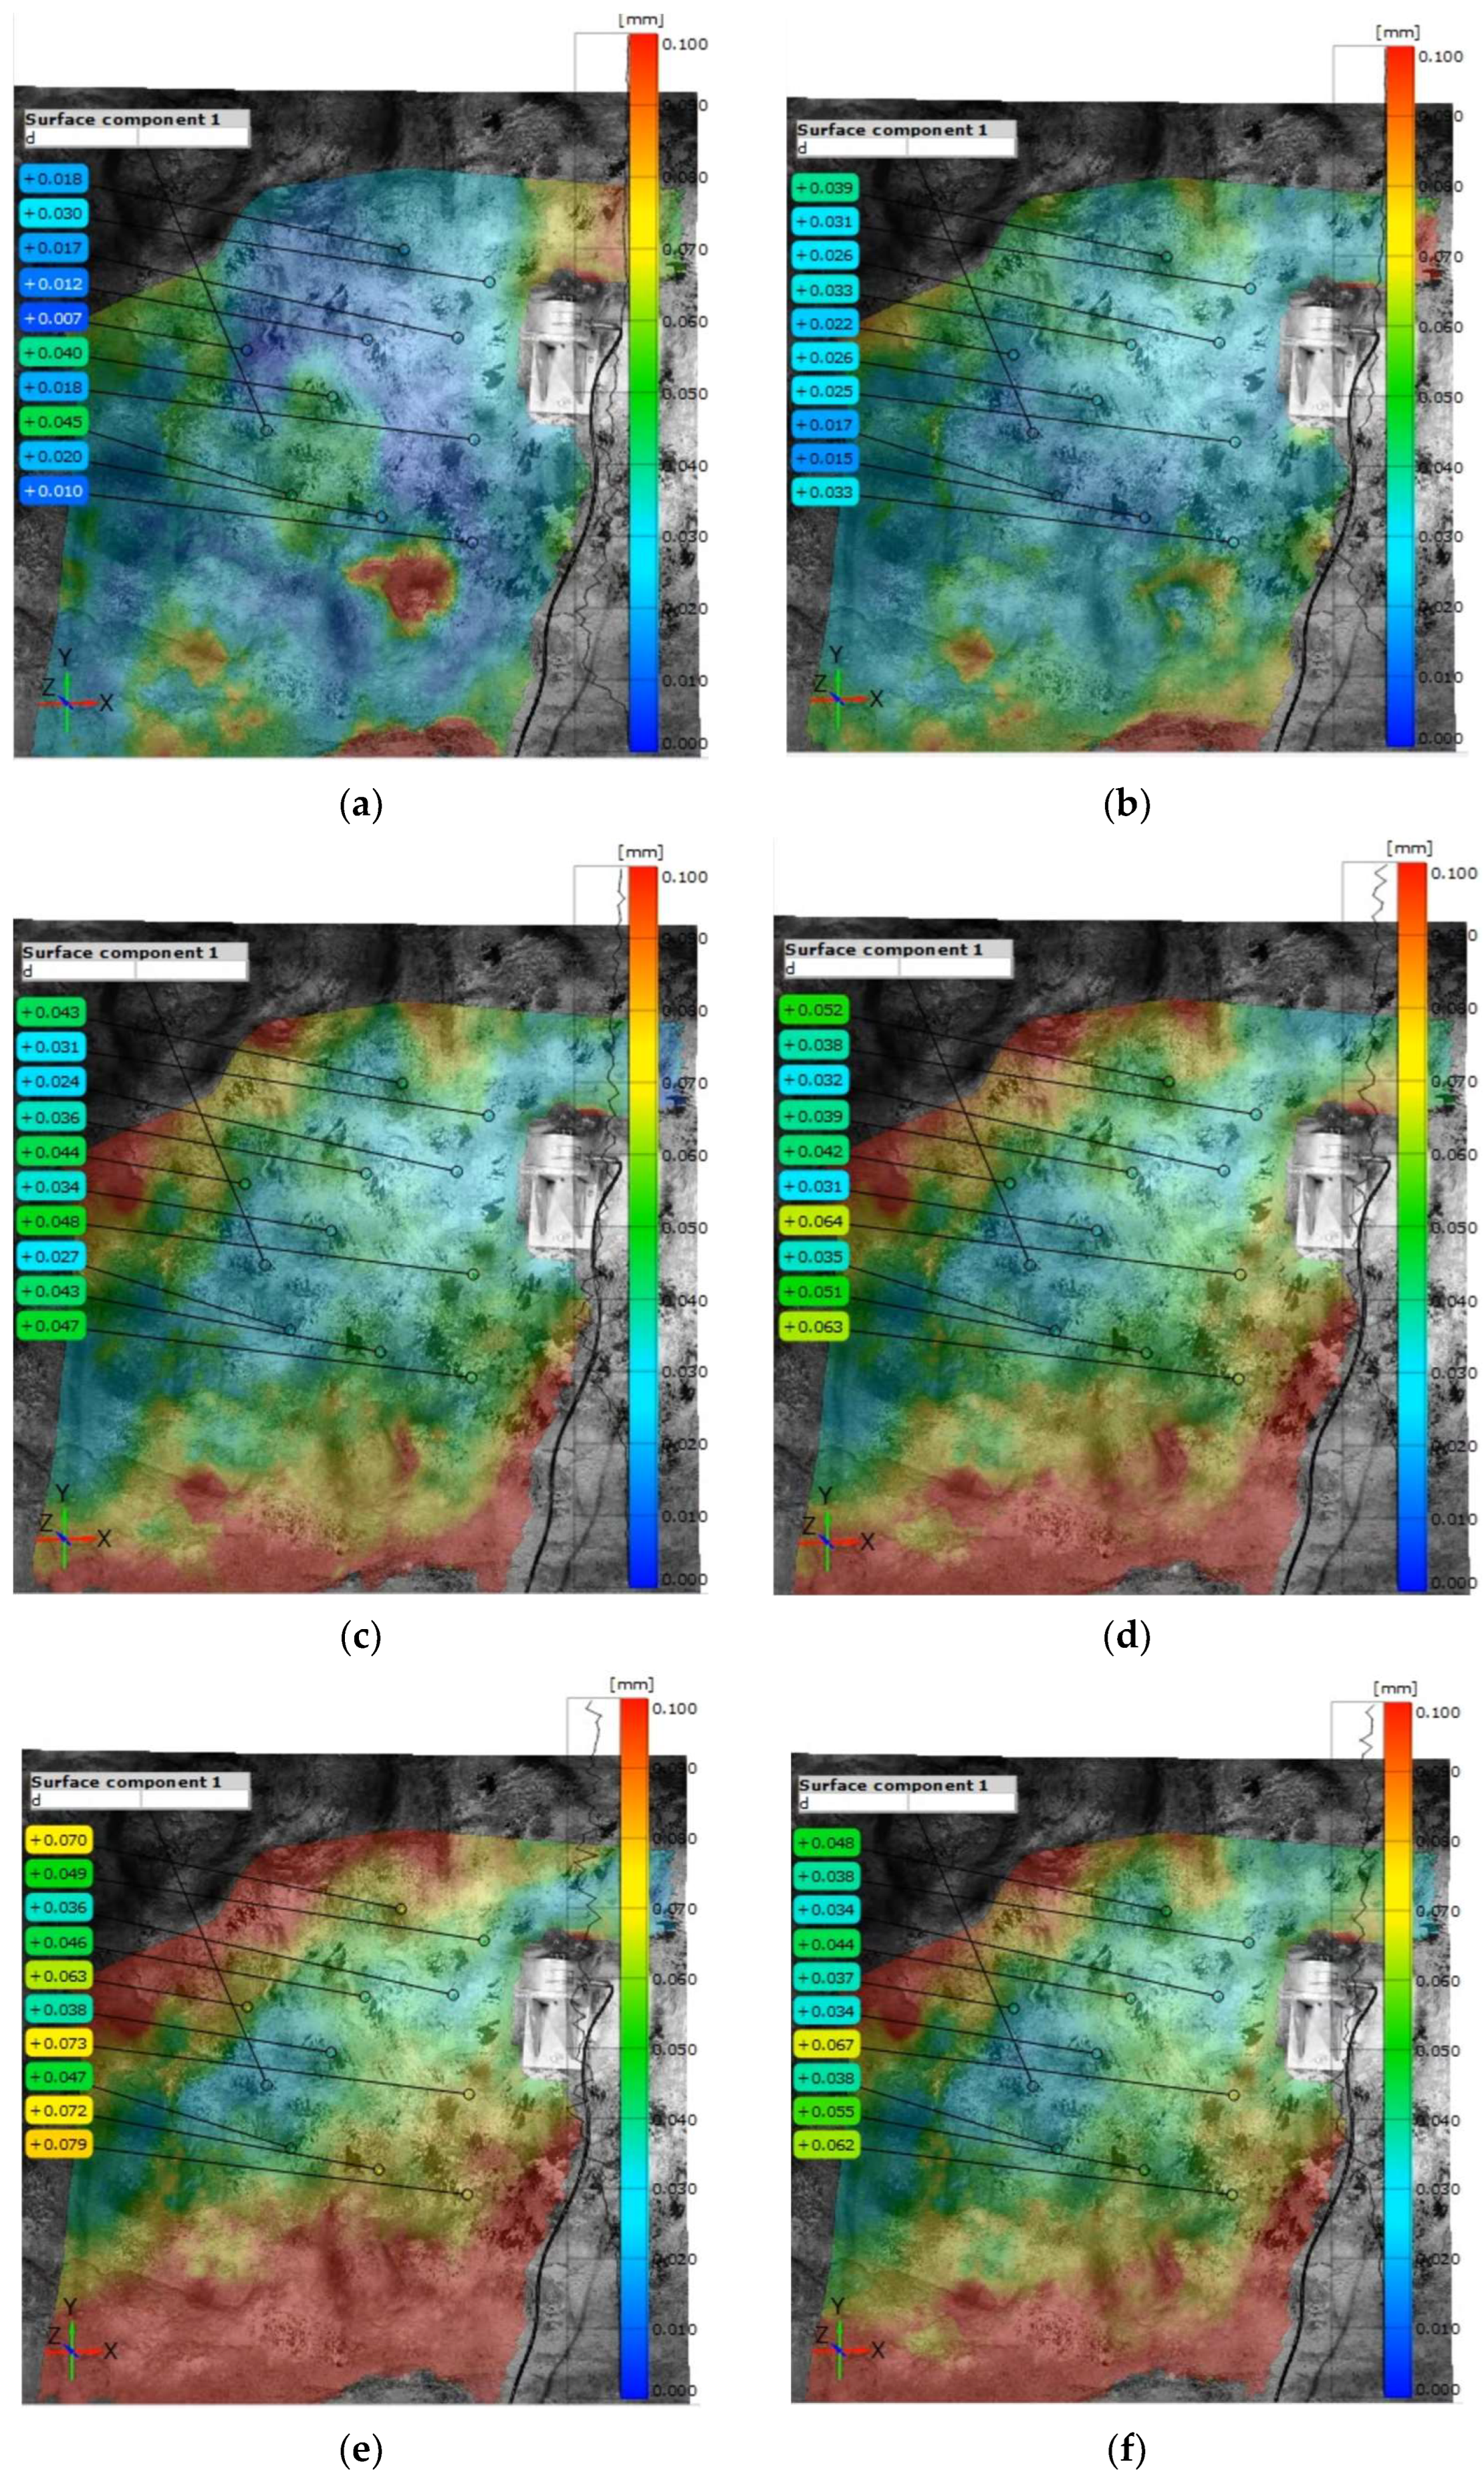
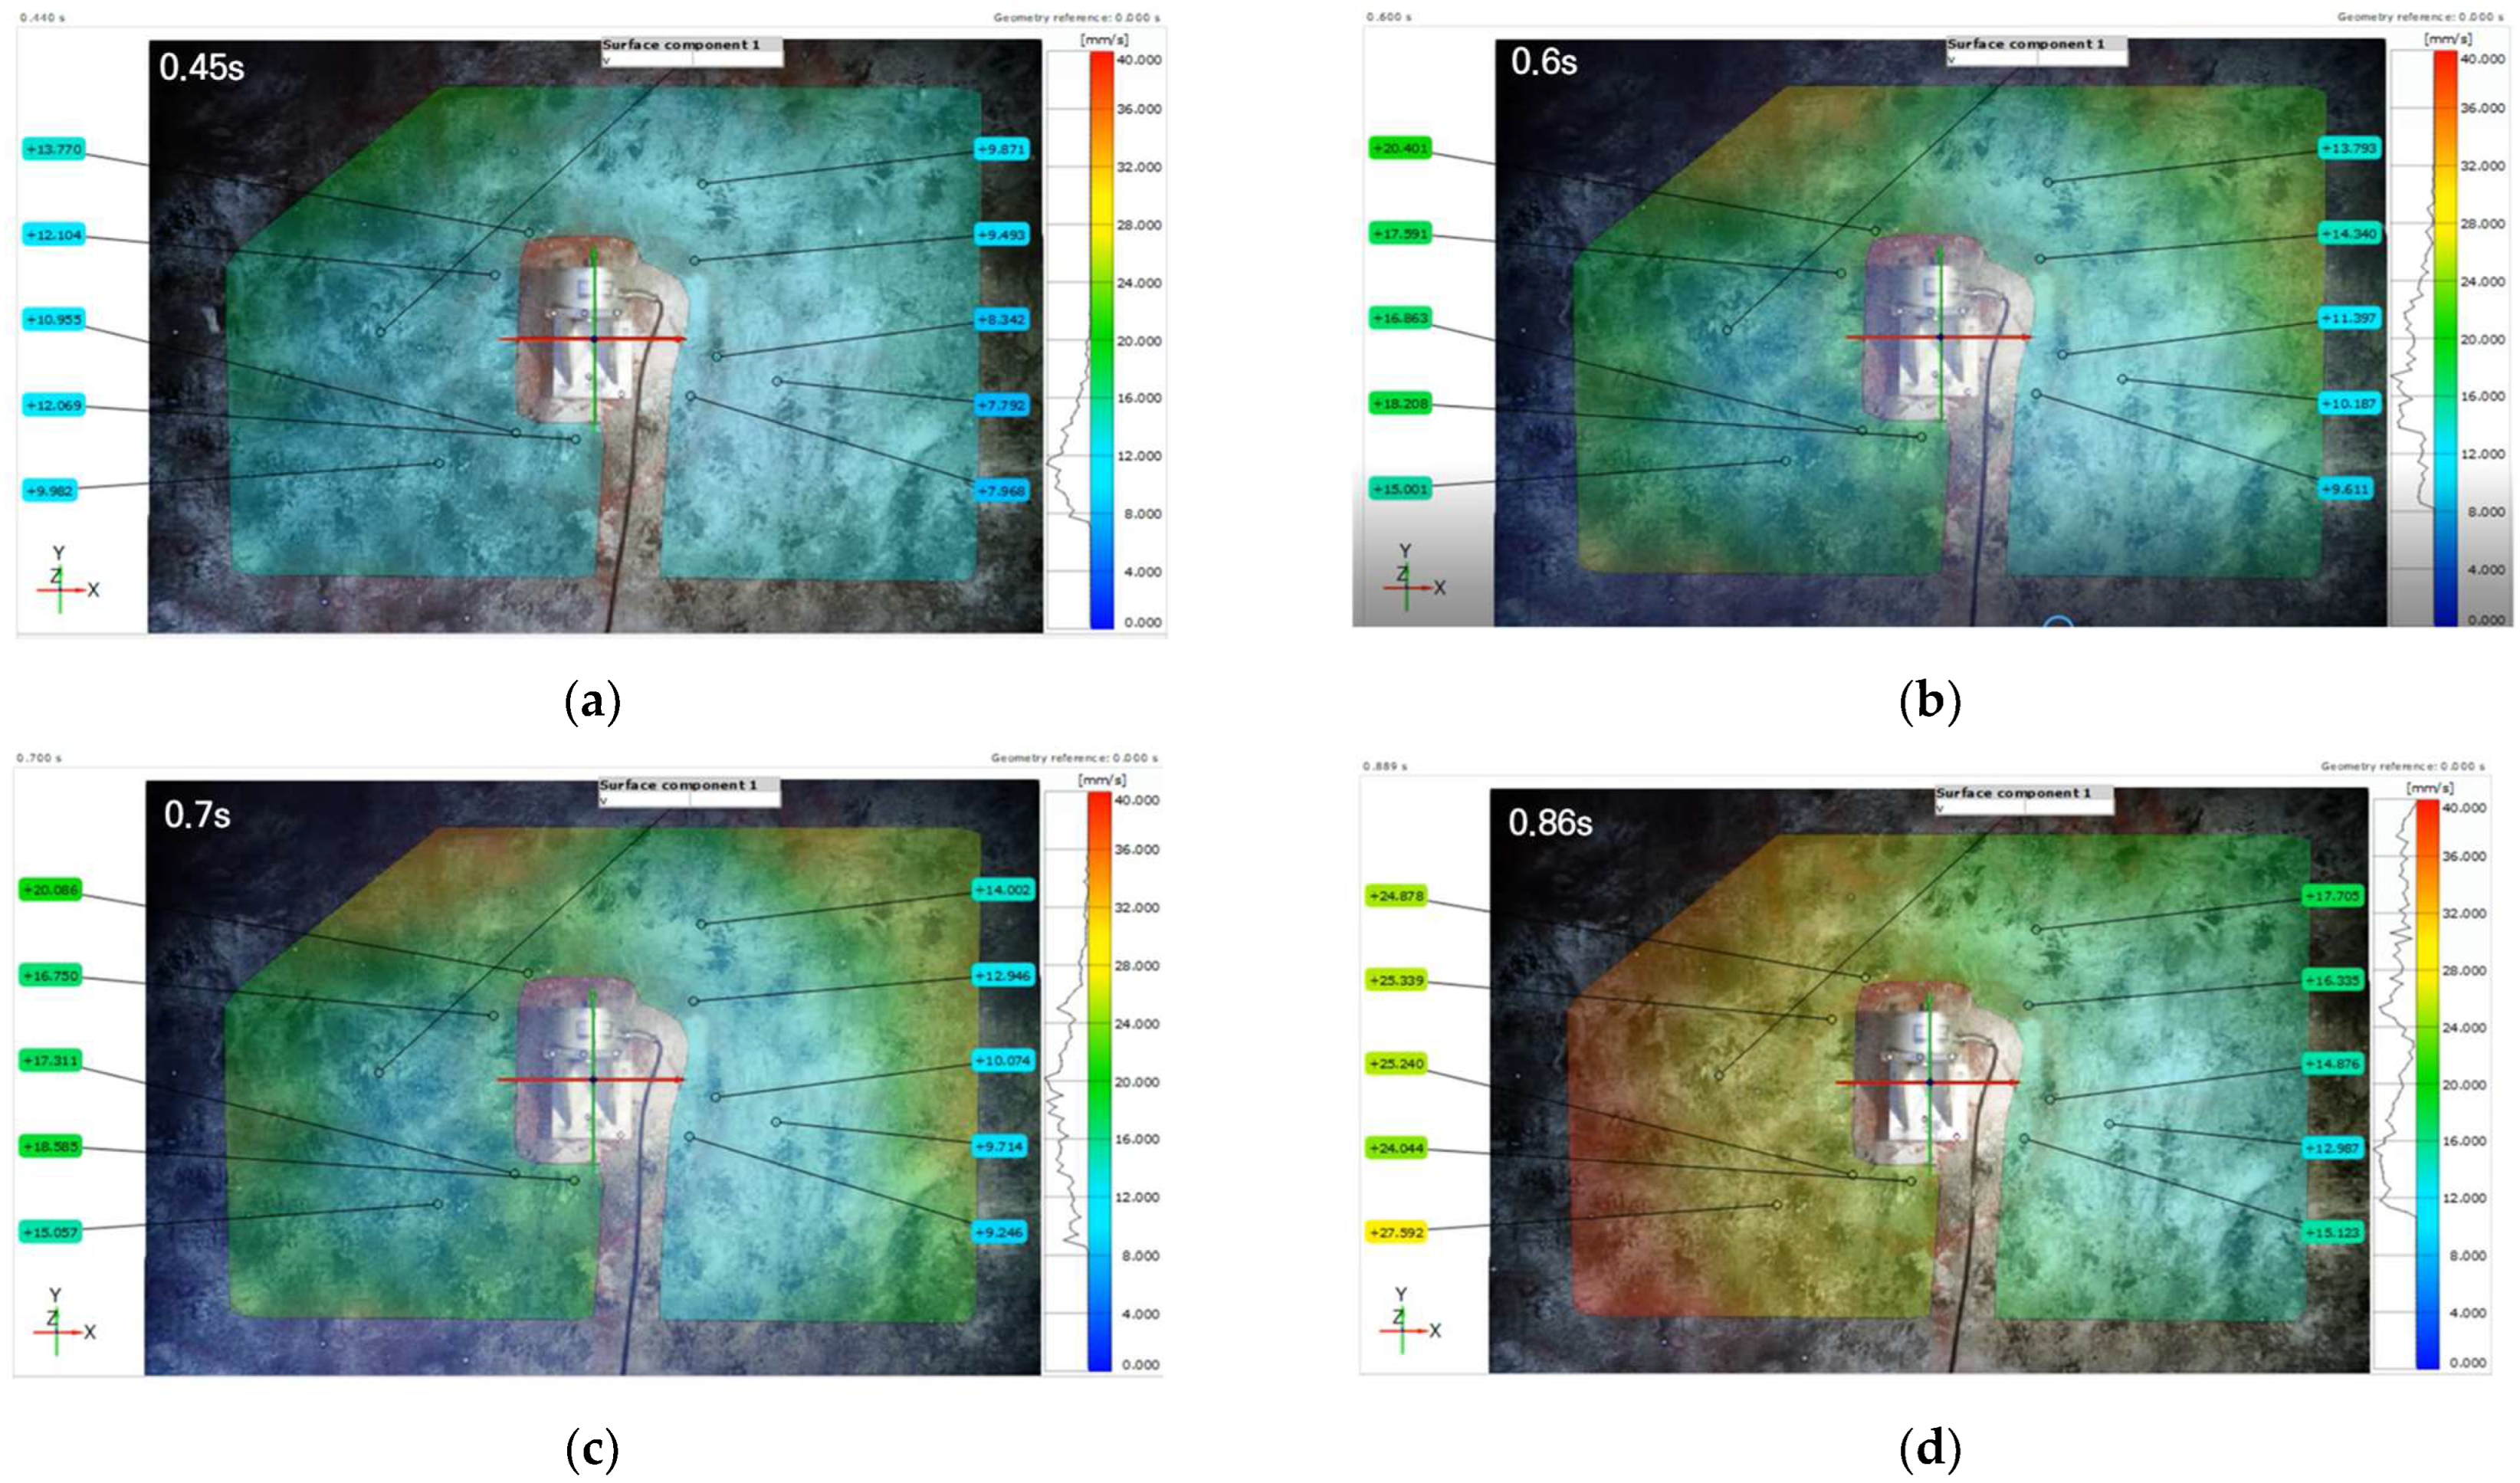
4.1. Measurement Results Using DIC

In this study, blasting displacements and vibrations were obtained by measuring the changes in the singular points of speckle patterns using the DIC technique for easy recognition of the movement path of the image within the ROI. The speckle pattern was used to evaluate the deformation at the surface of the specimen by comparing the changes in the gray intensity in the obtained images with respect to the measurement surface. The deformation in the surface of the specimen should provide sufficient information on changes in the gray intensity to reflect the evaluation algorithm used in evaluating the measurement. To achieve this, an artificial random pattern was formed on the surface region of the specimen to be analyzed. As shown in Figure 4, a speckle pattern was generated in the ROI on the wall of the rock pillar, and the movement of the image was calculated using displacement and vibration.
Figure 5 shows the DIC measurement results of displacement due to blasting at the face in the mine gallery in the ROI of the opposite rock pillar. The peak displacement was observed in the measurement area of the opposite rock pillar after 8–9 s (Figure 6). Among the several feature points within the ROI, the peak displacement was approximately 0.078 mm when the displacement of the 10 feature points was in the range of 0.03–0.078. The displacement continued and decreased in the ROI for approximately 10 s.
Because data sampling of a high-speed camera requires a significant amount of storage capacity, the time of change of the specimen needs to be predicted to determine an accurate time for image acquisition. Sampling for approximately 10 s after blasting was set as the optimal data acquisition time according to the peak displacements, as shown in Figure 7 and Figure 8. The measurement results of vibrations due to blasting at the face in the mine gallery in the ROI of the opposite rock pillar are shown in Figure 8. It took 0.4–0.9 s to acquire data, and sampling was conducted for approximately 0.5 s, when the peak particle velocity in the feature points in the ROI was 35 mm/s. The peak particle velocity at 0.88 s was in the range of approximately 16–35 mm/s for the 10 feature points. Figure 8 shows variations in the vibration velocity in the ROI according to the feature point position and time.

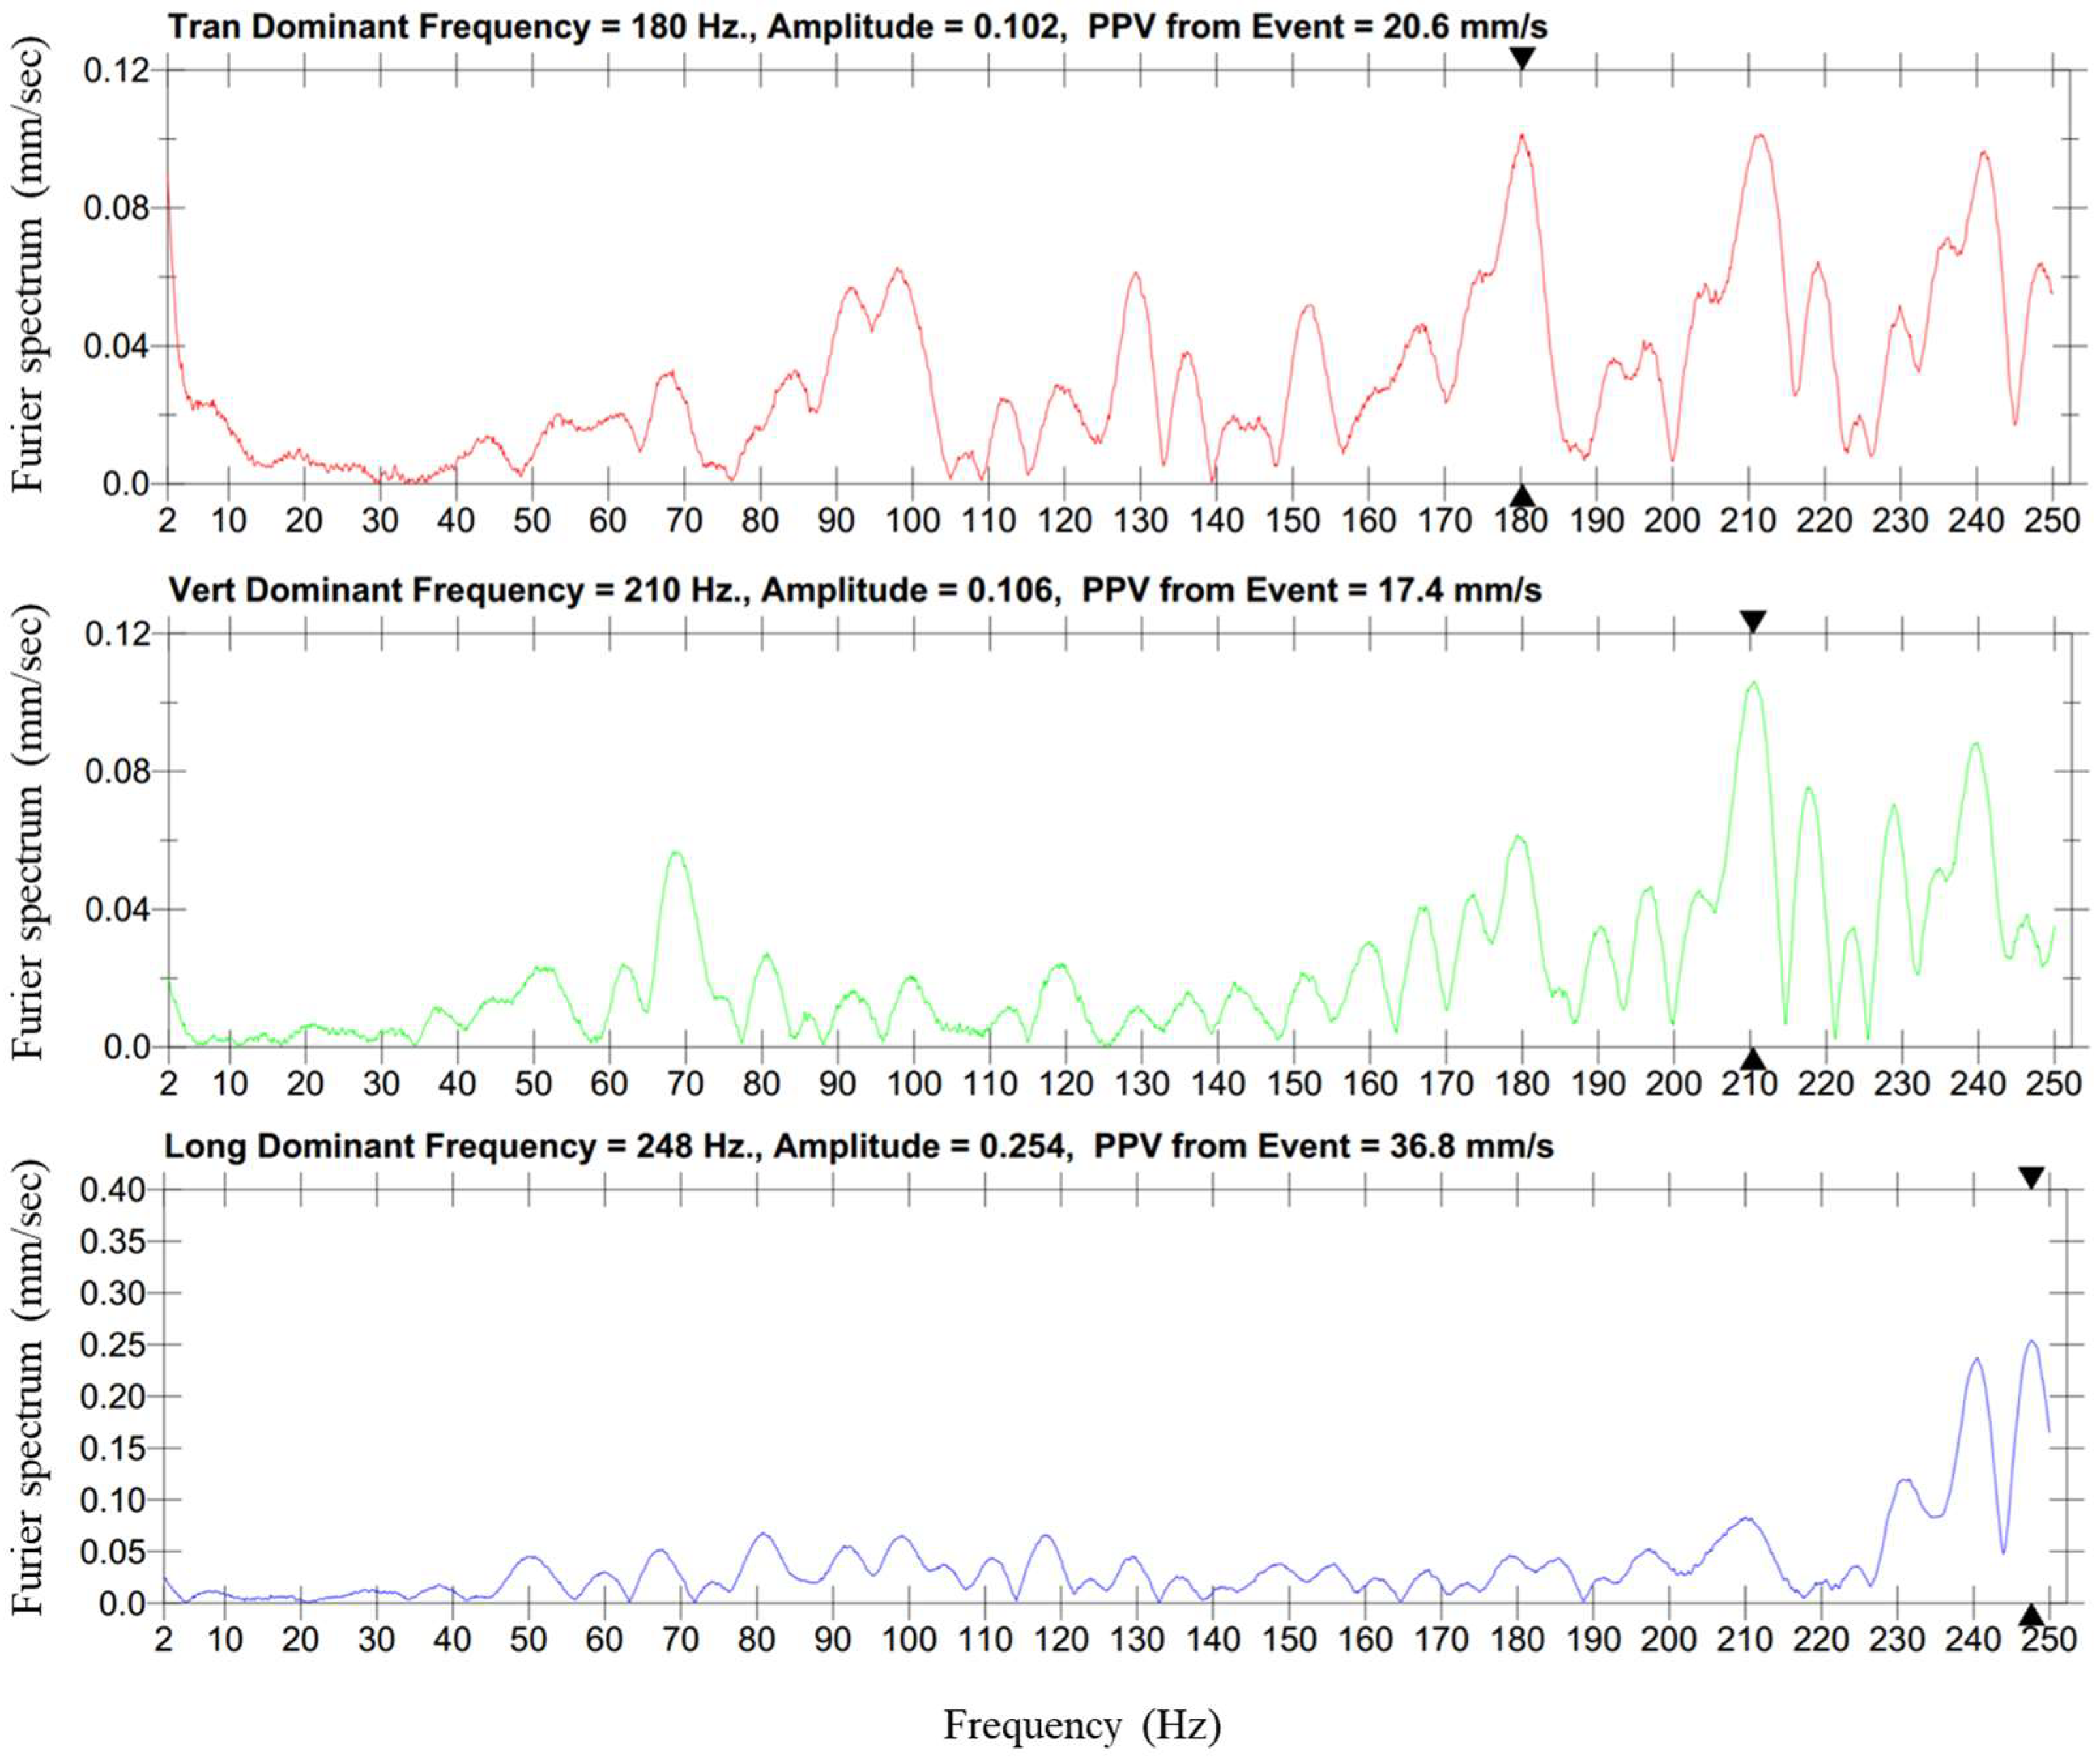
4.2. Measurement Results Using Vibration Measurement Instruments

The displacement and vibration measurement data obtained from the DIC system and blasting seismograph were compared. In order to understand the frequency characteristics caused by the blasting vibration, the results measured by the conventional vibration measurement instrument were analyzed in terms of the dominant frequency through fast Fourier transform (FFT) to determine which characteristics were the blasting vibrations. The blasting vibrations were directly measured three times at the same point, and the vector sum (PPV, peak particle velocity) was measured for 20.6, 17.4, and 36.8 mm/s in the order of L > T > V. This was judged as the result of the vibration response in the front–rear direction at the center point where the thickness was lowest and the amplitude was largest, and where the L component met the wall at right angles at the top of the center of the wall with the largest bending moment due to the propagation of the vibration generated from the width source. Figure 9 shows the fast Fourier transform, which is one of the measurement results. The peak particle velocity was 36.8 mm/s in the transverse vibration when the main frequency was approximately 248 Hz. Table 3 presents the peak displacement according to the direction.
The displacement and vibration measurement data obtained from the DIC system and blasting seismograph were compared in terms of the maximum values (Table 4). The mean values of the peak displacement and peak particle velocity from the actual measured data were compared with the maximum value in the ROI of the DIC system. The peak displacement and peak particle velocity were 86% and 93%, respectively, compared with the actual measured values, indicating similar results.

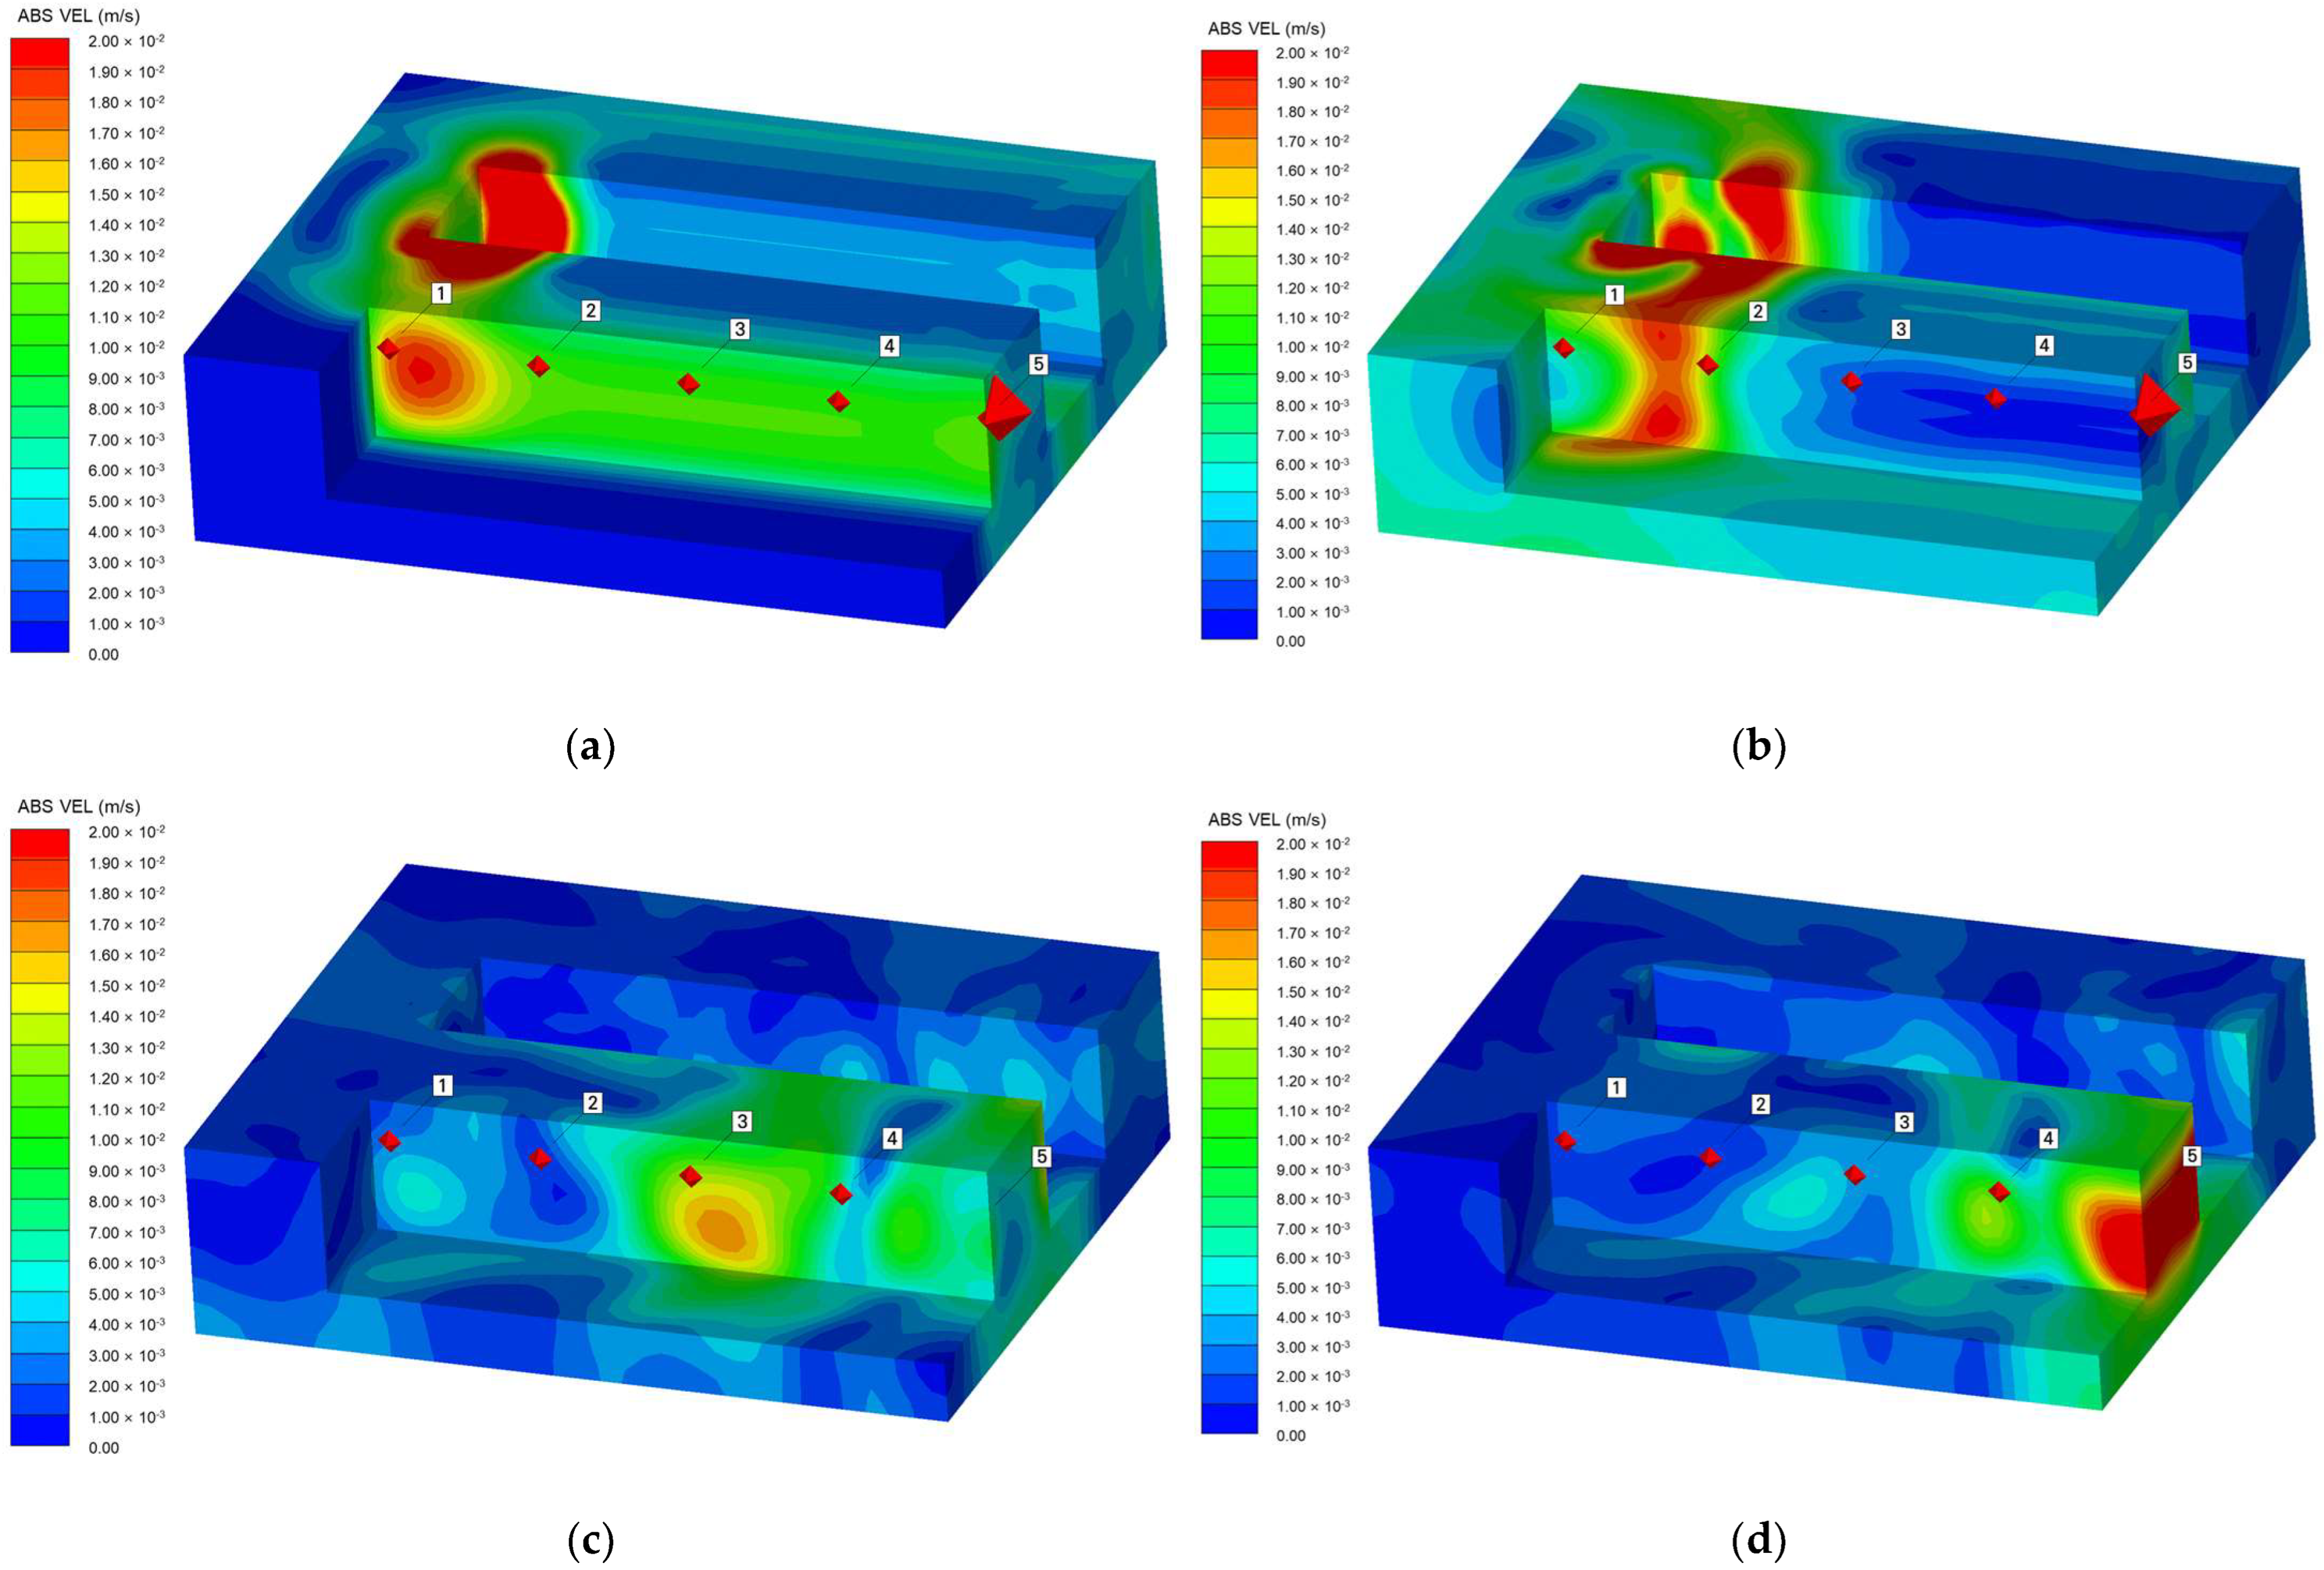
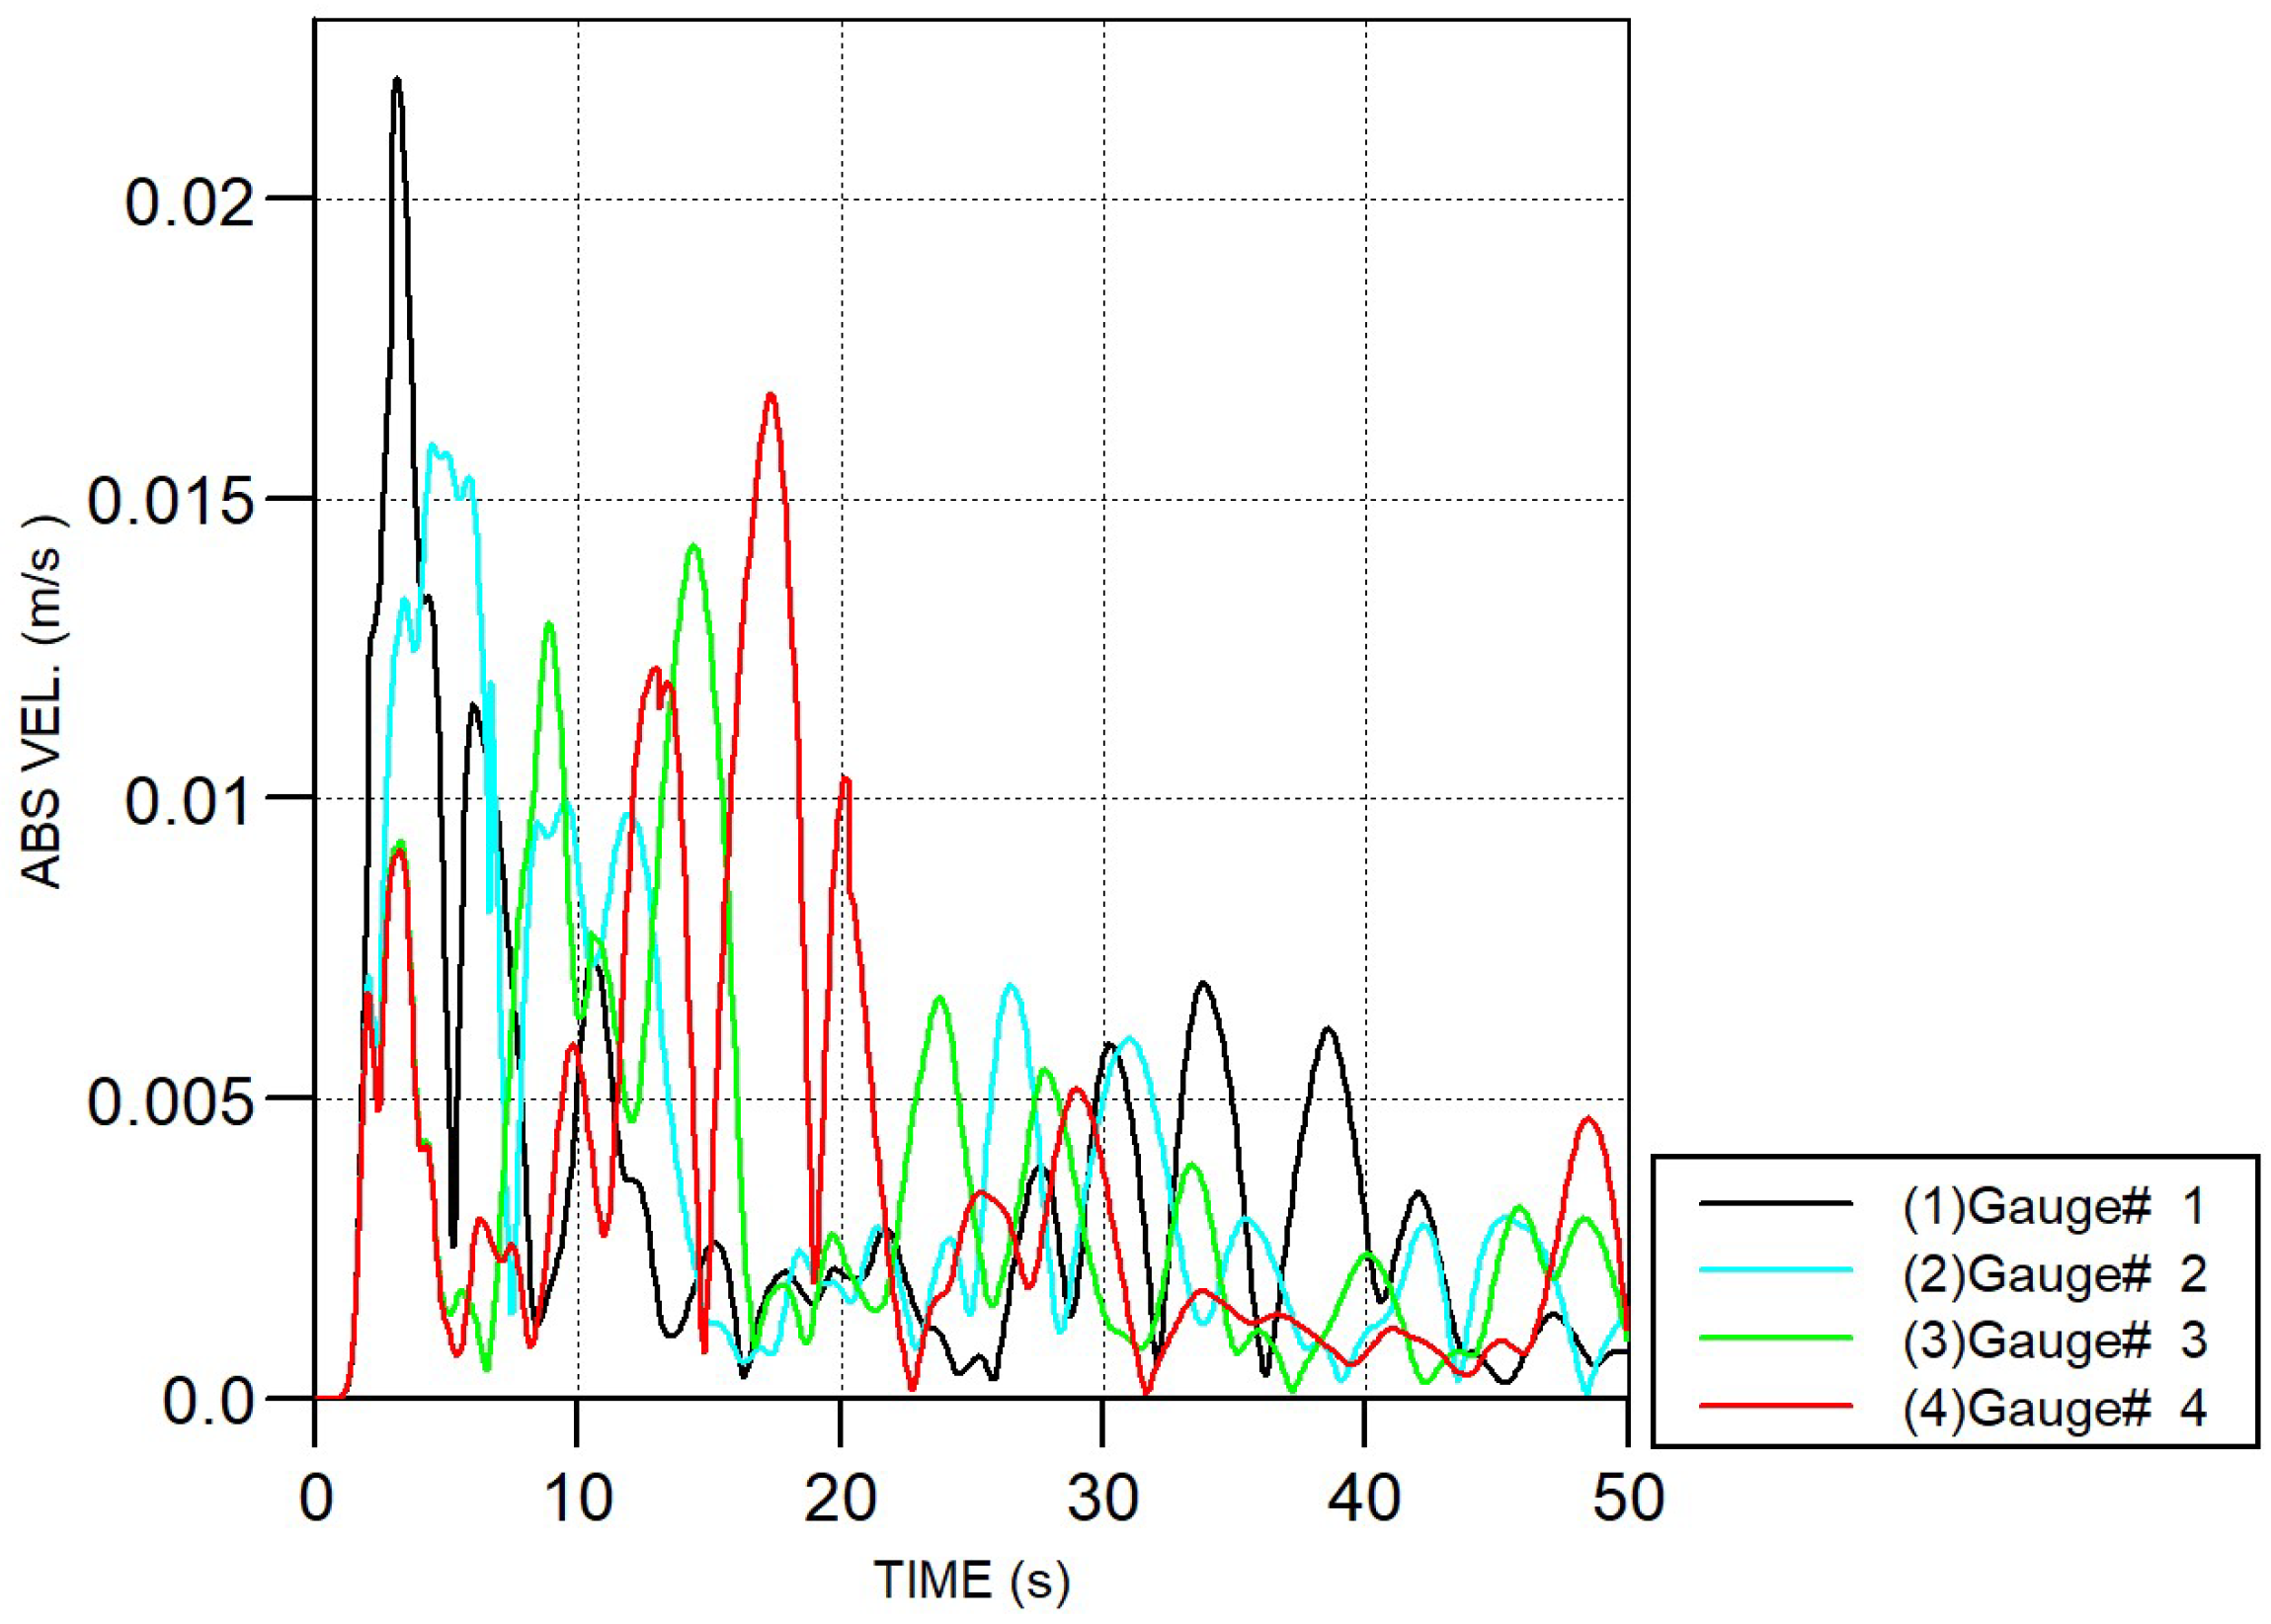
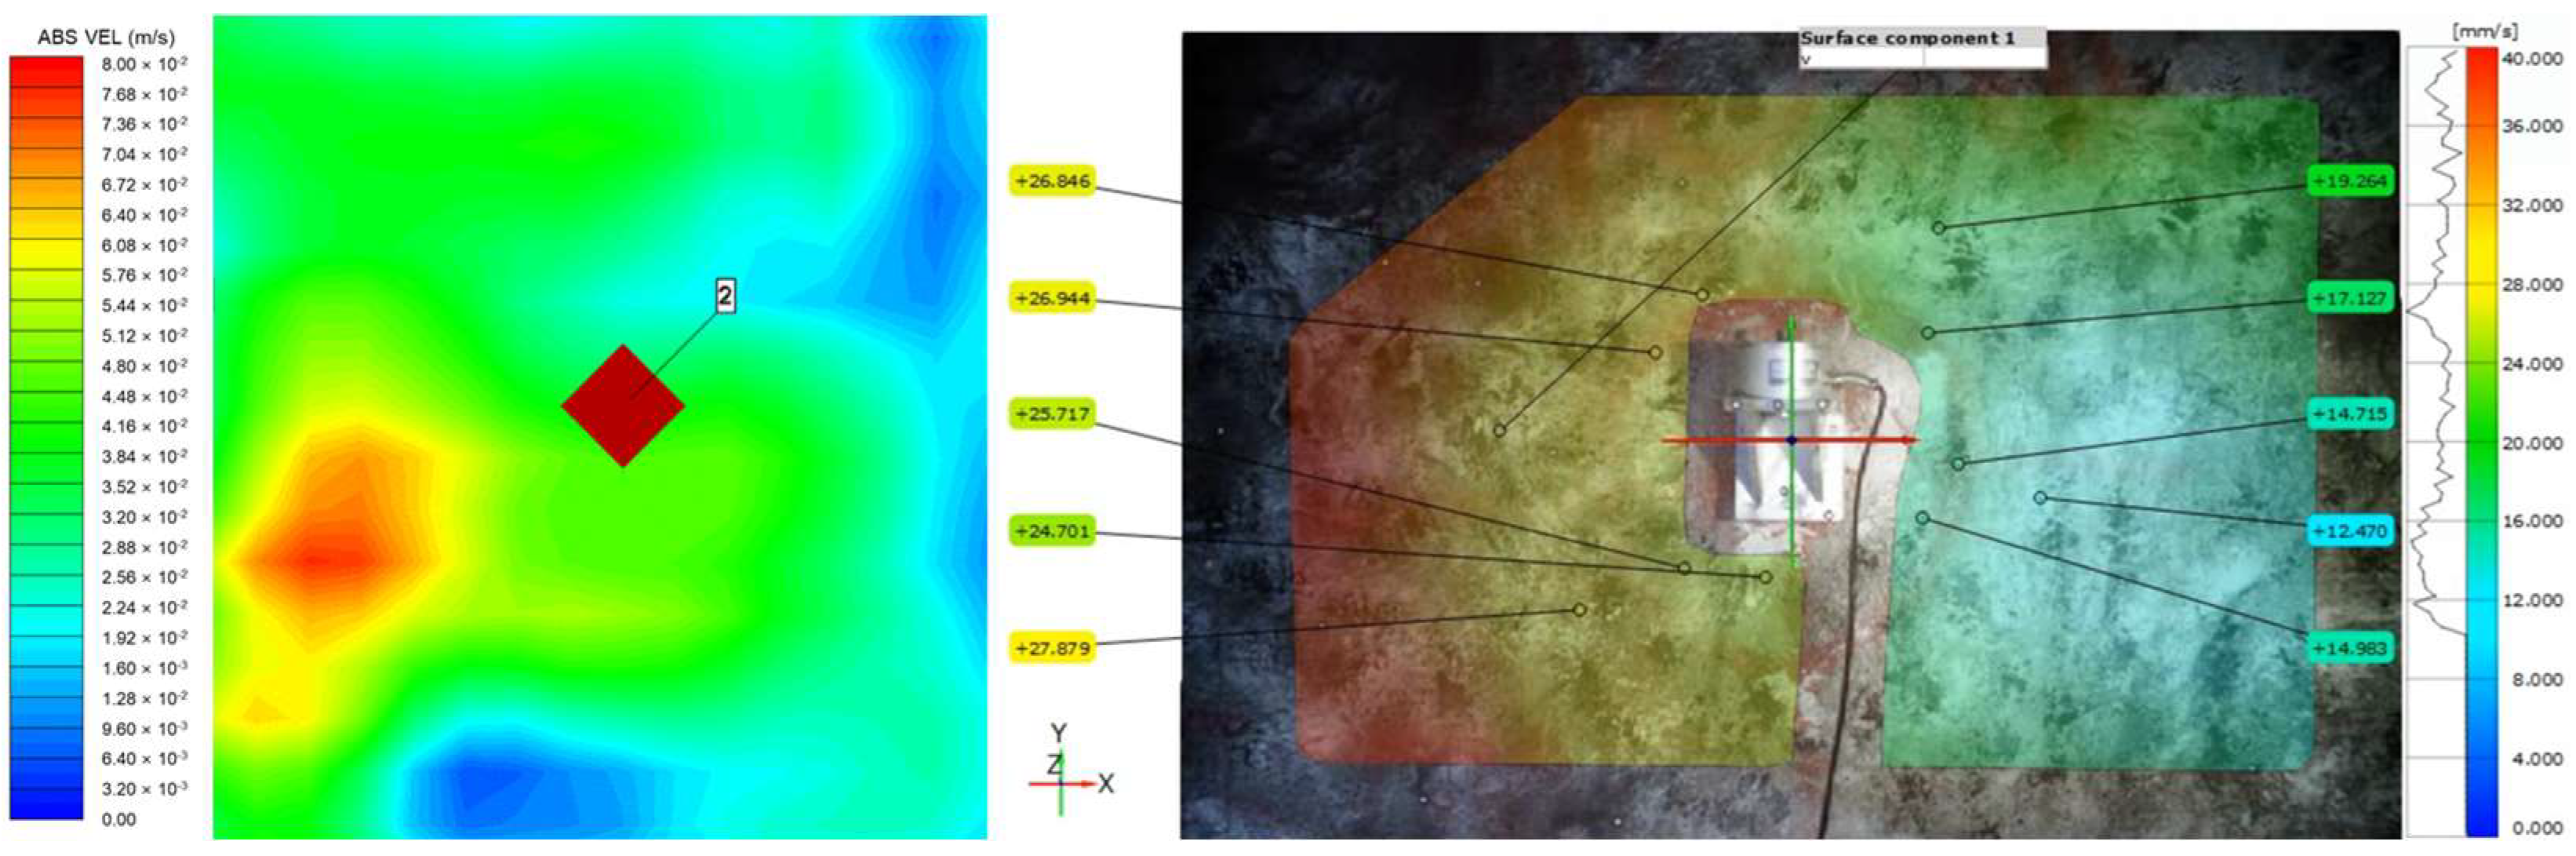
4.3. Numerical Simulation Results

The size of the numerically modeled mine gallery was 50 m wide and 50 m long. Two mine tunnels were modeled, and an explosion load (weight per delay of ANFO 25 kg) was applied to the right tunnel face. A vibration gauge was set at 10 m intervals in the left tunnel (Figure 10).
Figure 11 shows the vibration propagation according to time after blasting at the mine face of the left tunnel. The vibration velocity at the left mine gallery of the blasting face was 17–22 mm/s after blasting for 2 s. At a location (gauge 3) 40 m diagonal from the blasting face, which was the 3D DIC measurement area, the vibration velocity of the numerical model was calculated as 13.5 mm/s 15 s after blasting. The range of vibration velocity in the surrounding gauge point was between 12 and 17 mm/s, thus indicating that it was similar to the dominant value in the real vibration measurement. The vibration velocity 20 s after blasting gradually decreased to zero (Figure 12). Figure 13 compares the contours at the same step point (0.87 s after blasting) at the actual measurement point #2. The average vibration speed of the target area was 36 mm/s in numerical analysis and about 34 mm/s in DIC. The contour pattern was also similar. The contour pattern in which the value on the left side with the blast vibration source (blasting point) was higher than that on the right side appeared similar to both numerical and DIC measurements.

5. Discussion

In this study, a technique for underground mining known as DIC was used to measure displacements and vibrations in rock pillars caused by blasting. Measurements using the DIC technique have the advantage that they are rarely affected by the shape, surface state, and temperature of the measurement specimen, unlike conventional contact-type sensors. In addition, the DIC system is suitable for real-time monitoring of damage to rocks and structures owing to blasting because it can measure vibrations and displacements at a point on the target. Therefore, the applicability of DIC in mine tunnels was confirmed through field experiments performed in this study. As a result, the stereo camera and DIC technique showed similar accuracy to the conventional contact measuring instrument used in the field. It also showed a similar trend to the vibration velocity value determined through numerical analysis.
Furthermore, the field experiments performed in this study had some limitations and additional considerations. The stereo camera holder and tripod used in this experiment were fixed to the ground in the tunnel through anchoring, and the device was set up so that the entire measuring equipment behaved as a rigid body. In this experiment, the effect due to the vibration of the equipment itself was not detected in the results. However, approaching the blast point can affect the measuring equipment. In previous studies, vibration measurement was performed using a high-speed camera and the DIC technique on a laboratory scale. This is the first study to evaluate the applicability of a high-speed camera and DIC for the actual blasting vibration of an underground mine. In addition, it can be utilized as a technology to replace the conventional vibration measuring instruments used in underground mining sites.

6. Conclusions

In this study, the vibration measurement performance of the underground mining tunnel wall due to blasting was evaluated using a high-speed stereo camera and DIC technique. The applicability of the high-speed camera and DIC was confirmed by comparing the vibration value through numerical analysis with the conventional measurement method, and the limitations of the technology and further research directions are summarized below.
  • The conventionally measured data and data obtained using DIC were compared, and the results showed that both the peak displacement and the peak particle velocity were very similar to the actual measured values.
  • The above results confirmed the feasibility of using a blasting displacement and vibration measurement system in conjunction with the DIC technique and a stereo camera system and high-speed camera.
  • A camera with a capture speed that is 10–20 times faster than the vibration frequency is commonly required to precisely measure vibrations with DIC. Although the range of blast-induced natural frequencies varies depending on the site, an HD ultrahigh-speed camera of at least 3000 fps is required to analyze blasting vibration waveforms more precisely.
  • As a result of comparing the DIC results for blast vibration with the measured values of the contact sensor through field tests, the maximum displacement and vibration speeds were found to be 86 and 93% accurate, respectively. In addition, as a result of numerical analysis through blast modeling, the vibration velocity caused by the explosion and the contour pattern generated on the tunnel wall were similar to the DIC results. Accordingly, it is judged that high-speed cameras and DICs can be used to measure blast vibration in underground mines.
  • The experiments in this study were conducted within a limited ROI. However, it is expected that the configuration of a stereo DIC system capable of measuring a wider ROI can ensure applicability and utilization in various blast engineering fields, such as the evaluation of the stability of advanced length during nearby tunnel excavations, real-time stability of adjacent rock pillars, and monitoring of multiple blast displacements on the object of interest at remote distances.
  • In this study, we focused on evaluating the applicability of high-speed cameras and DICs to actual blasting sites. The accuracy compared to the measured value of the existing contact sensor may be insufficient; however, it is judged that an experiment to establish the stereo system conditions optimized for the field is necessary, which can be achieved by adjusting the distance to the baseline of the stereo camera and the target plane in the tunnel. In addition, in order to reduce the measurement cost due to the use of two or more high-speed cameras, it will be necessary to maximize cost-effectiveness by applying stereo DIC with a single camera.

Author Contributions

Conceptualization, S.S.; methodology, S.S.; software, S.S. and Y.K.; formal analysis, S.S. and Y.K.; writing—original draft preparation, S.S. and M.C.; writing—review and editing, S.S., Y.K. and M.C. All authors have read and agreed to the published version of the manuscript.

Funding

This research was supported by a grant from the project “Development of Smart Complex Solution for Large Deep Underground Space Using Artificial Intelligence” which was funded by the Korean Institute of Civil Engineering and Building Technology (KICT) and the Construction Technology Research Program (22SCIP-C151438-04) funded by the Ministry of Land, Infrastructure, and Transport of the Korean government.

Data Availability Statement

Data sharing is not applicable to this article.

Conflicts of Interest

The authors declare no conflict of interest.

References

  1. Sutton, M.; Orteu, J.; Schreier, H. Image, Correlation for Shape, Motion, and Deformation Measurements: Basic Concepts, Theory and Application; Springer Science Business Media LLC: Berlin/Heidelberg, Germany, 2009. [Google Scholar]
  2. Pan, B.; Qian, K.; Xie, H.; Asundi, A. Two-dimensional digital image correlation for in-plane displacement and strain measurement: A Review. Meas. Sci. Technol. 2009, 20, 062001. [Google Scholar] [CrossRef]
  3. Sutton, M.A.; Hild, F. Recent Advances and Perspectives in Digital Image Correlation. Exp. Mech. 2015, 55, 1–8. [Google Scholar] [CrossRef]
  4. Pan, B. Digital image correlation for surface deformation measurement: Historical developments, recent advances and future goals. Meas. Sci. Technol. 2018, 29, 082001. [Google Scholar] [CrossRef]
  5. Maccioni, L.; Concli, F. Fracture locus of a CORTEN steel: Finite Element calibration based on experimental results. Procedia Struct. Integr. 2019, 24, 738–745. [Google Scholar] [CrossRef]
  6. Farahani, B.V.; de Melo, F.Q.; Tavares, P.J.; Moreira, P.M.G.P. New approaches on the stress intensity factor characterization—Review. Procedia Struct. Integr. 2020, 28, 226–233. [Google Scholar] [CrossRef]
  7. Lecompte, D.; Vantomme, J.; Sol, H. Crack Detection in a Concrete Beam using Two Different Camera Techniques. Struct. Health Monit. 2006, 5, 59–68. [Google Scholar] [CrossRef]
  8. Jolin, M.; Küntz, M.; Bastien, J.; Perez, F.; Hild, F. Digital image correlation analysis of crack behaviour in a reinforced concrete beam during a load test. Can. J. Civ. Eng. 2006, 33, 1418–1425. [Google Scholar]
  9. Destrebecq, J.-F.; Toussaint, E.; Ferrier, E. Analysis of Cracks and Deformations in a Full Scale Reinforce Concrete Beam using a Digital Image Correlation Technique. Exp. Mech. 2011, 51, 879–890. [Google Scholar] [CrossRef]
  10. Mojsilović, N.; Salmanpour, A.H. Application of Digital Image Correlation for strain measurements of large masonry walls. In Proceedings of the APCOM & ISCM, Zurich, Switzerland, 11–14 December 2013. [Google Scholar]
  11. Ghorbani, R.; Matta, F.; Sutton, M. Full-Field Deformation Measurement and Crack Mapping on Confined Masonry Walls Using Digital Image Correlation. Exp. Mech. 2014, 55, 227–243. [Google Scholar] [CrossRef]
  12. Malesa, M.; Malowany, K.; Tomczak, U.; Siwek, B.; Kujawińska, M.; Siemińska-Lewandowska, A. Application of 3D digital image correlation in maintenance and process control in industry. Comput. Ind. 2013, 64, 1301–1315. [Google Scholar] [CrossRef]
  13. Shao, X.X.; Chen, Z.N.; Dai, X.J.; He, X.Y. Camera array-based digital image correlation for high-resolution strain measurement. Rev. Sci. Instrum. 2018, 89, 105110. [Google Scholar] [CrossRef] [PubMed]
  14. Beberniss, T.J.; Ehrhardt, D.A. High-speed 3D digital image correlation vibration measurement: Recent advancements and noted limitations. Mech. Syst. Signal Process. 2017, 86, 35–48. [Google Scholar] [CrossRef]
  15. Baqersad, J.; Poozesh, P.; Niezrecki, C.; Avitabile, P. Photogrammetry and optical methods in structural dynamics—A review. Mech. Syst. Signal Process. 2017, 86, 17–34. [Google Scholar] [CrossRef]
  16. Srivastava, V.; Baqersad, J. A multi-view optical technique to extract the operating deflection shapes of a full vehicle using digital image correlation. Thin-Walled Struct. 2019, 145, 106426. [Google Scholar] [CrossRef]
  17. Huňady, R.; Hagara, M. A new procedure of modal parameter estimation for high-speed digital image correlation. Mech. Syst. Signal Process. 2017, 93, 66–79. [Google Scholar] [CrossRef]
  18. Bharadwaj, K.; Sheidaei, A.; Afshar, A.; Baqersad, J. Full field strain prediction using mode shapes measured with digital image correlation. Measurement 2019, 139, 326–333. [Google Scholar] [CrossRef]
  19. Pan, B.; Yu, L.; Zhang, Q. Review of single-camera stereo-digital image correlation techniques for full-field 3D shape and deformation measurement. Sci. China Technol. Sci. 2018, 61, 2–20. [Google Scholar] [CrossRef] [Green Version]
  20. Genovese, K.; Casaletto, L.; Rayas, J.; Flores, V.; Martinez, A. Stereo-Digital Image Correlation (DIC) measurements with a single camera using a biprism. Opt. Lasers Eng. 2013, 51, 278–285. [Google Scholar] [CrossRef]
  21. Pankow, M.; Justusson, B.; Waas, A.M. Three-dimensional digital image correlation technique using single high-speed camera for measuring large out-of-plane displacements at high framing rates. Appl. Opt. 2010, 49, 3418–3427. [Google Scholar] [CrossRef]
  22. Yu, L.; Pan, B. Single-camera high-speed stereo-digital image correlation for full-field vibration measurement. Mech. Syst. Signal Process. 2017, 94, 374–383. [Google Scholar] [CrossRef]
  23. Yu, L.; Pan, B. Full-frame, high-speed 3D shape and deformation measurements using stereo-digital image correlation and a single color high-speed camera. Opt. Lasers Eng. 2017, 95, 17–25. [Google Scholar] [CrossRef]
  24. Xu, Z.; Yang, J.; Guo, L. Study of the Splitting Crack Propagation Morphology Using High Speed 3D DIC. Explos. Shock Waves 2016, 3, 38–41. [Google Scholar]
  25. Zhao, Y.; Gao, Y.; Wu, S.; Chen, L.; Zhang, C. Experimental and numerical study of failure characteristics of brittle rocks with single internal 3D open-type flaw. Acta Geotech. 2021, 16, 3087–3113. [Google Scholar] [CrossRef]
  26. Lin, Q.; Labuz, J. Fracture of sandstone characterized by digital image correlation. Int. J. Rock Mech. Min. Sci. 2013, 60, 235–245. [Google Scholar] [CrossRef]
  27. Zhang, N.; Hedayt, A.; Sosa, H.G.B.; Bernal, R.P.H.; Tupa, N.; Morales, I.Y.; Loza, R.S.C. Fracture Properties of the Gold Mine Tailings-based Geopolymer under Model Loading Condition through Semi-circular Bend Tests with Digital Image Correlation. Theor. Appl. Fract. Mech. 2021, 116, 103116. [Google Scholar] [CrossRef]
  28. Beberniss, T.; Spottswood, S.; Eason, T. High-Speed Digital Image Correlation Measurements of Random Nonlinear Dynamic Response. In Proceedings of the SEM Annual Conference, Uncasville, CT, USA, 10–13 June 2011. [Google Scholar]
  29. Beberniss, T.; Spottswood, S.; Eason, T. High-Speed 3D Digital Image Correlation Measurements of Long-duration Random Vibration; Recent Advancements and Noted Limitations. In Proceedings of the ISMA Biennial Conference, Lueven, Belgium, 17–19 September 2012. [Google Scholar]
  30. Beberniss, T.; Ehrhardt, D. Temporal Aliasing in High-speed 3-Dimmensional Digital Image Correlation Vibration Measurement. In Proceedings of the AIAA SciTech, Kissimmee, FL, USA, 5–9 January 2015. [Google Scholar]
  31. Chao, Y.J.; Sutton, M.A. Application of Stereo Vision to Three-dimensional Deformation Analyses in Fracture Experiments. Opt. Eng. 1994, 33, 981–990. [Google Scholar] [CrossRef]
  32. Lan, I.-F.; Hung, S.-C.; Chen, C.-Y.; Niu, Y.-M.; Shiuan, J.-H. An Improved Simple Method of Deducing JWL Parameters from cylinder expansion test. Propellants Explos. Pyrotech. 1993, 18, 18–24. [Google Scholar] [CrossRef]
  33. Riedel, W.; Thomaand, K.; Hiermaier, S. Penetration of Reinforced Concrete by BETA-B-500-numerical Analysis Using a New Macroscopic Concrete Model for Hydrocodes. In Proceedings of the 9th International Symposium on Interaction of the Effect of Munitions with Structures, Berlin, Germany, 3–7 May 1999; pp. 315–322. [Google Scholar]
  34. Nariseti, C. Quantification of Damage in Selected Rocks due to Impact with Tungsten Carbide Bits. Master’s Thesis, University of Toronto, Toronto, ON, Canada, 2013. [Google Scholar]
Figure 1. Schematic showing the correlation of the images of a reference subset before deformation and the target (or deformed) subset after deformation.
Remotesensing 14 03133 g001
Figure 2. Layout of blasting face and measurement point: (a) description of the measurement and blast location inside the mine tunnel; (b) tunnel interior by laser scanning.
Remotesensing 14 03133 g002
Figure 3. Photos of blasting face and measurement point: (a) DIC and high-speed camera equipment configuration; (b) installation of contact vibration meter.
Remotesensing 14 03133 g003
Figure 4. Speckle pattern in the region of interest (ROI).
Remotesensing 14 03133 g004
Figure 5. Blasting displacement curves of rock pillars ROI (DIC system).
Remotesensing 14 03133 g005
Figure 6. Displacement of rock pillars ROI at each timepoint after experimental blasting: (a) 2 s, (b) 4 s, (c) 6 s, (d) 8 s, (e) 10 s, and (f) 12 s.
Remotesensing 14 03133 g006
Figure 7. Vibration of rock pillars ROI after blasting.
Remotesensing 14 03133 g007
Figure 8. Vibration of rock pillars ROI at each time point after experimental blasting: (a) 0.45 s, (b) 0.6 s, (c) 0.7 s, and (d) 0.86 s.
Remotesensing 14 03133 g008
Figure 9. Fast Fourier transform results of real vibration values. At the top of each graph, the Furier spectrum value of the frequency indicated by a triangle marker is displayed.
Remotesensing 14 03133 g009
Figure 10. Layout of AUTODYN mine blasting model and vibration gauge point.
Remotesensing 14 03133 g010
Figure 11. Vibration contours of the rock pillar at each step point after blasting: (a) 2 s, (b) 5 s, (c) 15 s, and (d) 20 s.
Remotesensing 14 03133 g011
Figure 12. Vibration velocity at each gauge location set in the rock pillar.
Remotesensing 14 03133 g012
Figure 13. Comparison of numerical analysis result (left) and DIC result (right).
Remotesensing 14 03133 g013
Table 1. Numerical constants used in AUTODYN for Limestone [34].
ParameterValueUnit
Reference density2.66g/cm3
EOS
Bulk modulus (A1)71.2GPa
Parameter A249.40GPa
Parameter A311.62GPa
Parameter B01.22-
Parameter B11.22-
Parameter T143.87GPa
Parameter T20.00-
Reference temperature300.00K
Specific heat654.00J/(kg·K)
Thermal conductivity0.00-
Strength
Shear modulus (G)24.2GPa
Compressive strength (fc)100MPa
Tensile strength (ft/fc)0.05-
Shear strength (fs/fc)0.07-
Intact failure surface constant (A)0.80-
Intact failure surface exponent (N)0.61-
Tens/Comp meridian ratio (Q)0.72-
Brittle to ductile transition0.01-
G 1.10-
Elastic strength/ft0.40-
Elastic strength/fc0.85-
Fractured strength constant (B)2.67-
Fractured strength constant (M)0.61-
Compressive strain rate0.025-
Tensile strain rate0.045-
Failure
Damage constant D10.005-
Damage constant D20.7-
Minimum strain to failure0.06-
Residual shear modulus fraction0.250-
Tensile failureHydro-
Table 2. Blasting design of experiments.
Charge Per Delay
(kg/Delay)
Charge Hole Diameter
(mm)
Charge
Density
(kg/m3)
Charge
Hole Length (m)
Charge
Length
(m)
Total Charge Explosives
(kg)
25 510.8 (ANFO)3.82.595.8
Table 3. Measured peak displacements (mm).
No.Tran (T)Vert (V)Long (L)
10.0660.007 0.015
20.0730.0080.017
30.0650.0290.011
Peak vector sum (PPV) (mm/s)20.617.436.8
Table 4. Comparison of measurement results with the DIC system.
TypeVibration MeasurementDICSimilarity (%)
Mean of the peak displacement (T) (mm)0.0680.07886
Mean of the peak particle velocity (mm/s)32.63593
Publisher’s Note: MDPI stays neutral with regard to jurisdictional claims in published maps and institutional affiliations.

