
Distribution, Magnitude, and Variability of Natural Oil Seeps in the Gulf of Mexico

 ,
,
Abstract
:
1. Introduction

| Literature Reference | Location | Geologic Features | Water Depth (m) | Flux |
|---|---|---|---|---|
| Agirrezabala and López-Horgue, 2017 [12] | Bay of Biscay | Authigenic carbonates, diapirs | ||
| Barberes et al., 2020 [13] | Iberian Basin | Authigenic carbonates, mud volcanoes | ||
| Bernardo and Bartolini, 2015 [14] | Western Caribbean, Panama | |||
| Bojesen-Koefoed et al., 2004 [15] | Baffin Bay, West Greenland | |||
| Burns et al., 2010 [16] | Timor Sea | Carbonate domes | 90 | |
| Camplin and Hall, 2014 [17] | Indonesia/Java Sea | Pockmarks, carbonates, mounds, locally formed hydrates | 1800 | |
| Cazzini et al., 2015 [18] | Adriatic Sea, Italy | Carbonate platforms | ||
| Chen and Hu, 2014 [19] | Cariaco Basin, Venezuela | |||
| Coughlan et al., 2021 [20] | Irish Sea | Pockmarks, mounds, authigenic carbonates, mud diapirs | >40 | |
| Cramer and Franke, 2005 [21] | Laptev Sea, NE Siberia | Gas hydrates | ||
| Dill and Kaufhold, 2018 [22] | Colombia | Mud volcanoes, diapirs | ||
| Dupré et al., 2015 [23] | Sea of Marmara | Carbonates, mud volcanoes, gas hydrates | Avg~600 | |
| Feng et al., 2018 [24] | South China Sea | Carbonates, mud volcanoes, pockmarks | ||
| Fildani et al., 2005 [25] | Talara Basin, NW Peru | Carbonates | ||
| Foster et al., 2015 [26] | Baffin Bay, eastern Canadian Arctic | |||
| Freire et al., 2011 [27] | Japan Sea | Gas hydrates, pockmarks, mounds | 900–1100 | |
| Freire et al., 2017 [28] | Espírito Basin, Brazil | Carbonates, salt diapirs | 2700 | |
| Gbadebo, 2010 [29] | SW Nigeria | |||
| Hakimi et al., 2018 [30] | Gulf of Aden, south of Yemen | Carbonates | ||
| Himmler et al., 2008 [31] | Southern Namibia | Carbonates | Onshore | |
| Hovland et al., 2012 [32] | North Sea | Salt diapirs, pockmarks | ||
| Intawong et al., 2019 [33] | Mozambique Channel | Pockmarks, carbonates | ||
| Ivanov et al., 2020 [34] | Black Sea | Mud volcanoes (Russian sector) | 1000–1050 | 400–3000 tons yr−1 (Georgian sector), 140–100 tons yr−1 (Turkish sector) |
| Ivanov et al., 2020 [4] | South Caspian Sea | Mud volcanoes | ||
| Ivanov and Gerivani, 2020 [35] | Persian Gulf, UAE | Carbonates, faults and folds, salt domes | ||
| Jatiault et al., 2018 [36] | Lower Congo Basin, Angola | Salt tectonics, pockmarks | 1200–2700 | 4380 m3 yr−1 oil |
| Jauer and Budkewitsch, 2010 [37] | Labrador Sea, Canada | Mounds, mud volcanoes | ||
| Johansen et al., 2017 [5] | Gulf of Mexico, GC600 and MC118 | Salt diapirs, gas hydrates, authigenic carbonate mounds | 850–1200 | 2.62–10.8 (oily), 62.2–101 (mixed), 188 (gas) m3 yr−1 |
| Leifer et al., 2004 [38] | Coal Oil Point, Santa Barbara, CA | Salt diapirs, mud volcanoes, mounds, brine pools | 20–70 | 1.5 × 10⁵ m3 d−1 gas, 80 bbl d−1 oil |
| Liira et al., 2019 [39] | Svalbard | Carbonates, pockmarks | ||
| Logan et al., 2010 [40] | Offshore Australia | Pockmarks, carbonates | ||
| Mitra et al., 2013 [41] | Offshore India | |||
| Mityagina and Lavrova, 2018 [42] | Eastern Black Sea | Mud volcanoes | ||
| Nemirovskaya and Sivkov, 2012 [43] | Baltic Sea | |||
| Nesbitt et al., 2013 [44] | NE Pacific, Cascadia margin, WA | Cascadia accretionary wedge, carbonates | ||
| Pinet et al., 2008 [45] | St. Lawrence Estuary, Canada | Pockmarks, seismic chimneys, carbonates | 65–355 | |
| Römer et al., 2012 [46] | Arabian Sea, offshore Pakistan | Mud volcanoes | ||
| Römer et al., 2014 [47] | Eastern Mediterranean Sea | Authigenic carbonates, pockmarks | 1000–1800 | |
| Sakran et al., 2016 [48] | Gulf of Suez | Carbonates | ||
| Short et al., 2007 [49] | Gulf of Alaska | 41–327 | ||
| Taylor et al., 2000 [50] | Blake Ridge, offshore S. Carolina, U.S. | Pockmarks, salt diapirs | ||
| Venkatesan et al., 2013 [51] | Alaskan Beaufort Sea | |||
| Zakharenko et al., 2019 [52] | Lake Baikal, Russia | Gas hydrates, mud volcanoes | 855–1370 | |
| Zelilidis et al., 2015 [53] | Ionian Sea, Greece | Carbonates, diapirs |
2. Materials and Methods
2.1. Datasets
2.2. Defining Seep Zones
2.3. Centerline Flux Estimation
3. Results
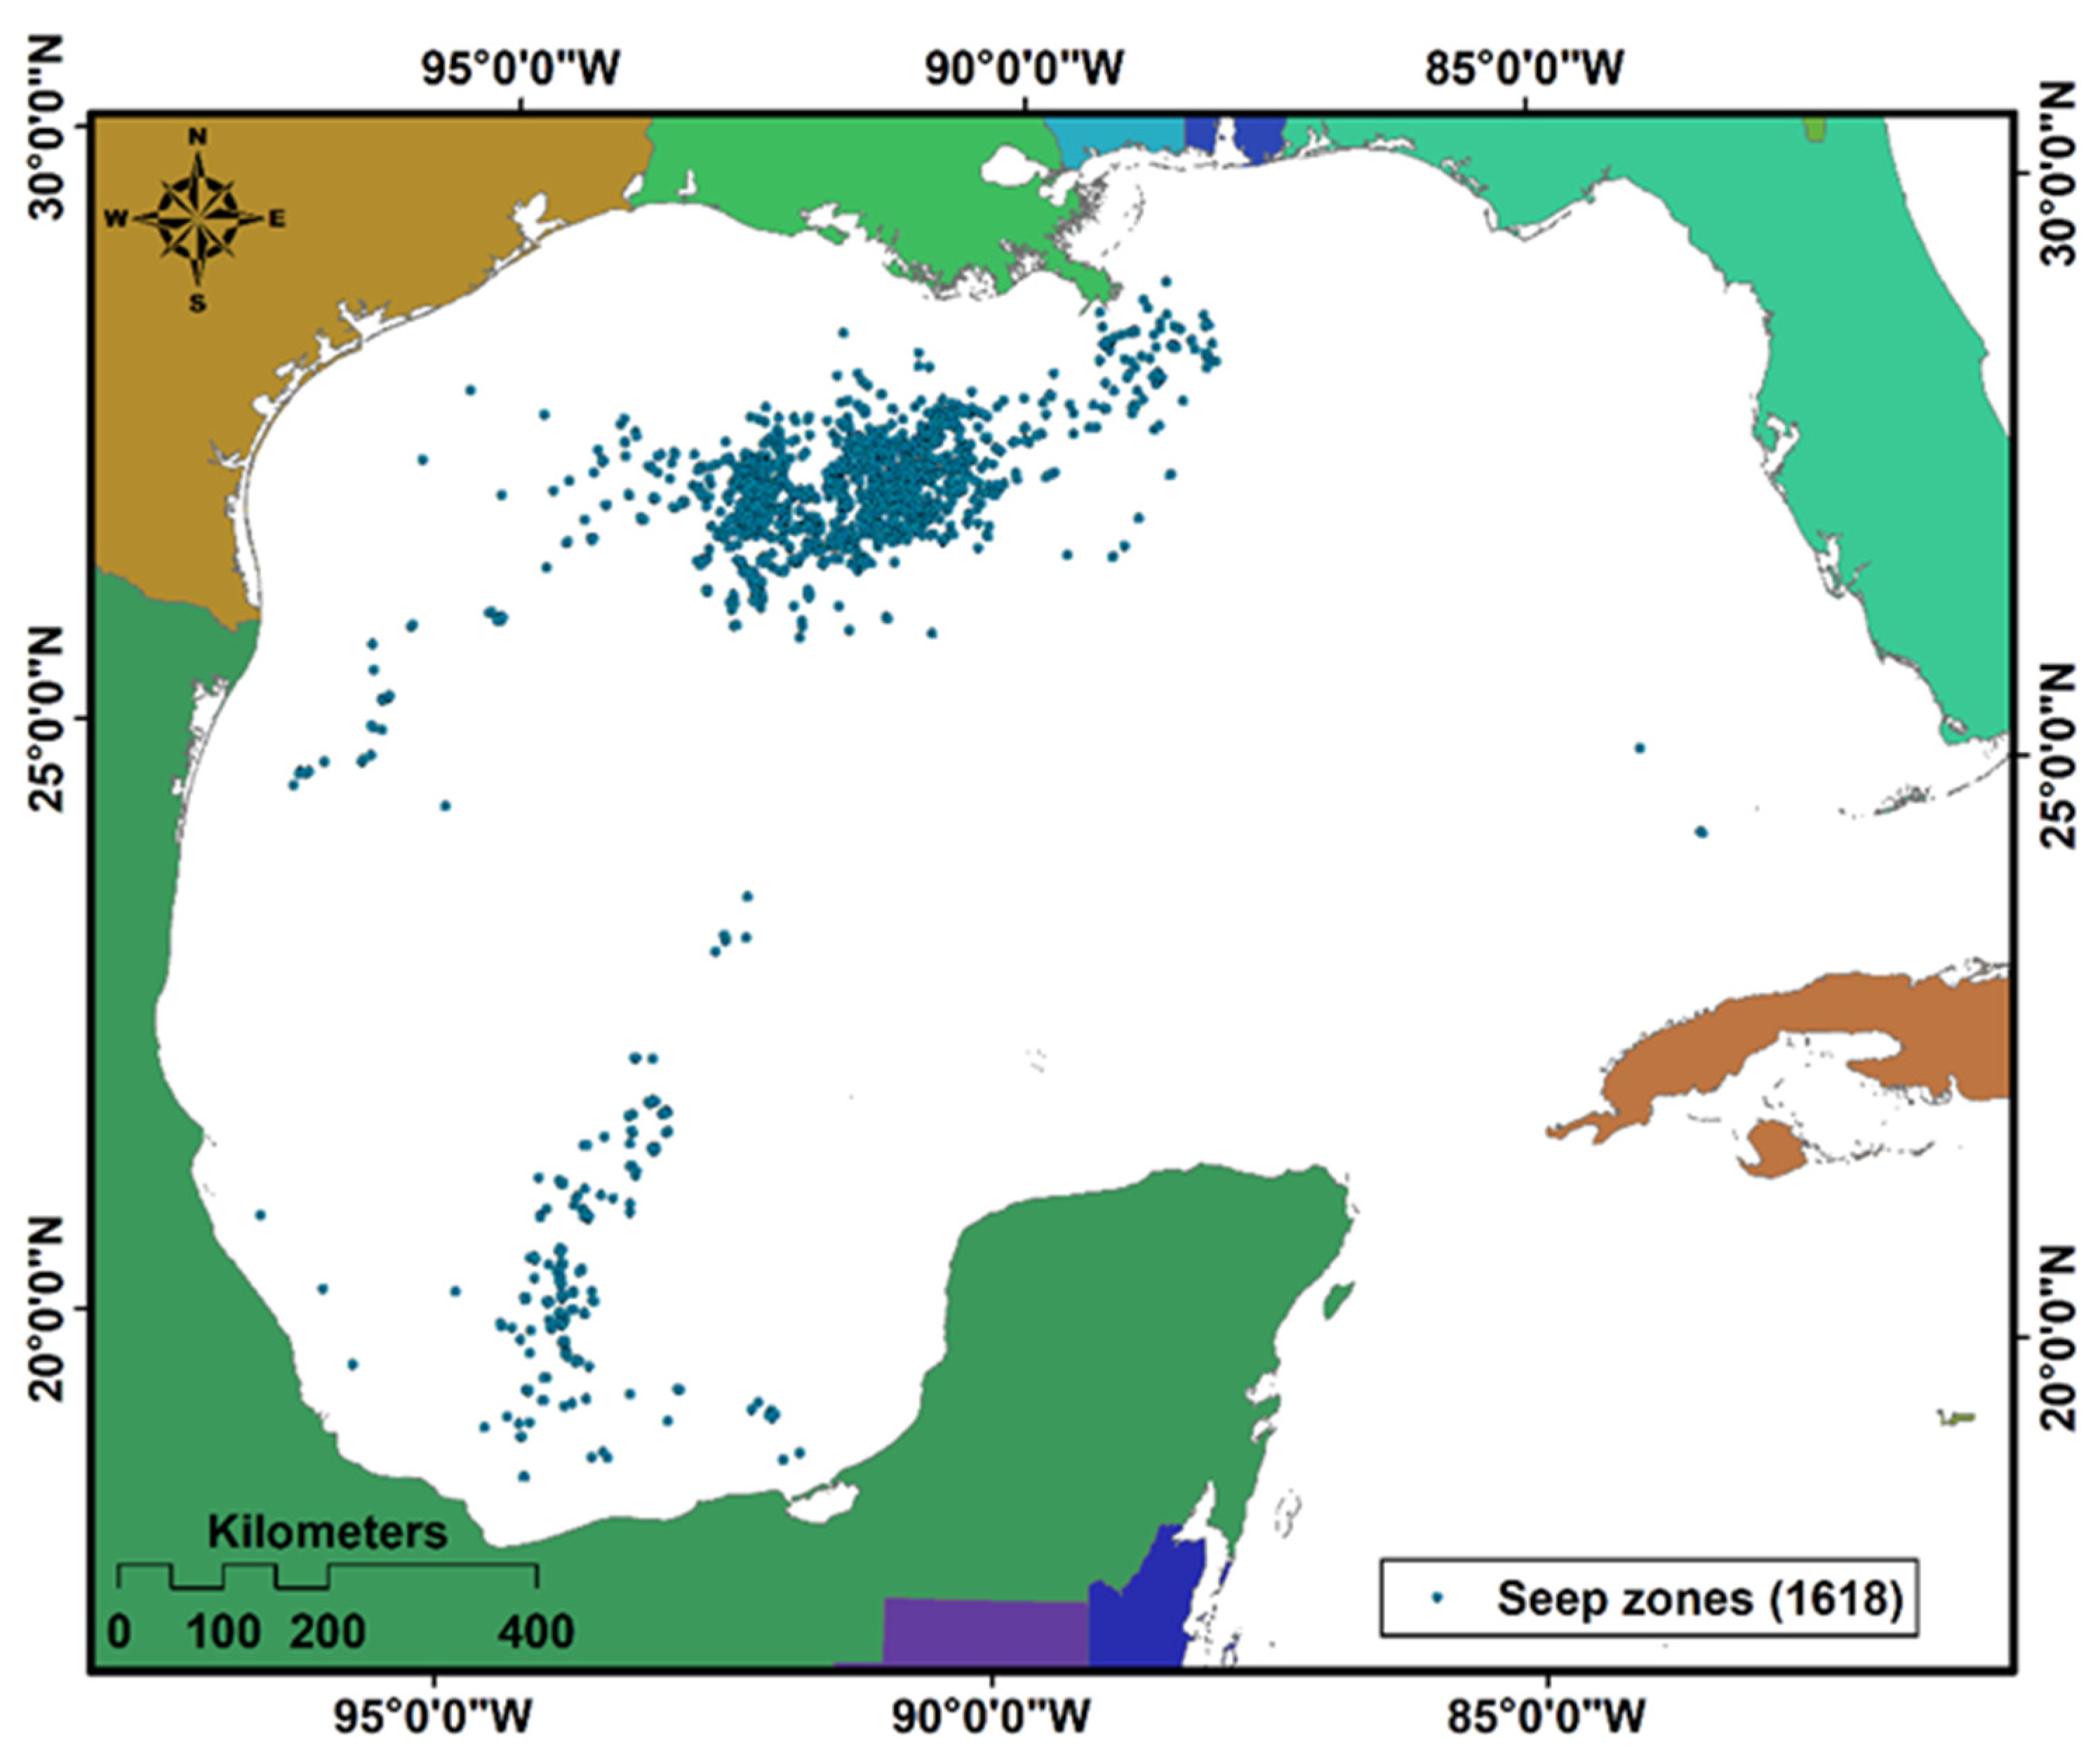
3.1. Seep Zones
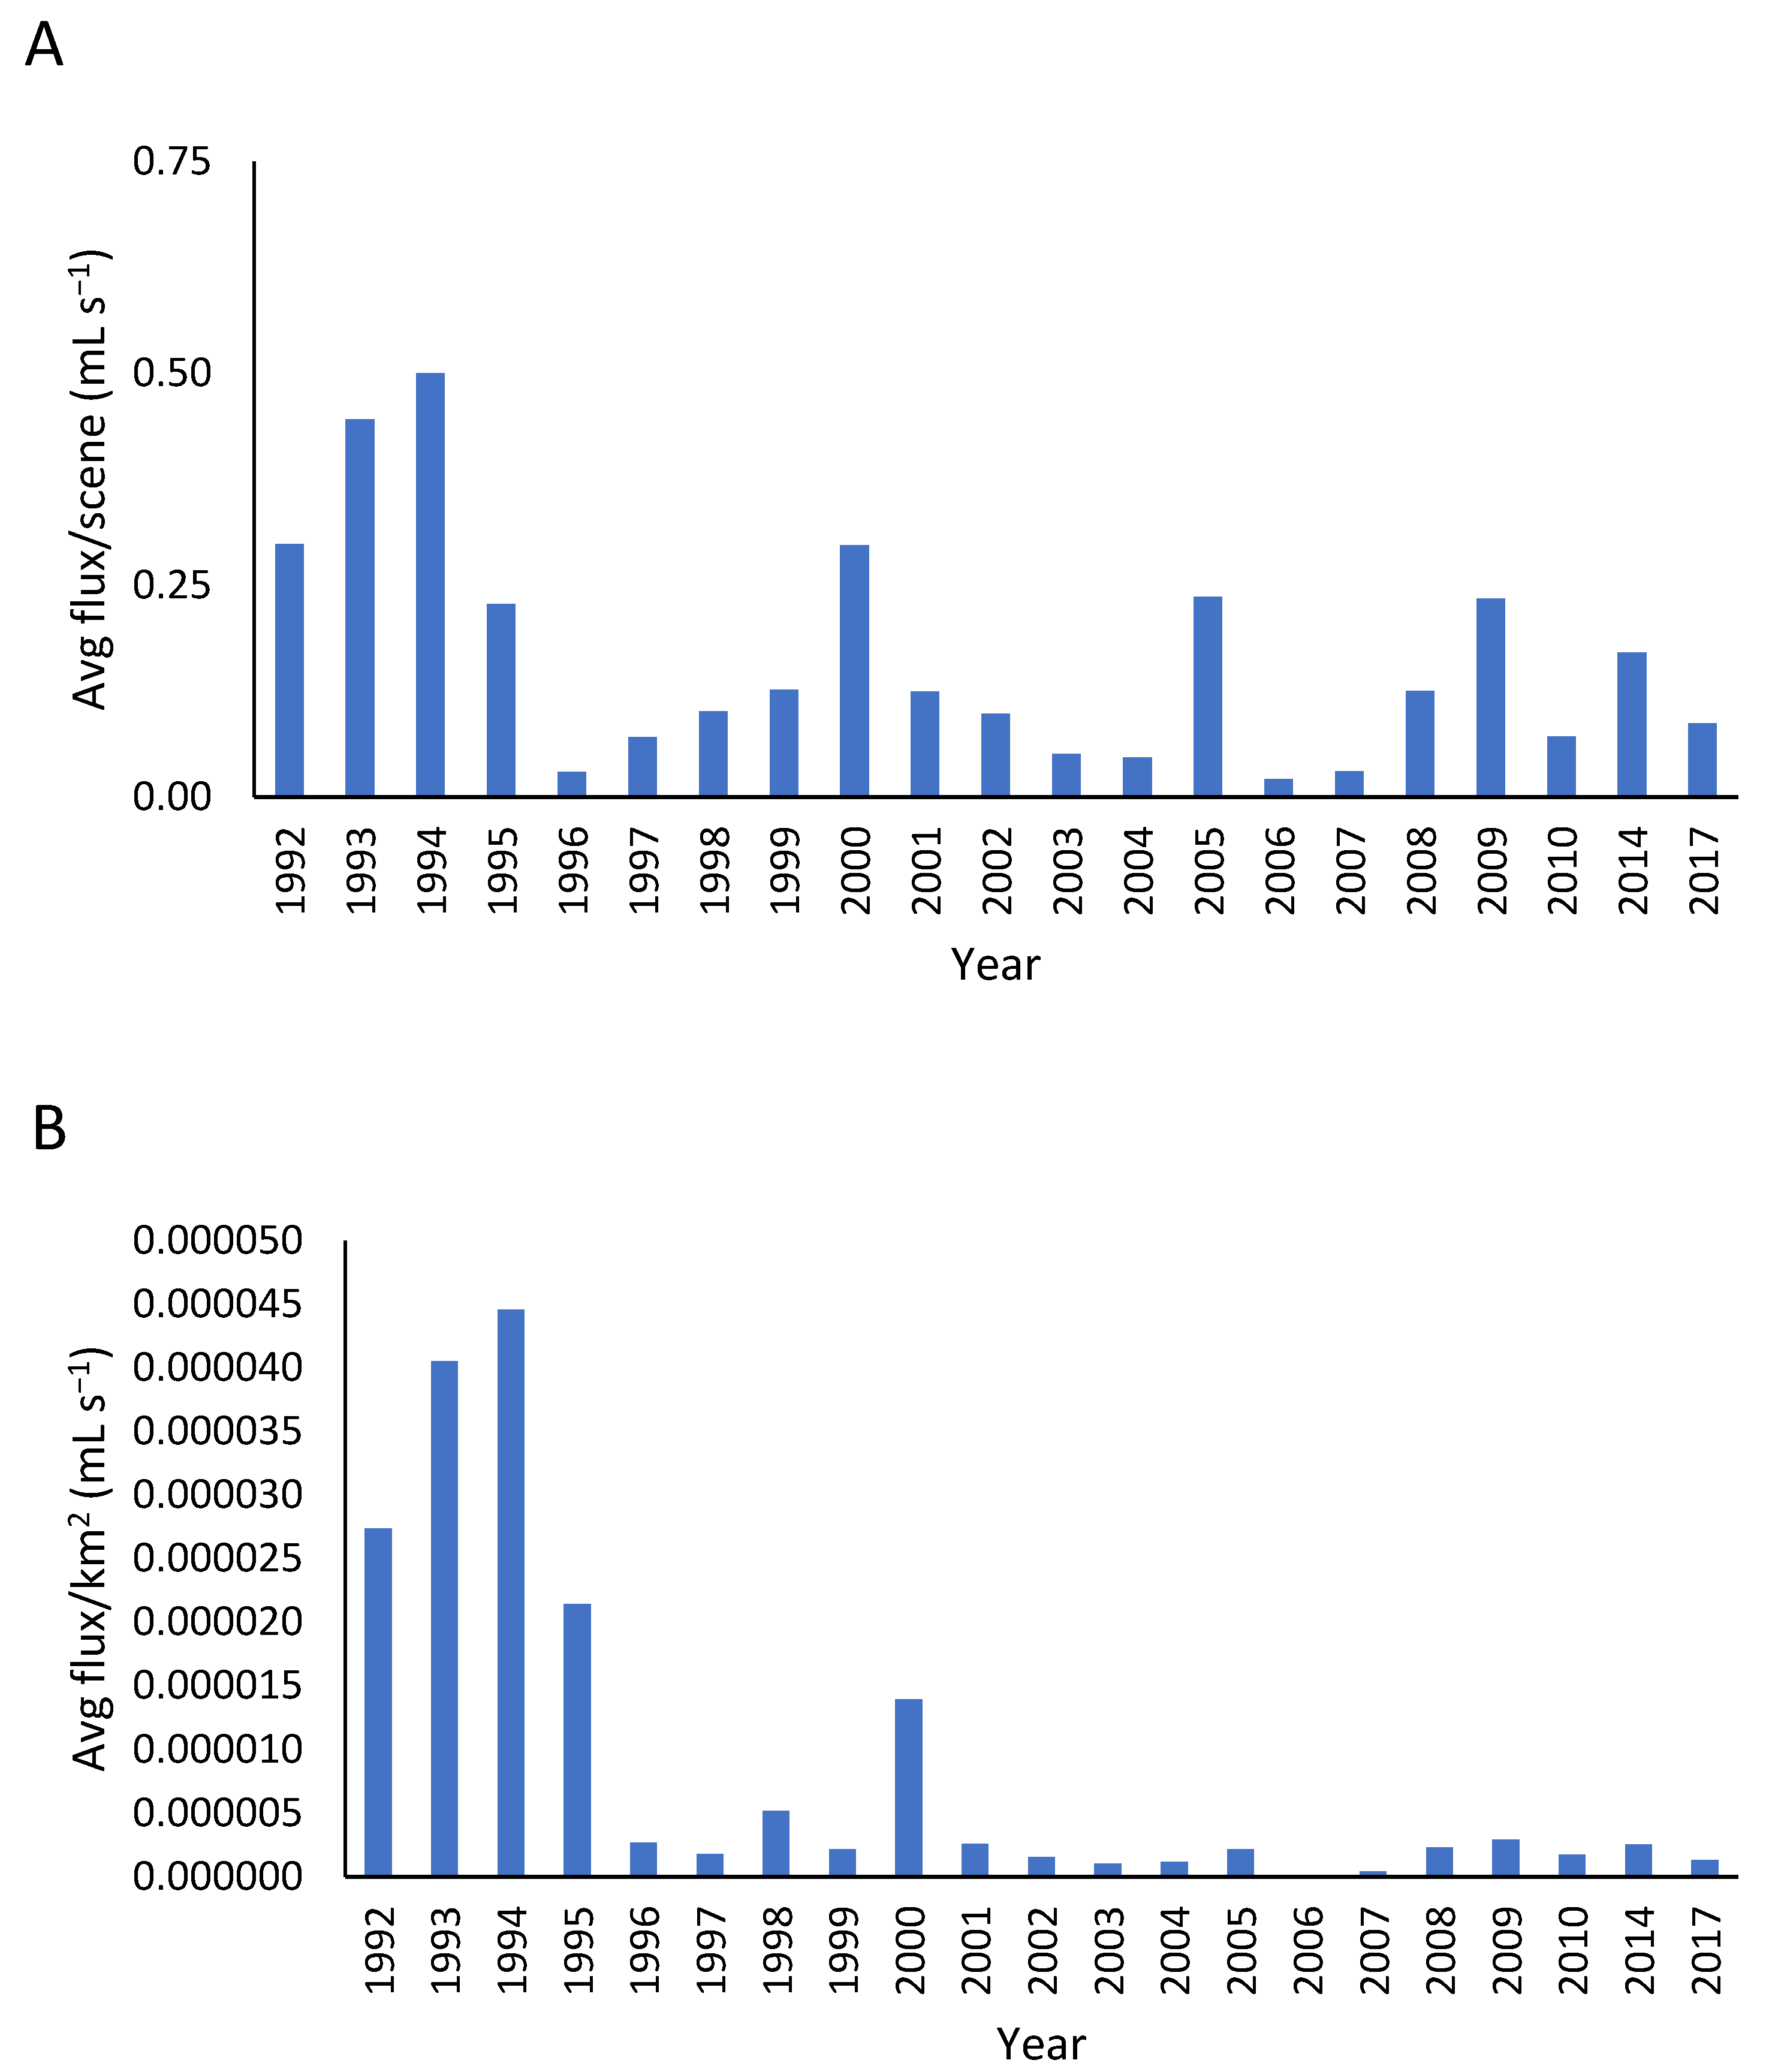
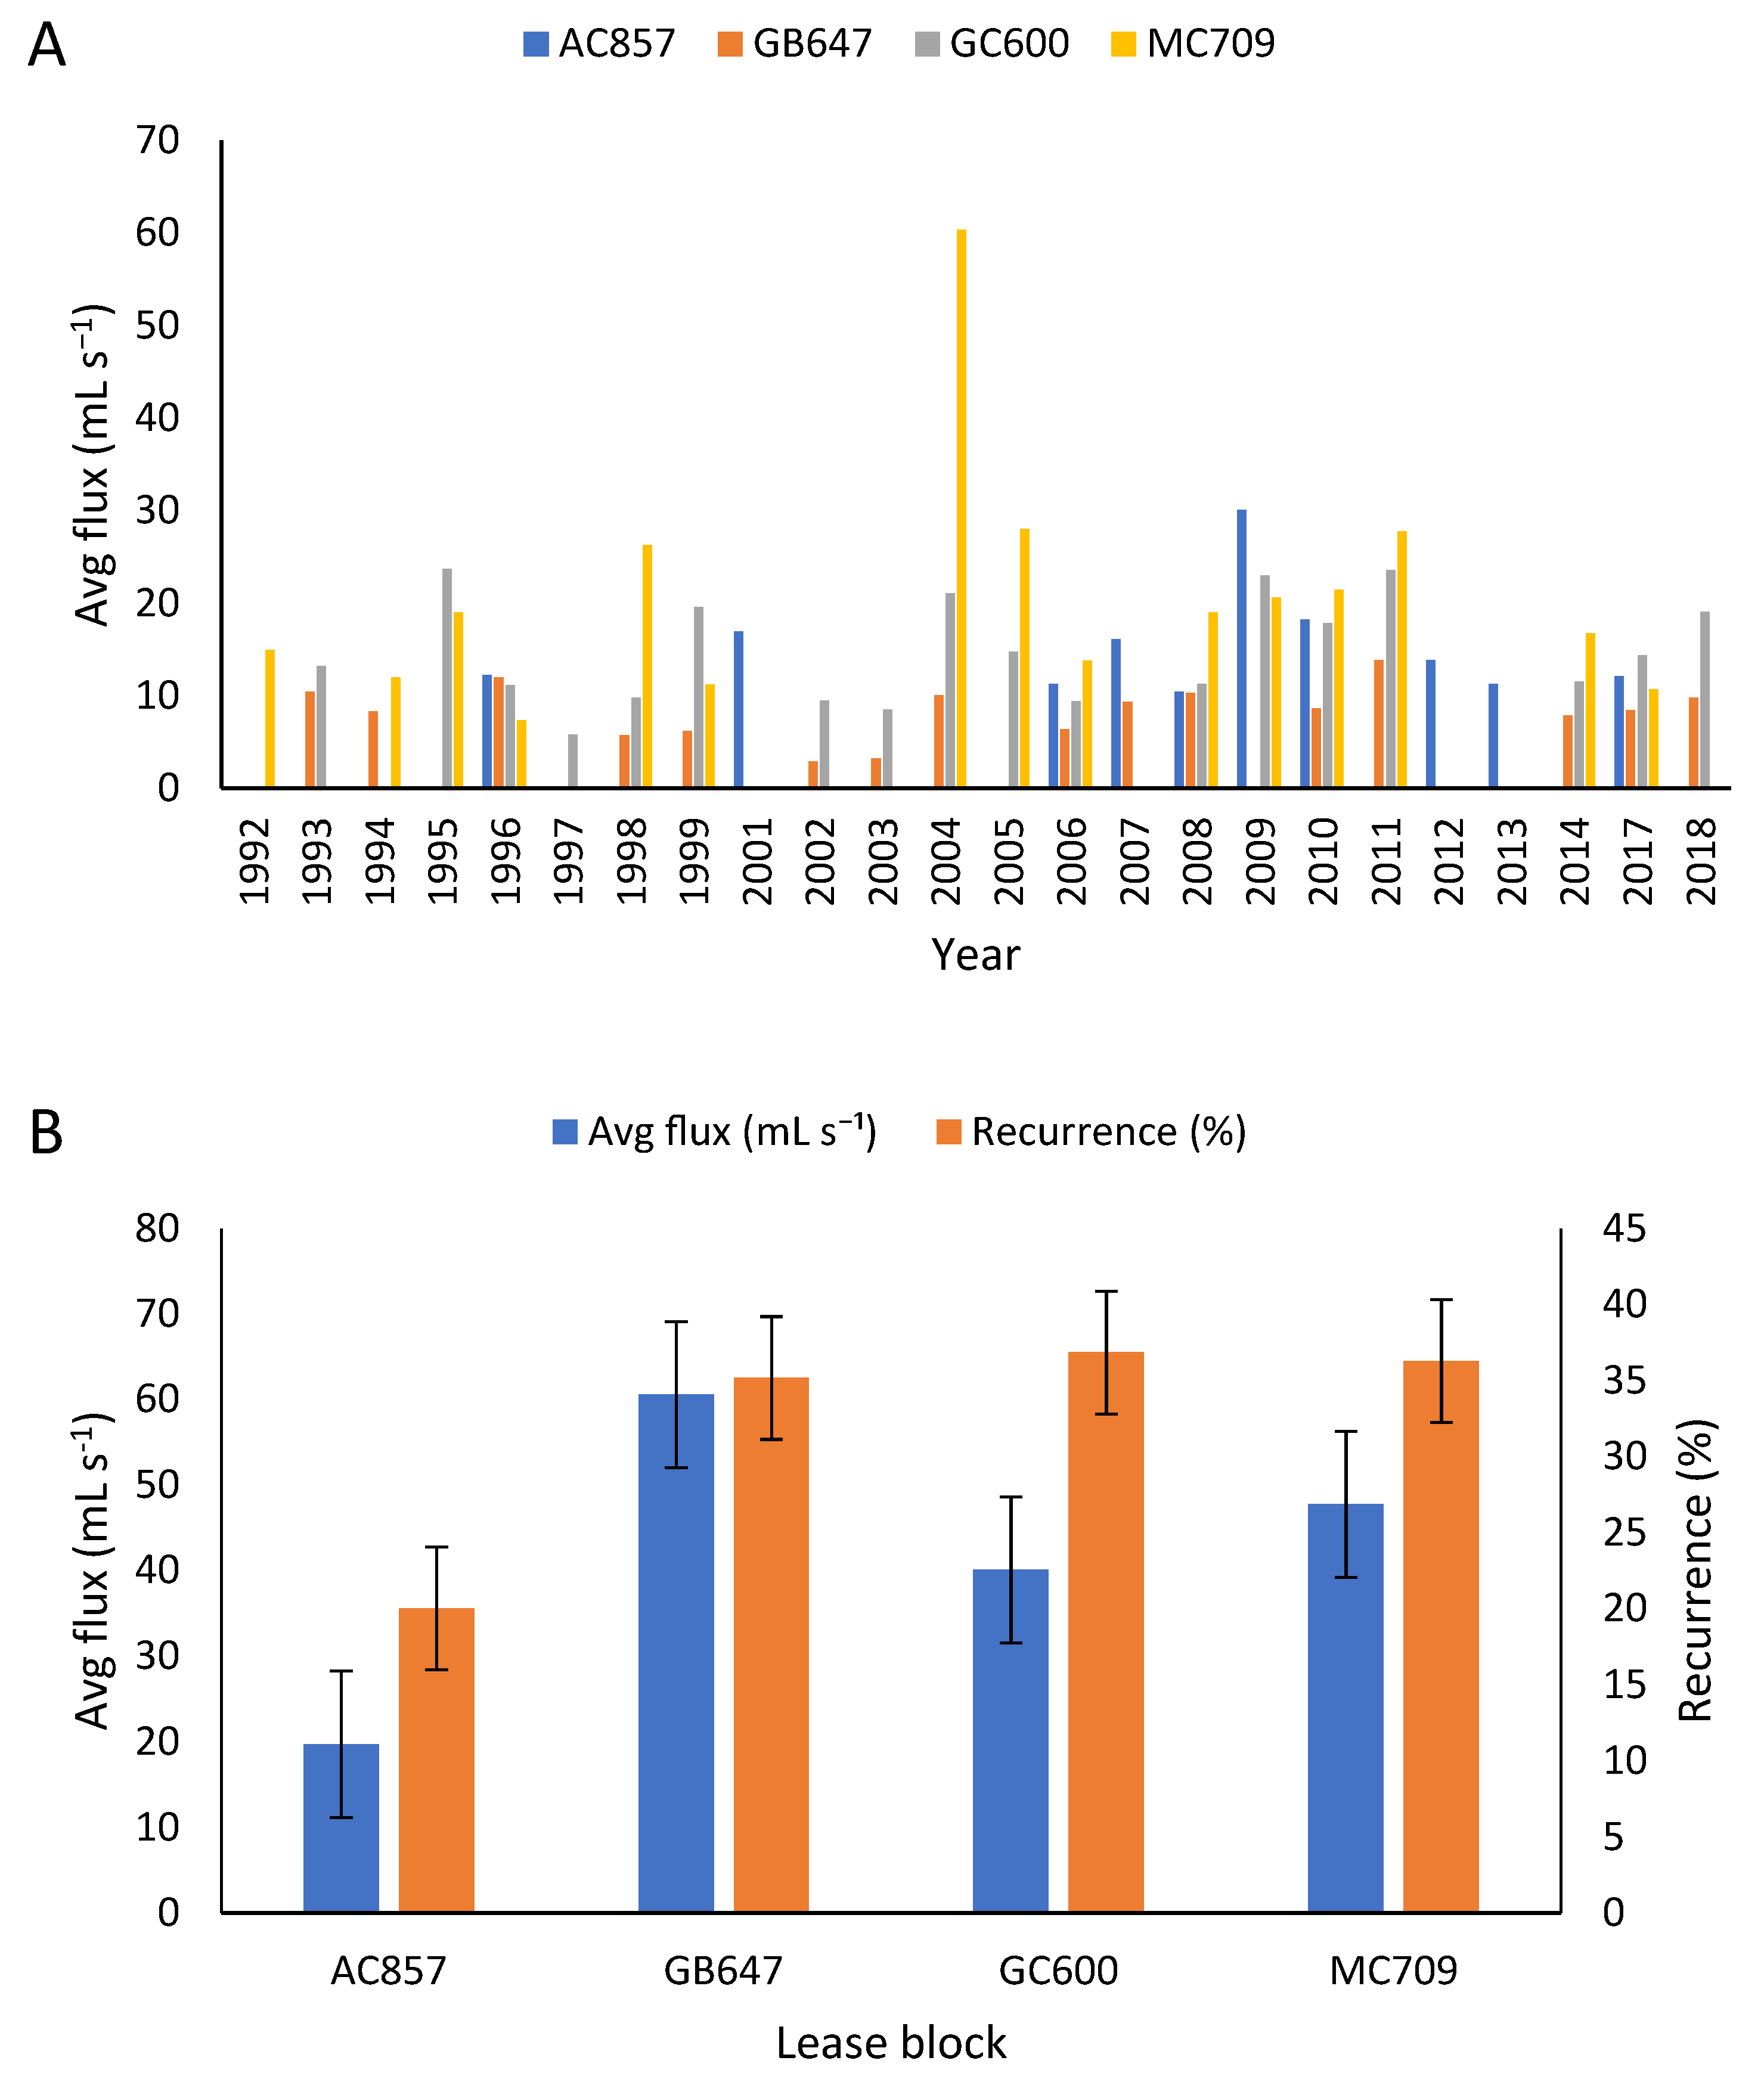
3.2. Flux Estimates
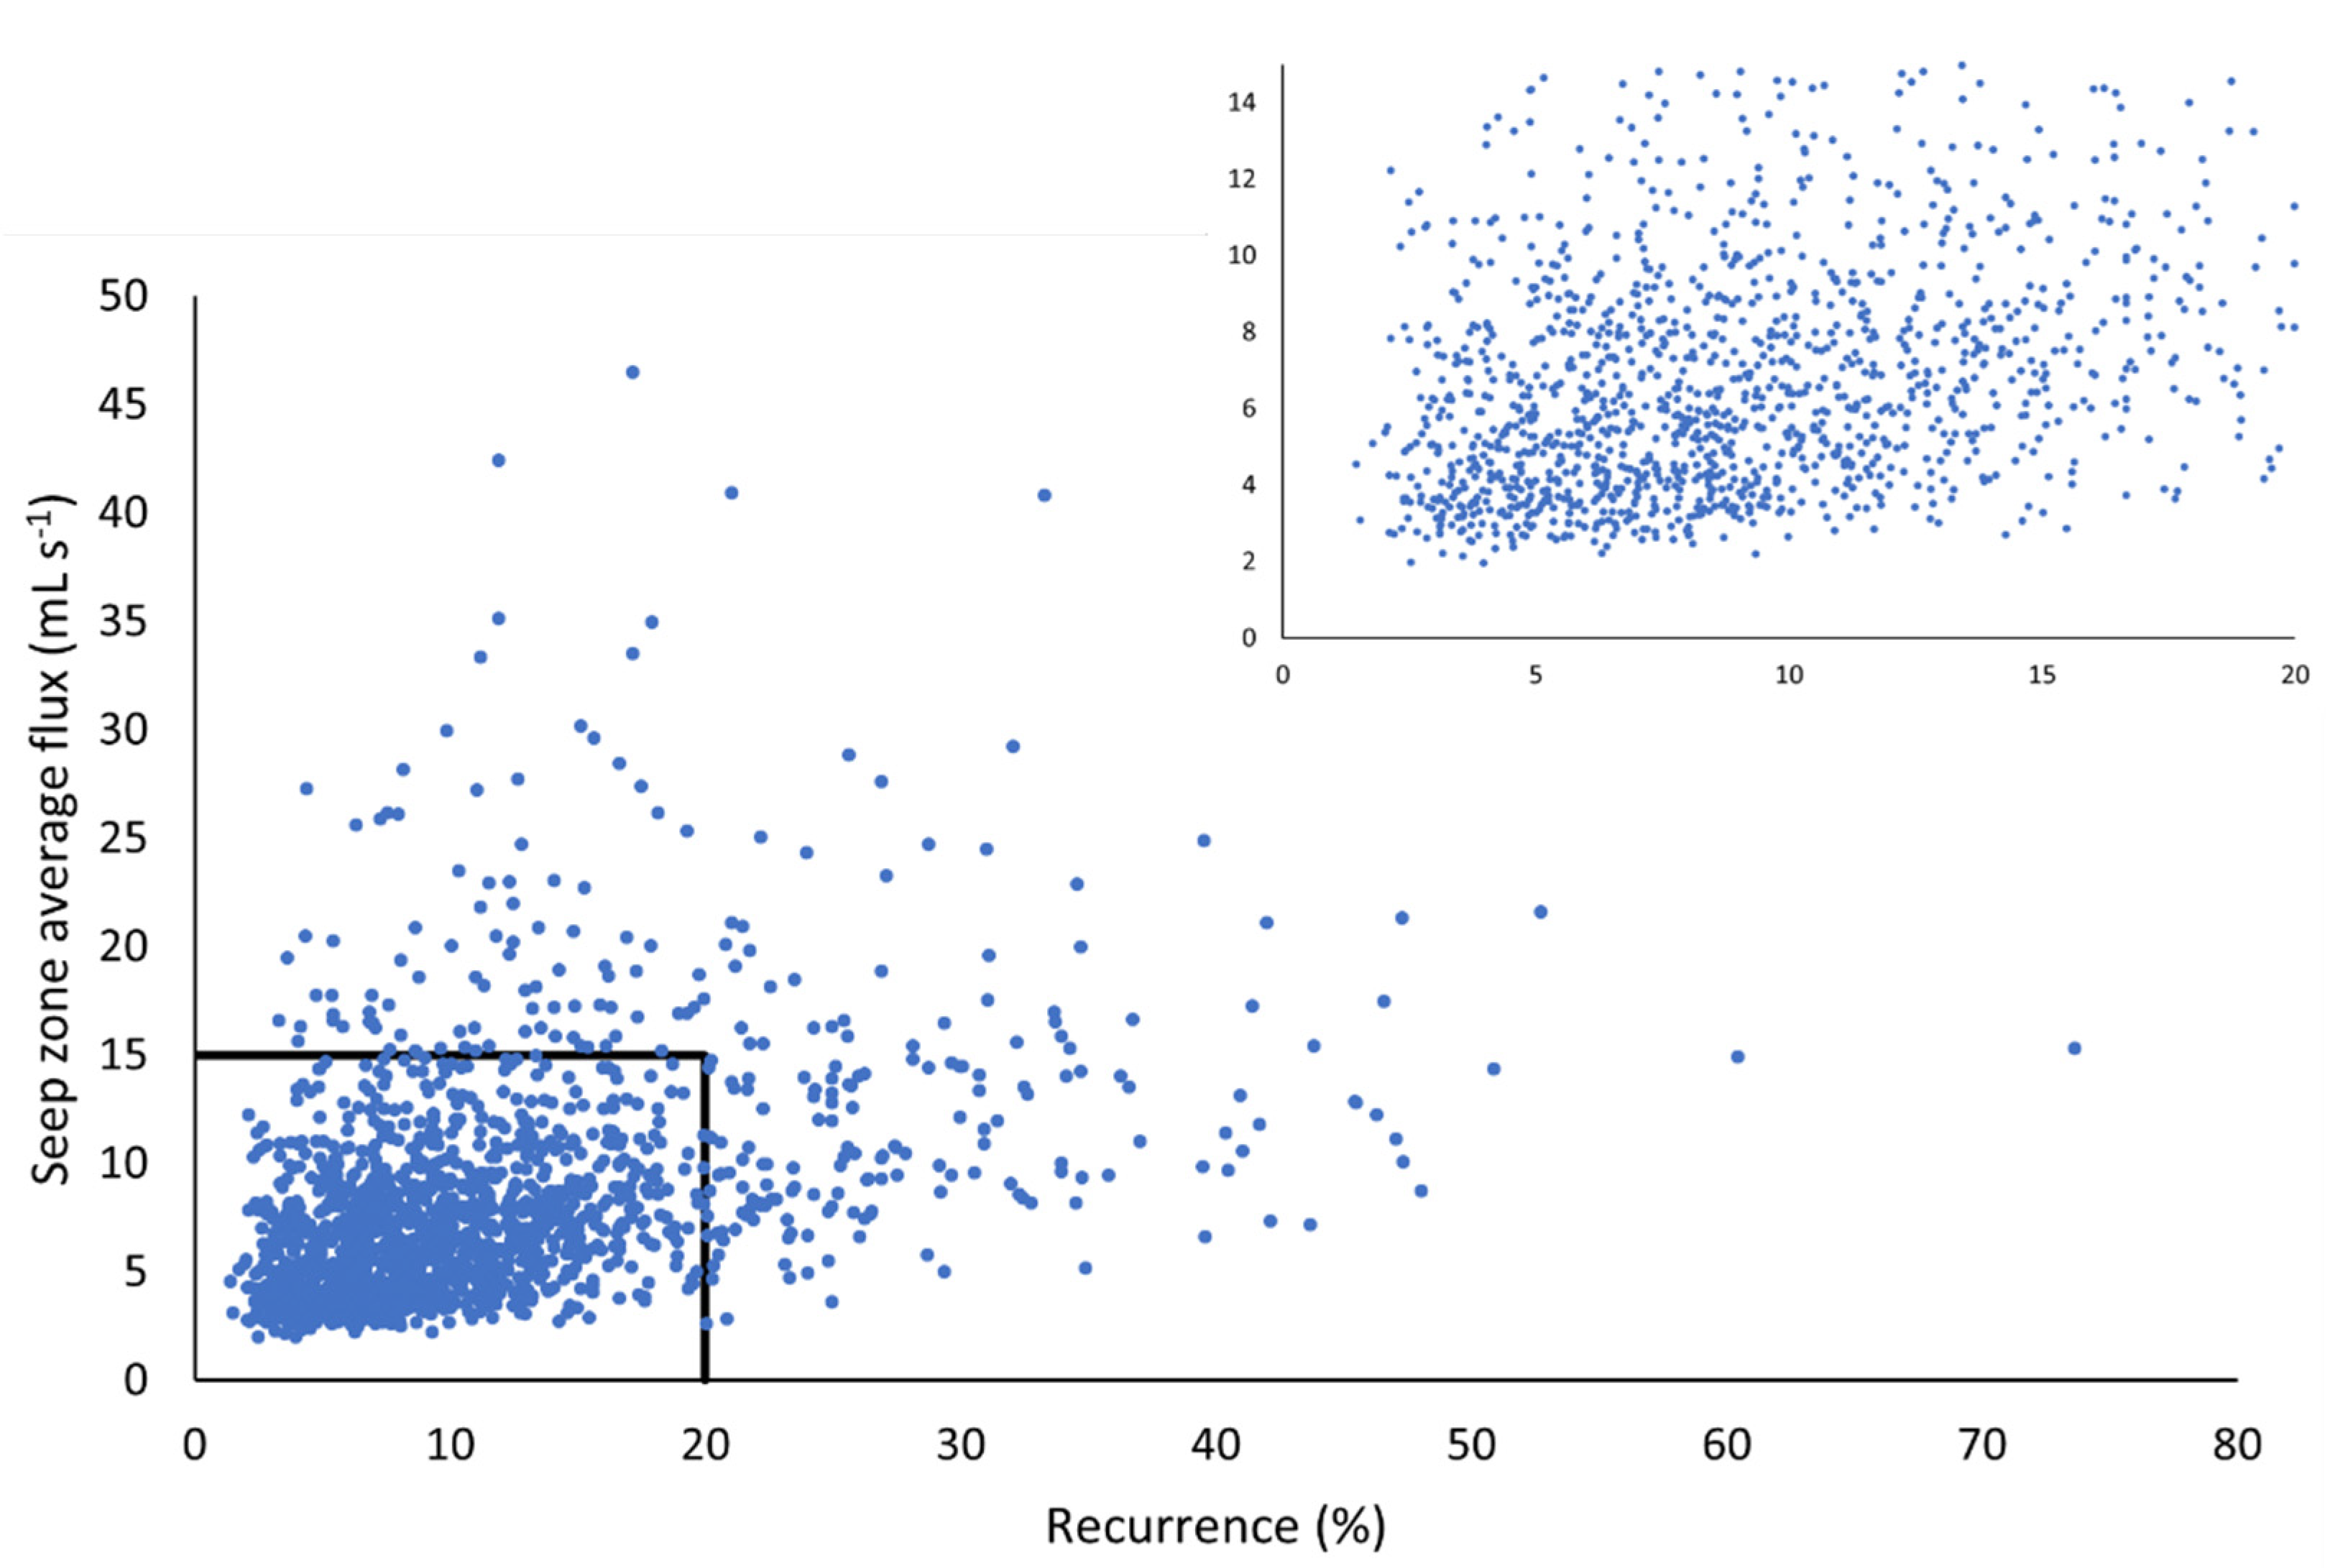
3.3. Seep Zone Categories
4. Discussion
5. Conclusions
Author Contributions
Funding
Conflicts of Interest
References
- Kennicutt, M.C.; Brooks, J.M.; Denoux, G.J. Leakage of deep, reservoired petroleum to the near surface on the Gulf of Mexico continental slope. Mar. Chem. 1988, 24, 39–59. [Google Scholar] [CrossRef]
- Abrams, M.A. Geophysical and geochemical evidence for subsurface hydrocarbon leakage in the Bering Sea, Alaska. Mar. Pet. Geol. 1992, 9, 208–221. [Google Scholar] [CrossRef]
- Kvenvolden, K.A.; Cooper, C.K. Natural seepage of crude oil into the marine environment. Geo-Mar. Lett. 2003, 23, 140–146. [Google Scholar] [CrossRef]
- Ivanov, A.Y.; Gerivani, H.; Evtushenko, N.V. Characterization of natural hydrocarbon seepage in the South Caspian Sea off Iran using satellite SAR and geological data. Mar. Georesour. Geotechnol. 2020, 38, 527–538. [Google Scholar] [CrossRef]
- Johansen, C.; Todd, A.C.; MacDonald, I.R. Time series video analysis of bubble release processes at natural hydrocarbon seeps in the Northern Gulf of Mexico. Mar. Pet. Geol. 2017, 82, 21–34. [Google Scholar] [CrossRef] [Green Version]
- MacDonald, I.R.; Guinasso Jr., N.L.; Ackleson, S.G.; Amos, J.F.; Duckworth, R.; Sassen, R.; Brooks, J.M. Natural Oil Slicks in the Gulf of Mexico Visible From Space. J. Geophys. Res. 1993, 98, 351–364. [Google Scholar]
- Garcia-Pineda, O.; MacDonald, I.; Zimmer, B.; Shedd, B.; Roberts, H. Remote-sensing evaluation of geophysical anomaly sites in the outer continental slope, northern Gulf of Mexico. Deep-Sea Res. II 2010, 57, 1859–1869. [Google Scholar] [CrossRef]
- Kennicutt, M.C., II. Oil and Gas Seeps in the Gulf of Mexico. In Habitats and Biota of the Gulf of Mexico: Before the Deepwater Horizon Oil Spill; Ward, C.H., Ed.; SpringerOpen: New York, NY, USA, 2017; pp. 275–358. [Google Scholar]
- MacDonald, I.R.; Sager, W.W.; Peccini, M.B. Gas hydrate and chemosynthetic biota in mounded bathymetry at mid-slope hydrocarbon seeps: Northern Gulf of Mexico. Mar. Geol. 2003, 198, 133–158. [Google Scholar] [CrossRef]
- U.S. EIA. Gulf of Mexico Crude Oil Production will Increase with New Projects in 2021 and 2022. Available online: https://www.eia.gov/todayinenergy/detail.php?id=47536#:~:text=In%202020%2C%20GOM%20crude%20oil,at%201.9%20million%20b%2Fd (accessed on 2 May 2022).
- MacDonald, I.R.; Garcia-Pineda, O.; Beet, A.; Daneshgar Asl, S.; Feng, L.; Graettinger, G.; French-McCay, D.; Holmes, J.; Hu, C.; Huffer, F.; et al. Natural and unnatural oil slicks in the Gulf of Mexico. J. Geophys. Res. Ocean. 2015, 120, 8364–8380. [Google Scholar] [CrossRef]
- Agirrezabala, L.M.; López-Horgue, M.A. Environmental and ammonoid faunal changes related to Albian Bay of Biscay opening: Insights from the northern margin of the Basque-Cantabrian Basin. J. Sea Res. 2017, 130, 36–48. [Google Scholar] [CrossRef]
- Barberes, G.A.; Spigolon, A.L.D.; Pena dos Reis, R.; Permanyer, A.; Barata, M.T. Hydrocarbon seeps from the unconventional petroleum system of the South Portuguese Zone, Portugal. J. Iber. Geol. 2020, 46, 1–19. [Google Scholar] [CrossRef]
- Bernardo, L.M.; Bartolini, C. Petroleum source rock analysis in the Western Caribbean Region: An overview. In Petroleum Geology and Potential of the Colombian Caribbean Margin; Bartolini, C., Mann, P., Eds.; AAPG Memoir 108; American Association of Petroleum Geologists: Tulsa, OK, USA; Repsol: Madrid, Spain; Anadarko: The Woodlands, TX, USA, 2015; pp. 587–614. [Google Scholar]
- Bojesen-Koefoed, J.; Nytoft, H.P.; Christiansen, F.G. Age of oils in West Greenland: Was there a Mesozoic seaway between Greenland and Canada? Geol. Surv. Den. Greenl. Bull. 2004, 4, 49–52. [Google Scholar] [CrossRef] [Green Version]
- Burns, K.A.; Brinkman, D.L.; Brunskill, G.J.; Logan, G.A.; Volk, H.; Wasmund, K.; Zagorskis, I. Fluxes and fate of petroleum hydrocarbons in the Timor Sea ecosystem with special reference to active natural hydrocarbon seepage. Mar. Chem. 2010, 118, 140–155. [Google Scholar] [CrossRef]
- Camplin, D.J.; Hall, R. Neogene history of Bone Gulf, Sulawesi, Indonesia. Mar. Pet. Geol. 2014, 57, 88–108. [Google Scholar] [CrossRef]
- Cazzini, F.; Dal Zotto, O.; Fantoni, R.; Ghielmi, M.; Ronchi, P.; Scotti, P. Oil and gas in the Adriatic Foreland, Italy. J. Pet. Geol. 2015, 38, 255–279. [Google Scholar] [CrossRef]
- Chen, S.; Hu, C. In search of oil seeps in the Cariaco Basin using MODIS and MERIS medium-resolution data. Remote Sens. Lett. 2014, 5, 442–450. [Google Scholar] [CrossRef]
- Coughlan, M.; Roy, S.; O’Sullivan, C.; Clements, A.; O’Toole, R.; Plets, R. Geological settings and controls of fluid migration and associated seafloor seepage features in the north Irish Sea. Mar. Pet. Geol. 2021, 123, 104762. [Google Scholar] [CrossRef]
- Cramer, B.; Franke, D. Indications for an active petroleum system in the Laptev Sea, NE Siberia. J. Pet. Geol. 2005, 28, 369–384. [Google Scholar] [CrossRef]
- Dill, H.G.; Kaufhold, S. The Totumo mud volcano and its near-shore marine sedimentological setting (North Colombia)—From sedimentary volcanism to epithermal mineralization. Sediment. Geol. 2018, 366, 14–31. [Google Scholar] [CrossRef]
- Dupré, S.; Scalabrin, C.; Grall, C.; Augustin, J.-M.; Henry, P.; Celal Sengör, A.M.; Görür, N.; Çagatay, M.N.; Géli, L. Tectonic and sedimentary controls on widespread gas emissions in the Sea of Marmara: Results from systematic, shipborne multibeam echo sounder water column imaging. J. Geophys. Res. Solid Earth 2015, 120, 2891–2912. [Google Scholar] [CrossRef] [Green Version]
- Feng, D.; Qiu, J.-W.; Hu, Y.; Peckmann, J.; Guan, H.; Tong, H.; Chen, C.; Chen, J.; Gong, S.; Li, N.; et al. Cold seep systems in the South China Sea: An overview. J. Asian Earth Sci. 2018, 168, 3–16. [Google Scholar] [CrossRef]
- Fildani, A.; Hanson, A.D.; Chen, Z.; Moldowan, J.M.; Graham, S.A.; Arriola, P.R. Geochemical characteristics of oil and source rocks and implications for petroleum systems, Talara Basin, northwest Peru. AAPG Bull. 2005, 89, 1519–1545. [Google Scholar] [CrossRef]
- Foster, K.L.; Stern, G.A.; Carrie, J.; Bailey, J.N.L.; Outridge, P.M.; Sanei, H.; Macdonald, R.W. Spatial, temporal, and source variations of hydrocarbons in marine sediments from Baffin Bay, Eastern Canadian Arctic. Sci. Total Environ. 2015, 506–507, 430–443. [Google Scholar] [CrossRef] [PubMed]
- Freire, A.F.M.; Matsumoto, R.; Santos, L.A. Structural-stratigraphic control on the Umitaka Spur gas hydrates of Joetsu Basin in the eastern margin of Japan Sea. Mar. Pet. Geol. 2011, 28, 1967–1978. [Google Scholar] [CrossRef]
- Freire, A.F.M.; Iemini, J.A.; Viana, A.R.; Magnavita, L.P.; Dehler, N.M.; Kowsmann, R.O.; Miller, D.J.; Bezerra, S.H.D.G.; dos Anjos Zerfass, G.d.S.; Shimabukuro, S.; et al. A giant oil seep at a salt-induced escarpment of the São Paulo Plateau, Espírito Santo Basin, off Brazil: Host rock characteristics and geochemistry. Deep-Sea Res. Part II 2017, 146, 45–52. [Google Scholar] [CrossRef]
- Gbadebo, A.M. Environmental implications of bitumen seep induced pollution in parts of Ogun state, southwestern Nigeria. Environ. Earth Sci. 2010, 59, 1507–1514. [Google Scholar] [CrossRef]
- Hakimi, M.H.; Al-Matary, A.M.; Ahmed, A.F. Bulk geochemical characteristics and carbon isotope composition of oils from the Sayhut sub-basin in the Gulf of Aden with emphasis on organic matter input, age and maturity. Egypt. J. Pet. 2018, 27, 361–370. [Google Scholar] [CrossRef]
- Himmler, T.; Freiwald, A.; Stollhofen, H.; Peckmann, J. Late Carboniferous hydrocarbon-seep carbonates from the glaciomarine Dwyka Group, southern Namibia. Palaeoecology 2008, 257, 185–197. [Google Scholar] [CrossRef]
- Hovland, M.; Jensen, S.; Fichler, C. Methane and minor oil macro-seep systems—Their complexity and environmental significance. Mar. Geol. 2012, 332–334, 163–173. [Google Scholar] [CrossRef]
- Intawong, A.; Hodgson, N.; Rodriguez, K.; Hargreaves, P. Oil prospects in the Mozambique Channel: Where incipient subduction meets passive margin. First Break 2019, 37, 75–81. [Google Scholar] [CrossRef]
- Ivanov, A.Y.; Matrosova, E.R.; Kucheiko, A.Y.; Filimonova, N.A.; Evtushenko, N.V.; Terleeva, N.V.; Libina, N.V. Search and Detection of Natural Oil Seeps in the Seas Surrounding the Russian Federation Using Spaseborne SAR Imagery. Atmos. Ocean. Phys. 2020, 56, 43–62. [Google Scholar] [CrossRef]
- Ivanov, A.Y.; Gerivani, H. Oil leaking and seeping site in the Persian Gulf detected and studied by satellite observations. Mar. Georesour. Geotechnol. 2021, 39, 1481–1496. [Google Scholar] [CrossRef]
- Jatiault, R.; Dhont, D.; Loncke, L.; Durrieu de Madron, X.; Dubucq, D.; Channelliere, C.; Bourrin, F. Deflection of natural oil droplets through the water column in deep-water environments: The case of the Lower Congo Basin. Deep-Sea Res. Part I 2018, 136, 44–61. [Google Scholar] [CrossRef]
- Jauer, C.D.; Budkewitsch, P. Old marine seismic and new satellite radar data: Petroleum exploration of north west Labrador Sea, Canada. Mar. Pet. Geol. 2010, 27, 1379–1394. [Google Scholar] [CrossRef]
- Leifer, I.; Boles, J.R.; Luyendyk, B.P.; Clark, J.F. Transient discharges from marine hydrocarbon seeps: Spatial and temporal variability. Environ. Geol. 2004, 46, 1038–1052. [Google Scholar] [CrossRef]
- Liira, M.; Noormets, R.; Sepp, H.; Kekišev, O.; Maddison, M.; Snorre, O. Sediment geochemical study of hydrocarbon seeps in Isfjorden and Mohnbukta: A comparison between western and eastern Spitsbergen, Svalbard. Arktos 2019, 5, 49–62. [Google Scholar] [CrossRef]
- Logan, G.A.; Jones, A.T.; Kennard, J.M.; Ryan, G.J.; Rollet, N. Australian offshore natural hydrocarbon seepage studies, a review and re-evaluation. Mar. Pet. Geol. 2010, 27, 26–45. [Google Scholar] [CrossRef]
- Mitra, D.S.; Majumdar, T.J.; Ramakrishan, R.; Dave, H.; Mazumder, S. Detection and monitoring of offshore oil seeps using ERS/ENVISAT SAR/ASAR data and seep-seismic studies in Krishna–Godavari offshore basin, India. Geocarto Int. 2013, 28, 404–419. [Google Scholar] [CrossRef]
- Mityagina, M.; Lavrova, O. Oil slicks from natural hydrocarbon seeps in the South-Eastern Black Sea, their drift and fate as observed via remote sensing. In Proceedings of the IGARSS 2018—2018 IEEE International Geoscience and Remote Sensing Symposium, Valencia, Spain, 22–27 July 2018; pp. 7926–7929. [Google Scholar]
- Nemirovskaya, I.A.; Sivkov, V.V. Peculiarities in the distribution of hydrocarbons in the southeastern part of the Baltic Sea. Oceanology 2012, 52, 34–47. [Google Scholar] [CrossRef]
- Nesbitt, E.A.; Martin, R.A.; Campbell, K.A. New records of Oligocene diffuse hydrocarbon seeps, northern Cascadia margin. Palaeogeogr. Palaeoclimatol. Palaeoecol. 2013, 390, 116–129. [Google Scholar] [CrossRef]
- Pinet, N.; Duchesne, M.; Lavoie, D.; Bolduc, A.; Long, B. Surface and subsurface signatures of gas seepage in the St. Lawrence Estuary (Canada): Significance to hydrocarbon exploration. Mar. Pet. Geol. 2008, 25, 271–288. [Google Scholar] [CrossRef]
- Römer, M.; Sahling, H.; Pape, T.; Bohrmann, G.; Spieß, V. Quantification of gas bubble emissions from submarine hydrocarbon seeps at the Makran continental margin (offshore Pakistan). J. Geophys. Res. 2012, 117, C10015. [Google Scholar] [CrossRef]
- Römer, M.; Sahling, H.; Pape, T.; dos Santos Ferreira, C.; Wenzhöfer, F.; Boetius, A.; Bohrmann, G. Methane fluxes and carbonate deposits at a cold seep area of the Central Nile Deep Sea Fan, Eastern Mediterranean Sea. Mar. Geol. 2014, 347, 27–42. [Google Scholar] [CrossRef]
- Sakran, S.; Nabih, M.; Henaish, A.; Ziko, A. Structural regime and its impact on the mechanism and migration pathways of hydrocarbon seepage in the southern Gulf of Suez rift: An approach for finding new unexplored fault blocks. Mar. Pet. Geol. 2016, 71, 55–75. [Google Scholar] [CrossRef]
- Short, J.W.; Kolak, J.J.; Payne, J.R.; Van Kooten, G.K. An evaluation of petrogenic hydrocarbons in northern Gulf of Alaska continental shelf sediments—The role of coastal oil seep inputs. Org. Geochem. 2007, 38, 643–670. [Google Scholar] [CrossRef]
- Taylor, M.H.; Dillon, W.P.; Pecher, I.A. Trapping and migration of methane associated with the gas hydrate stability zone at the Blake Ridge Diapir: New insights from seismic data. Mar. Geol. 2000, 164, 79–89. [Google Scholar] [CrossRef]
- Venkatesan, M.I.; Naidu, A.S.; Blanchard, A.L.; Misra, D.; Kelley, J.J. Historical changes in trace metals and hydrocarbons in nearshore sediments, Alaskan Beaufort Sea, prior and subsequent to petroleum-related industrial development: Part II. Hydrocarbons. Mar. Pollut. Bull. 2013, 77, 147–164. [Google Scholar] [CrossRef]
- Zakharenko, A.S.; Galachyants, Y.P.; Morozov, I.V.; Shubenkova, O.V.; Morozov, A.A.; Ivanov, V.G.; Pimenov, N.V.; Krasnopeev, A.Y.; Zemskaya, T.I. Bacterial Communities in Areas of Oil and Methane Seeps in Pelagic of Lake Baikal. Microb. Ecol. 2019, 78, 269–285. [Google Scholar] [CrossRef]
- Zelilidis, A.; Maravelis, A.G.; Tserolas, P.; Konstantopoulos, P.A. An overview of the petroleum systems in the Ionian Zone, onshore NW Greece and Albania. J. Pet. Geol. 2015, 38, 331–348. [Google Scholar] [CrossRef]
- N.O.A.A. Emergency Response Division. Open Water Oil Identification Job Aid for Aerial Observation. 2016. Available online: https://response.restoration.noaa.gov/oil-and-chemical-spills/oil-spills/resources/open-water-oil-identification-job-aid.html (accessed on 28 May 2022).
- Brekke, C.; Solberg, A.H.S. Oil spill detection by satellite remote sensing. Remote Sens. Environ. 2005, 95, 1–13. [Google Scholar] [CrossRef]
- Leifer, I.; Lehr, W.J.; Simecek-Beatty, D.; Bradley, E.; Clark, R.; Dennison, P.; Hu, Y.; Matheson, S.; Jones, C.E.; Holt, B.; et al. State of the art satellite and airborne marine oil spill remote sensing: Application to the BP Deepwater Horizon oil spill. Remote Sens. Environ. 2012, 124, 185–209. [Google Scholar] [CrossRef] [Green Version]
- Fingas, M.; Brown, C.E. A review of oil spill remote sensing. Sensors 2018, 18, 906–950. [Google Scholar]
- Daneshgar Asl, S.; Dukhovskoy, D.S.; Bourassa, M.; MacDonald, I.R. Hindcast modeling of oil slick persistence from natural seeps. Remote Sens. Environ. 2017, 189, 96–107. [Google Scholar] [CrossRef]
- Razaz, M.; Di Iorio, D.; Wang, B.; Daneshgar Asl, S.; Thurnherr, A.M. Variability of a natural hydrocarbon seep and its connection to the ocean surface. Sci. Rep. 2020, 10, 12654. [Google Scholar] [CrossRef] [PubMed]
- Garcia-Pineda, O.; Zimmer, B.; Howard, M.; Pichel, W.; Li, X.; MacDonald, I.R. Using SAR images to delineate ocean oil slicks with a texture-classifying neural network algorithm (TCNNA). Can. J. Remote Sens. 2009, 35, 411–421. [Google Scholar] [CrossRef]
- Garcia-Pineda, O.; Holmes, J.; Rissing, M.; Jones, R.; Wobus, C.; Svejkovsky, J.; Hess, M. Detection of oil near shorelines during the Deepwater Horizon oil spill using synthetic aperture radar (SAR). Remote Sens. 2017, 9, 567. [Google Scholar] [CrossRef] [Green Version]
- Meng, T.; Yang, X.; Chen, K.-S.; Nunziata, F.; Xie, D.; Buono, A. Radar backscattering over sea surface oil emulsions: Simulation and observation. IEEE Trans. Geosci. Remote Sens. 2022, 60, 1–14. [Google Scholar] [CrossRef]
- Nunziata, F.; de Macedo, C.R.; Buono, A.; Velotto, D.; Migliaccio, M. On the analysis of a time series of X-band TerraSAR-X SAR imagery over oil seepages. Int. J. Remote Sens. 2018, 40, 3623–3646. [Google Scholar] [CrossRef]
- De Beukelaer, S.M.; MacDonald, I.R.; Guinnasso, N.L., Jr.; Murray, J.A. Distinct side-scan sonar, RADARSAT SAR, and acoustic profiler signatures of gas and oil seeps on the Gulf of Mexico slope. Geo-Mar. Lett. 2003, 23, 177–186. [Google Scholar] [CrossRef]
- Abrams, M.A.; Logan, G. Geochemical evaluation of ocean surface slick methods to ground truth satellite seepage anomalies for seepage detection. In Proceedings of the Annual Meeting—American Association of Petroleum Geologists: Unmasking the Potential of Exploration & Production, New Orleans, LA, USA, 11–14 April 2010. [Google Scholar]
- MacDonald, I.R.; Leifer, I.; Sassen, R.; Stine, P.; Mitchell, R.; Guinasso, N., Jr. Transfer of hydrocarbons from natural seeps to the water column. Geofluids 2002, 2, 95–107. [Google Scholar] [CrossRef]
- Johansen, C.; Macelloni, L.; Natter, M.; Silva, M.; Woosley, M.; Woolsey, A.; Diercks, A.R.; Hill, J.; Viso, R.; Marty, E.; et al. Hydrocarbon migration pathway and methane budget for a Gulf of Mexico natural seep site: Green Canyon 600. Earth Planet. Sci. Lett. 2020, 545, 116411. [Google Scholar] [CrossRef]
- Abrams, M.A. Distribution of subsurface hydrocarbon seepage in near-surface marine sediments. In Hydrocarbon Migration and Its Near-Surface Expression; Schumacher, D., Abrams, M.A., Eds.; AAPG Memoir 66; American Association of Petroleum Geologists: Tulsa, OK, USA, 1996; pp. 1–14. [Google Scholar]
- Jatiault, R.; Dhont, D.; Loncke, L.; Dubucq, D. Monitoring of natural oil seepage in the Lower Congo Basin using SAR observations. Remote Sens. Environ. 2017, 191, 258–272. [Google Scholar] [CrossRef]
- Jones, A.T.; Logan, G.A.; Kennard, J.M.; Rollet, N. Reassessing potential origins of synthetic aperture radar (SAR) slicks from the Timor Region of the North West Shelf on the basis of field and ancillary data. Appea J. 2005, 45, 311–331. [Google Scholar] [CrossRef]
- Jones, A.T.; Thankappan, M.; Logan, G.A.; Kennard, J.M.; Smith, C.J.; Williams, A.K.; Lawrence, G.M. Coral spawn and bathymetric slicks in synthetic aperture radar (SAR) data from the Timor Sea, north-west Australia. Int. J. Remote Sens. 2006, 27, 2063–2069. [Google Scholar] [CrossRef]
- Wu, L.; Wang, L.; Min, L.; Hou, W.; Guo, Z.; Zhao, J.; Li, N. Discrimination of algal-bloom using spaceborne SAR observations of Great Lakes in China. Remote Sens. 2018, 10, 767. [Google Scholar] [CrossRef] [Green Version]
- Environmental Systems Research Institute. Aggregate Points. Available online: https://doc.arcgis.com/en/arcgis-online/analyze/aggregate-points.htm#:~:text=The%20Aggregate%20Points%20tool%20uses,each%20area%20using%20graduated%20symbols (accessed on 18 May 2022).
- Leifer, I.; Boles, J. Measurement of marine hydrocarbon seep flow through fractured rock and unconsolidated sediment. Mar. Pet. Geol. 2005, 22, 551–568. [Google Scholar] [CrossRef]
- B.O.E.M. Seismic Water Bottom Anomalies Map Gallery. Available online: https://www.boem.gov/oil-gas-energy/mapping-and-data/map-gallery/seismic-water-bottom-anomalies-map-gallery (accessed on 25 February 2000).
- B.O.E.M. Northern GoM Deepwater Bathymetry Grid from 3D Seismic. Available online: https://www.boem.gov/oil-gas-energy/mapping-and-data/map-gallery/northern-gom-deepwater-bathymetry-grid-3d-seismic (accessed on 25 March 2022).
- Leifer, I.; Boles, J. Turbine tent measurements of marine hydrocarbon seeps on subhourly timescales. J. Geophys. Res. 2005, 110, C01006. [Google Scholar] [CrossRef] [Green Version]
- Quigley, D.C.; Hornafius, J.S.; Luyendyk, B.P.; Francis, R.D.; Clark, J.; Washburn, L. Decrease in natural marine hydrocarbon seepage near Coal Oil Point, California, associated with offshore oil production. Geology 1999, 27, 1047–1050. [Google Scholar] [CrossRef] [Green Version]
- Leifer, I. A Synthesis Review of Emissions and Fates for the Coal Oil Point Marine Hydrocarbon Seep Field and California Marine Seepage. Geofluids 2019, 2019, 4724587. [Google Scholar] [CrossRef] [Green Version]
- U.S. EIA. Petroleum & Other Liquids. Available online: https://www.eia.gov/dnav/pet/hist/LeafHandler.ashx?n=pet&s=mcrfp3fm2&f=a (accessed on 2 June 2021).


| MDA * | NPA | Airbus | MacDonald et al. [11] | Total | |
|---|---|---|---|---|---|
| Years active | 1997–2014 | 1978, 1991–2018 | 1992–2015 | 1994–2007 | 28 |
| number of scenes | 215 | 2265 | 1357 | 254 | 4091 |
| number of polygons (oil slicks) | 2070 | 29,126 | 7667 | 14,608 | 53,471 |
| number of points (OSOs) | 2070 | 29,089 | 3826 | 14,531 | 49,516 |
| Seep Zone Category | Positive Anomaly | Negative Anomaly | Total |
|---|---|---|---|
| High recurrence | 72 | 28 | 100 |
| High flux | 27 | 9 | 36 |
| High recurrence and high flux | 3 | 1 | 4 |
| Total | 102 | 38 | 140 |
Publisher’s Note: MDPI stays neutral with regard to jurisdictional claims in published maps and institutional affiliations. |
© 2022 by the authors. Licensee MDPI, Basel, Switzerland. This article is an open access article distributed under the terms and conditions of the Creative Commons Attribution (CC BY) license (https://creativecommons.org/licenses/by/4.0/).
Share and Cite
O’Reilly, C.; Silva, M.; Daneshgar Asl, S.; Meurer, W.P.; MacDonald, I.R. Distribution, Magnitude, and Variability of Natural Oil Seeps in the Gulf of Mexico. Remote Sens. 2022, 14, 3150. https://doi.org/10.3390/rs14133150
O’Reilly C, Silva M, Daneshgar Asl S, Meurer WP, MacDonald IR. Distribution, Magnitude, and Variability of Natural Oil Seeps in the Gulf of Mexico. Remote Sensing. 2022; 14(13):3150. https://doi.org/10.3390/rs14133150
Chicago/Turabian StyleO’Reilly, Carrie, Mauricio Silva, Samira Daneshgar Asl, William P. Meurer, and Ian R. MacDonald. 2022. "Distribution, Magnitude, and Variability of Natural Oil Seeps in the Gulf of Mexico" Remote Sensing 14, no. 13: 3150. https://doi.org/10.3390/rs14133150