Article

Investigating the Ability to Identify New Constructions in Urban Areas Using Images from Unmanned Aerial Vehicles, Google Earth, and Sentinel-2

by
Fahime Arabi Aliabad
1,
Hamid Reza Ghafarian Malamiri
2,3,
Saeed Shojaei
4,
Alireza Sarsangi
5,
Carla Sofia Santos Ferreira
6,7,* and
Zahra Kalantari
6,8
1
Department of Arid Land Management, Faculty of Natural Resources and Desert Studies, Yazd University, Yazd 8915818411, Iran
2
Department of Geography, Yazd University, Yazd 8915818411, Iran
3
Department of Geoscience and Engineering, Delft University of Technology, 2628 CD Delft, The Netherlands
4
Department of Arid and Mountainous Region Reclamation, Faculty of Natural Resources, University of Tehran, Tehran 1417935840, Iran
5
Department of Remote Sensing and GIS, Faculty of Geography, University of Tehran, Tehran 1417935840, Iran
6
Bolin Center for Climate Research, Department of Physical Geography, Stockholm University, 10691 Stockholm, Sweden
7
Research Centre for Natural Resources, Environment and Society (CERNAS), Polytechnic Institute of Coimbra, Agrarian School of Coimbra, 3045-601 Coimbra, Portugal
8
Department of Sustainable Development, Environmental Science and Engineering (SEED), KTH Royal Institute of Technology, 11428 Stockholm, Sweden
*
Author to whom correspondence should be addressed.
Remote Sens. 2022, 14(13), 3227; https://doi.org/10.3390/rs14133227
Submission received: 13 April 2022 / Revised: 13 June 2022 / Accepted: 1 July 2022 / Published: 5 July 2022

Abstract

:
One of the main problems in developing countries is unplanned urban growth and land use change. Timely identification of new constructions can be a good solution to mitigate some environmental and social problems. This study examined the possibility of identifying new constructions in urban areas using images from unmanned aerial vehicles (UAV), Google Earth and Sentinel-2. The accuracy of the land cover map obtained using these images was investigated using pixel-based processing methods (maximum likelihood, minimum distance, Mahalanobis, spectral angle mapping (SAM)) and object-based methods (Bayes, support vector machine (SVM), K-nearest-neighbor (KNN), decision tree, random forest). The use of DSM to increase the accuracy of classification of UAV images and the use of NDVI to identify vegetation in Sentinel-2 images were also investigated. The object-based KNN method was found to have the greatest accuracy in classifying UAV images (kappa coefficient = 0.93), and the use of DSM increased the classification accuracy by 4%. Evaluations of the accuracy of Google Earth images showed that KNN was also the best method for preparing a land cover map using these images (kappa coefficient = 0.83). The KNN and SVM methods showed the highest accuracy in preparing land cover maps using Sentinel-2 images (kappa coefficient = 0.87 and 0.85, respectively). The accuracy of classification was not increased when using NDVI due to the small percentage of vegetation cover in the study area. On examining the advantages and disadvantages of the different methods, a novel method for identifying new rural constructions was devised. This method uses only one UAV imaging per year to determine the exact position of urban areas with no constructions and then examines spectral changes in related Sentinel-2 pixels that might indicate new constructions in these areas. On-site observations confirmed the accuracy of this method.

1. Introduction

Extensive urban cover change is a major challenge in urban planning [1]. For example, heterogeneous urban growth, unplanned settlements and land use change are major problems in developing countries [2]. In recent years, satellite image processing has been proposed as an efficient tool for identifying and extracting land cover maps and identifying changes over time [3]. Land cover classification using satellite images can be carried out using pixel-based or object-based methods [4]. In pixel-based processing of images, single-pixel information is the basis and criterion of classification. In object-based processing, spectral and spatial values and other existing information in a similar set of pixels, called an object or phenomenon, are the basis of processing [5]. In addition to spectral information, other information such as context, shape, size and direction, is also used in classification by object-based processing [6]. Due to problems with pixel-based classification, object-based classification has been increasingly used by many researchers over the past two decades [7].
Traditional pixel-based image analysis is limited because it only uses the spectral information of single pixels, typically reproduces large areas (city) and thus is associated with low spatial resolution which is often inappropriate for supporting land management [8]. Because spectral variability increases within the field classification using the traditional pixel-based method yields a decrease in the accuracy of the images and classification results include a speckled appearance [9].
In object-based image analysis, the main unit of image processing is the shape of objects, segments, or parts of the image [10]. Image classification based solely on spectral information has limitations therefore, other sources of information should be used to increase the accuracy of classification [11,12,13,14,15,16].
Due to the diversity of information sources, educational data, terrain features and segmentation parameters, as well as different spectral reflections in different terrain features, appropriate methods for classifying satellite images do not apply a single approach with specific parameters to image classification [17,18]. Therefore, the development of different techniques for processing satellite images in varying conditions has been proposed as an appropriate research field.
In urban areas, Frantz et al. [19] mapped building height using Sentinel-1 and Sentinel-2 satellite time series data on a national scale. They used building shadow in optical images and radar data to estimate the height of 3 m buildings using root mean square error (RMSE). Gombe et al. [20] concluded that Sentinel-2 provides good data for monitoring urban activities, especially urban development. Numerous studies have used Sentinel-2 images to examine land use changes in urban areas, with accuracy between 75% and 92% [21,22]. Phiri et al. [23] reviewed the results of 25 studies comparing Sentinel-2 image classification methods and concluded that the support vector machine (SVM) and Bayes methods have the highest accuracy. Phiri et al. [23] used vegetation indices to increase classification accuracy through the tree decision algorithm. Boonpook et al. [24] concluded that UAV images are a suitable way to identify new constructions around rivers, while Liu et al. [25] found that the integration of Digital Surface Models (DSM) and UAV images increases the accuracy of construction identification. Priyadarshini et al. [26] identified suburban areas around a city using UAV images and the random forest, maximum likelihood, Mahalanobis and neural net algorithms. Their study showed that object-based methods are more accurate than other methods in identifying constructions.
Although several methods have been proposed to identify new constructions in suburban areas, detection of buildings in urban areas is rather limited. Particularly in developing countries, unauthorized constructions are carried out and limited resources from local authorities raise challenges in the timely identification of illegal construction activities. Therefore, identifying new constructions at the very beginning of the activity is very important for the authorities to control urban sprawl and consequent social and environmental problems. Thus, the aim of the present study was to investigate the advantages and limitations of aerial vehicle (UAV), Google Earth and Sentinel-2 images in identifying new constructions. The study focuses on Yazd city and uses several pixel-based and object-based classification methods to analyze Sentinel-2, Google Earth and UAV images, as explained in Section 2. In Section 3, based on the comparison between different classification methods and images, a new method combining different sources of images is proposed to identify new constructions.

2. Materials and Methods

2.1. Study Area

Yazd, which is well-known as the first adobe city in the world, was the first recorded city in Iran. The city center is dense and compact, while the urban structure around the center is scattered and developing, with newly constructed settlements in the suburbs. In recent years, migration from surrounding cities to Yazd has increased because of employment opportunities generated by significant industrial growth and development in the city. This increase in population has amplified the need for housing, leading to the spread of new constructions around the city that currently extend over 30 ha. The location of Yazd in central Iran and examples of the images used in this study are shown in Figure 1. The study area is located in a desert area and a plain, away from mountainous lands, and has a dry climate.

2.2. Data Inputs

Three types of images, from Sentinel-2, UAVs and Google Earth were used to investigate the ability to identify new constructions in the selected urban area in Yazd.
Sentinel-2 satellites have multispectral imaging systems and produce optical images [27]. Sentinel-2 images have been used in previous studies on urban development [28], urban heat islands [29], informal settlement identification [30] and urban ecosystems [31]. Sentinel-2 is a reliable tool for investigating urban areas and a series of its 10 m spatial resolution images can be used to identify informal settlements and new constructions [32]. The most important advantage of these images is the possibility to monitor the ground every five days.
In this study, a total of 30 Sentinel-2 images from a six-month period between May and November 2021 were analyzed. Images with a time interval of 5 days were used. Images that were cloudy were omitted, but these were very rare since the area has a very dry climate. All images considered were re-assembled into 10 m pixels. Pixel-based classification was performed using ENVI and object-based classification was performed using eCognition.
UAVs can be a powerful tool for providing remote sensing information because they allow flexible maneuvers, high-resolution images, sub-cloud flight, easy launch and landing and fast data access at low cost [33]. Disadvantages include flight restrictions, space-limiting regulations, short flight time due to battery consumption and large volumes of data collected, with long processing times [34,35]. In this study, a red-green-blue (RGB) image with a spatial resolution of 0.15 m collected on 5 May 2021 by a UAV was analyzed. Images were prepared using a phase one Ixu1000-100MP camera at a flight altitude of 900 m, an overlap of 80 × 70 and GSP of 5 to 6 cm/cm and were pre-processed and used to prepare DSM in the Pix4d software with a spatial resolution of 15 cm. This type of image is taken annually by municipalities to complete their urban database. Also, UAV images were prepared with an overlap of 70 × 80 and DSM with a spatial resolution of 15 cm.
Google Earth was also used in this study through images collected in spring 2021. Google Earth images have high spatial resolution and are freely available to the public. Specifications of all images used in the present study are shown in Table 1.

2.3. Method

The UAV images were classified using pixel-based methods (Maximum Likelihood, Minimum Distance, Mahalanobis and Spectral Angle Mapping (SAM)) and object-based methods (Bayes, SVM, Nearest neighbor, Decision tree and Random forest). To evaluate the scope to increase the classification accuracy of UAV images in preparing a land cover map, a Digital Surface Model (DSM) with a spatial resolution of 0.15 m was used with the object-based methods. Four types of land cover: building, barren land, green space and road, were distinguished given the current urbanization extent within the city and the susceptibility of non-urban surfaces to become sealed [36].
The ability of Google Earth images to identify new constructions was examined because this type of image is available for free, unlike UAV images, and has higher spatial resolution than satellite images. Google Earth images with a spatial resolution of 1.5 m were classified using different pixel-based and object-based methods and land cover maps were prepared.
Sentinel-2 images were used to prepare a land cover map using pixel-based and object-based methods. Since the spatial resolution of these images is 10 m and given the low vegetation cover of the study site, the normalized difference vegetation index (NDVI) was used to evaluate the ability to increase the accuracy of the land cover map obtained using these images. Sentinel-2 images were pre-processed using SNAP software, an UAV images were processed using pix4 software and finally, RGB and DSM images were prepared from them. Pixel-based classification was performed using ENVI software and object-oriented classification methods were performed using eCognition software. ArcMap software was also used to check for changes and validation.
The accuracy of each classification method was investigated using two metrics, kappa coefficient and overall accuracy, and the advantages and disadvantages of each method were evaluated. Differences in land cover over time, categorized as buildings, barren land, green space and paved roads, were compared using the UAV, Google Earth, and Sentinel-2 images (Figure 2). Based on the results, a method for identifying new constructions was developed. Sites identified as new constructions using the new method were validated in site (field) visits.

2.4. Image Classification Using Pixel-Based Methods

In digital images, each pixel has a specific numerical value in each image band, indicating the spectral behavior of its corresponding feature on the ground. By analyzing the numerical values of digital images in different bands, it is possible to identify terrain features in the image and classify them. This type of classification is based on the numerical value of the pixels in an image, where features with the same numerical value are grouped, an approach called the pixel-based method [37]. The pixel-based classification methods used in this study were maximum likelihood, minimum distance, Mahalanobis and SAM.
The maximum likelihood method (most similarity), a supervised classification method [38], is one of the best-known and most widely used methods for classifying digital data. In this method, the classification of the reflection value distribution in each training sample is represented by a probability density function based on probability theory [39].
In the minimum distance method, the average of all classes that have already been separated from each other using the training site method is first determined, and then the Euclidean distance of the reflection of each pixel is calculated from the average of all classes. This type of classification is simple and efficient mathematically and computationally, but its theoretical foundations are not as strong as those of the maximum likelihood classification method [40].
The Mahalanobis method is similar to the minimum distance method, but instead of the smallest Euclidean distance, it uses the shortest Mahalanobis distance [41]. In this method, it is assumed that the histogram is normal bands [42].
Spectral angle mapping (SAM), a supervised classification method, is an efficient way to compare the spectrum of images to a standard or reference spectrum. The algorithm of this method calculates the similarity between two spectra from the spectral angle between them. The angle between the two vectors is calculated by converting spectra to vectors in a space with the size of the number of bands. In this method, the direction of the vectors is important to calculate the angle, not their length, and therefore pixel brightness does not affect classification. Reducing the value of the angle (between 0 and 1) makes detection more accurate. If the value of the angle is 1, the whole image is identified as the target object [43].

2.5. Image Classification Using Object-Based Methods

Object-based image analysis has become an effective method for classifying land cover using remote sensing data [18,44]. Parameters such as image type, segmentation scale, accuracy evaluation, type of algorithm selected in classification, training locations, input data and target classes are important in the object-based classification of images [45]. After pre-processing and image preparation, the first stage of object-based classification is segmentation, which was done here using the multi-resolution segmentation algorithm. This algorithm creates visual objects by minimizing the spatial mean of heterogeneities and sequentially joining pixels in the image [46]. Segmentation is the first and most important step in image sub-classification into separate image units [47]. The Bayes, SVM, K-nearest-neighbor (KNN), decision tree (DT) and random forest (RF) algorithms [4] were used for object-based classification.
The Bayes method considers parameters as random variables with known distributions. A Bayes classification assumes that the existence (or non-existence) of a particular property of a class is not related to the existence (or non-existence) of another property. It estimates the probability of occurrence of different attribute values for different classes in a training set, and then uses these probabilities to classify patterns [48].
The SVM method was first formally introduced in 1992 [32]. It is a set of supervised, non-parametric learning methods used for classification [49] and tries to separate the data set by creating a hyperplane and provide a logical prediction for the new data set.
When using the KNN algorithm in object-based classification, the pixels are assigned to different classes based on their weight. In this classification method, impure pixels have one degree of membership for each class and according to fuzzy logic are classified into a particular class based on the highest degree of membership [50]. When using the KNN classification method, the highest membership degree indicates the closest distance from a given sample. For each image object, increasing the slope of the nearest neighbor function increases the final classification result [51].
In object-based classification methods, the creation of decision rules is an important step for land use classification [52]. Unlike single-stage classification methods, in which only one decision is made for each pixel and the pixel belongs to a particular class, in the DT method, one of the most common multi-stage classification methods, a set of decisions is made to classify the desired pixel correctly. The DT method uses interrelated classifiers, each of which performs part of the classification process and does not act alone. The DT is a representation of branches and nodes, with each node leading to a set of possible answers [53]. In this method, the optimal branch structure with the lowest error rate and the minimum number of nodes is determined and the class sharing and the number of branches and layers used are considered. The accuracy and efficiency of classification in this method are strongly dependent on the selection of branches [54].
The RF algorithm is a non-parametric machine learning algorithm based on a group of decision trees. Several decision trees grow in the classification of the RF algorithm. Pixels or unclassified phenomena are placed in a class according to their properties by passing a pixel through the X decision tree. The assignment of a pixel to one of the classes (Y number of classes) is decided by the decision trees and each decision tree announces its decision to include the pixel in a class. The forest assigns the voted pixel to the class with the maximum votes. Decision trees grow individually from the training sample set. With N times of sampling with replacement, two-thirds of the main data set is used to train a tree (N is the number of samples in the main data set). Therefore, by sampling with replacement, the remaining one-third of the data will not be involved in tree training and will be removed from the bag to be used for internal validation of the algorithm. The performance of RF in handling very large sets has been proven, hence it can be used in the analysis of satellite data [55,56].

2.6. Evaluating the Accuracy of Classification

Kappa coefficient and overall accuracy were used in this study to evaluate the validity of the classified maps. Overall accuracy calculates accuracy based on the ratio of correctly classified pixels to the sum of known pixels, whereas the kappa coefficient calculates the accuracy of the classification relative to a completely random classification [57]. Training samples were selected using UAV images because these images give an accurate knowledge of the study area.

2.7. Proposed Method

After investigating different images including Google Earth, Sentinel-2 and the photos taken by the drone and comparing different categorization methods including object-based and pixel-based to identify new constructions, the advantages and disadvantages of these methods were compared. Based on this analysis, a new method was developed to identify new constructions in small periods, aiming to overcome the limitations of the methods used. Based on the images taken by drone and Sentinel-2 time series, collected every five days, this method can identify new constructions with the lowest cost and processing time.

3. Results and Discussion

3.1. Accuracy of UAV Image Classification

To evaluate the ability to identify new constructions in urban areas using UAV images, the accuracy of different land cover mapping methods was examined. Four types of land cover (building, barren land, green space and roads) were distinguished. Various image classification methods, including several pixel-based and object-based methods, were examined. The ability of DSM to increase the accuracy of the land cover map was also explored. Figure 3 shows the land cover maps obtained from UAV images using the different methods. Kappa coefficient and overall accuracy values obtained in the evaluation and validation of the different methods of land cover mapping using UAV images are shown in Table 2.
Evaluation of the accuracy of pixel-based methods showed that Mahalanobis had the lowest accuracy (kappa coefficient = 0.51, overall accuracy = 67%) and maximum likelihood had the highest accuracy (kappa coefficient = 0.82) (Table 2). The SAM and minimum distance pixel-based methods (kappa coefficient = 0.62 and 0.56, respectively) ranked second to the maximum likelihood method in terms of accuracy.
Object-based classification methods, i.e., SVM, Bayes, KNN, DT and RF, were first examined on UAV RGB images and then by adding DSM (Figure 3). The results showed that the object-based methods were generally more accurate than the pixel-based methods. In the UAV RGB image classification, the lowest accuracy was obtained with the DT method (kappa coefficient = 0.72, overall accuracy = 82%) (Table 2). The other methods tested had kappa coefficients above 0.80, with KNN showing the highest accuracy (kappa coefficient = 0.93, overall accuracy = 92%). The accuracy of the object-based classification methods with DSM was highest for the KNN and SVM methods (kappa coefficient = 0.97 and 0.95, respectively) and the overall accuracy was estimated to be more than 90% for all methods (Table 2). Therefore, the use of the elevation component in object-based classification methods improved the kappa coefficient by 4%. This improved accuracy is useful in urban areas, especially in separating land cover for lands that have high elevation differences but similar spectral reflections, such as building materials and buildings.
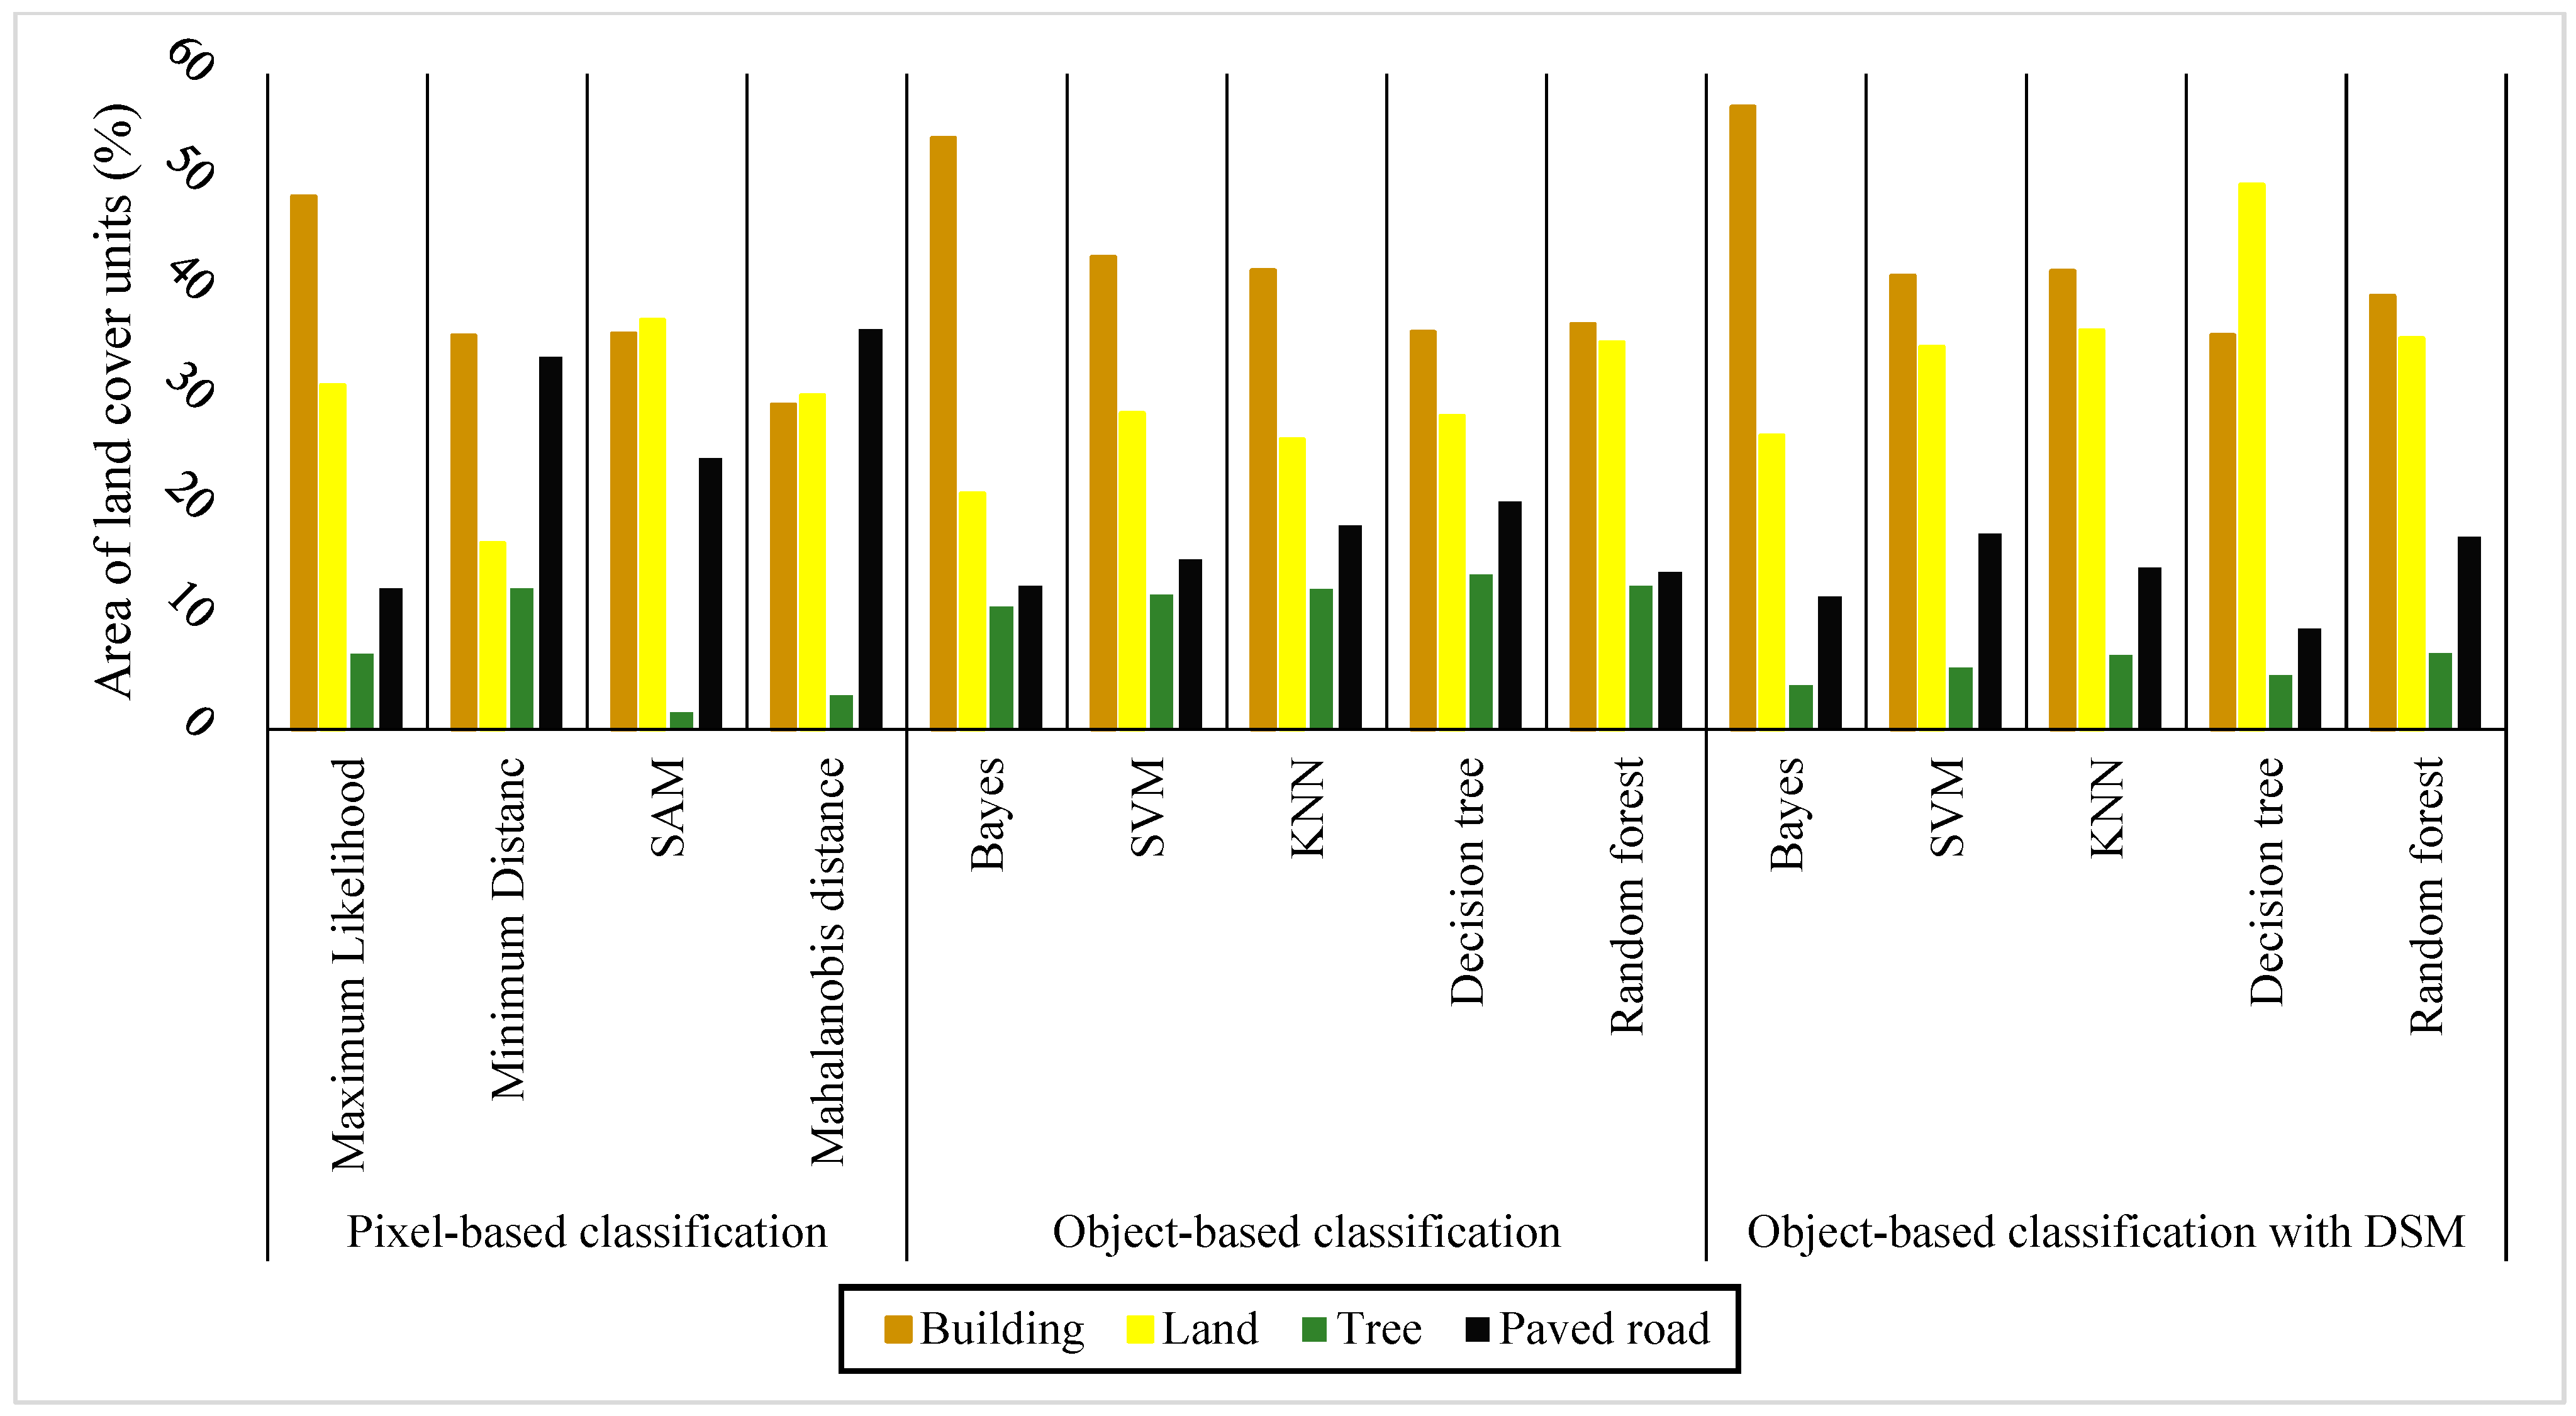
To investigate the differences between the classification methods, the percentage of each land cover area in the total study area was estimated and compared (Figure 4). The road cover class showed the greatest changes of all land cover classes when using pixel-based classification methods. With the SAM, Mahalanobis and minimum distance classification methods, more than 30% of the study area was identified as road cover, while maximum likelihood, which was the most accurate pixel-based classification method (Table 2), classified only 10% of the area as road. This indicates that the pixel-based classification methods performed poorly in road segmentation. With the Mahalanobis method, green spaces and shadows of buildings were identified as roads. With the minimum distance method, the shadows of buildings were considered to be green and buildings were not adequately separated from barren land. With the SAM method, buildings and road cover were not separated properly and vegetation had the smallest area of all pixel-based classification methods.
A comparison of the area of land cover classes identified using object-based methods showed that DT identified the greatest building cover (36.36%) and smallest area of green space (14.15%). The DT method also had lower accuracy than the other object-based classification methods in the classification of the UAV RGB image. With this method, the shadows of buildings and materials were identified as green space and road cover, which reduced the accuracy of land cover classification.
A comparison of the land cover area in object-based classification using DSM showed that the area of road and green space was reduced in all classification methods. With this method, the error in classifying building shadows observed for the object-based method without DSM was removed.

3.2. Accuracy of Google Earth Image Classification

Since Google Earth images are free and have high spatial resolution compared with satellite images, the ability of images from this source to identify new constructions in urban areas was investigated. The pixel-based and object-based classification results for the land cover map developed using Google Earth images are shown in Figure 5.
The kappa coefficient and overall accuracy values for Google Earth image classification using the different methods are shown in Table 3. Among the pixel-based methods, maximum likelihood had the highest accuracy (kappa coefficient = 0.75, overall accuracy = 80%) and SAM had the lowest accuracy (kappa coefficient = 0.39, overall accuracy = 47%). The minimum distance and Mahalanobis methods had kappa coefficients of 0.41 and 0.56, respectively (Table 3) In general, the pixel-based methods tested did not have the appropriate accuracy for separating land cover in urban areas.
In object-based classification of Google Earth images to prepare land cover maps for urban areas and identify new constructions, the SVM method (kappa coefficient = 0.23, overall accuracy = 39%) was less accurate than all other object-based methods as well as all pixel-based methods. KNN had the highest accuracy of the object-based methods (kappa coefficient = 0.83), followed by DT (kappa coefficient = 0.69). Therefore, the use of object-based methods increased the accuracy of Google Earth image classification, with the kappa coefficient increasing by 8% compared with pixel-based methods.
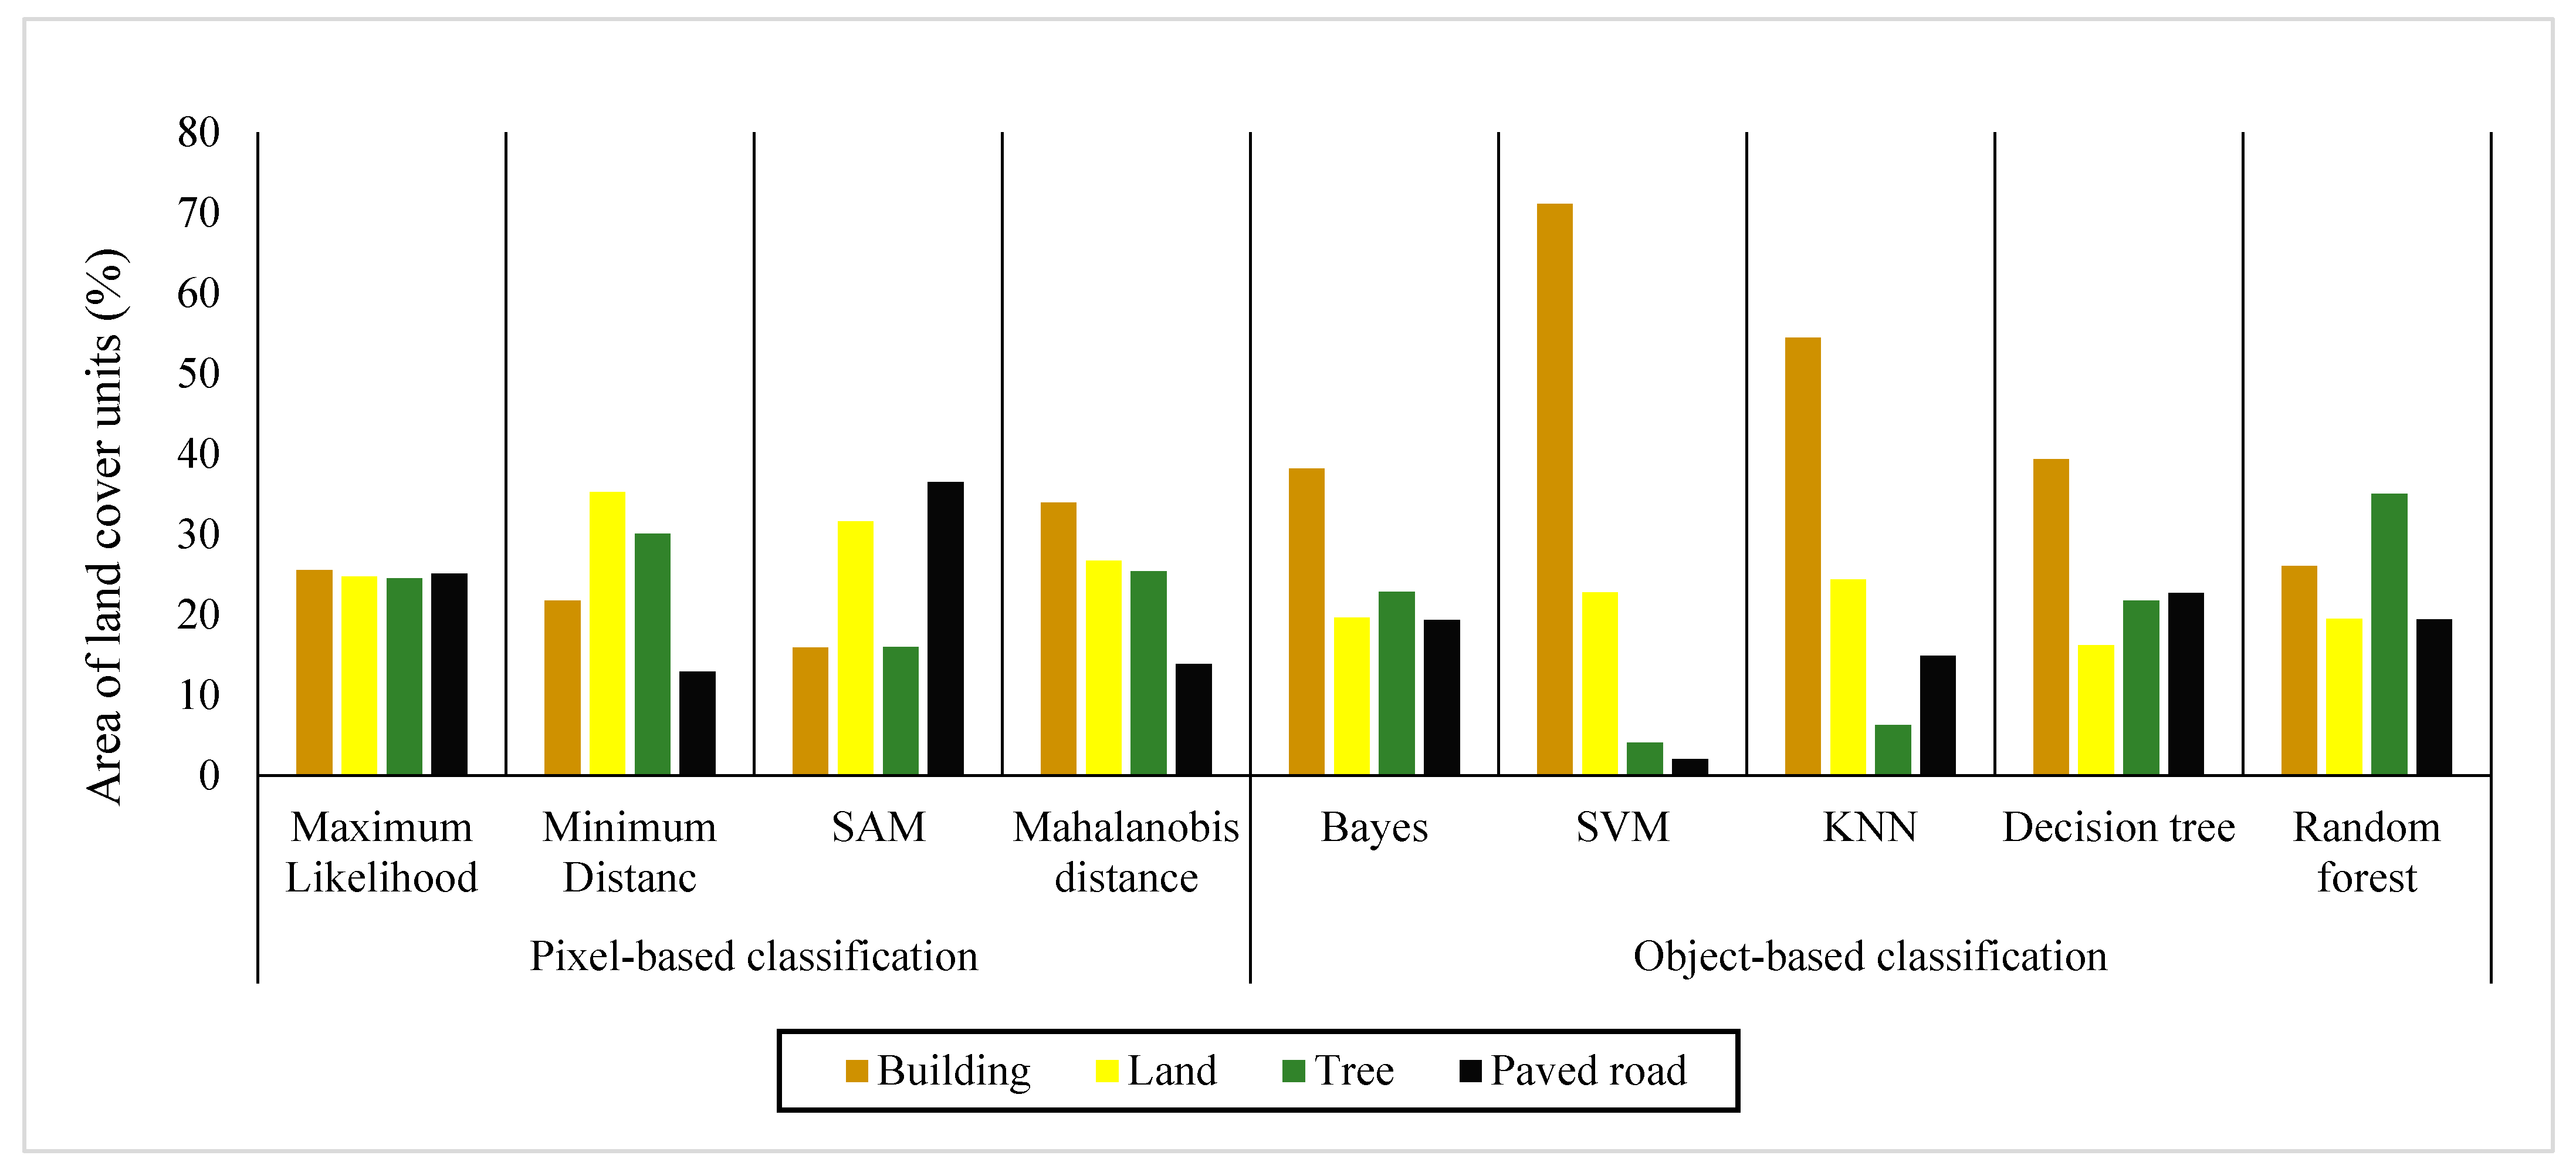
Comparisons of the percentage area of different land cover units in Google Earth images according to the pixel-based methods showed that SAM identified the largest area (40%) as road cover (Figure 6), with the land cover class of residential houses not being well separated from the roads class. The minimum distance method gave the largest percentage of green space covered area since both roads and shadows of trees were identified as green space. The Mahalanobis method identified the highest percentage of area covered by buildings, but the shadow of trees was classified as vegetation and roads were not well separated from other land cover types.
Among the object-based classification methods, SVM identified 70% of the study area as built-up area and was not able to separate road from green space (Figure 6). The area of these two types of cover was less than 5%. The highest percentage of green space coverage (35%) was obtained in the RF object-based classification, which identified a large proportion of roads and shadows of buildings as green space.

3.3. Accuracy of Sentinel-2 Image Classification

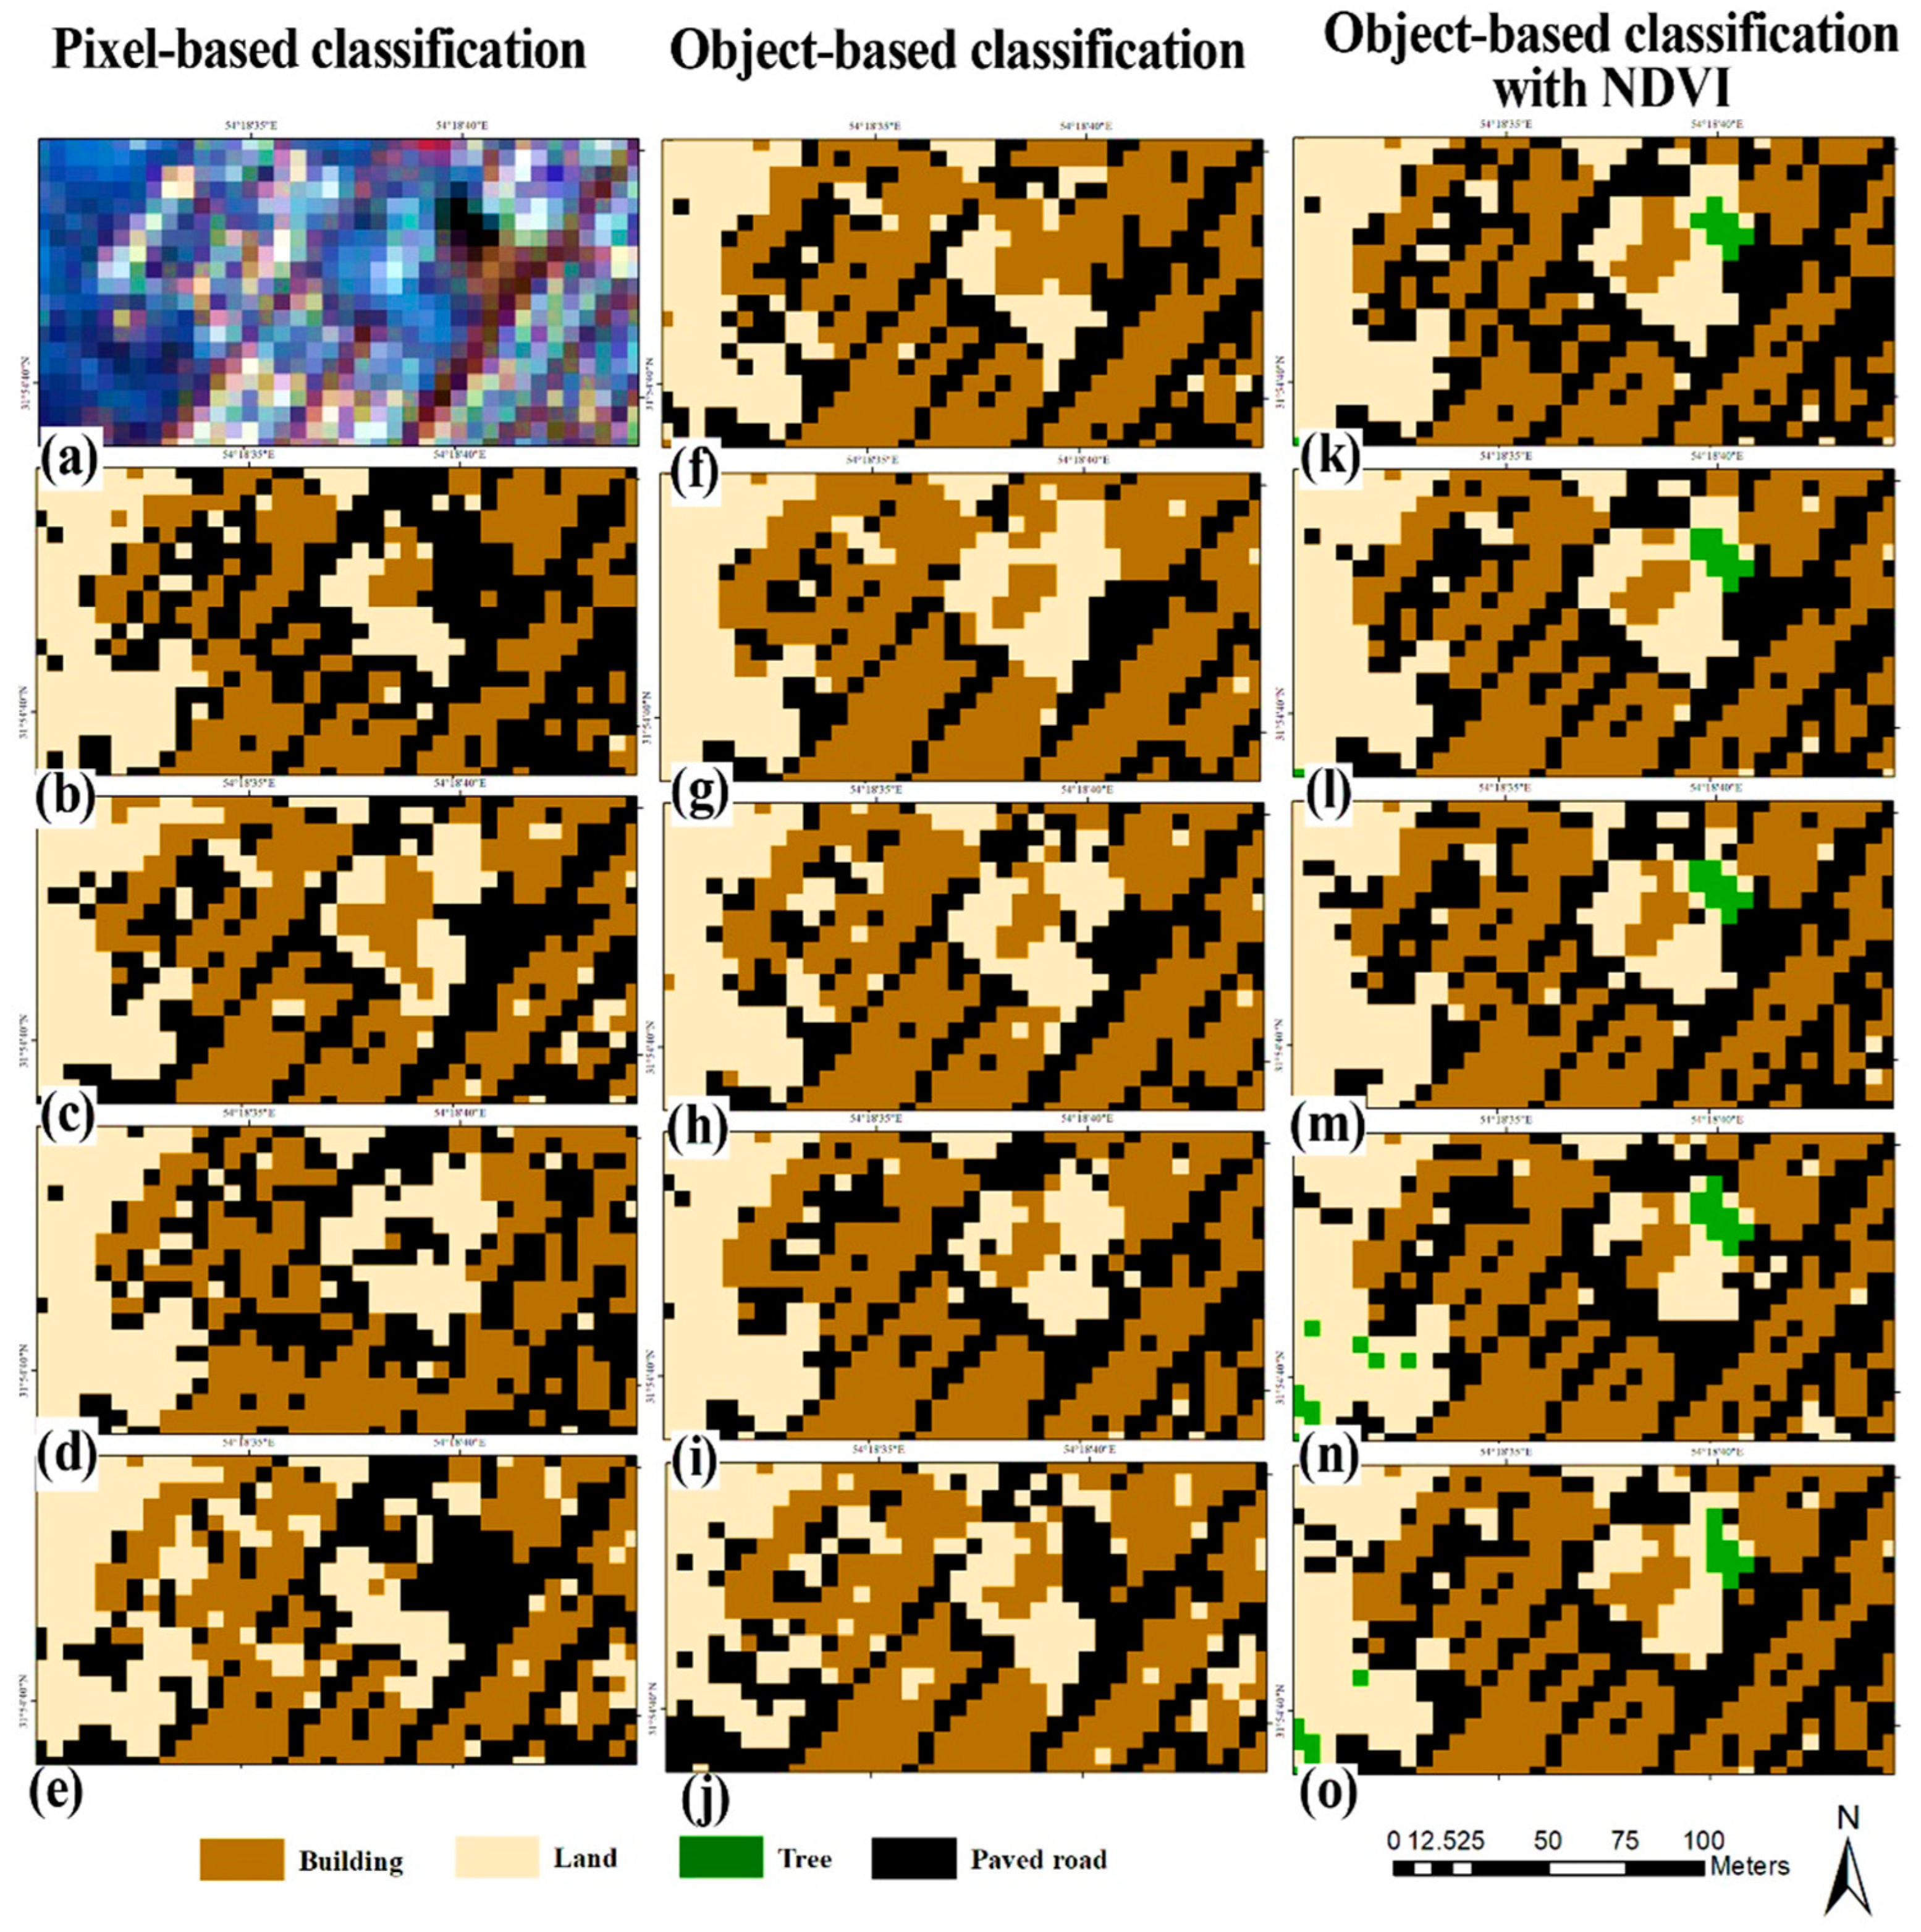
Sentinel-2 images, with a spatial resolution of 10 m and the possibility of monitoring the ground in five days, are suitable data for urban studies. In this study, Sentinel-2 images were divided into three types of land cover (building, barren land and road) using object-based and pixel-based classification methods. Since the study area has a dry climate and little vegetation, the ability to increase the accuracy of classification using NDVI was tested. The land cover classification of the Sentinel-2 images is shown in Figure 7.
A comparison of the accuracy of the pixel-based methods of classification of Sentinel-2 images showed that the maximum likelihood method had the highest accuracy (kappa coefficient = 0.74, overall accuracy = 80%) and the Mahalanobis method had the lowest accuracy (kappa coefficient = 0.47, overall accuracy = 51%) (Table 4). The SAM and minimum distance pixel-based methods also had relatively high kappa coefficients (0.73 and 0.66, respectively).
Among the object-based methods, SVM and KNN had the highest accuracy in classifying Sentinel-2 images, whereas RF and Bayes showed lower accuracy than other methods (kappa coefficient = 0.69 and 0.71, respectively). The use of NDVI in land cover mapping did not increase the accuracy of the classification methods due to the very small area of urban green spaces in the city of Yazd. The use of a vegetation index may be more effective if the goal is to accurately identify vegetation in areas with more vegetation cover.
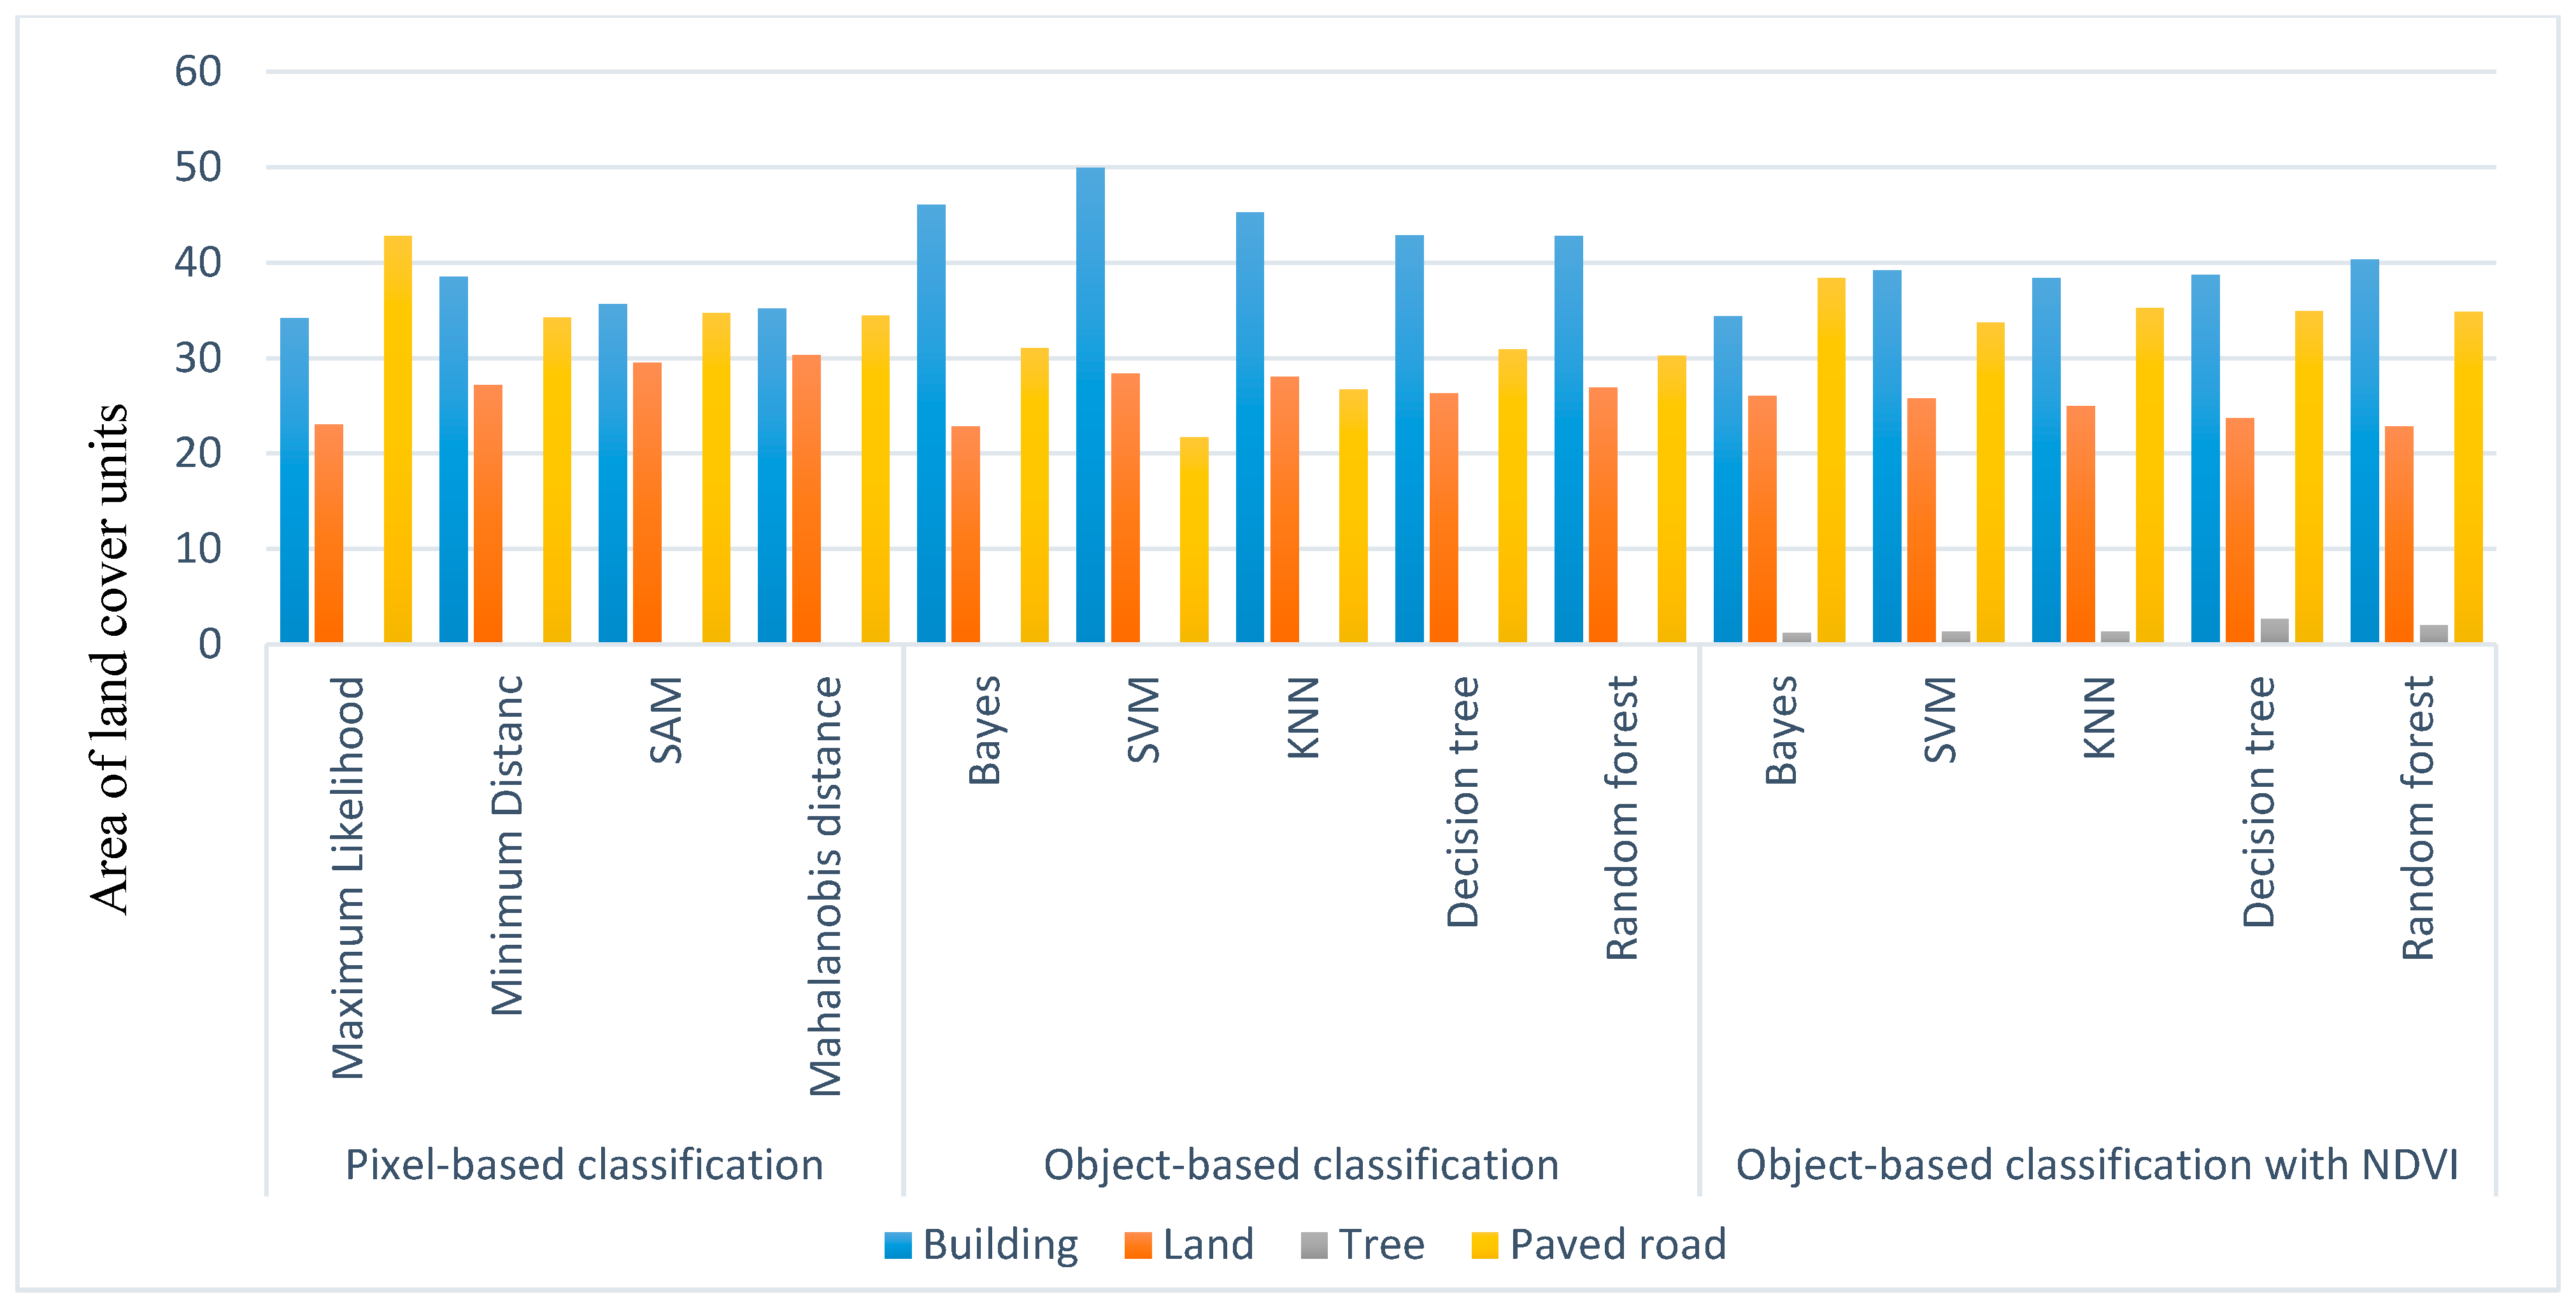
The classification of land cover area in Sentinel-2 images using pixel-based methods gave a higher percentage of road area than that identified using UAV images, which had higher accuracy (Figure 8). Due to the small width of roads (10.5 m main roads, 7 m side roads) in the study area and the 10 m resolution of the Sentinel-2 images, classification based solely on the pixel spectral characteristics had problems with the identification of roads. In addition, in pixel-based classification methods, training samples may be entered with more errors, while in object-based classification training samples are applied based on an object that is separated according to similar characteristics, which avoids the impact of impure training samples.

3.4. Proposed Method for Identification of New Constructions in Urban Areas

The aim of image classification was to separate the unconstructed pieces of land, buildings, vegetation and asphalt. Due to the high amount of wind and dust in dry areas, asphalt is not completely black in most areas and does not include a spectrum similar to the unconstructed pieces of land. Therefore, this issue was considered in the initial sampling so that training samples of roads with black, light and dusty asphalt were properly identified. Additionally, it was challenging to distinguish new buildings within the historic district, covering most of the study area, from the surrounding land since they are made of clay and mud (without materials such as bricks and iron). Thus, preparing a land cover map that could separate buildings from unconstructed pieces of land was of great importance. DSM was used as auxiliary data by the UAV image. As the UAV image of the study area was available, training samples were selected based on this image which led to a good understanding of the land cover of the area. The sites identified as new constructions were examined through ground inspection.
Since the study area is largely composed of the historic district, which is made up of clay and mud and is not very similar to the unconstructed pieces of land in terms of spectrum, so preparing a land cover map that could separate buildings from unconstructed pieces of land was of great importance. First, a land cover map was prepared to identify new constructions by examining the land cover changes of new constructions. Then, the constraints of using each type of image were examined and the results showed that the UAV images were highly accurate in identifying new constructions, but it is not feasible to do imaging of the whole city several times a year. Google Earth images had acceptable accuracy for identifying new constructions, but it is not a good method for executive work due to a lack of access to the desired dates. However, Sentinel images had low accuracy as they used the method of examining the land cover change resulting from land cover images. Thus, a method was proposed to extract unconstructed pieces of land in early-year imaging using object-oriented and DSM classification methods.
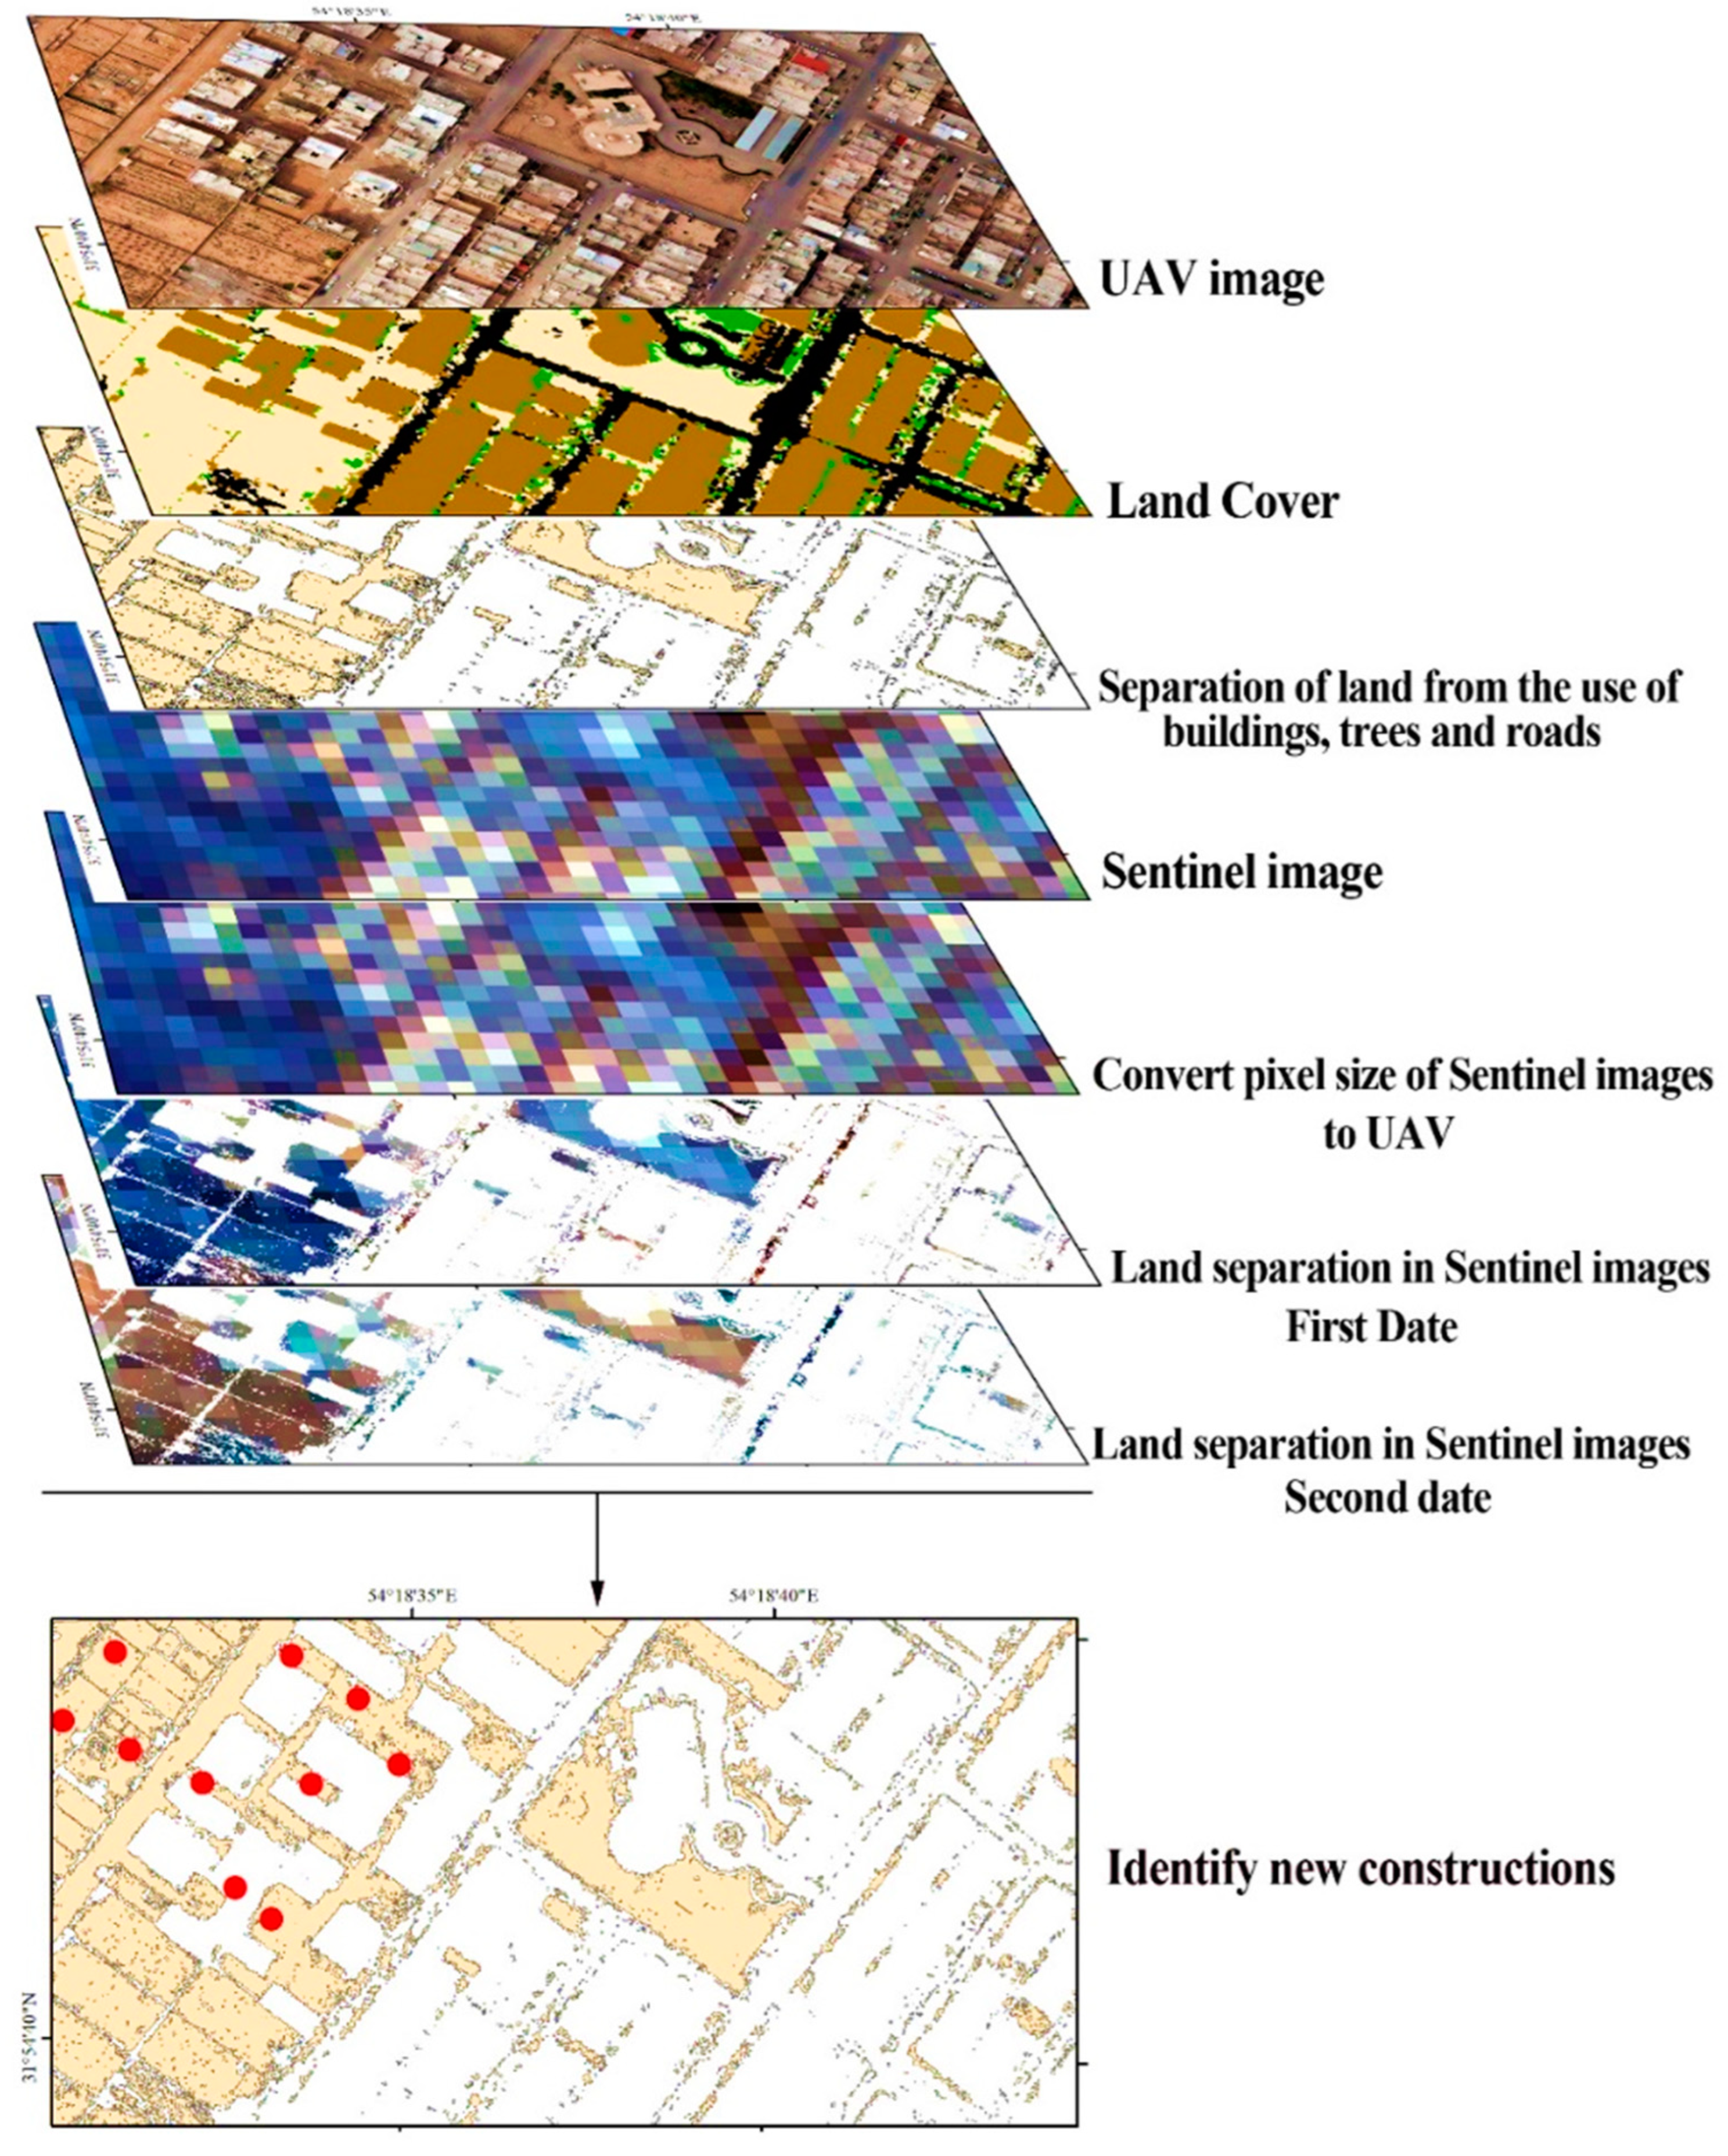
Based on the accuracy of land cover mapping using the different images and classification methods, and considering the advantages and disadvantages of each method, an improved method for identifying new constructions in urban areas was developed (Figure 9). This method acknowledges the impossibility of continuous monitoring of urban areas using UAVs, due to the very high costs of the time series, problems related to obtaining flying permits, large volumes of data and long processing times, as well as the need for municipalities to continuously monitor and identify unauthorized constructions before completion of those constructions. The method instead requires UAV images taken once a year, typically performed by local authorities, and access to the Sentinel-2 images. First, using the UAV image and DSM, a land cover map for a study area is prepared and areas without buildings are identified as a class (bare land). The spatial resolution (pixel size) of the Sentinel-2 images (10 m) is converted to the size of UAV images (0.15 m) through resizing and the areas without constructions in the Sentinel-2 images are separated using the land cover map obtained from the UAV image. Next, the spectral change curves over time in the pixels corresponding to areas without construction are examined using a Sentinel-2 image taken on the same date as the UAV imaging, and points showing major changes in spectral reflectance over time are designated as new construction sites. This assumption was made considering the urbanization level of the city and the absence of agricultural areas. To validate the accuracy, the location of the designated points is assessed by a site visit.
To test the accuracy of the method, it was applied to the study site in Yazd. The results of the local visit showed that all areas categorized using the method as representing buildings under construction were accurately identified. This method eliminates the shortcomings of previous methods, such as lack of access to the position of new constructions at the desired time, the impossibility of checking for changes in time series in areas with no images for previous dates and low accuracy for checking changes. Additionally, the proposed method for identifying new constructions in time requires a shorter time for image processing and thus has lower costs than other conventional methods.
Based on the results of the present study and on those by Boonpook et al. [24], who identified new constructions using deep learning methods and UAV images, UAV images can be used for accurate identification of new constructions in urban areas. Although the use of UAV images is very expensive, the novel method proposed in this study can be used to prepare a new UAV image once a year to identify new constructions during the year. Based on results obtained by Liu et al. [25] in identifying new constructions using the UAV DSM image, it appears that using a combination of DSM and UAV images increases the accuracy of construction identification. A comparison of pixel-based and object-based methods in this study produced similar results to those reported by Priyadarshini et al. [26], in that object-based methods were found to be more accurate in identifying new constructions, with the SVM method giving the highest accuracy for classifying the land cover in Sentinel-2 images. The results in this study were also similar to those reported by Phiri et al. [23], who compared different preparation methods for land cover maps using Sentinel-2 images.

4. Conclusions

This study showed that UAV images have a very good ability to separate land cover types, but if the images have shadows, it is not possible to identify areas with no constructions adjacent to multi-storey buildings. The use of DSM from UAV images eliminates the error caused by the presence of building shadows and increases the accuracy of UAV image classification using object-based methods. In general, object-based methods using UAV images with DSM can accurately identify new constructions. However, due to the large area of cities, the high cost of imaging, the need for flight permits and the large volume of images to be processed, monitoring urban constructions using UAV images is time-consuming.
In this study, Google Earth images were also identified as a good source of data for land cover mapping in urban areas because of their high spatial resolution compared with satellite images. However, Google Earth images are limited in time, as the images are usually only updated two or three times a year and the exact date of the next update is not known but may be required to monitor new construction. Therefore, Google Earth images are not suitable for the timely monitoring of new urban constructions. However, in areas where UAV imaging is not possible for some reason and the time of construction is not important, Google Earth image data can be used to more accurately identify an area and compare changes.
Sentinel-2 images with a spatial resolution of 10 m and temporal resolution of five days were used in this study to identify new constructions. The results showed that these images alone cannot identify new constructions in urban areas unless the building is large and includes several pixels.
Considering the shortcomings of existing methods, a new method for accurate and timely monitoring of new constructions in urban areas, using imaging by UAV once a year and the time series of Sentinel-2 images, was developed. In this method, the exact position of areas without construction is identified using the UAV image on the date of collection and then changes in the amount of the corresponding pixels are examined using the Sentinel-2 images, with changes in the spectral curve of the points indicating possible construction in these areas. Validation of the method in a site visit revealed that it reliably identified all areas under construction in the study area.

Author Contributions

S.S. and F.A.A. conceived the original idea. H.R.G.M., Z.K. and C.S.S.F. supervised the project. F.A.A., A.S. and S.S. performed the analytical calculations. S.S., C.S.S.F. and Z.K. wrote the manuscript. All the authors participated in the development of the study and the experiments. All authors have read and agreed to the published version of the manuscript.

Funding

This research received no external funding.

Data Availability Statement

Not applicable.

Acknowledgments

Authors are grateful to the University of Tehran and Stockholm University for their support of this research.

Conflicts of Interest

The authors declare no conflict of interest.

References

  1. Jaeger, J.A.G.; Schwick, C. Improving the Measurement of Urban Sprawl: Weighted Urban Proliferation (WUP) and Its Application to Switzerland. Ecol. Indic. 2014, 38, 294–308. [Google Scholar] [CrossRef]
  2. Yeh, A.G.O.; Li, X. Measurement and monitoring of urban sprawl in a rapidly growing region using entropy. Photogramm. Eng. Remote Sens. 2001, 67, 83–90. [Google Scholar]
  3. Szuster, B.W.; Chen, Q.; Borger, M. A comparison of classification techniques to support land cover and land use analysis in tropical coastal zones. Appl. Geogr. 2011, 31, 525–532. [Google Scholar] [CrossRef]
  4. Duro, D.C.; Franklin, S.E.; Dubé, M.G. A comparison of pixel-based and object-based image analysis with selected machine learning algorithms for the classification of agricultural landscapes using SPOT-5 HRG imager. Remote Sens. Environ. 2012, 118, 259–272. [Google Scholar] [CrossRef]
  5. Clemens, E.; Drăguţ, L. Automated classification of topography from SRTM data using object-based image analysis. Geomorphology 2012, 141–142, 21–33. [Google Scholar]
  6. Kim, M. Object-Based Spatial Classification of Forest Vegetation with IKONOS Imagery. Ph.D. Thesis, University of Georgia, Athens, GA, USA, 2009; p. 133. [Google Scholar]
  7. Blaschke, T. Object based image analysis for remote sensing. ISPRS J. Photogramm. Remote Sens. 2010, 65, 2–16. [Google Scholar] [CrossRef] [Green Version]
  8. Zhang, L.; Huang, X.; Huang, B.; Li, P. A pixel shape index coupled with spectral information for classification of high spatial resolution remotely sensed imagery. IEEE Trans. Geosci. Remote Sens. 2006, 44, 2950–2961. [Google Scholar] [CrossRef]
  9. Gao, Y.; Mas, J.F. A comparison of the performance of pixel-based and object-based classifications over images with various spatial resolutions. Online J. Earth Sci. 2008, 2, 27–35. [Google Scholar]
  10. Yan, G. Pixel Based and Objects Oriented Image Analysis for Coal Fire Research; ITC: Enschede, The Netherlands, 2003; pp. 15–97. [Google Scholar]
  11. Leinenkugel, P.; Deck, R.; Huth, J.; Ottinger, M.; Mack, B. The Potential of Open Geodata for Automated Large-Scale Land Use and Land Cover Classification. Remote Sens. 2019, 11, 2249. [Google Scholar] [CrossRef] [Green Version]
  12. Thapa, B.; Watanabe, T.; Regmi, D. Flood Assessment and Identification of Emergency Evacuation Routes in Seti River Basin, Nepal. Land 2022, 11, 82. [Google Scholar] [CrossRef]
  13. Agapiou, A.; Vionis, A.; Papantoniou, G. Detection of Archaeological Surface Ceramics Using Deep Learning Image-Based Methods and Very High-Resolution UAV Imageries. Land 2021, 10, 1365. [Google Scholar] [CrossRef]
  14. Xie, F.; Zhao, G.; Mu, X.; Tian, P.; Gao, P.; Sun, W. Sediment Yield in Dam-Controlled Watersheds in the Pisha Sandstone Region on the Northern Loess Plateau, China. Land 2021, 10, 1264. [Google Scholar] [CrossRef]
  15. Koeva, M.; Humayun, M.I.; Timm, C.; Stöcker, C.; Crommelinck, S.; Chipofya, M.; Zevenbergen, J. Geospatial Tool and Geocloud Platform Innovations: A Fit-for-Purpose Land Administration Assessment. Land 2021, 10, 557. [Google Scholar] [CrossRef]
  16. Alfonso-Torreño, A.; Gómez-Gutiérrez, Á.; Schnabel, S. Dynamics of erosion and deposition in a partially restored valley-bottom gully. Land 2021, 10, 62. [Google Scholar] [CrossRef]
  17. Yu, Q.; Gong, P.; Tian, Y.Q.; Pu, R.; Yang, J. Factors affecting spatial variation of classification uncertainty in an image object-based vegetation mapping. Photogramm. Eng. Remote Sens. 2008, 74, 1007–1018. [Google Scholar] [CrossRef] [Green Version]
  18. Li, M.; Ma, L.; Blaschke, T.; Cheng, L.; Tiede, D. A systematic comparison of different object-based classification techniques using high spatial resolution imagery in agricultural environments. Int. J. Appl. Earth Obs. Geoinf. 2016, 49, 87–98. [Google Scholar] [CrossRef]
  19. Frantz, D.; Schug, F.; Okujeni, A.; Navacchi, C.; Wagner, W.; van der Linden, S.; Hostert, P. National-scale mapping of building height using Sentinel-1 and Sentinel-2 time series. Remote Sens. Environ. 2021, 252, 112128. [Google Scholar] [CrossRef]
  20. Gombe, K.E.; Asanuma, I.; Park, J.-G. Quantification of annual urban growth of Dar es Salaam Tanzania from Landsat time Series data. Adv. Remote Sens. 2017, 6, 175–191. [Google Scholar] [CrossRef] [Green Version]
  21. Iannelli, G.C.; Gamba, P. Jointly exploiting Sentinel-1 and Sentinel-2 for urban mapping. In Proceedings of the IGARSS 2018–2018 IEEE International Geoscience and Remote Sensing Symposium, Valencia, Spain, 22–27 July 2018; pp. 8209–8212. [Google Scholar]
  22. Ng, W.-T.; Rima, P.; Einzmann, K.; Immitzer, M.; Atzberger, C.; Eckert, S.J.R.S. Assessing the potential of Sentinel-2 and Pléiades data for the detection of Prosopis and Vachellia spp. in Kenya. Remote Sens. 2017, 9, 74. [Google Scholar] [CrossRef] [Green Version]
  23. Phiri, D.; Simwanda, M.; Salekin, S.R.; Nyirenda, V.; Murayama, Y.; Ranagalage, M. Sentinel-2 Data for Land Cover. Use Mapping: A Review. Remote Sens. 2020, 12, 2291. [Google Scholar] [CrossRef]
  24. Boonpook, W.; Tan, Y.; Ye, Y.; Torteeka, P.; Torsri, K.; Dong, S. A deep learning approach on building detection from unmanned aerial vehicle-based images in riverbank monitoring. Sensors 2018, 18, 3921. [Google Scholar] [CrossRef] [PubMed] [Green Version]
  25. Liu, W.; Yang, M.; Xie, M.; Guo, Z.; Li, E.; Zhang, L.; Wang, D. Accurate Building Extraction from Fused DSM and UAV Images Using a Chain Fully Convolutional Neural Network. Remote Sens. 2019, 11, 2912. [Google Scholar] [CrossRef] [Green Version]
  26. Priyadarshini, K.N.; Sivashankari, V.; Shekhar, S. Identification of Urban Slums Using Classification Algorithms—A Geospatial Approach. In Proceedings of the International Conference on Unmanned Aerial System in Geomatics, Greater Noida, India, 6–7 April 2019; Springer: Cham, Switzerland; pp. 237–252. [Google Scholar]
  27. Immitzer, M.; Vuolo, F.; Atzberger, C. First Experience with Sentinel-2 data for crop and tree species classifications in Central Europe. Remote Sens. 2016, 8, 166. [Google Scholar] [CrossRef]
  28. Tavares, P.A.; Beltrão, N.E.S.; Guimarães, U.S.; Teodoro, A.C.J.S. Integration of sentinel-1 and sentinel-2 for classification and LULC mapping in the urban area of Belém, eastern Brazilian Amazon. Sensors 2019, 19, 1140. [Google Scholar] [CrossRef] [PubMed] [Green Version]
  29. Chunping, Q.; Schmitt, M.; Lichao, M.; Xiaoxiang, Z. Urban local climate zone classification with a residual convolutional Neural Network and multi-seasonal Sentinel-2 images. In Proceedings of the 2018 10th IAPR Workshop on Pattern Recognition in Remote Sensing (PRRS), Beijing, China, 19–20 August 2018; pp. 1–5. [Google Scholar]
  30. Gibson, L.; Engelbrecht, J.; Rush, D. Detecting historic informal settlement fires with sentinel 1 and 2 satellite data-Two case studies in Cape Town. Fire Saf. J. 2019, 108, 102828. [Google Scholar] [CrossRef]
  31. Haas, J.; Ban, Y. Sentinel-1A SAR and sentinel-2A MSI data fusion for urban ecosystem service mapping. Remote Sens. Appl. Soc. Environ. 2017, 8, 41–53. [Google Scholar] [CrossRef]
  32. Kranjčić, N.; Medak, D.; Župan, R.; Rezo, M.J.R.S. Support Vector Machine Accuracy Assessment for Extracting Green Urban Areas in Towns. Remote Sens. 2019, 11, 655. [Google Scholar] [CrossRef] [Green Version]
  33. Crommelinck, S.; Bennett, R.; Gerke, M.; Nex, F.; Yang, M.Y.; Vosselman, G. Review of automatic feature extraction from high-resolution optical sensor data for UAV-based cadastral mapping. Remote Sens. 2016, 8, 689. [Google Scholar] [CrossRef] [Green Version]
  34. Tahar, K.N.; Ahmad, A. An evaluation on fixed wing and multi-rotor UAV images using photogrammetric image processing. Int. J. Comput. Electr. Autom. Control. Inf. Eng. 2013, 7, 48–52. [Google Scholar]
  35. Shahraki, S.Z.; Sauri, D.; Serra, P.; Modugno, S.; Seifolddini, F.; Pourahmad, A. Urban sprawl pattern and land-use change detection in Yazd, Iran. Habitat Int. 2011, 35, 521–528. [Google Scholar] [CrossRef]
  36. Toth, C.; Józków, G. Remote sensing platforms and sensors: A survey. ISPRS J. Photogramm. Remote Sens. 2016, 115, 22–36. [Google Scholar] [CrossRef]
  37. Whiteside, T.G.; Boggs, G.S.; Maier, S.W. Comparing object-based and pixel-based classifications for mapping savannas. Int. J. Appl. Earth Obs. Geoinf. 2011, 13, 884–893. [Google Scholar] [CrossRef]
  38. Chen, M.; Su, W.; Li, L.; Zhang, C.; Yue, A.; Li, H. Comparisson of Pixel-Based and Obgectoriented Knowledge Based Classification Methods Using SPOT5 Imagery. WSEAS Trans. Inf. Sci. Appl. 2009, 6, 477–489. [Google Scholar]
  39. Yuqi, T. Object-Based Change Detection with Multi-Feature in Urban High-Resolution Remote Sensing Imagery. Ph.D. Thesis, Wuhan University, Wuhan, China, 2013; p. 162. [Google Scholar]
  40. Tso, B.; Mather, P.M. Chapter 2–3. In Classification Methods for Remotely Sensed Data, 2nd ed.; Taylor and Francis Pub.: Boca Raton, FL, USA, 2009. [Google Scholar]
  41. Xing, E.P.; Ng, A.Y.; Jordan, M.I.; Russell, S. Distance metric learning, with application to clustering with side-information. In Advances in NIPS; MIT Press: Cambridge, MA, USA, 2003. [Google Scholar]
  42. Richards, J.A. Remote Sensing Digital Image Analysis; Springer: Berlin/Heidelberg, Germany, 1999; p. 240. [Google Scholar]
  43. Luc, B.; Deronde, B.; Kempeneers, P.; Debruyn, W.; Provoost, S.; Sensing, R.; Observation, E. Optimized Spectral Angle Mapper classification of spatially heterogeneous dynamic dune vegetation, a case study along the Belgian coastline. In Proceedings of the 9th International Symposium on Physical Measurements and Signatures in Remote Sensing (ISPMSRS), Beijing, China, 17–19 October 2005; Volume 1, pp. 17–19. [Google Scholar]
  44. Kumar, R.; Nandy, S.; Agarwal, R.; Kushwaha, S.P.S. Forest cover dynamics analysis and prediction modeling using logistic regression model. Ecol. Indic. 2014, 45, 444–455. [Google Scholar] [CrossRef]
  45. Tehrany, M.S.; Pradhan, B.; Jebuv, M.N. A comparative assessment between object and pixel-based classification approaches for land use-land cover mapping using SPOT 5 imagery. Geocarto Int. 2014, 29, 351–369. [Google Scholar] [CrossRef]
  46. Baatz, M.; Schäpe, A. Object-based and Multi-Scale Image Analysis in Semantic Network. In Proceedings of the 2nd International Symposium on Operationalization of Remote Sensing, ITC, Enschede, The Netherlands, 16–20 August 1999. [Google Scholar]
  47. Huang, L.; Ni, L. Object-based Classification of High Resolution Satellite Image for Better Accuracy. In Proceedings of the 8th International Symposium on Spatial Accuracy Assessment in Natural Resources and Environment, Shanghai, China, 25–27 June 2008. [Google Scholar]
  48. Pradhan, R.; Ghose, M.K.; Jeyaram, A. Land cover classification of remotely sensed satellite data using bayesian and hybrid classifier. Int. J. Comput. Appl. 2010, 7, 1–4. [Google Scholar] [CrossRef]
  49. Rudrapal, D.; Subhedar, M. Land cover classification using support vector machine. Int. J. Eng. Res. Technol. 2015, 4, 584–588. [Google Scholar] [CrossRef]
  50. Myint, S.W.; Gober, P.; Brazel, A.; Grossman-Clarke, S.; Weng, Q. Per-pixel vs. object-based classification of urban land cover extraction using high spatial resolution imagery. Remote Sens. Environ. 2011, 115, 1145–1161. [Google Scholar] [CrossRef]
  51. Wijaya, A.; Budiharto, R.S.; Tosiani, A.; Murdiyarso, D.; Verchot, L.V. Assessment of Large Scale land Cover Change Classifications and Drivers of Deforestation in Indonesia. Int. Arch. Photogramm. Remote Sens. Spat. Inf. Sci. 2015, 40, 557–573. [Google Scholar] [CrossRef] [Green Version]
  52. DeFries, R.S.; Chan, J.C.-W. Multiple Criteria for Evaluating Machine Learning Algorithms for Land Cover Classification from Satellite Data. Remote Sens. Environ. 2000, 74, 503–515. [Google Scholar] [CrossRef]
  53. Lennon, R. Remote Sensing Digital Image Analysis: An Introduction; ESA/ESRIN: Frascati, Italy, 2002. [Google Scholar]
  54. Rounds, E. A combined nonparametric approach to feature selection and binary decision tree design. Pattern Recognit. 1980, 12, 313–317. [Google Scholar] [CrossRef]
  55. Basukala, A.K.; Oldenburg, C.; Schellberg, J.; Sultanov, M.; Dubovyk, O. Towards improved land use mapping of irrigated croplands: Performance assessment of different image classification algorithms and approaches. Eur. J. Remote Sens. 2017, 50, 187–201. [Google Scholar] [CrossRef] [Green Version]
  56. Breiman, L.; Cutler, A. Random Forests. 2017. Available online: https://www.stat.berkeley.edu/~breiman/RandomForests/cc_papers.htm (accessed on 30 June 2002).
  57. McHugh, L. Interrater reliability: The kappa statistic. Biochem. Med. 2012, 22, 276–282. [Google Scholar] [CrossRef]
Figure 1. (a) Location of Yazd in central Iran, (b) the study area in Yazd city, and examples of (c) unmanned aerial vehicle (UAV), (d) Google Earth and (e) Sentinel-2 images of the study area.
Remotesensing 14 03227 g001
Figure 2. General view of the methodological framework used in this study.
Remotesensing 14 03227 g002
Figure 3. Classification of unmanned aerial vehicle (UAV) images obtained using: (1) pixel-based methods (a) UAV image, (b) maximum likelihood method, (c) minimum distance method, (d) spectral angle mapping (SAM) and (e) Mahalanobis method; (2) object-based methods (f) Bayes method, (g) support vector machine (SVM), (h) K-nearest-neighbor (KNN), (i) decision tree (DT) and (j) random forest (RF); (3) object-based methods using the digital spatial model (DSM) (k) Bayes, (l) SVM, (m) KNN, (n) DT and (o) RF.
Remotesensing 14 03227 g003
Figure 4. Percentage area of different land cover units (buildings, barren land, trees, roads) identified when using pixel-based, object-based and object-based with digital elevation model (DSM) methods to classify unmanned aerial vehicle (UAV) images.
Remotesensing 14 03227 g004
Figure 5. Classification of Google Earth images obtained using pixel-based methods (a) Google Earth image, (b) maximum likelihood method, (c) minimum distance method, (d) spectral angle mapping (SAM) and (e) Mahalanobis method; and object-based methods: (f) Bayes method, (g) support vector machine (SVM), (h) K-nearest neighbor (KNN), (i) decision tree (DT) and (j) random forest (RF).
Remotesensing 14 03227 g005
Figure 6. Percentage area of different land cover units (buildings, barren land, trees, roads) identified when using pixel-based and object-based methods to classify Google Earth images.
Remotesensing 14 03227 g006
Figure 7. Classification of Sentinel-2 images obtained using pixel-based methods: (a) Sentinel-2 image, (b) maximum likelihood method, (c) minimum distance method, (d) spectral angle mapping (SAM) and (e) Mahalanobis method; object-based methods: (f) Bayes method, (g) support vector machine (SVM), (h) K-nearest neighbor (KNN), (i) decision tree (DT) and (j) random forest (RF); and object-based methods with normalized difference vegetation index (NDVI): (k) Bayes method, (l) SVM, (m) KNN, (n) DT and (o) RF.
Remotesensing 14 03227 g007
Figure 8. Percentage area of different land cover units (buildings, barren land, trees, roads) identified when using pixel-based, object-based and object-based with normalized difference vegetation index (NDVI) methods to classify Sentinel-2 images.
Remotesensing 14 03227 g008
Figure 9. General framework of the proposed method for identification of new constructions in urban areas.
Remotesensing 14 03227 g009
Table 1. Specifications of the Sentinel-2, Google Earth and unmanned aerial vehicle (UAV) images used in this study.
ImageWavelength (µm)BandSpatial Resolution (m)
Sentinel-2A0.458–0.523Band 2—Blue10
0.543–0.578Band 3—Green
0.650–0.680Band 4—Red
0.785–0.899Band 8—Infrared
Google Earth 1.5
UAV RGB0.450Blue0.15
0.550Green
0.625Red
DSM--0.15
Table 2. Accuracy of classification of unmanned aerial vehicle (UAV) images using pixel-based methods, object-based methods and object-based methods with the digital spatial model (DSM).
Kappa CoefficientOverall Accuracy (%)
Pixel-based classificationMaximum likelihood0.8285
Minimum distance0.5679
Spectral angle mapping 0.6276
Mahalanobis 0.5167
Object-based classificationBayes0.992
Support vector machine 0.9188
K-nearest-neighbor 0.9392
Decision tree0.7882
Random forest0.8376
Object-based classification with DSMBayes0.9493
Support vector machine0.9594
K-nearest-neighbor0.9794
Decision tree0.9391
Random forest0.9192
Table 3. Accuracy of classification of Google Earth images using pixel-based and object-based methods.
Kappa CoefficientOverall Accuracy (%)
Pixel-based classificationMaximum likelihood0.7580
Minimum distance0.4153
Spectral angle mapping0.3947
Mahalanobis0.5660
Object-based classificationBayes0.5653
Support vector machine0.2337
K-nearest-neighbor0.8379
Decision tree0.6974
Random forest0.6675
Table 4. Accuracy of classification of Sentinel-2 images using pixel-based methods, object-based methods and object-based methods with normalized difference vegetation index (NDVI).
Kappa CoefficientOverall Accuracy (%)
Pixel-based classificationMaximum likelihood0.7480
Minimum distance0.6679
Spectral angle mapping0.7367
Mahalanobis 0.4751
Object-based classificationBayes0.7176
Support vector machine0.8774
K-nearest-neighbor0.8582
Decision tree0.875
Random forest0.6973
Object-based classification with NDVIBayes0.7480
Support vector machine0.8581
K-nearest-neighbor0.8177
Decision tree0.7683
Random forest0.7175
Publisher’s Note: MDPI stays neutral with regard to jurisdictional claims in published maps and institutional affiliations.