Article

Shoreline Dynamics of Chongming Island and Driving Factor Analysis Based on Landsat Images

1
Department of Ecology, College of Biology and the Environment, Nanjing Forestry University, Nanjing 210037, China
2
Co-Innovation Center for Sustainable Forestry in Southern China, Nanjing Forestry University, Nanjing 210037, China
3
Taihu Laboratory for Lake Ecosystem Research, State Key Laboratory of Lake Science and Environment, Nanjing Institute of Geography and Limnology, Chinese Academy of Sciences, Nanjing 210008, China
4
University of Chinese Academy of Sciences, Beijing 100049, China
*
Author to whom correspondence should be addressed.
Remote Sens. 2022, 14(14), 3305; https://doi.org/10.3390/rs14143305
Submission received: 22 May 2022 / Revised: 22 June 2022 / Accepted: 5 July 2022 / Published: 8 July 2022

Abstract

:
Chongming Island, the third largest island in China, has experienced dramatic shoreline changes due to erosion, river deposits, and human activities. While previous studies have shown the capacity of Landsat series images to extract shoreline dynamics, the spatial variation of shoreline dynamics and their corresponding driving factors remain unclear. Therefore, we established a method to monitor the shoreline dynamics of Chongming Island from 1984 to 2020 and to evaluate the driving factors of shoreline changes using a novel approach to Landsat image analysis. The method, based on the LISA (local indicator of spatial autocorrelation) concept, automatically extracted the shoreline from Landsat imagery. The results show that the LISA method, based on the SWIR1 band, has a high capacity for shoreline extraction in Chongming Island. By distinguishing the responses of the eastern and northern shorelines to upstream sediment loads and comprehensively analyzing the driving factors of eastern and northern dynamics, we found that: (i) although upstream sediment loads decreased dramatically, the shoreline of Chongming Island is still expanding due to human activities (i.e., reclamation and an estuary project) and sediment re-suspension from near-shore or cross-shore currents; (ii) the expansion of Chongming Island was initially due to the dynamics at the eastern shoreline, but the expansion of the eastern shoreline slowed after 2008 as upstream sedimentation slowed, less construction of cofferdams took place, and the Qingcaosha Reservoir was constructed; (iii) the northern shoreline of Chongming Island expanded rapidly after 1999, due to the merger of Xinlongsha, Xincunsha, and Chongming Island, and the transport of coastal and offshore sediments by hydrodynamic processes; and (iv) the main driving factors of eastern shoreline movement on Chongming Island are cofferdam reclamation and coastal engineering, and the changes at the northern shoreline are mainly affected by reclamation projects, offshore sediment supplies, and upstream sediment inflow. The results of this study provide theoretical fundamentals for land reclamation and future urban planning for Chongming Island.

Graphical Abstract

1. Introduction

A shoreline is defined as the line of connection points between the land and a body of water [1]. A shoreline may be an artificial shoreline (i.e., the dividing line between sea water and an artificial coast) or a natural shoreline. The types of natural shoreline are bedrock shorelines (i.e., with a dividing line between sea water and the bedrock coast), sandy shorelines (i.e., with a dividing line between sea water and the sandy coast), developed muddy shorelines (i.e., with a dividing line between sea water and the developed muddy coast), and undeveloped muddy shorelines (determined by the vegetation growth state on the beach) [2]. Due to erosion and river deposits that affect shorelines, they are fundamentally dynamic [1].
Shoreline dynamics are primary landscape drivers in delta regions [3,4], and rapid shoreline changes (e.g., in the Nile delta and the Yellow River delta) are garnering greater global attention [5,6]. Shoreline shifts are not only affected by many natural factors associated with geology, hydrology, climate change, vegetation, and the environment, but are also impacted by human activities, such as land reclamation and water conservancy projects [5,7]. Therefore, it is important to study the mechanisms and driving factors of shoreline dynamics for the purposes of land use planning, land protection, and management.
Chongming Island, the third largest island in China, lies in the Yangtze River, the third longest river in the world [8]. Due to rapid development and urbanization, a high intensity of environmental engineering in the Yangtze River basin, the strong sea tidal effect in the estuary, and the influence of river flooding (such as the 1998 Yangtze River basin flood) the balance between scouring and silting is continuously altered, inevitably causing shoreline shifts in Chongming Island [9,10,11]. The methods developed in previous studies conducted in Chongming Island to analyze the characteristics of scouring and silting were topographic data analysis, analysis of sedimentary records from surface sediment, and numerical, empirical, and conceptual simulations analysis [12,13,14,15]. Due to the limitations of those conventional methods, previous research focused mainly on either the entire Yangtze River delta or eastern Chongming Island [8,16]. Nevertheless, the spatial variation of its shoreline dynamics remains uncertain from literature reports, including potential mechanisms of spatial variation in shoreline shifts in Chongming Island.
Tidal-dominated estuarine deposits and erosion promote the natural expansion of islands, and islands that extend parallel to tidal currents are often affected by both river and marine systems [17]. Chongming Island divides the Yangtze River into northern and southern branches between the Yangtze River estuary and the East China Sea. The impacts of the Coriolis force and hydrology management (e.g., the Yangtze River estuary deep water channel project) create differences in hydrological and topographic conditions between the northern and southern branches [18,19], and the difference in topographic conditions cause various sea tidal effects (e.g., the northern branch is more affected by tides than the southern branch) [20], resulting in different responses to upstream sediment. Previous studies emphasized the dominant factors of erosion and deposits in the riverbeds of both branches, but few studies focused on the impact of differences in upstream sediment on the spatial variation of shoreline dynamics in Chongming Island [21]. To fully understand this dynamic and its fundamental causes, it is important to study the spatial variations of shoreline dynamics in Chongming Island and to distinguish the dominant driving factors for land protection and management.
Remote sensing (RS), especially using satellite platforms, has been widely used in shoreline data extraction and monitoring [22]. This approach offers advantages due to the diversity and flexibility of spatial, temporal, spectral, and radiation resolutions [23]. Satellite RS not only has the capacity to help in understanding past and present shoreline conditions and long-term shoreline dynamics (i.e., with the advantages of high temporal resolution and long-term datasets), but also can be used for sustainable development and effective planning of shoreline management, with the advantage of continuous and stable supplies of future data [22]. Several methods have been proposed in the literature for shoreline data extraction and environmental change detection using satellite imagery. Threshold segmentation is the most popular method, which functions by calculating water-related spectral indices (such as NDWI) from either multiple- or single-band reflectance [24,25]. Alternative methods include single-band density slicing, linear transformation, principal component analysis, and various land-cover classification algorithms (e.g., decision tree classification, support vector machine classification, and artificial neural network classification) [22,26]. However, these methods are limited by temporal and spatial consistency, as well as by image quality [27]. Moreover, tidal-dominated estuarine deposits and erosion promote the natural expansion of Chongming Island, which contributes to the rapid changes and complex conditions of the shoreline and to the challenges of shoreline extraction. Therefore, it is important to select a method to extract shoreline with high temporal consistency, less sensitivity to environmental variability, and automatic process capacity. The local indicator of spatial autocorrelation (LISA) method captures spatial clusters based on the spatial correlation between a variable and its surrounding variables. The LISA method has great potential in eliminating illogical results, due to its emphasis on the autocorrelation between each pixel and its neighbors [28]. It has been shown to be an effective method, with high accuracy for distinguishing between land and water bodies for ecological research [29,30,31].
Pursuant to these earlier findings, the aims of this study were to analyze the shoreline dynamics in Chongming Island from 1984 to 2020 and to explore the corresponding driving factors. Our specific objectives were: (1) to extract the shoreline base on Landsat imagery by the LISA method and analyze the shoreline dynamics in Chongming Island, (2) to distinguish the response mechanisms of the eastern and northern shorelines to upstream sediment, and (3) to explore the dominant factors driving the spatial variations of shoreline shifts in Chongming Island.

2. Materials and Methods
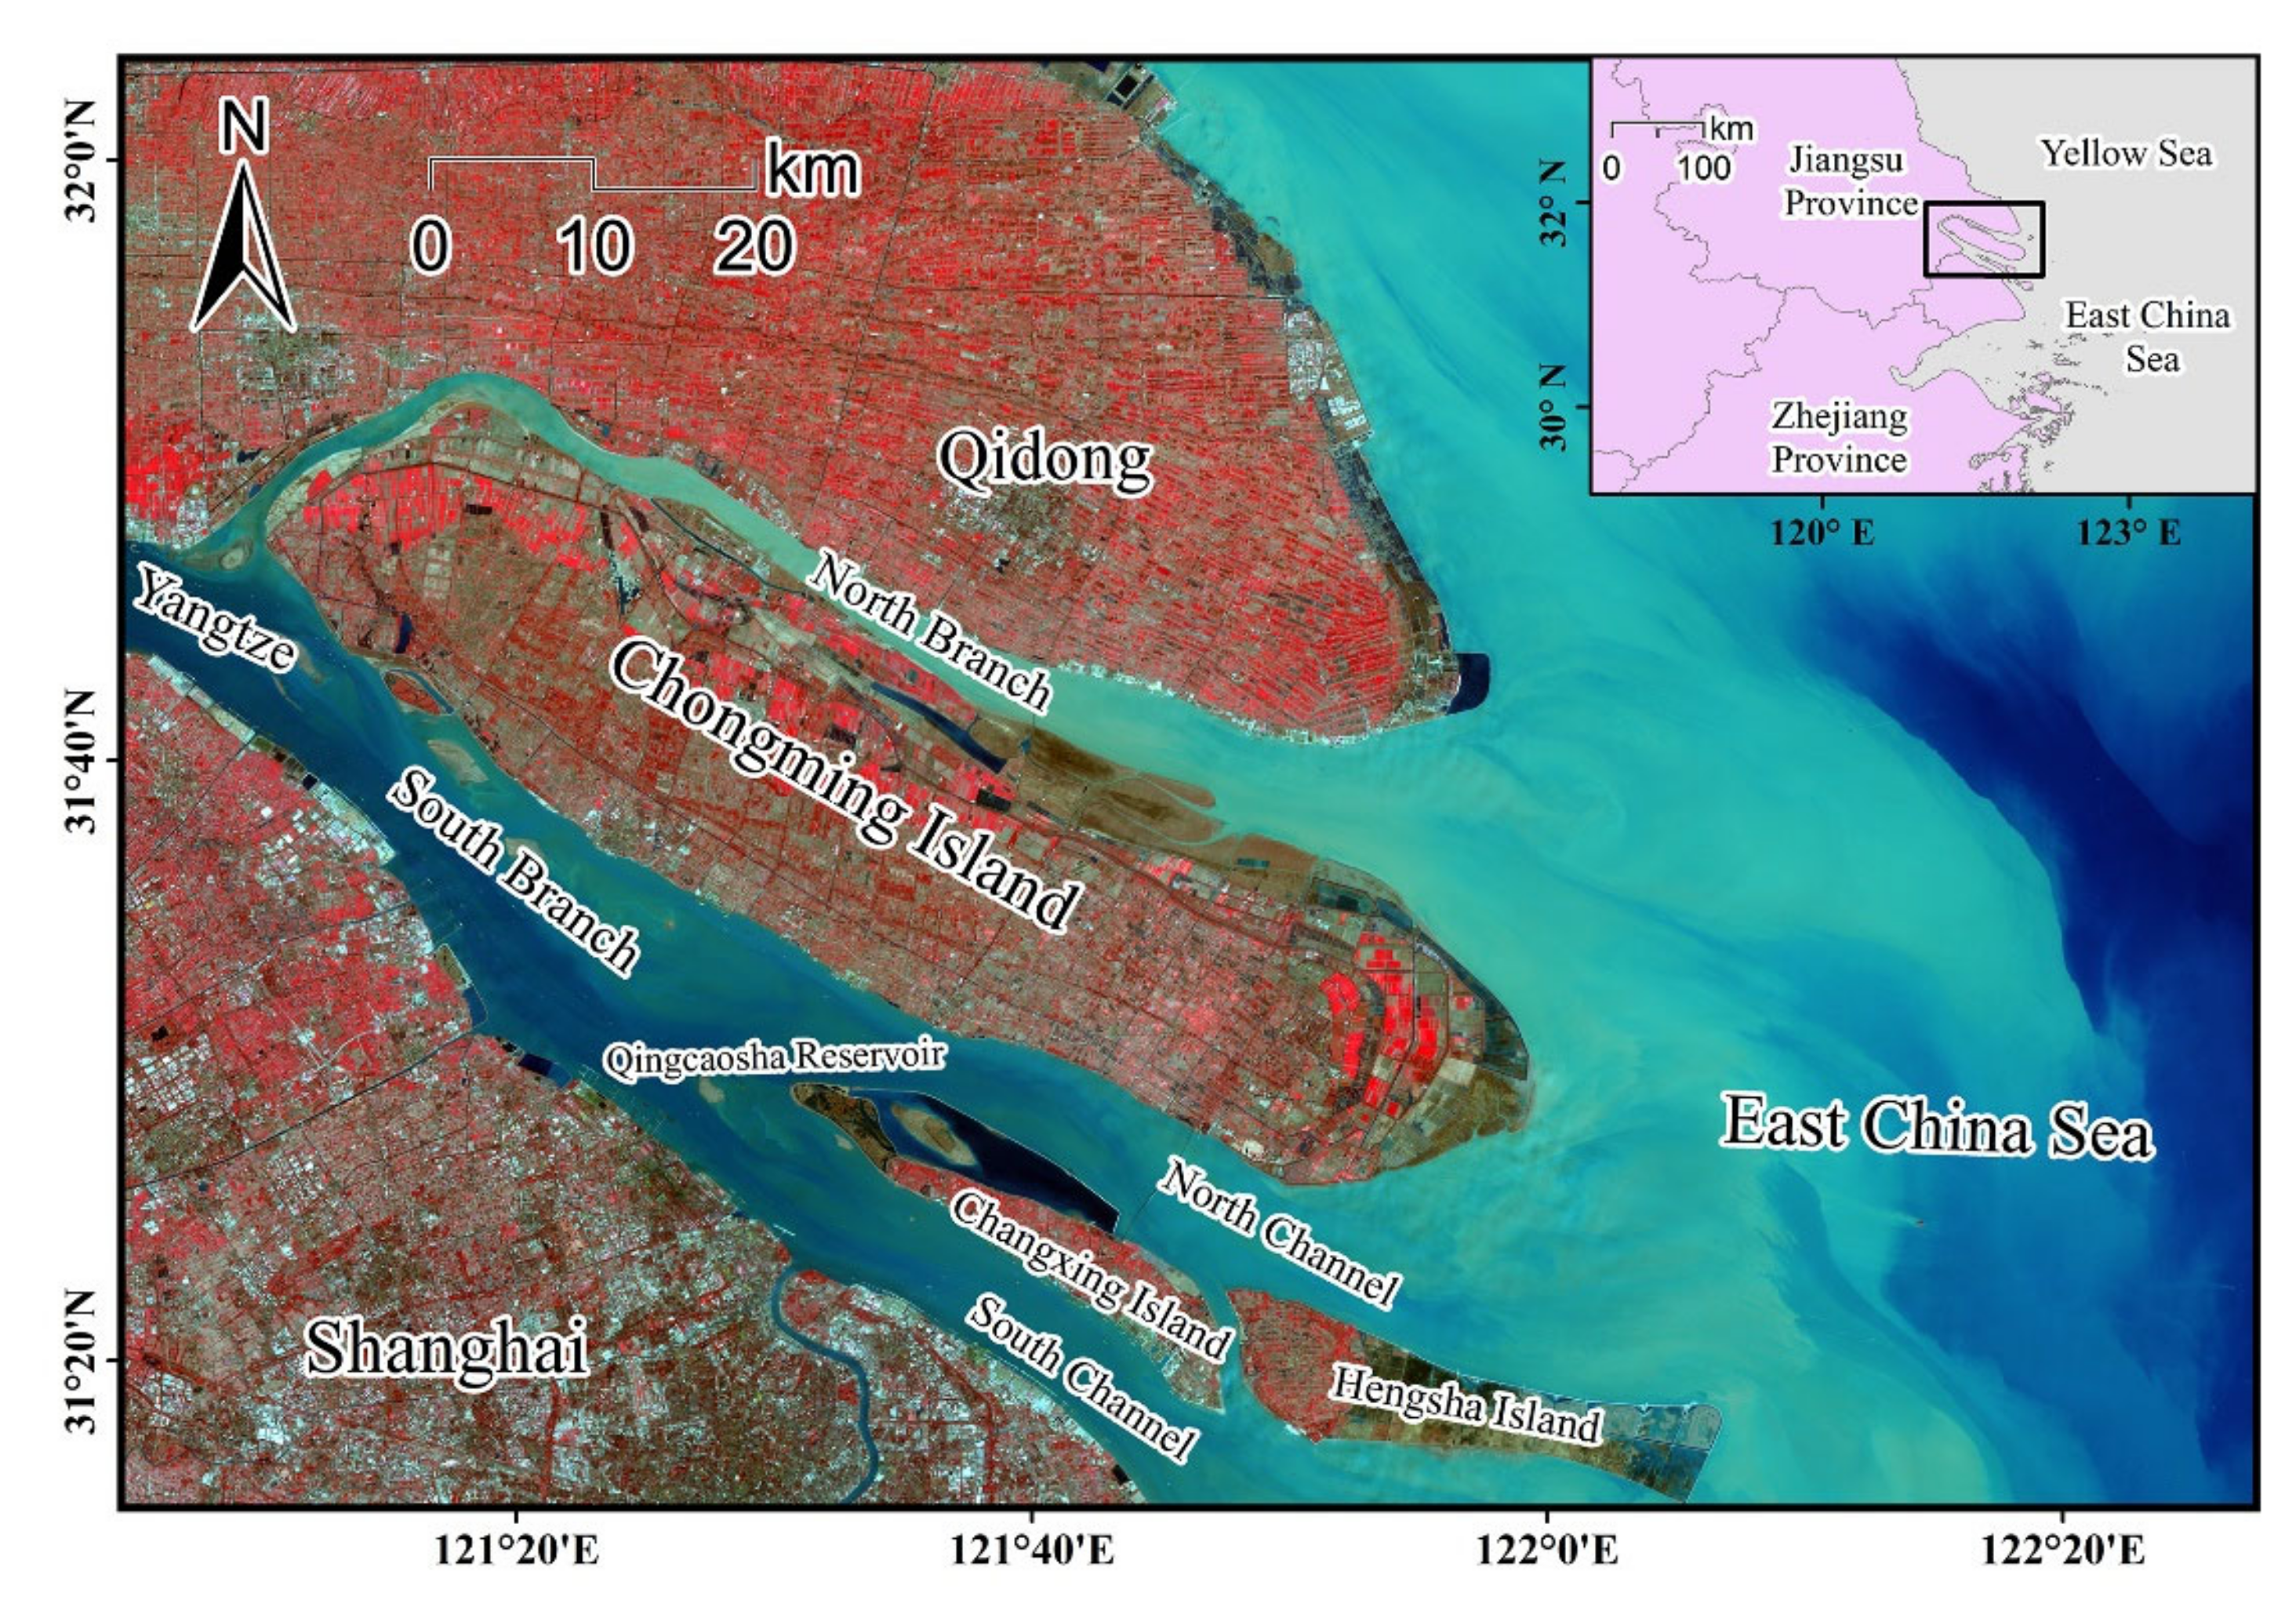
2.1. Study Area

Chongming Island, a part of Shanghai (the largest megacity in China), is located at the mouth of the Yangtze River and the East China Sea (Figure 1). It is the largest estuarine alluvial island in the world, as a result of a large amount of sediments from the Yangtze River. Chongming Island consists of a predominantly flat terrain with the elevation of the northwestern and central parts slightly higher than that of the southwestern and eastern parts [32]. Its climate is typical of the subtropical monsoon region, with an average annual temperature of approximate 15.3 °C and an annual accumulated precipitation of approximately 1022 mm [33]. Due to continuous sediment deposits from the Yangtze River to the East China Sea, Chongming Island has been expanding continuously over time [34].

2.2. Data Collection

Sixty-two Landsat Thematic Mapper (TM) images obtained from 1984 to 2011 and 18 Operational Land Imager (OLI) images obtained from 2013 to 2020 were downloaded from the United States Geological Survey (USGS) website (https://earthexplorer.usgs.gov/; accessed on 27 October 2020). The spatial resolution of all images was 30 × 30 m, and the projection was via Universal Transverse Mercator (UTM) Zone 51N, World Geodetic System 1984 (WGS 1984). All images were previously corrected, geometrically and atmospherically (i.e., Landsat Collection 2 level 2), when downloaded from the website. Only cloud-free images were included for studying shoreline extraction in the area. (See Table A1 in Appendix A for detailed information about the processed Landsat images, including the acquisition dates and the sensors.)
The data for annual water runoff, sediment load, and suspended sediment concentration of the Yangtze River, measured at the Datong Hydrological Station from 1984 to 2020, were collected from the Yangtze Water Resources Commission. The Datong Hydrological Station, located in Chizhou City (642 km from the estuary of the Yangtze River and the East China Sea), controls 94% of the downstream regions in the Yangtze River Basin. It is the closest hydrological station to the estuary and houses long-term observation data [11].
GIS (geographic information system) layers of artificial cofferdam were also obtained from 1984 to 2020 to provide a better understanding of the shoreline extraction and dynamics that were considered in this study.

2.3. Analytical Methods

Because a shore project to protect Chongming Island from erosion was conducted at the southern shore of Chongming island in the 1950s, the southern shoreline has remained virtually unchanged for over 60 years. Therefore, we divided the extracted Chongming Island shoreline into two parts (Figure 2): an eastern part (east of Xijia Port and the Beibayao River) and a northern part (north of the Beibayao and Beihenyin Rivers).

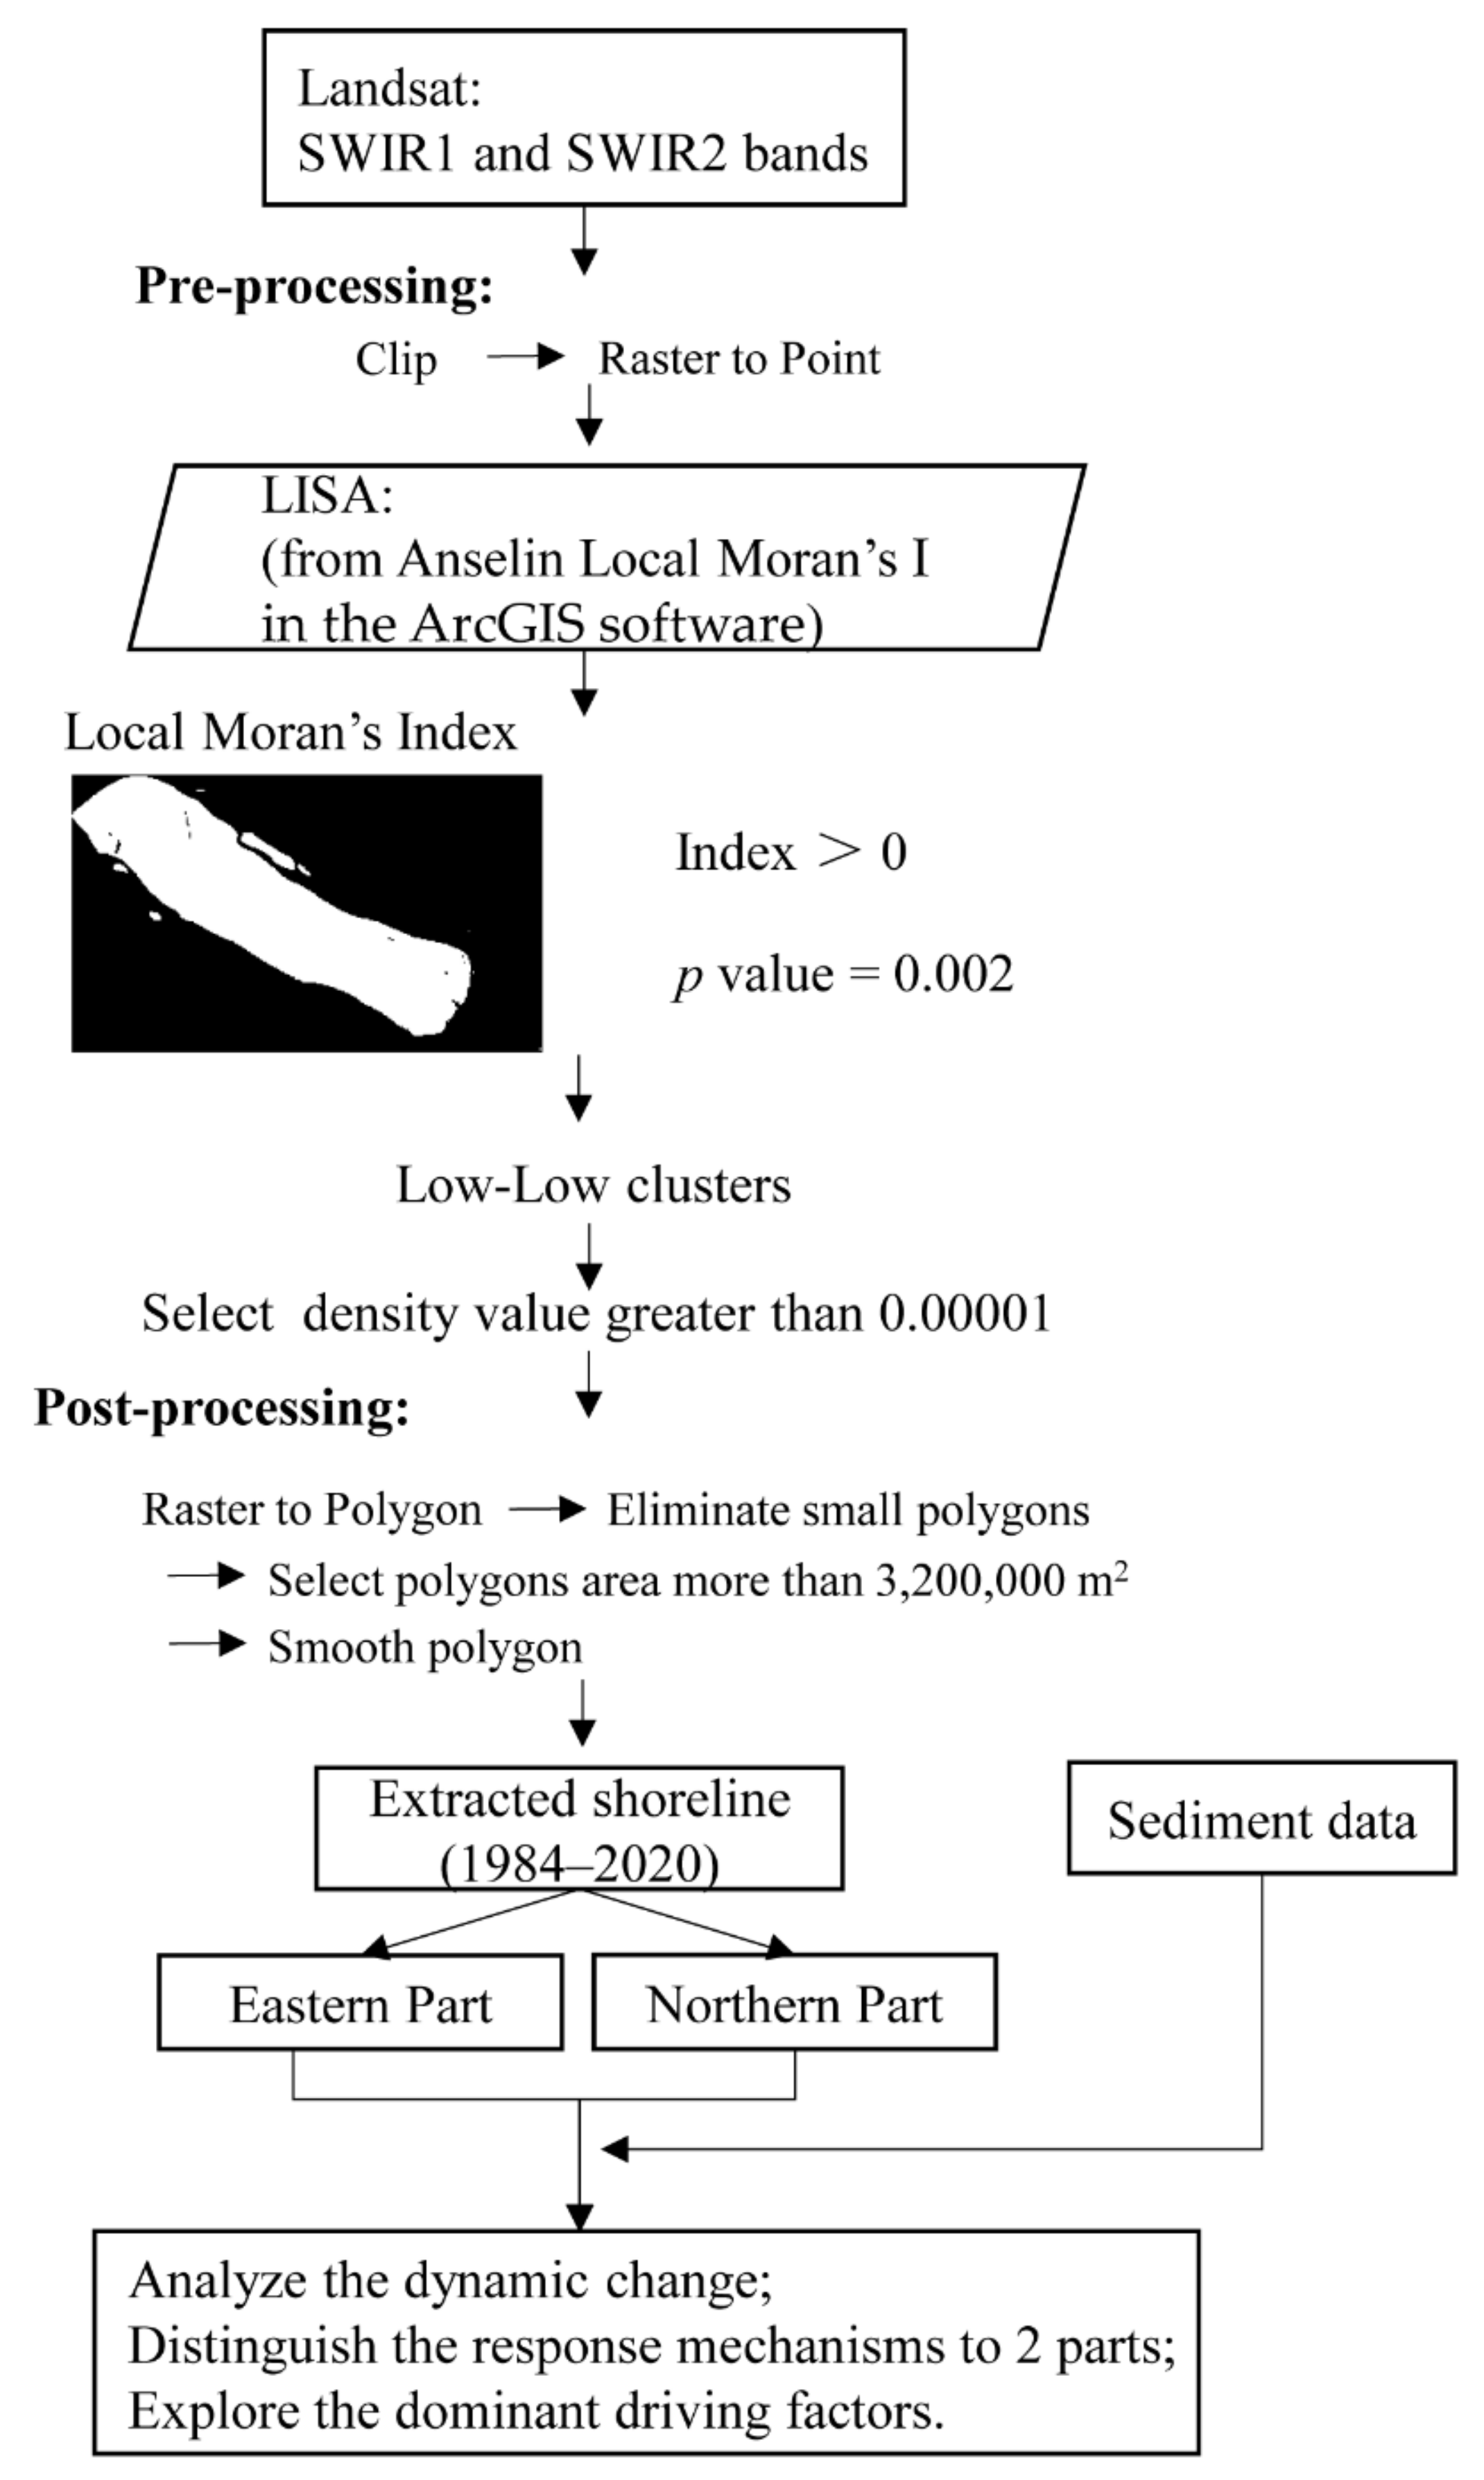
2.3.1. Automatic Shoreline Extraction from Remote Sensing Images

Automatic shoreline extraction is based on the concept of the LISA method, which captures spatial clustering based on the spatial correlation between variables and surrounding variables [28]. In Landsat imagery, the texture of water is smooth compared with that of land, establishing an autocorrelation between each pixel of water bodies and its neighbors. Moreover, the reflectance of water in the longer wavelength region is lower than that of land cover, so the low-value cluster in the imagery (i.e., cold spots from the results of the LISA process) is defined as open water. Extracted Chongming Island areas excluded the spatial extents of water bodies, whose boundaries were the extracted shorelines.
Processing steps, including clipping to the main study area and converting from raster to point format, were first applied to all the Landsat images. Then, the LISA method was used to extract cold spots (which are defined as spatial clusters with low values indicating water bodies) from the Landsat images. This was achieved by analyzing the pre-processed point format data using Anselin Local Moran’s I ArcGIS software. Low-low clusters (i.e., cold spots) were selected from the LISA analysis of the point format data converted from SWIR1 or SWIR2, with a p-value of 0.002 (which was statistically significant). The post-processing steps included calculating point densities, selecting the pixels with a density greater than 0.00001 (density refers to the number of midpoints per square meter), converting the selected pixels to polygons, removing the small polygons (with an area of less than 3,200,000 m2), and smoothing the remaining polygons. By excluding the open water areas (i.e., the cold spots), the regions of Chongming Island were extracted and the boundary of those regions became the extracted shoreline. Unlike the high heterogeneity of Chongming Island, open water was smooth in texture; therefore, open water was easily extracted using the LISA method [29]. The extraction results revealed the boundary between open water and Chongming Island; its shorelines (Figure 3). All steps in extracting the shoreline from a single band of Landsat images were compiled into a Python script (see the Supplementary Materials).
Generally, a p-value less than 0.05 indicates statistical significance. In this study, we selected a p-value that equaled 0.002 (i.e., the lowest p-value of Anselin Local Moran’s I when the number of random permutations were selected as 499 in ArcGIS software), to reduce the heterogeneity effects of the island’s beach areas. In the following steps, the point-density threshold was set to 0.00001 (which could be lowered if smaller water bodies needed to be extracted) to eliminate small water bodies within Chongming Island and reduce image-quality effects. The extracted small polygons of water bodies, with an area less than 3,200,000 m2, were also removed to exclude nearby islets.

2.3.2. Linear Model and Segmented Linear Regression for Extracted Long-Term Shoreline Data

To better understand shoreline dynamics in Chongming Island from 1984 to 2020, island area changes were analyzed using the segmented linear relationship from the segmented package in the R software (https://www.r-project.org/). The segmented linear relationship is widely used in ecological research [29,35]. In this study, the segmented linear relationship was used to analyze the interannual dynamic changes in the extracted areas of Chongming Island and to evaluate the changes in the shoreline of Chongming Island. In addition, simple linear and non-linear regression were applied to evaluate the impact of upstream sediments on northern and eastern shoreline shifts with the linear model (lm()) in R software.

3. Results

3.1. Shoreline Extraction Results Based on the Method of LISA

The extracted shorelines from the SWIR1 and SWIR2 bands were similar and stable in the early stage of urbanization in Chongming Island (Figure 4a,b). However, the extraction results from the SWIR1 band were significantly better than those of the SWIR2 band in the later stages of urbanization, and the shoreline extraction from the SWIR2 band was influenced by the built-up areas (Figure 4c,d; see all the shoreline extraction results in Supplementary Materials S1).
The accuracy assessment was conducted based on the reference of Sentinal-2 A/B images obtained on 24 May 2018, 23 February 2020, and 16 August 2020, paired with shoreline extraction from Landsat OLI image obtained on 23 May 2018, 22 February 2020, and 16 August 2020, respectively. One hundred points were selected randomly within each image, for accuracy assessment. The overall accuracy was 98%, and the Kappa coefficient was 95.7%. (See Supplementary Materials S2 for more detailed information about the accuracy assessment, including the error matrix, random points, and the paired Landsat OLI and Sentinel-2 A/B images.)

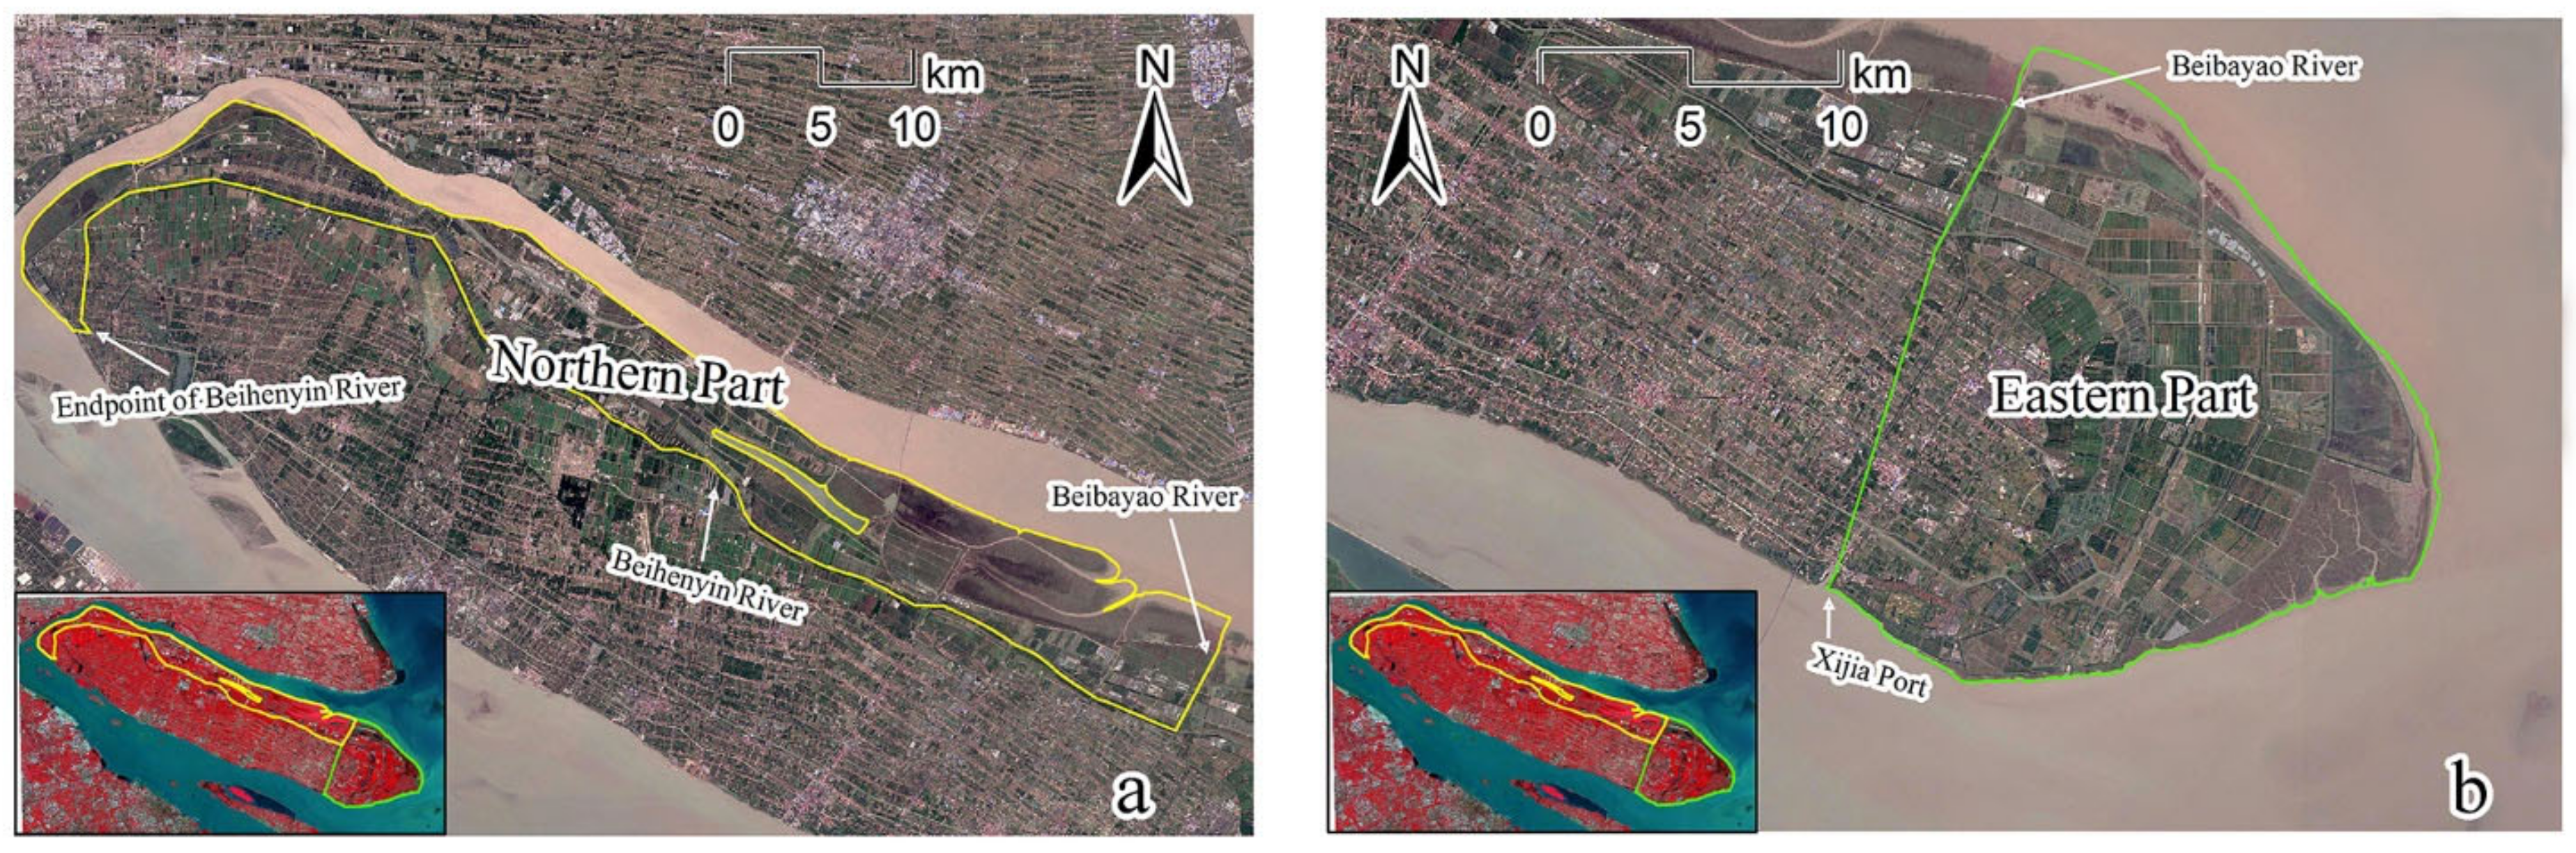
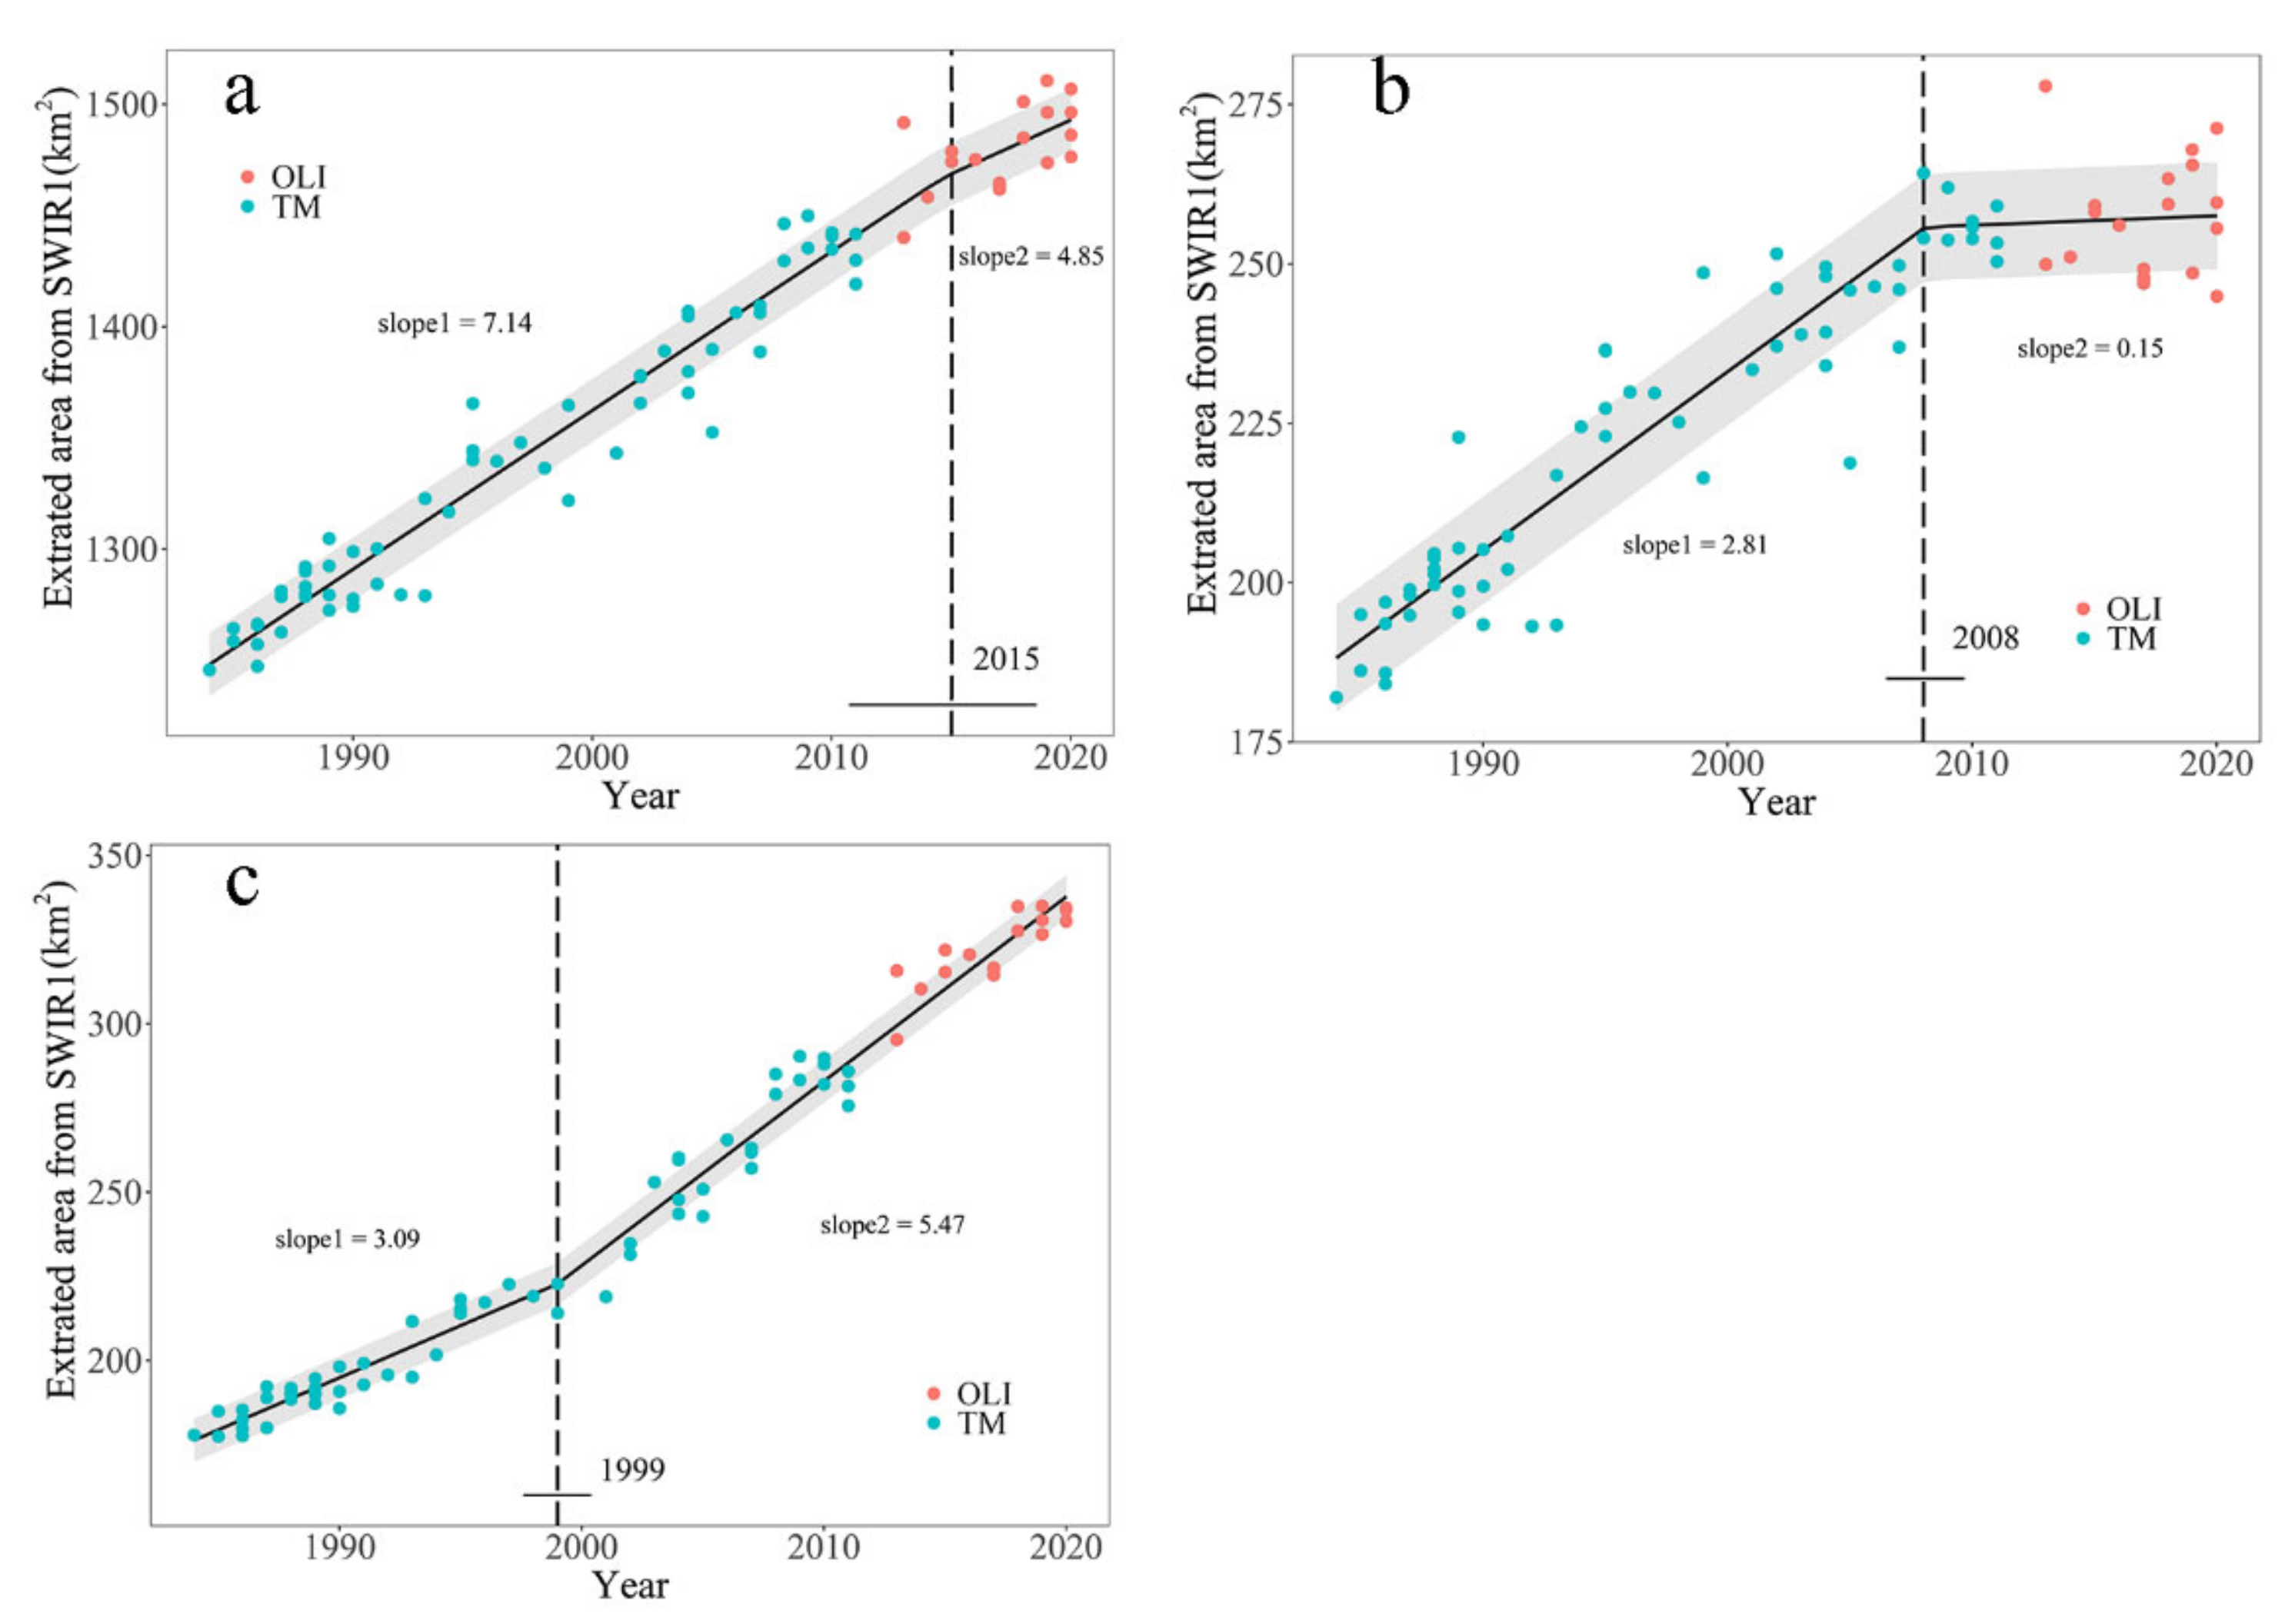
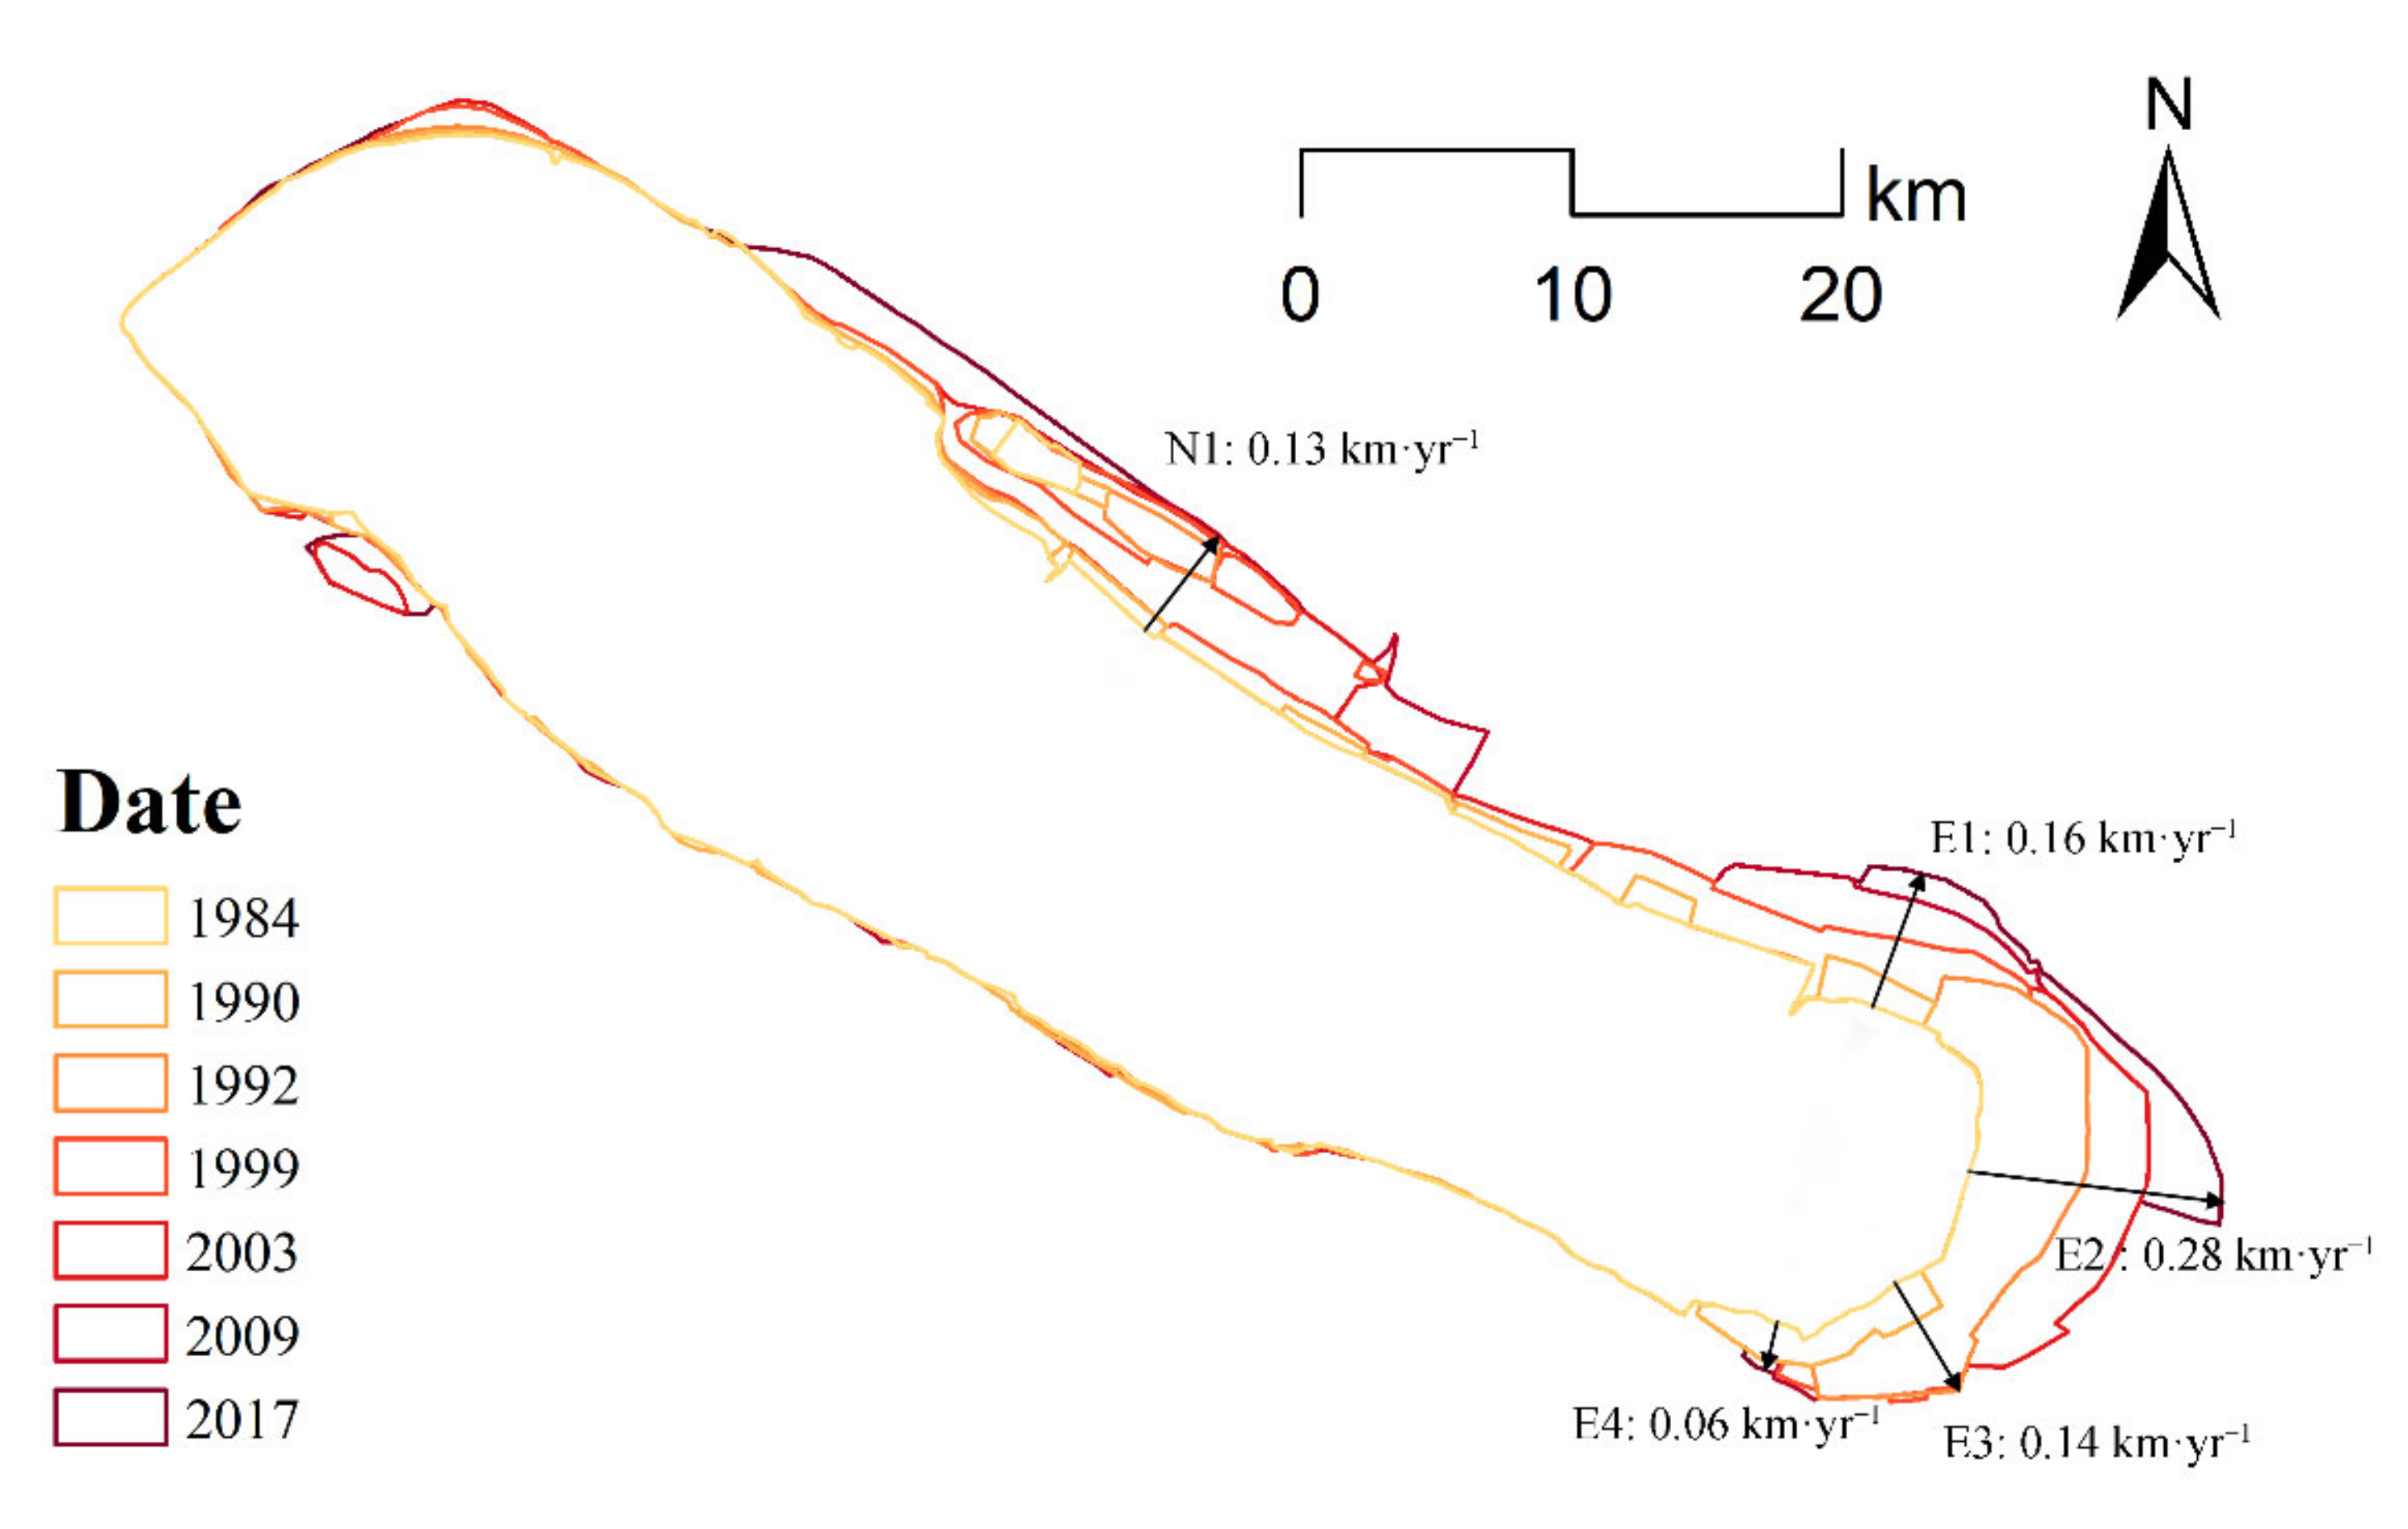
3.2. Overall Changes of Chongming Island and the Dyanamics of Its Eastern and Northern Shorelines

Compared to the shoreline in 1984, subsequent shorelines from 1985 to 2020 gradually advanced toward the east and north. As a result of the expansion of the eastern and northern shorelines, approximately 261.1 km2 of new land was formed in the study area between 1984 and 2020, for a net progradation rate of 7.2 km2 per year. The results for the segmented linear relationship of the island area from 1984 to 2020 show that the area of Chongming Island increased steadily as the shoreline continued to expand outward. However, the expansion rate of the shoreline slowed after 2015 (Figure 5a).
By dividing the shoreline into eastern and northern parts (Figure 2), we could better describe the shoreline dynamics. From 1984 to 2020, the net progradation rate of the northern part of Chongming Island was 4.3 km2 per year (i.e., the area of new formed land in the northern part was 155.8 km2), while the eastern part of Chongming Island formed 89.2 km2 of new land (i.e., a net progradation rate of 2.5 km2 per year); the accumulation rate in the northern part was higher than that of the eastern part of Chongming Island. The results for the segmented linear relationship showed that the eastern shoreline shifted outward during the whole study period, and that the expansion rate slowed and almost stopped after 2008 (Figure 5b). On the other hand, the area of northern Chongming Island increased rapidly after 1999 (Figure 5c). This suggests that the eastern and northern shoreline expansion mechanisms of Chongming Island may be different.

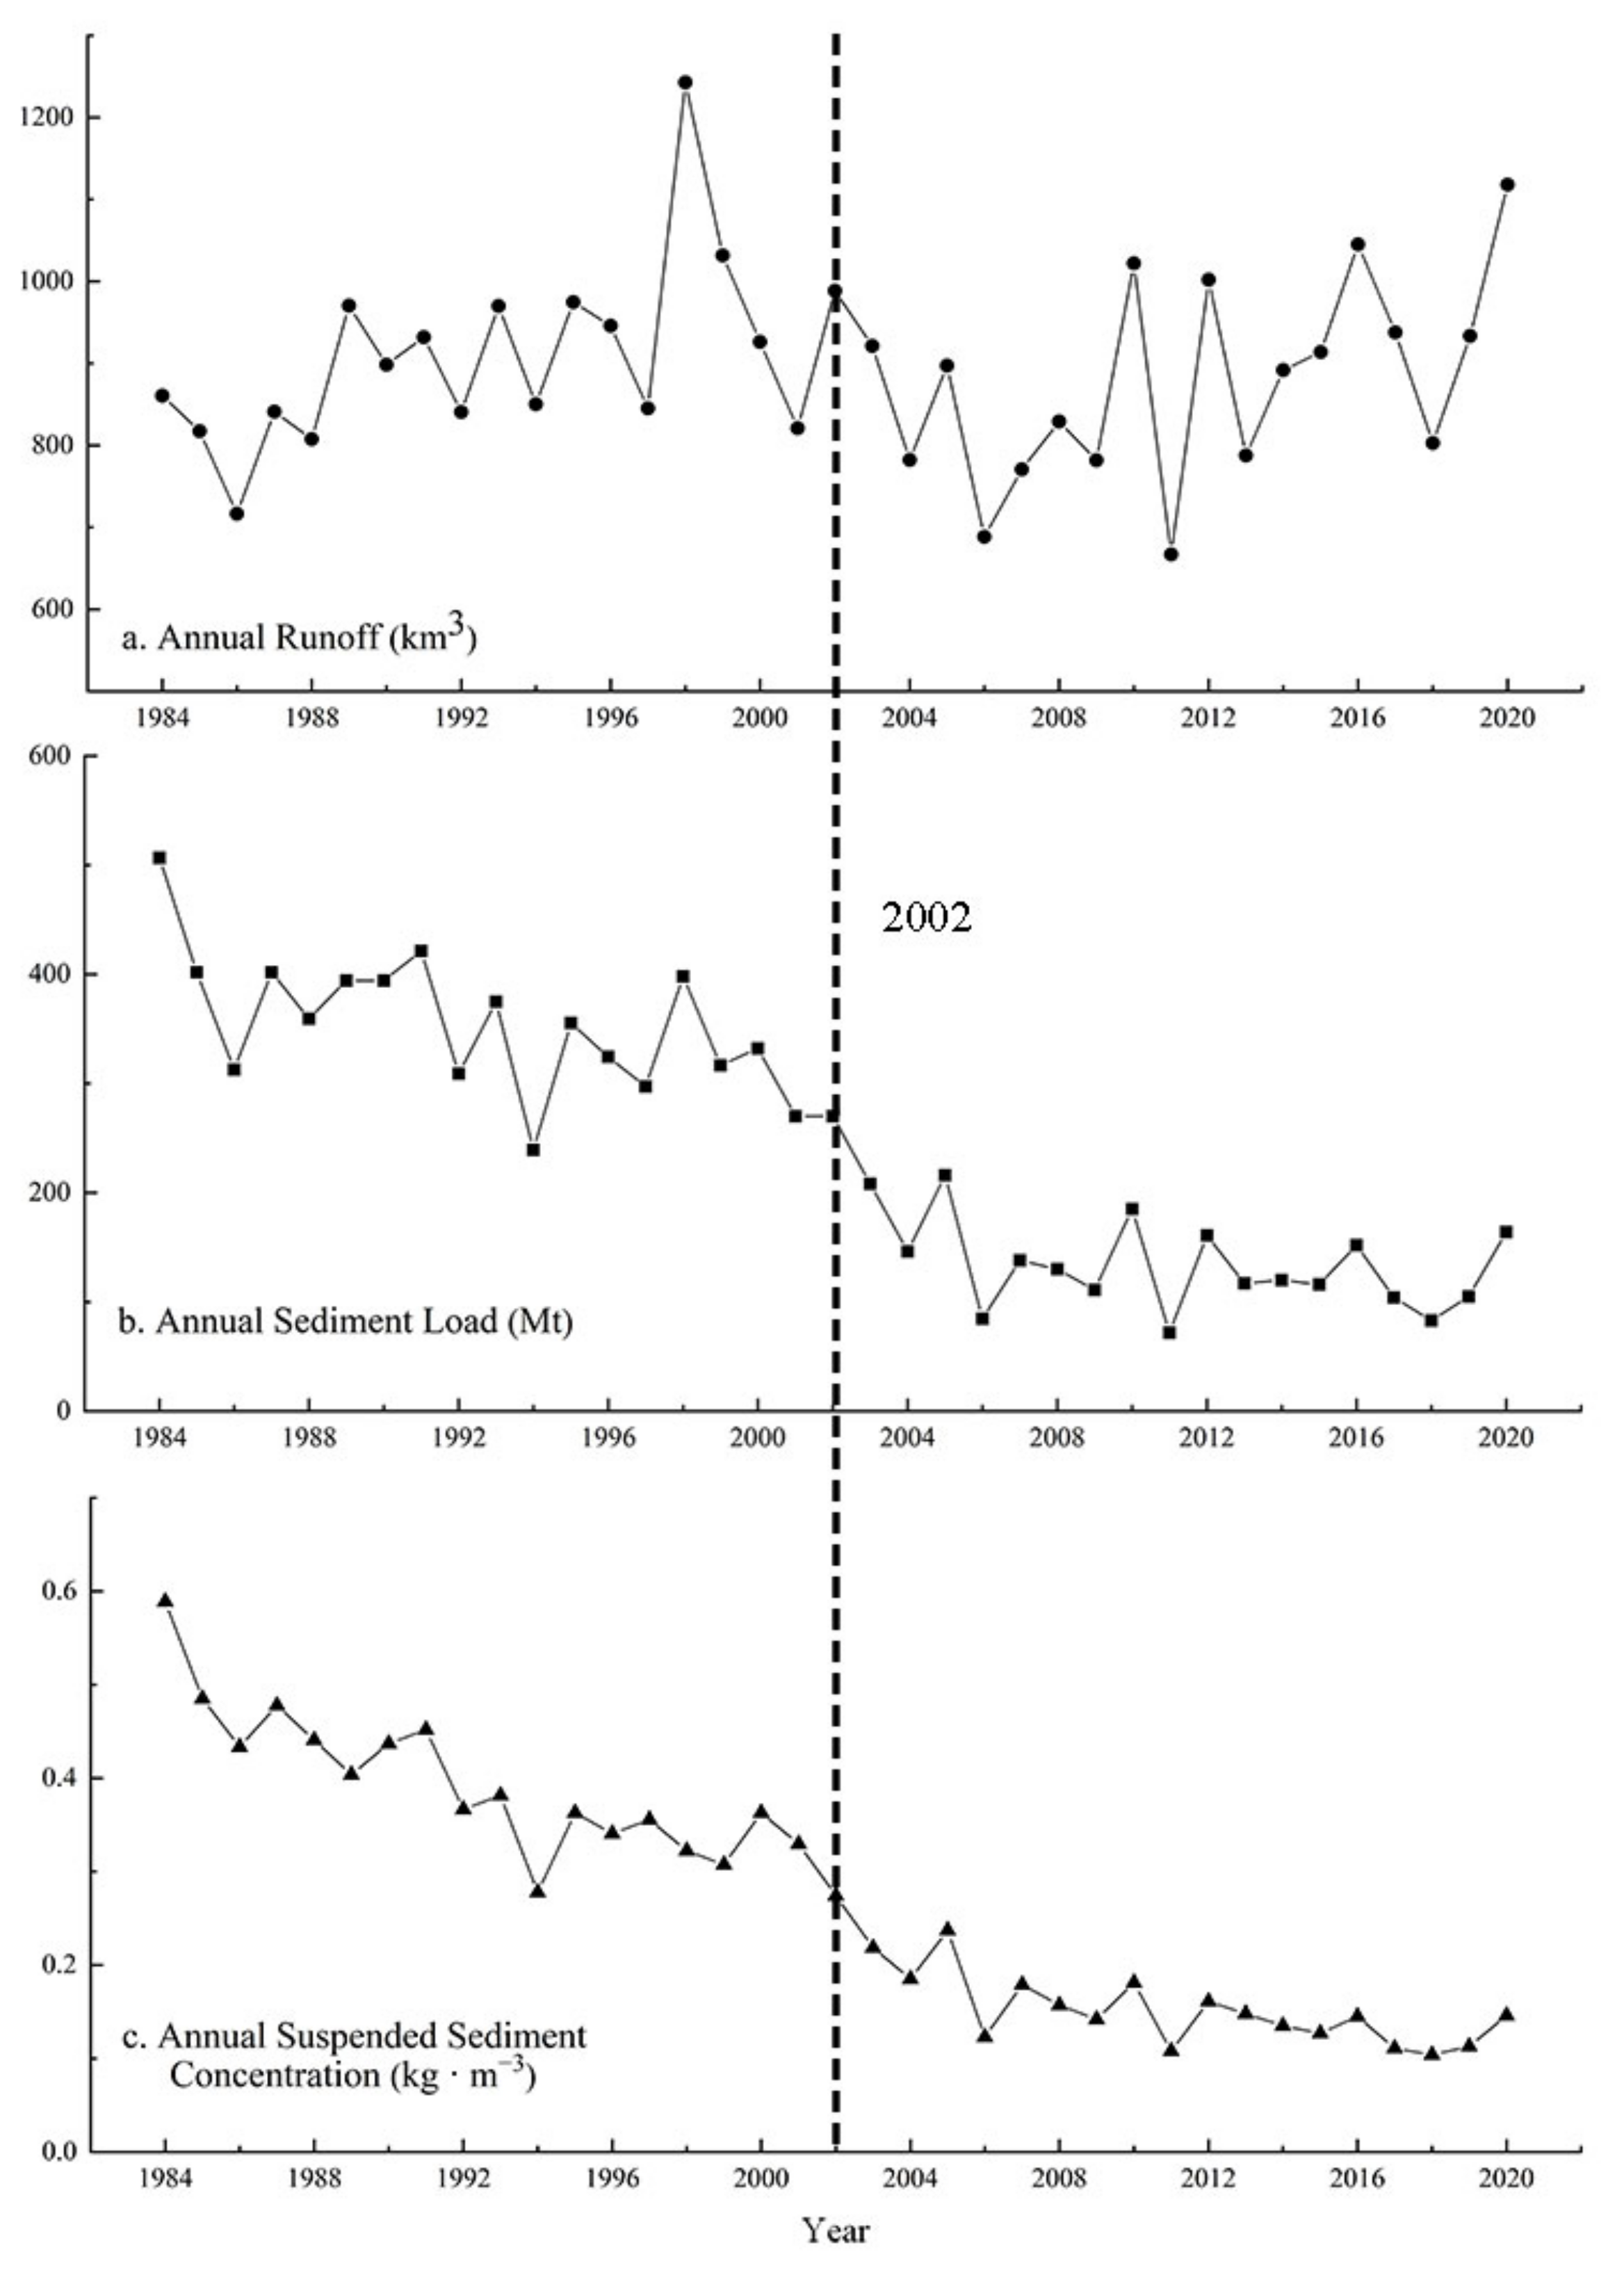
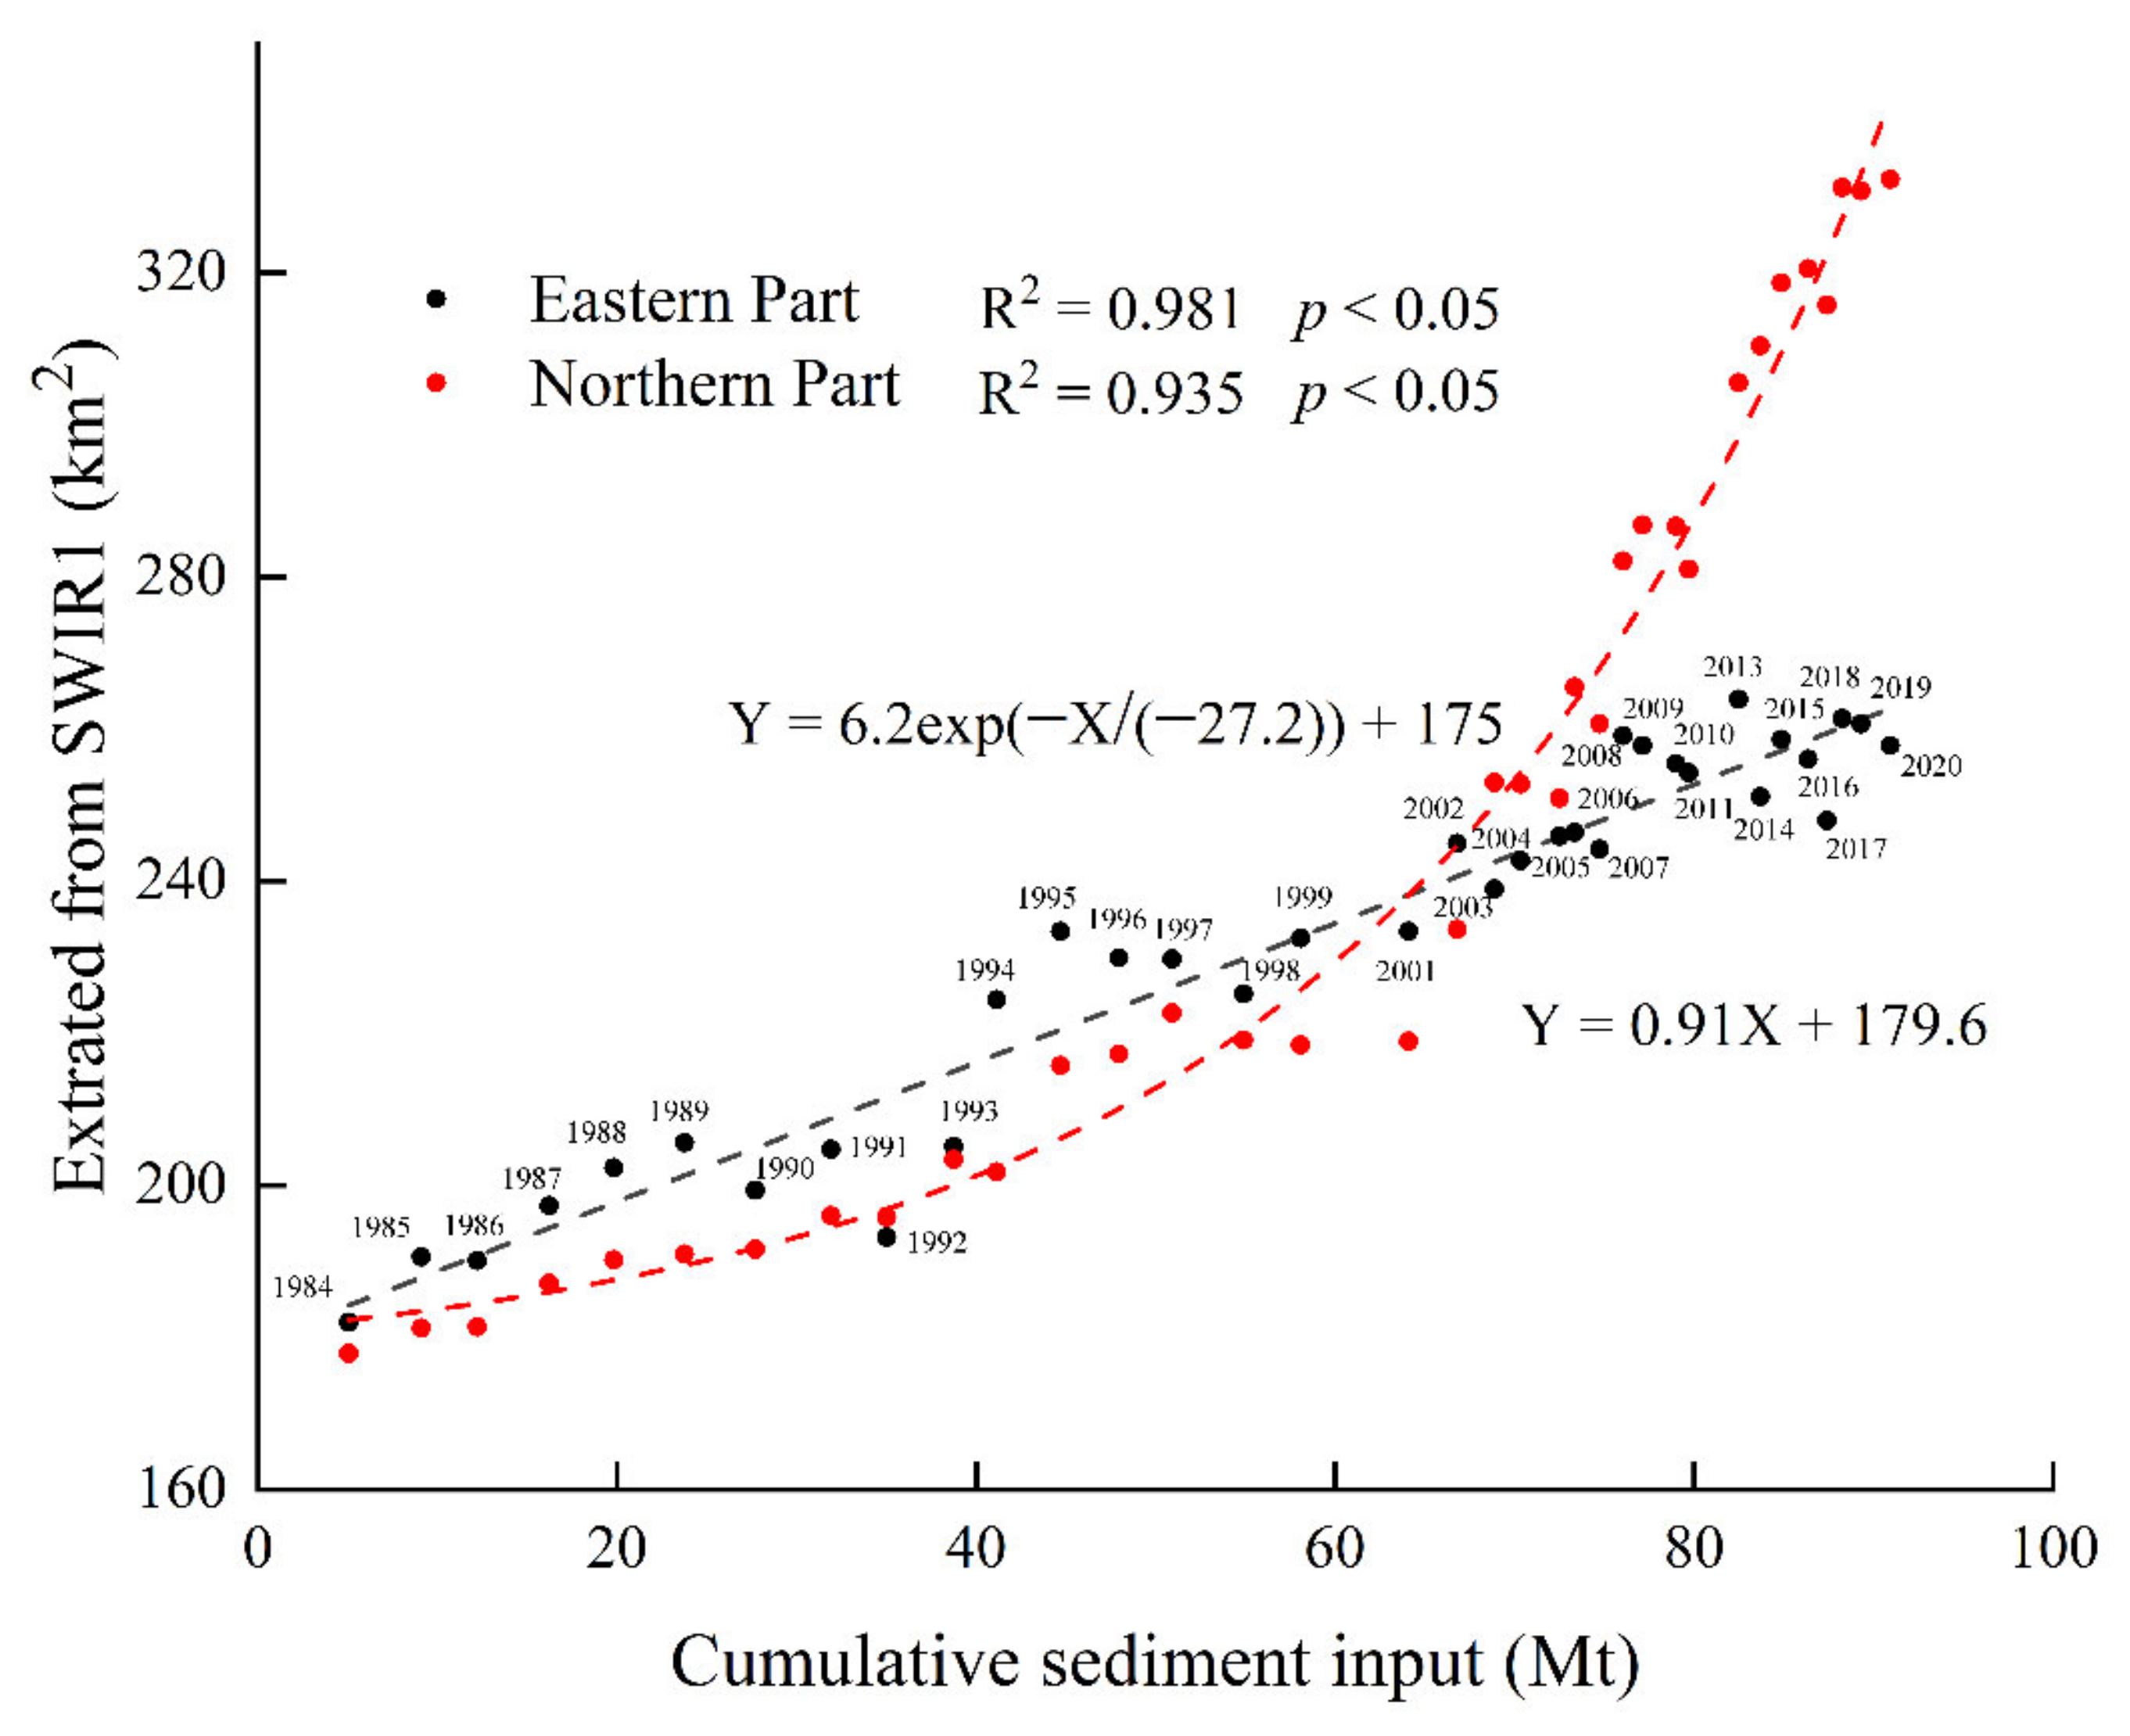
3.3. Responses of Eastern and Northern Chongming Island to Sediment Inflow from Upstream

According to hydrological data from Datong Station, the annual runoff of the Yangtze River did not vary much during the study period (Figure 6a). The average annual runoff decreased from 909.5 km3 (1984–2002) to 883.2 km3 (2002–2020). Unlike the temporal trend of the annual runoff, the annual sediment load and the annual suspended sediment concentration decreased significantly (Figure 6b,c). The average annual sediment load decreased from 3.51 million tons (1984–2002, before the construction of the three gorges project, the largest water conservation project in the Yangtze River basin, Figure 6b) to 1.34 million tons (2002–2020, after the construction of the three gorges project, as shown in Figure 6b), while the average annual suspended sediment concentration decreased from 0.39 kg·m−3 (1984–2002, Figure 6c) to 0.15 kg·m−3 (2002–2020, Figure 6c).
An exponential relationship was found between sediment accumulation and island area in the northern shoreline (R2 = 0.981, Figure 7), while a linear relationship was found for the eastern part (R2 = 0.935, Figure 7). This suggests that the eastern and northern shorelines of Chongming Island respond to sediment input differently. Moreover, the distribution of upstream sediments into the northern and eastern shorelines was different over the study period from 1984 to 2020 (Figure 7). Sediment accumulation was greater in the eastern shoreline before 2001, while the sediment inputs from upstream accumulated increasingly in the northern shoreline after 2001. Since 2001, the accumulated sediment inputs were 64.1 Mt, but the gap between the contribution of sediments in the northern and eastern shorelines increased (Figure 7).

4. Discussion

4.1. Shoreline Extraction from SWIR1 and SWIR2 Bands via the Method of LISA

In this study, the SWIR1 band was superior to the SWIR2 band for shoreline extraction (Figure 4c,d), because the rapid speed of urbanization cast shadows near built-up regions, affecting shoreline extraction from the SWIR2 bands [35]. Before the cofferdam construction on eastern Chongming Island, the tidal flats were extracted as a land feature due to their heterogeneous character, which was significantly different from the character of water bodies (Figure 4a,b). However, the reflectance of tidal flats was also affected by particle size, water content, local slope, sea water turbidity, and the presence of small tidal channels [36], and shoreline extractions from the SWIR1 and SWIR2 bands were influenced by the residual surface water on the tidal flats [36]. This might reduce the accuracy of the shoreline extractions, especially on the eastern part of Chongming Island (Figure 4d).
The accuracy of land-water interface delineation might also have been affected by hydrological conditions in Chongming Island. The spectral characteristics of clear water in the optical domain (350–2500 mm) showed that reflectance decreased as the wavelength increased [37]. However, the hydrological conditions of open water bodies are relatively complex. Turbidity, suspended matter, vegetation, algae, or organic matter floating on the surface or suspended have a significant impact on the spectral characteristics of water bodies [38]. The shoreline extractions from the SWIR1 and SWIR2 bands were not affected by those hydrological conditions, based on the results of this study (Supplementary Materials S1), because the strong absorption characteristics of water (including turbid water) in the SWIR bands mitigated the effects of those hydrological conditions [29].
Islands formed by estuarine sediments are vulnerable to tidal and storm erosion [39]. When a large amount of monsoon runoff and rainfall occurs in the Yangtze River estuary, the natural wetlands (tidal flats), especially on the eastern parts of Chongming Island, decline significantly [40]. The active estuarine dynamics in the Yangtze River estuary mean that islands often form and then collapse due to the continuous erosion. Therefore, the southern estuary has seen the intermittent occurrence of small sand islands (Figure 4a,b).
Although the satellite images analyzed in this study were obtained from the same series of satellites, the sensors were different (i.e., TM or OLI), and their spectral characteristics were not completely consistent. This may have caused some uncertainty in our interpretation of shoreline dynamics. However, the advantage of our research to manage this uncertainty was the qualitative analysis, which reduced some of the effects of temporal inconsistency in the Landsat satellite series.
In addition, there are some error sources in the LISA method that can reduce the accuracy of shoreline extraction from Landsat images. These errors occur due to spatial resolution, the image quality of satellite images, and the parameters or steps of the methods used in this study (i.e., including spatial autocorrelation distance, smoothing polygons, and eliminating small polygons) [35]. Noise in the Landsat imagery (i.e., salt and pepper effects mainly in early-acquired TM images) affected the homogeneous characteristics of the water bodies in the images, which reduced the accuracy of shoreline extraction. Indeed, post-processing to smooth the polygons and eliminate the small polygons imposed errors on the shoreline extraction results [29]. Smoothing polygons may lead to a horizontal movement of about 30 m (Landsat image resolution) of the final extracted shoreline, while elimination of small polygons can result in the complete loss of some small sand islands. Nevertheless, these two steps had the advantage of reducing the influence of image quality on the classification results from previous remote-sensing classification methods [29,35].

4.2. Shoreline Dynamics and Factors Driving Chongming Island Area

Factors in three domains, including basin, marine, and human disturbance, are dominant in controlling island shoreline dynamics [41]. For example, long- or short-term shoreline dynamics can result from river hydrodynamic changes, river geomorphology changes, sea level rises, storm surges, wind tides, other natural processes, and human activities [1]. Large amounts of river sediment are the main sources of material for shoreline accretion in estuary delta regions [42]. The Yangtze River, which is the third longest in the world, with the fourth largest sediment content and the fifth greatest flow in the world, transports a large amount of sediment downstream every year [16], which continuously accumulates in the estuary and expands Chongming Island. However, the sediment transport in the Yangtze River has gradually decreased due to extensive human activities, including land restoration, land reclamation, and the construction of water conservancy facilities. More than 50,000 dams were built in the Yangtze River basin since 1950 [12], including the construction of the three gorges project, exacerbating this phenomenon of decreasing sediments. Although the annual sediment load and the annual suspended sediment concentration decreased significantly during the study period, the shoreline of Chongming Island continued to expand, but with a significantly lower expansion rate.
In addition to the contributions of upstream sediment, downstream human activities add sediments from nearshore and cross-shore currents, contributing to the outward shifts of shoreline in Chongming Island [43,44]. A large number of wharf and bridge construction projects, reclamation activities, and channel dredging were carried out in the middle and lower reaches of the Yangtze River in recent years. For example, the deep-water channel project (1997–2005) dredged the Yangtze River estuary to a depth of 6.5–12.5 m [45,46]. These projects led to the resuspension and transport of sediments downstream, which eventually contributed to the continuous expansion of Chongming Island [43]. Moreover, the results of the research carried out by Chen et al. showed that the submerged parts of the Yangtze River delta (the edges, tidal flats, or submerged small islands) were further eroded by tidal action, which was another source of the sediment inputs that caused the expansion of Chongming Island [45]. However, the segmented linear regression results showed that the expansion of Chongming Island slowed gradually after 2015. This phenomenon might be related to the spatial variation—the difference between the northern and eastern shorelines—of the shoreline dynamics in Chongming Island.

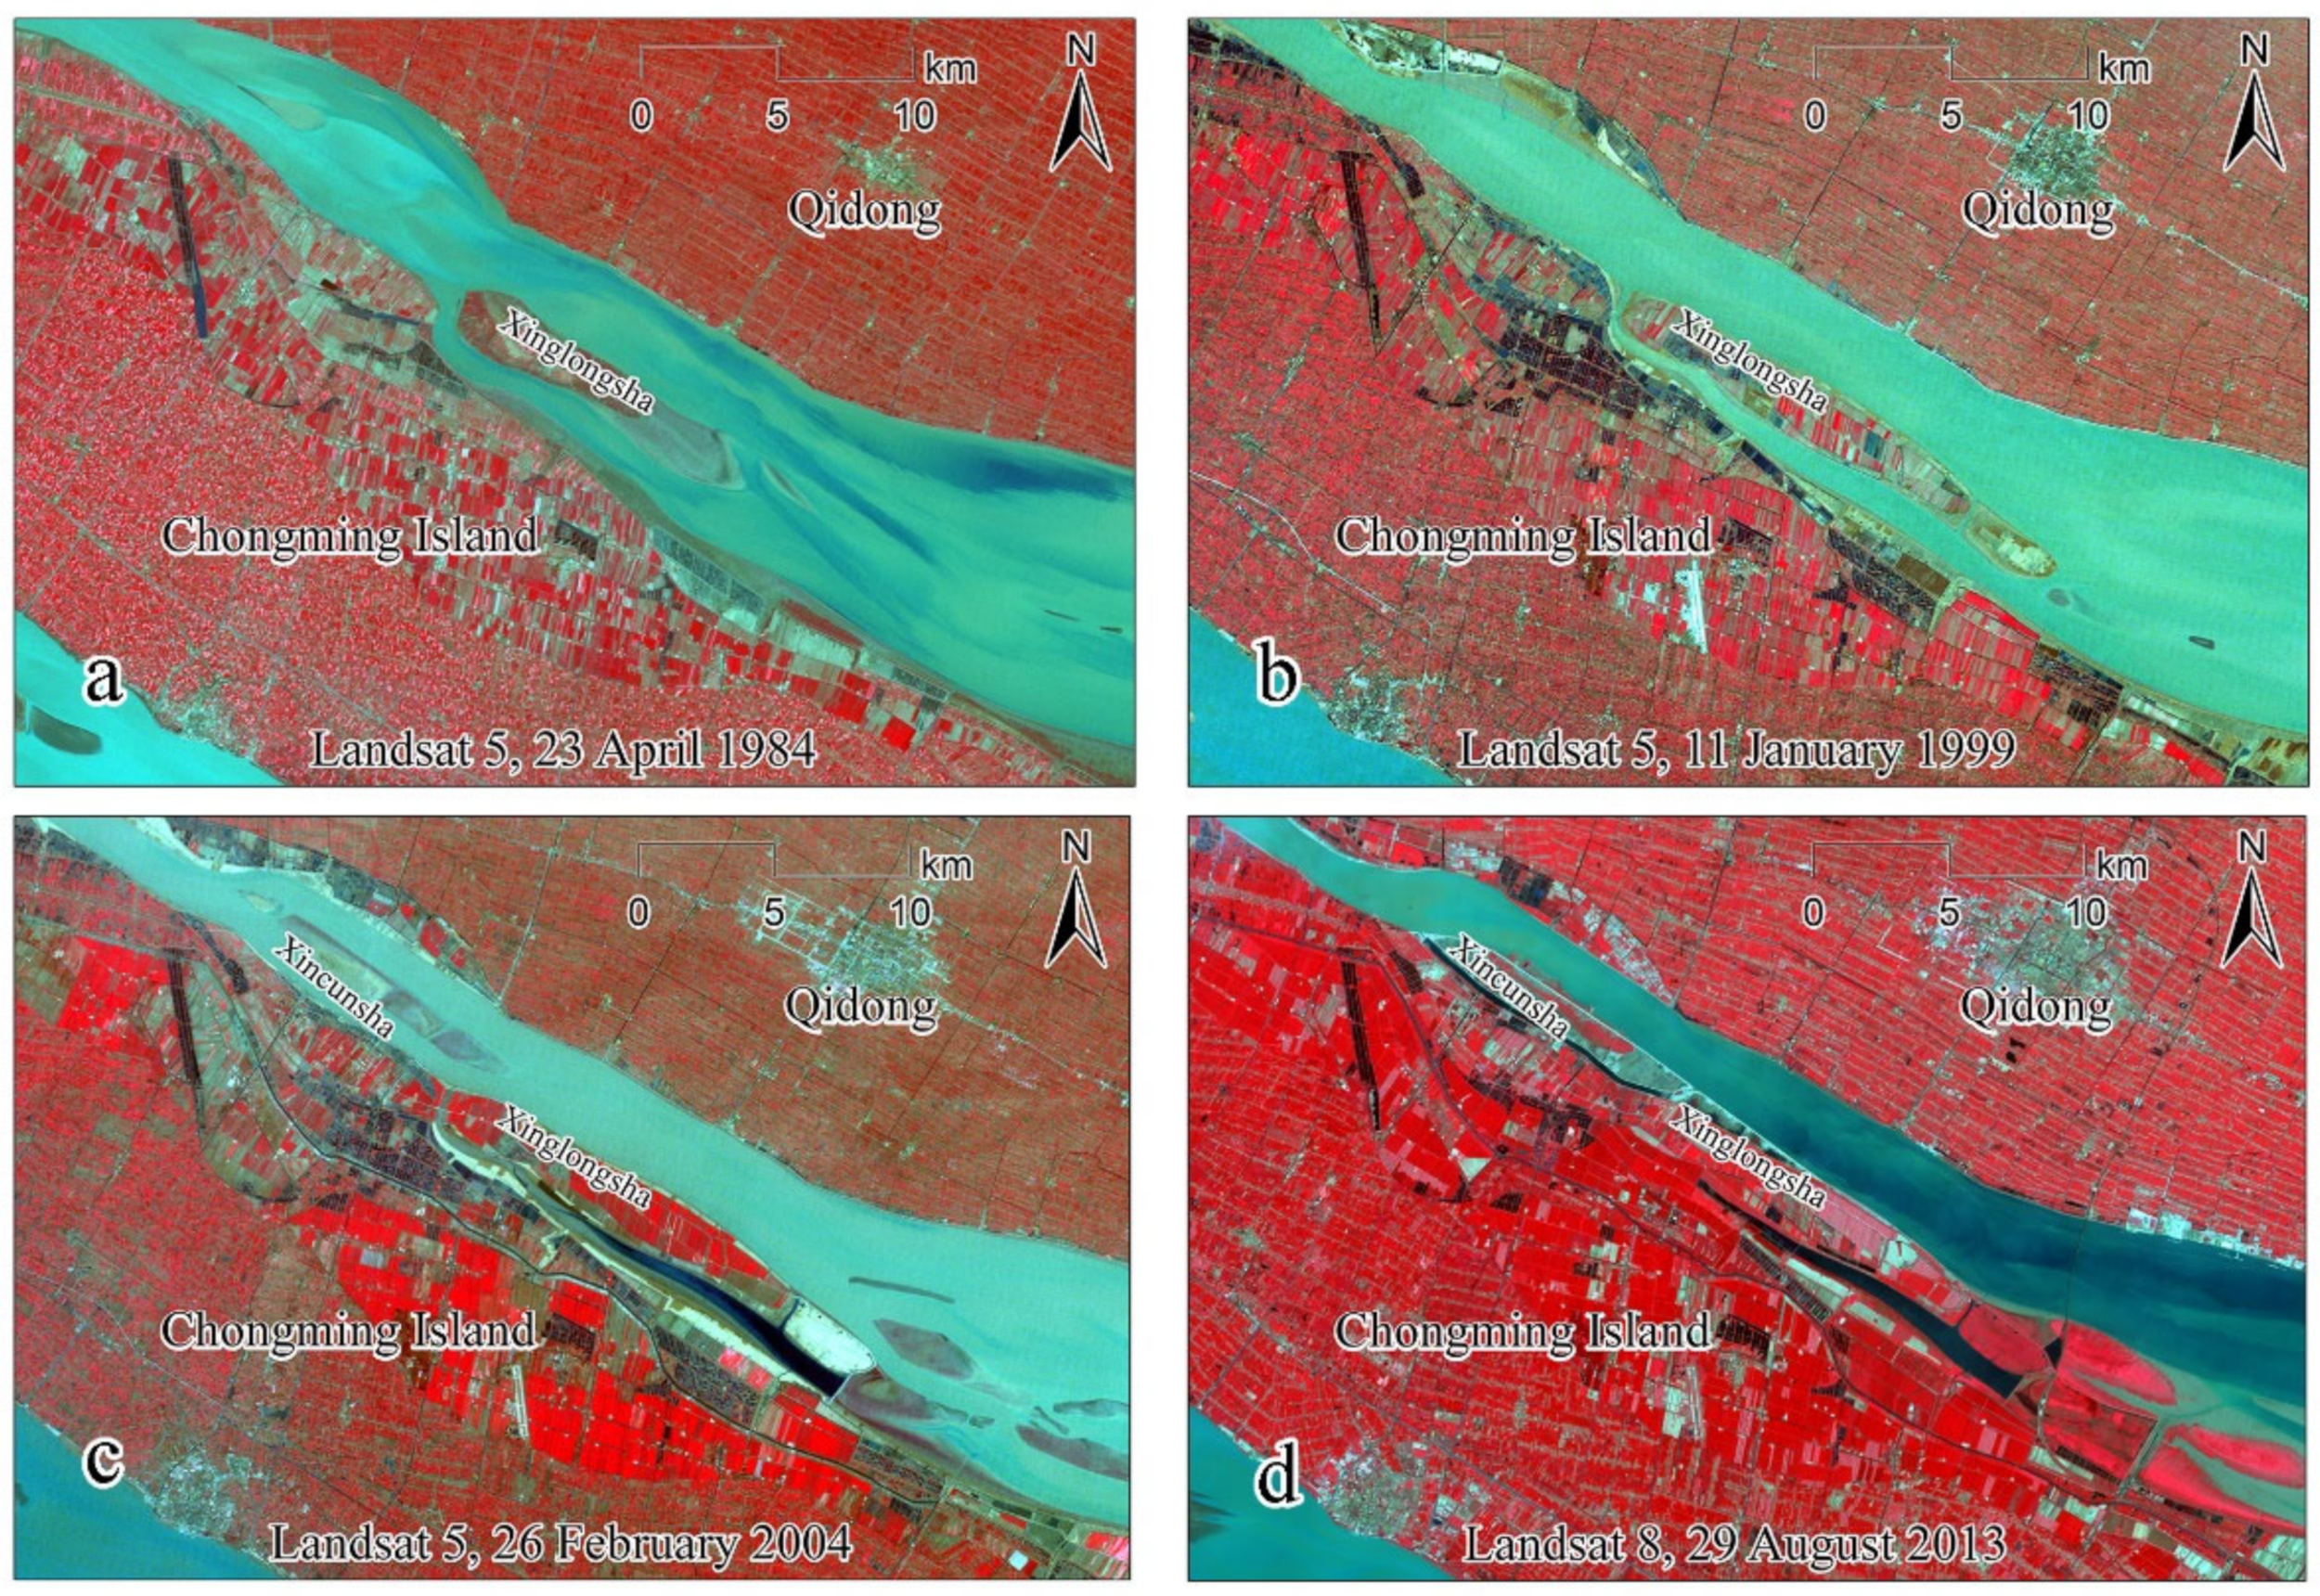
4.3. Dynamics and Driving Factors of Northern Shoreline in Chongming Island

Due to Chongming Island’s position in the Yangtze River estuary, wave erosion and sediment deposits occurred simultaneously during the island’s evolution [47]. The deposits and the erosion process resulted in two shapes of shoreline development: arcuate and smooth. The arcuate shoreline, with vivid deposit effects, extends along the northeastern and eastern shores of Chongming Island (Figure 4), while the smooth shoreline, extending along the southern shore, was formed by a seawall built in the 1950s to protect the the shoreline [34]. The deposits on the northern side of Chongming Island were mainly due to the Coriolis force, which contributes to the island’s northwestern to southeastern morphology (Figure 4) [34]. The Coriolis effect deflects the river, causing strong erosion from the estuary’s southern bank due to its higher energy and faster flow. This results in the deposit of sediments on the northern bank, where the energy is lower and the river flows more slowly. Moreover, the main spillway of the Yangtze River estuary moves southward, which further aggravates the erosion of the southern bank and increases the deposits on the northern bank. Seawater intrusion often occurs in the northern branch of the Yangtze River, due to the effects of runoff, tide, and wind. As a result, the salinity of the northern branch is significantly higher than that of the southern branch [20,48]. Salinity results in the flocculation of fine suspended sediment, and eventually promotes sedimentation and increases deposits along the northern shoreline [42]. Moreover, cofferdam embankments have been built continuously along the northern shoreline for the purpose of reclaiming land (Figure 8). Intensive cofferdam and reclamation projects have reduced the width of the northern branch of the Yangtze River, changed the hydrodynamic environment, reduced river flow and velocity, and enhanced the siltation effects, resulting in additional sediment deposits along the northern shoreline.
The northern shoreline of Chongming Island expanded at an increasing rate after 1999 (Figure 5c). This might have been the result of a merging of the sand island in the northern branch of the Yangtze River into the northern part of Chongming Island, combined with large-scale engineering construction. Xincunsha and Xinglongsha islands are located in the central part of the northern branch of the Yangtze River estuary (Qidong City, Jiangsu Province; Figure 9). In the early stages, Xinglongsha was a small sand island formed by sediment accumulation in the center of the northern branch of the Yangtze River estuary (Figure 9a). Later, it gradually enlarged, due to continuous sedimentation (Figure 9b), merging into Chongming Island in the early 21st century (Figure 9c). Xinchunsha Island gradually accumulated sand (Figure 9c), and eventually merged into Chongming Island in 2014 (Figure 9d). The merging of the two sand islands directly accelerated shoreline expansion by changing the hydrodynamic environment and increasing the sedimentation rate. Since 1998, the deepwater channel project of the southern branch of the Yangtze River estuary has been under way. This project dredged the river bed in the southern channel of the Yangtze River and produced millions of tons of sediment [10]. Most of these sediments were redistributed into the northern shoreline, due to strong hydrodynamic transport [48].

4.4. Dynamics and Driving Factors of Eastern Shoreline in Chongming Island

The tidal flats in large estuaries like the Yangtze River estuary usually have very high deposit rates due to the transportation of large amounts of sediment from upstream [49]. This dynamic is responsible for the continuous expansion of the eastern shoreline of Chongming Island, for three principal reasons. The first reason is flow expansion, where a river transitions from a confined flow to an unconfined flow, resulting in the rapid expansion of the cross-sectional area and causing even more sediment deposits in estuaries [50]. Second, Spartina alterniflora was introduced into the eastern part of Chongming Island in 1990s to improve land reclamation and to alleviate erosion [51]. The area of S. alterniflora expanded rapidly from 4 hectares in 1995 to 2067 hectares in 2012. There are still 1315 hectares of S. alterniflora remaining in the eastern part of Chongming Island, even after a control program that has been in place since 2016) [33]. The existence of S. alterniflora and other tidal flat vegetation causes local water turbulence, slows water velocity, and facilitates sediment deposits. Moreover, the stems and leaves of vegetation adhere to the suspended sediment, which intensifies the sediment deposits. Finally, the land reclamation of tidal flats has been greatly increased in response to the rapid urbanization of the Yangtze River delta [46]. Six massive cofferdam projects have been carried out since 1984 on the eastern part of Chongming Island to reclaim more land (the fastest rate of land reclamation is in the E1 and E2 directions, as shown in Figure 8). Our findings regarding the eastern shoreline are consistent with the research of Sun et al. [40]. The direction of cofferdam construction was biased in the direction of natural accumulation; the northeastern part of Chongming Island corresponds exactly with the region with the highest natural accumulation rate. Previous studies found that the construction of cofferdams increases sediment accumulation along the shoreline [52].
Although the eastern shoreline of Chongming Island is constantly expanding, the rate of shoreline expansion decreased significantly after 2008 (i.e., the expansion rate now equals approximately zero, as shown in Figure 5b). This phenomenon might be related to the combined effects of the northern and southern branches of the Yangtze River. After the three gorges project, the largest water conservancy project in the Yangtze River basin, began operations, sediment inflow upstream of the delta was trapped by the dam, resulting in a continued decrease of downstream sediment (Figure 6) and slowing the Chongming Island shoreline expansion [53]. The research of Li et al. indicated that the average shoreline expansion rate and the net deposit area of the eastern part of Chongming Island (referred to as Dongtan in previous research) are significantly correlated with sediment transport at Datong Station [54].
The research of Li et al. also showed that cofferdam reclamation contributes to the accretion of tidal flats [54]. However, the research of Sun et al. showed that cofferdam construction in the eastern part of Chongming Island was gradually decreasing [40]. Our results show that the new area of cofferdam construction from 2003 to 2009 was less than 10 km2 (Figure 8). Therefore, the slowing cofferdam construction rate has a negative impact on shoreline expansion. More importantly, the Qingcaosha Reservoir project, located in the northern channel of the southern branch, which was begun in 2007, decreased the total runoff and tidal volume in the northern channel of the southern branch by narrowing the northern channel to 4450 m in width [44]. As a result, the sediment flux and the suspended sediment mass concentration in the northern channel decreased significantly [55], enhancing the erosion in the southeastern section of the eastern part of Chongming Island. Since then, the expansion rate of the eastern part of Chongming Island slowed dramatically (Figure 5b). Therefore, the decrease in upstream sediments and the construction of the Qingcaosha Reservoir are dominant factors in the slow expansion rate on the eastern part of Chongming Island after 2008.

4.5. Mechanisms of Eastern and Northern Shoreline Responses to Upstream Sediments

The dynamics of eastern and northern shorelines in Chongming Island are closely related to sediment inflow from upstream (Figure 3), but the response mechanisms of the eastern and northern shorelines to sediment inflow are different. The exponential relationship between the accumulated land area on the northern shoreline and the cumulative sediment indicates that an increasing amount of land is subject to less river sediment input (Figure 7). This suggests that other factors, including artificial cofferdams and nearshore- or offshore sediment, contribute more to the island’s expansion to the north than upstream sediment inputs. Unlike the eastern shoreline, the northern branch was narrowed by cofferdam construction (to 117.5 km2 during the study period, as shown in Figure 8; i.e., the narrowest part of the northern branch in 2013 was only half of the width it had in 1984, based on satellite images, as shown in Figure 4). This narrowing increases flow resistance and slows the flow rate, which reduces sediment accumulation along the northern shoreline. With the entrance narrowing, the influence of the Yangtze River runoff on the northern branch gradually diminished and it became the dominant tidal channel [48]. Nearshore and offshore sediments were transported into the northern branch channel of the Yangtze River under hydrodynamic processes, and the long and narrow coastline provided favorable conditions for sediment deposits [54].
Unlike the northern shoreline, the eastern shoreline has a linear relationship with cumulative sedimentation (Figure 7), indicating that upstream sediment input contributed more than other factors to the expansion of the eastern shoreline. Because the entrance of the southern branch of the Yangtze River is larger than that of the northern branch, sediment input distributes more sediment to the southern branch than to the northern branch [56]. The southern branch is dominated by Yangtze River runoff instead of tides [57]. The cross-sectional area of the southern branch of the Yangtze River increases significantly at the estuary, which causes the river to rapidly transition from a restricted flow to a non-restricted flow [58]. In this case, the flow slows, which brings more sediment deposits to the eastern shoreline.
The location of the eastern shoreline determines its complex hydrodynamic and tidal environments, and its erosion and its deposits are influenced by the combined effects of the northern and southern branches of the Yangtze River. From to south, the eastern part of Chongming Island can be divided into three sections: northeastern, eastern, and southeastern. Because the northeastern section is affected by the estuarian tides of the northern branch of the Yangtze River, its shoreline continuously expands outwards [54]. During flood and ebb tides, tidal currents diverge and converge in the eastern section due to its convex shape. As a result, it forms a region with rotating flow directions and low flow velocity, which are conducive to sediment deposits and an expansion of the shoreline outward [51]. The erosion is much stronger in the southeastern section than in the other two sections because that section is close to the northern channel mouth of the Yangtze River’s southern branch, where the suspended sediment has declined because of the Qingcaosha Reservoir [55]. The tidal current in the eastern section of the eastern shoreline of Chongming Island has decreased, because the northern channel mouth of the southern branch slowly grows the eastern shoreline to the northeast (Figure 4). Correspondingly, the construction direction of the cofferdam on the eastern shoreline gradually tends to the northeast (Figure 8).

5. Conclusions

The LISA method has a high capacity for stable and accurate shoreline extraction from the SWIR1 bands in Chongming Island. Our study uncovered four major phenomena. First, although the sediment inflow upstream in the Yangtze River has decreased, the shoreline of Chongming Island continues to shift outwards because of reclamation and estuary projects and the sediment resuspension from nearshore or cross-shore currents. Second, the northern shoreline of Chongming Island has expanded rapidly since 1999, because more coastal and offshore sediments were transported by hydrodynamic processes. (Xinlongsha and Xincunsha Islands were merged with Chongming Island.) Third, outward shifts of the eastern shoreline of Chongming Island slowed after 2008 due to the decreasing inflow of upstream sediment, the slower rate of cofferdam reclamation, and the construction of the Qingcaosha Reservoir. Finally, the main driving factors of shoreline movement on Chongming Island are cofferdam reclamation and coastal engineering. Our results provide a better understanding of the historical shoreline dynamics in Chongming Island from 1984 to 2020 and provide some fundamental principles for river management, land reclamation, future urban planning, and the social and economic development of Chongming Island.

Supplementary Materials

The following supporting information can be downloaded at: https://www.mdpi.com/article/10.3390/rs14143305/s1. Supplementary Materials S1: All shoreline extraction results of Chongming Island; Supplementary Materials S2: Accuracy assessment of Landsat shoreline extraction results based on Sentinel 2; Python scripts.

Author Contributions

Conceptualization, H.W. and D.X.; methodology, H.W. and D.X.; validation, H.W. and Y.P.; formal analysis, H.W., D.X., Y.P. and D.Z.; investigation, H.W., Y.P. and D.Z.; writing—original draft preparation, H.W.; writing—review and editing, D.X. and Z.L.; supervision, D.X.; funding acquisition, D.X. and Z.L. All authors have read and agreed to the published version of the manuscript.

Funding

This research was funded by the National Natural Science Foundation of China (41871097, 41901361) and the Six Talent Peaks Program of Jiangsu Province (TD-XYDXX-006).

Data Availability Statement

Not applicable.

Acknowledgments

The authors would like to acknowledge the Yangtze Water Resources Commission for providing the datasets of the Datong Hydrological Station. We also acknowledge John Wilmshurst for proofreading the English usage in this manuscript.

Conflicts of Interest

The authors declare no conflict of interest.

Appendix A

Appendix A provides the information from all Landsat images used to extract the shoreline of Chongming Island in this study.
Table A1. Landsat imagery acquired for shoreline extraction in Chongming Island.
Year/MonthMarchAprilMayJuneJulyAugustSeptemberOctoberNovemberDecemberJanuaryFebruary
Year/SeasonSpringSummerAutumnWinter
1984 1 TM
1985 1 TM 1 TM
1986 1 TM 1 TM2 TM
1987 1 TM 1 TM1 TM
1988 1 TM 2 TM1 TM1 TM
1989 1 TM 1 TM 1 TM1 TM
19901 TM1 TM 1 TM
1991 1 TM 1 TM
1992 1 TM
19931 TM 1 TM
1994 1 TM
19951 TM1 TM1 TM 1 TM
1996 1 TM
1997 1 TM
1998 1 TM
1999 1 TM 1 TM
2000
20011 TM
20021 TM 1 TM 1 TM
2003 1 TM
2004 1 TM 1 TM 1 TM 1 TM
2005 1 TM 1 TM
2006 1 TM
2007 1 TM 1 TM 1 TM
2008 1 TM 1 TM
2009 1 TM 1 TM
2010 1 TM1 TM1 TM
20111 TM 1 TM 1 TM
2012
2013 1 OLI 1 OLI
2014 1 OLI
20151 OLI 1 OLI
2016 1 OLI
2017 1 OLI 1 OLI 1 OLI
2018 1 OLI 1 OLI
2019 1 OLI 1 OLI1 OLI
2020 1 OLI 1 OLI 1 OLI1 OLI

References

  1. Mondal, I.; Bandyopadhyay, J.; Dhara, S. Detecting shoreline changing trends using principle component analysis in sagar island, west bengal, india. Spat. Inf. Res. 2016, 25, 67–73. [Google Scholar] [CrossRef]
  2. Ge, X.; Sun, X.; Liu, Z. Object-Oriented Coastline Classification and Extraction from Remote Sensing Imagery. In Proceedings of the Remote Sensing of the Environment: 18th National Symposium on Remote Sensing of China, Wuhan, China, 14 May 2014. [Google Scholar]
  3. Yang, S.L.; Li, M.; Dai, S.B.; Liu, Z.; Zhang, J.; Ding, P.X. Drastic decrease in sediment supply from the yangtze river and its challenge to coastal wetland management. Geophys. Res. Lett. 2006, 33, L06408. [Google Scholar] [CrossRef]
  4. Liu, Y.; Li, X.; Hou, X. Spatiotemporal changes to the river channel and shoreline of the yellow river delta during a 40-year period (1976–2017). J. Coast. Res. 2019, 36, 128–138. [Google Scholar] [CrossRef]
  5. Cui, B.-L.; Li, X.-Y. Coastline change of the yellow river estuary and its response to the sediment and runoff (1976–2005). Geomorphology 2011, 127, 32–40. [Google Scholar] [CrossRef]
  6. Nienhuis, J.H.; Ashton, A.D.; Roos, P.C.; Hulscher, S.J.M.H.; Giosan, L. Wave reworking of abandoned deltas. Geophys. Res. Lett. 2013, 40, 5899–5903. [Google Scholar] [CrossRef] [Green Version]
  7. Lee, Y.-K.; Ry, J.-H.; Choi, J.-K.; Soh, J.-G.; Eom, J.-A.; Won, J.-S. A study of decadal sedimentation trend changes by waterline comparisons within the ganghwa tidal flats initiated by human activities. J. Coast. Res. 2011, 27, 867–869. [Google Scholar] [CrossRef]
  8. Tian, B.; Zhang, L.; Wang, X.; Zhou, Y.; Zhang, W. Forecasting the effects of sea-level rise at chongming dongtan nature reserve in the yangtze delta, shanghai, china. Ecol. Eng. 2010, 36, 1383–1388. [Google Scholar] [CrossRef]
  9. Jiang, T.; Kundzewicz, Z.W.; Su, B. Changes in monthly precipitation and flood hazard in the yangtze river basin, china. Int. J. Climatol. 2008, 28, 1471–1481. [Google Scholar] [CrossRef]
  10. Xue, P.; Chen, C.; Ding, P.; Beardsley, R.C.; Lin, H.; Ge, J.; Kong, Y. Saltwater intrusion into the changjiang river: A model-guided mechanism study. J. Geophys. Res. 2009, 114, C02006. [Google Scholar] [CrossRef]
  11. Chu, Z.; Yang, X.; Feng, X.; Fan, D.; Li, Y.; Shen, X.; Miao, A. Temporal and spatial changes in coastline movement of the yangtze delta during 1974–2010. J. Asian Earth Sci. 2013, 66, 166–174. [Google Scholar] [CrossRef]
  12. Yang, S.L.; Milliman, J.D.; Li, P.; Xu, K. 50,000 dams later: Erosion of the yangtze river and its delta. Glob. Planet Change 2011, 75, 14–20. [Google Scholar] [CrossRef]
  13. Fan, D.; Guo, Y.; Wang, P.; Shi, J.Z. Cross-shore variations in morphodynamic processes of an open-coast mudflat in the changjiang delta, china: With an emphasis on storm impacts. Cont. Shelf Res. 2006, 26, 517–538. [Google Scholar] [CrossRef]
  14. Zhao, B.; Wang, Z.; Chen, J.; Chen, Z. Marine sediment records and relative sea level change during late pleistocene in the changjiang delta area and adjacent continental shelf. Quat. Int. 2008, 186, 164–172. [Google Scholar] [CrossRef]
  15. Luan, Z.; Jin, Q. Research on water-sediment numerical simulation of middle and lower reaches of the yangtze river and estuary. Procedia Eng. 2016, 154, 582–588. [Google Scholar] [CrossRef] [Green Version]
  16. Milliman, J.D.; Huang-Ting, S.; Zuo-Sheng, Y.; Meade, R.H.; Milliman, J.D.; Jin, Q. Transport and deposition of river sediment in the changjiang estuary and adjacent continental shelf. Cont. Shelf Res. 1985, 4, 37–44. [Google Scholar] [CrossRef]
  17. Gao, S.; Wang, Y.P.; Gao, J.-H. Sediment retention at the changjiang sub-aqueous delta over a 57 year period, in response to catchment changes. Estuar. Coast. Shelf Sci. 2011, 95, 29–38. [Google Scholar] [CrossRef]
  18. Yang, H.F.; Yang, S.L.; Xu, K.H.; Milliman, J.D.; Wang, H.; Yang, Z.; Chen, Z.; Zhang, C.Y. Human impacts on sediment in the yangtze river: A review and new perspectives. Glob. Planet. Change 2018, 162, 8–17. [Google Scholar] [CrossRef]
  19. Li, M.; Chen, Z.; Yin, D.; Chen, J.; Wang, Z.; Sun, Q. Morphodynamic characteristics of the dextral diversion of the yangtze river mouth, china: Tidal and the coriolis force controls. Earth Surf. Processes Landf. 2011, 36, 641–650. [Google Scholar] [CrossRef]
  20. Wang, J.-H.; Zhang, D.-B.; Zhang, W.-S.; Zhang, J.-S. Impacts of different dynamic factors on the saltwater intrusion in the northern branch of the yangtze estuary. China Ocean Eng. 2019, 33, 673–684. [Google Scholar] [CrossRef]
  21. Xu, H.-J.; Huang, Z.; Bai, Y.-C.; Su, L.-S.; Hong, Y.-C.; Lu, T.-T.; Wang, X. Numerical analysis of sediment deposition in yangtze river estuary: Insight from conceptual estuary models. Appl. Ocean Res. 2020, 104, 102372. [Google Scholar] [CrossRef]
  22. Ghosh, M.K.; Kumar, L.; Roy, C. Monitoring the coastline change of hatiya island in bangladesh using remote sensing techniques. ISPRS J. Photogramm. Remote Sens. 2015, 101, 137–144. [Google Scholar] [CrossRef]
  23. El-Asmar, H.M.; Hereher, M.E. Change detection of the coastal zone east of the nile delta using remote sensing. Environ. Earth Sci. 2010, 62, 769–777. [Google Scholar] [CrossRef]
  24. Guo, Q.; Pu, R.; Bing, Z.; Gao, L. A Comparative Study of Coastline Changes at Tampa Bay and Xiangshan Harbor during the Last 30 Years. In Proceedings of the 2016 IEEE International Geoscience and Remote Sensing Symposium (IGARSS), Beijing, China, 3 November 2016. [Google Scholar]
  25. Xu, H. Modification of normalised difference water index (ndwi) to enhance open water features in remotely sensed imagery. Int. J. Remote Sens. 2007, 27, 3025–3033. [Google Scholar] [CrossRef]
  26. Liu, Z.; Yao, Z.; Wang, R. Assessing methods of identifying open water bodies using landsat 8 oli imagery. Environ. Earth Sci. 2016, 75, 873. [Google Scholar] [CrossRef]
  27. Feyisa, G.L.; Meilby, H.; Fensholt, R.; Proud, S.R. Automated water extraction index: A new technique for surface water mapping using landsat imagery. Remote Sens. Environ. 2014, 140, 23–35. [Google Scholar] [CrossRef]
  28. Xu, D.; Pu, Y.; Zhu, M.; Luan, Z.; Shi, K. Automatic detection of algal blooms using sentinel-2 msi and landsat oli images. IEEE J. Sel. Top. Appl. Earth Obs. Remote Sens. 2021, 14, 8497–8511. [Google Scholar] [CrossRef]
  29. Xu, D.; Zhang, D.; Shi, D.; Luan, Z. Automatic extraction of open water using imagery of landsat series. Water 2020, 12, 1928. [Google Scholar] [CrossRef]
  30. Kowe, P.; Mutanga, O.; Odindi, J.; Dube, T. Exploring the spatial patterns of vegetation fragmentation using local spatial autocorrelation indices. J. Appl. Remote Sens. 2019, 13, 024523. [Google Scholar] [CrossRef]
  31. Wang, L.; Shi, C.; Diao, C.; Ji, W.; Yin, D. A survey of methods incorporating spatial information in image classification and spectral unmixing. Int. J. Remote Sens. 2016, 37, 3870–3910. [Google Scholar] [CrossRef]
  32. Zhang, X. Application of satellite remote sensing to coastal topography generation: Case study of chongming island in shanghai, china. J. Appl. Remote Sens. 2009, 3, 033572. [Google Scholar] [CrossRef]
  33. Zhang, X.; Xiao, X.; Wang, X.; Xu, X.; Chen, B.; Wang, J.; Ma, J.; Zhao, B.; Li, B. Quantifying expansion and removal of spartina alterniflora on chongming island, china, using time series landsat images during 1995–2018. Remote Sens. Environ. 2020, 247, 111916. [Google Scholar] [CrossRef] [PubMed]
  34. Wu, S.; Chen, R.; Meadows, M.E. Evolution of an estuarine island in the anthropocene: Complex dynamics of chongming island, shanghai, p.R. China. Sustainability 2019, 11, 6921. [Google Scholar] [CrossRef] [Green Version]
  35. Xu, D.; Geng, Q.; Jin, C.; Xu, Z.; Xu, X. Tree line identification and dynamics under climate change in wuyishan national park based on landsat images. Remote Sens. 2020, 12, 2890. [Google Scholar] [CrossRef]
  36. Ryu, J.-H.; Won, J.-S.; Min, K.D. Waterline extraction from landsat tm data in a tidal flat—A case study in gomso bay, korea. Remote Sens. Environ. 2002, 83, 442–456. [Google Scholar] [CrossRef]
  37. Colditz, R.R.; Troche Souza, C.; Vazquez, B.; Wickel, A.J.; Ressl, R. Analysis of optimal thresholds for identification of open water using modis-derived spectral indices for two coastal wetland systems in mexico. Int. J. Appl. Earth Obs. Geoinf. 2018, 70, 13–24. [Google Scholar] [CrossRef]
  38. Frazier, P.; Page, K. Water body detection and delineation with landsat tm data. Photogramm. Eng. Remote Sens. 2000, 66, 1461–1467. [Google Scholar]
  39. Yang, H.F.; Yang, S.L.; Xu, K.H. River-sea transitions of sediment dynamics: A case study of the tide-impacted yangtze river estuary. Estuar. Coast. Shelf Sci. 2017, 196, 207–216. [Google Scholar] [CrossRef]
  40. Sun, N.; Zhu, W.; Cheng, Q. Gf-1 and landsat observed a 40-year wetland spatiotemporal variation and its coupled environmental factors in yangtze river estuary. Estuar. Coast. Shelf Sci. 2018, 207, 30–39. [Google Scholar] [CrossRef]
  41. Dolgopolova, E.N.; Isupova, M.V. Classification of estuaries by hydrodynamic processes. Water Resour. 2010, 37, 268–284. [Google Scholar] [CrossRef]
  42. Kuang, C.; Liu, X.; Gu, J.; Guo, Y.; Huang, S.; Liu, S.; Yu, W.; Huang, J.; Sun, B. Numerical prediction of medium-term tidal flat evolution in the yangtze estuary: Impacts of the three gorges project. Cont. Shelf Res. 2013, 52, 12–26. [Google Scholar] [CrossRef]
  43. Luo, W.; Shen, F.; He, Q.; Cao, F.; Zhao, H.; Li, M. Changes in suspended sediments in the yangtze river estuary from 1984 to 2020: Responses to basin and estuarine engineering constructions. Sci. Total Environ. 2022, 805, 150381. [Google Scholar] [CrossRef] [PubMed]
  44. Cai, L.; Chen, S.; Yan, X.; Bai, Y.; Bu, J. Study on high-resolution suspended sediment distribution under the influence of coastal zone engineering in the yangtze river mouth, China. Remote Sens. 2022, 14, 486. [Google Scholar] [CrossRef]
  45. Chen, Y.; Dong, J.; Xiao, X.; Zhang, M.; Tian, B.; Zhou, Y.; Li, B.; Ma, Z. Land claim and loss of tidal flats in the yangtze estuary. Sci. Rep. 2016, 6, 24018. [Google Scholar] [CrossRef] [PubMed]
  46. França, M.C.; Francisquini, M.I.; Cohen, M.C.L.; Pessenda, L.C.R.; Rossetti, D.F.; Guimarães, J.T.F.; Smith, C.B. The last mangroves of marajó island—Eastern amazon: Impact of climate and/or relative sea-level changes. Rev. Palaeobot. Palynol. 2012, 187, 50–65. [Google Scholar] [CrossRef]
  47. Seybold, H.; Andrade, J.S.; Herrmann, H.J. Modeling river delta formation. Proc. Natl. Acad. Sci. USA 2007, 104, 16804–16809. [Google Scholar] [CrossRef] [Green Version]
  48. Yang, H.F.; Yang, S.L.; Xu, K.H.; Wu, H.; Shi, B.W.; Zhu, Q.; Zhang, W.X.; Yang, Z. Erosion potential of the yangtze delta under sediment starvation and climate change. Sci. Rep. 2017, 7, 10535. [Google Scholar] [CrossRef] [Green Version]
  49. Pan, L.; Ding, P.; Ge, J. Impacts of deep waterway project on morphological changes within the north passage of the changjiang estuary, china. J. Coast. Res. 2012, 284, 1165–1176. [Google Scholar] [CrossRef]
  50. Zhu, C.; Guo, L.; Maren, D.S.; Tian, B.; Wang, X.; He, Q.; Wang, Z.B. Decadal morphological evolution of the mouth zone of the yangtze estuary in response to human interventions. Earth Surf. Processes Landf. 2019, 44, 2319–2332. [Google Scholar] [CrossRef]
  51. Edmonds, D.A.; Slingerland, R.L. Mechanics of river mouth bar formation: Implications for the morphodynamics of delta distributary networks. J. Geophys. Res. 2007, 112, F02034. [Google Scholar] [CrossRef] [Green Version]
  52. Lu, J.; Zhang, Y. Spatial distribution of an invasive plant spartina alterniflora and its potential as biofuels in china. Ecol. Eng. 2013, 52, 175–181. [Google Scholar] [CrossRef]
  53. Luo, X.X.; Yang, S.L.; Wang, R.S.; Zhang, C.Y.; Li, P. New evidence of yangtze delta recession after closing of the three gorges dam. Sci. Rep. 2017, 7, 41735. [Google Scholar] [CrossRef] [PubMed] [Green Version]
  54. Li, X.; Zhou, Y.; Zhang, L.; Kuang, R. Shoreline change of chongming dongtan and response to river sediment load: A remote sensing assessment. J. Hydrol. 2014, 511, 432–442. [Google Scholar] [CrossRef]
  55. Li, X.; Zhang, X.; Qiu, C.; Duan, Y.; Liu, S.; Chen, D.; Zhang, L.; Zhu, C. Rapid loss of tidal flats in the yangtze river delta since 1974. Int. J. Environ. Res. Public Health 2020, 17, 1636. [Google Scholar] [CrossRef] [PubMed] [Green Version]
  56. Du, J.-L.; Yang, S.-L.; Feng, H. Recent human impacts on the morphological evolution of the yangtze river delta foreland: A review and new perspectives. Estuar. Coast. Shelf Sci. 2016, 181, 160–169. [Google Scholar] [CrossRef]
  57. Xie, L.; Zhang, Z.; Zhang, Y.; Wang, Y.; Huang, X. Sedimentation and morphological changes at yuantuojiao point, estuary of the north branch, changjiang river. Acta Oceanol. Sin. 2013, 32, 24–34. [Google Scholar] [CrossRef]
  58. Zhu, B.; Yue, Y.; Borthwick, A.G.L.; Yu, W.; Liang, E.; Tang, J.; Chai, Y.; Li, Y. Decadal link between longitudinal morphological changes in branching channels of yangtze estuary and movement of the offshore depo-center. Earth Surf. Processes Landf. 2020, 45, 2689–2705. [Google Scholar] [CrossRef]
Figure 1. Study area: Chongming Island, Shanghai, China. The background picture is a Landsat OLI image obtained on 9 March 2020, with standard false color composition (near-infrared band in red, red band in green, and green band in blue).
Remotesensing 14 03305 g001
Figure 2. The northern (a) and eastern (b) parts of Chongming Island. The image is a true-color composite downloaded from Google Earth with a spatial resolution of 17.8 m, obtained on 31 December 2020; the background image in the left bottom is a Landsat OLI image obtained on 9 March 2020, with standard false color composition (near-infrared band in red, red band in green, and green band in blue); the dividing line is the shoreline extraction from the SWIR1 band of the Landsat OLI image, obtained on 16 August 2020.
Remotesensing 14 03305 g002
Figure 3. Methodology flowchart. SWIR1 is the first shortwave infrared band; SWIR2 refers to the second shortwave infrared band of the Landsat images.
Remotesensing 14 03305 g003
Figure 4. Image extraction of the Chongming Island shoreline. (a) the result of shoreline extraction on 23 April 1984; (b) the result of shoreline extraction on 8 April 1990; (c) the result of shoreline extraction on 29 August 2013; (d) the result of shoreline extraction on 18 January 2019. The background image is a Landsat image with standard false color composition (near-infrared band in red, red band in green, and green band in blue), with a spatial resolution of 30 m.
Remotesensing 14 03305 g004
Figure 5. Segmented linear regression of the shorelines of the whole of Chongming Island (a), the eastern shoreline (b), and the northern shoreline (c).
Remotesensing 14 03305 g005
Figure 6. Annual runoff (a), annual sediment load (b), and annual suspended sediment concentration (c), before (left side of the dashed line) and after (right side of the dashed line) the three gorges project became operational. Data measured at Datong Station from 1984 to 2002.
Remotesensing 14 03305 g006
Figure 7. Relationship between sediment accumulation and the extracted areas of the eastern and northern shorelines on Chongming Island.
Remotesensing 14 03305 g007
Figure 8. Cofferdam engineering of Chongming Island from 1984 to 2020 (E1, E2, E3, E4, and N represent the direction of cofferdam protection on Chongming Island).
Remotesensing 14 03305 g008
Figure 9. The formation and incorporation of Xinglongsha and Xincunsha into Chongming Island. (a) the Xinglongsha formed by sediment accumulation; (b) the Xinglongsha gradually enlarged; (c) the Xinglongsha merged into Chongming Island and the Xinchunsha accumulated sand; (d) the Xinglongsha and Xinchusha merged into Chongming Island. The background is a Landsat image with standard false color composition (near-infrared band in red, red band in green, and green band in blue), with a spatial resolution of 30 m.
Remotesensing 14 03305 g009
Publisher’s Note: MDPI stays neutral with regard to jurisdictional claims in published maps and institutional affiliations.

