Article

Extensive Evaluation of Four Satellite Precipitation Products and Their Hydrologic Applications over the Yarlung Zangbo River

1
Key Laboratory of Water Cycle & Related Land Surface Process, Institute of Geographic Sciences and Natural Resources Research, Chinese Academy of Sciences, Beijing 100101, China
2
University of Chinese Academy of Sciences, Beijing 100101, China
3
National Institute of Natural Hazards, Ministry of Emergency Management of the People’s Republic of China, Beijing 100085, China
*
Author to whom correspondence should be addressed.
Remote Sens. 2022, 14(14), 3350; https://doi.org/10.3390/rs14143350
Submission received: 11 June 2022 / Revised: 2 July 2022 / Accepted: 7 July 2022 / Published: 12 July 2022
(This article belongs to the Section Atmospheric Remote Sensing)

Abstract

:
Satellite remote sensing precipitation products with high temporal–spatial resolution and large area coverage have great potential in hydrometeorological research. This paper analyzes the performance of four satellite products from 2000 to 2008 in the Yarlung Zangbo River Basin, namely the Tropical Rainfall Measuring Mission (TRMM), Precipitation Estimation from Remotely Sensed Information using Artificial Neural Networks-Climate Data Record (PERSIANN), Climate Hazards Group InfraRed Precipitation with Station data (CHIRPS), and Climate Prediction Center morphing method (CMORPH). The four products are evaluated from three aspects: spatial distribution, temporal characteristics, and hydrological simulation. The results show that: (1) the four products exhibit similar annual and daily precipitation patterns, with the highest daily precipitation accuracy concentrated in the center, followed by the east and west; (2) TRMM, CHIRPS, and CMORPH exhibit the largest positive bias for monthly precipitation estimation in December, while PERSIANN shows the largest positive bias in July. All products overestimate the precipitation of 0.1–5 mm/d, and underestimate the precipitation above 5 mm/d, especially for PERSIANN; (3) certain Products tend to perform better than others at elevations of 3000–4000 m and in relatively humid zones. TRMM shows relatively stable performance for various elevation and climate zones; (4) for hydrological model validation, TRMM has the best performance during the calibration period, although it is inferior to CHIRPS during the validation period. Overall, TRMM has the highest applicability in the Yarlung Zangbo River Basin; however, its impact on the uncertainty of hydrological modeling needs to be further studied.

Graphical Abstract

1. Introduction

Precipitation plays a significant role in the natural hydrological cycle, and reliable precipitation data is critical for flood warning, water resource management, and climate monitoring [1,2]. At present, there are three main methods for estimating precipitation, namely, rain gauge, ground-based weather radar, and satellite remote sensing monitoring. Although rain gauges are recognized as the most reliable source of data, they are often limited by observation density and equipment installation environment. At the same time, they cannot represent the whole spatial distribution of precipitation in a large area. Ground-based weather radars can provide real-time precipitation observations with high spatial and temporal resolution at the regional scale [3]. However, the radars are limited by uneven spatial distribution as well as by high cost, and cannot provide large-scale precipitation observations [4]. In contrast, satellite remote sensing can provide high resolution, long time series, and high-precision precipitation observation data, which makes up for the deficiencies of gauge and radar observations [5].
In recent decades, a large number of satellite precipitation products have been developed, including The Tropical Rainfall Measuring Mission(TRMM) [6,7], Precipitation Estimation from Remotely Sensed Information using Artificial Neural Networks-Climate Data Record (PERSIANN) [8,9,10], Climate Hazards Group InfraRed Precipitation with Station data (CHIRPS) [11], Climate Prediction Center morphing method (CMORPH) [12,13] and the Global Precipitation Measurements from Integrated Multi-satellite Retrievals (GPM-IMERG) [14], etc. At present, many researchers have carried out related work on the accuracy of various satellite precipitation products, and the majority of these studies have proven the great potential of satellite remote sensing monitoring in regional or global scale hydrometeorological simulation [13,15,16,17,18].
However, the quality of satellite estimations is inherently affected by systematic and random errors caused by flaws in sensors, algorithms, and sampling frequency [19,20]. Moreover, many satellite precipitation products (e.g., TRMM, PERSIANN, CMORPH, etc.) are bias-corrected by gauging data, and their accuracy is affected by gauge observation uncertainty [17]. In general, the performance of satellite precipitation products usually depends on a variety of factors, including geographical features, climatic conditions, precipitation characteristics, etc. [21,22]. Montes et al. [23] analyzed the performance of four satellite products in Bangladesh and found that while they all can capture the spatial distribution of locally heavy precipitation, they have random large errors in coastal and high-altitude areas. In the source region of the Yellow River, Meng et al. [24] found that the IMERG products show an obvious dependence on meteorological conditions, and the correlation in humid regions is better than that in arid regions. Ullah et al. [25] found that in Pakistan, TRMM showed the most significant agreement with gauge observations for daily precipitation greater than 10 mm, followed by CHIRPS and MSWEP. Yu et al. [26] also found that the error of satellite products is positively correlated with precipitation intensity.
In addition, the applicability of satellite precipitation products in hydrological simulations is a key indicator for evaluating their performance. Zhu et al. [27] studied the performance of using TRMM and CMORPH to force SWAT hydrological simulations in the Huifa River Basin in China. They found that TRMM and CMORPH had significantly better flow forecasting ability on the monthly scale than on the daily scale, and TRMM outperformed CMORPH. Sun et al. [13] used the VIC model to evaluate the hydrological applicability of four products (CMORPH CRT, CMORPH BLD, CMORPH CMA and TRMM) in the Huaihe River Basin in China. They found that the CMORPH CRT showed the worst simulations of long-term flow and extreme flood events, while the flow simulations forced by CMORPH CMA even outperformed those forced by TRMM. Sun et al. [28] found that when different precipitation products were used to fit the best parameters, the uncertainty of the simulation increased significantly.
The Yarlung Zangbo River Basin is located in the alpine region of southwestern China, with complex terrain and a diverse climate. The basin’s precipitation distribution is extremely uneven, and there are only a few meteorological stations. At present, relatively little work has been done on the evaluation of satellite precipitation product accuracy in this area. There have only been a few studies examining the application of various satellite precipitation products in this basin [29,30]. However, these studies generally lack an in-depth discussion of satellite precipitation estimation errors caused by terrain and climatic conditions. Furthermore, few studies have discussed the hydrological model parametric uncertainty caused by multiple satellite precipitation inputs in this area.
In this study, we validate the performance of four satellite precipitation products (i.e., TRMM, PERSIANN, CHIRPS and CMORPH) in the Yarlung Zangbo River Basin from three aspects: (1) compare the precipitation spatial distribution of the four products; (2) evaluate the precipitation temporal characteristics of the four products at the monthly and daily scales; and (3) evaluate the simulation effects of the four products by forcing the GR2M monthly hydrological model.

2. Study Area and Data
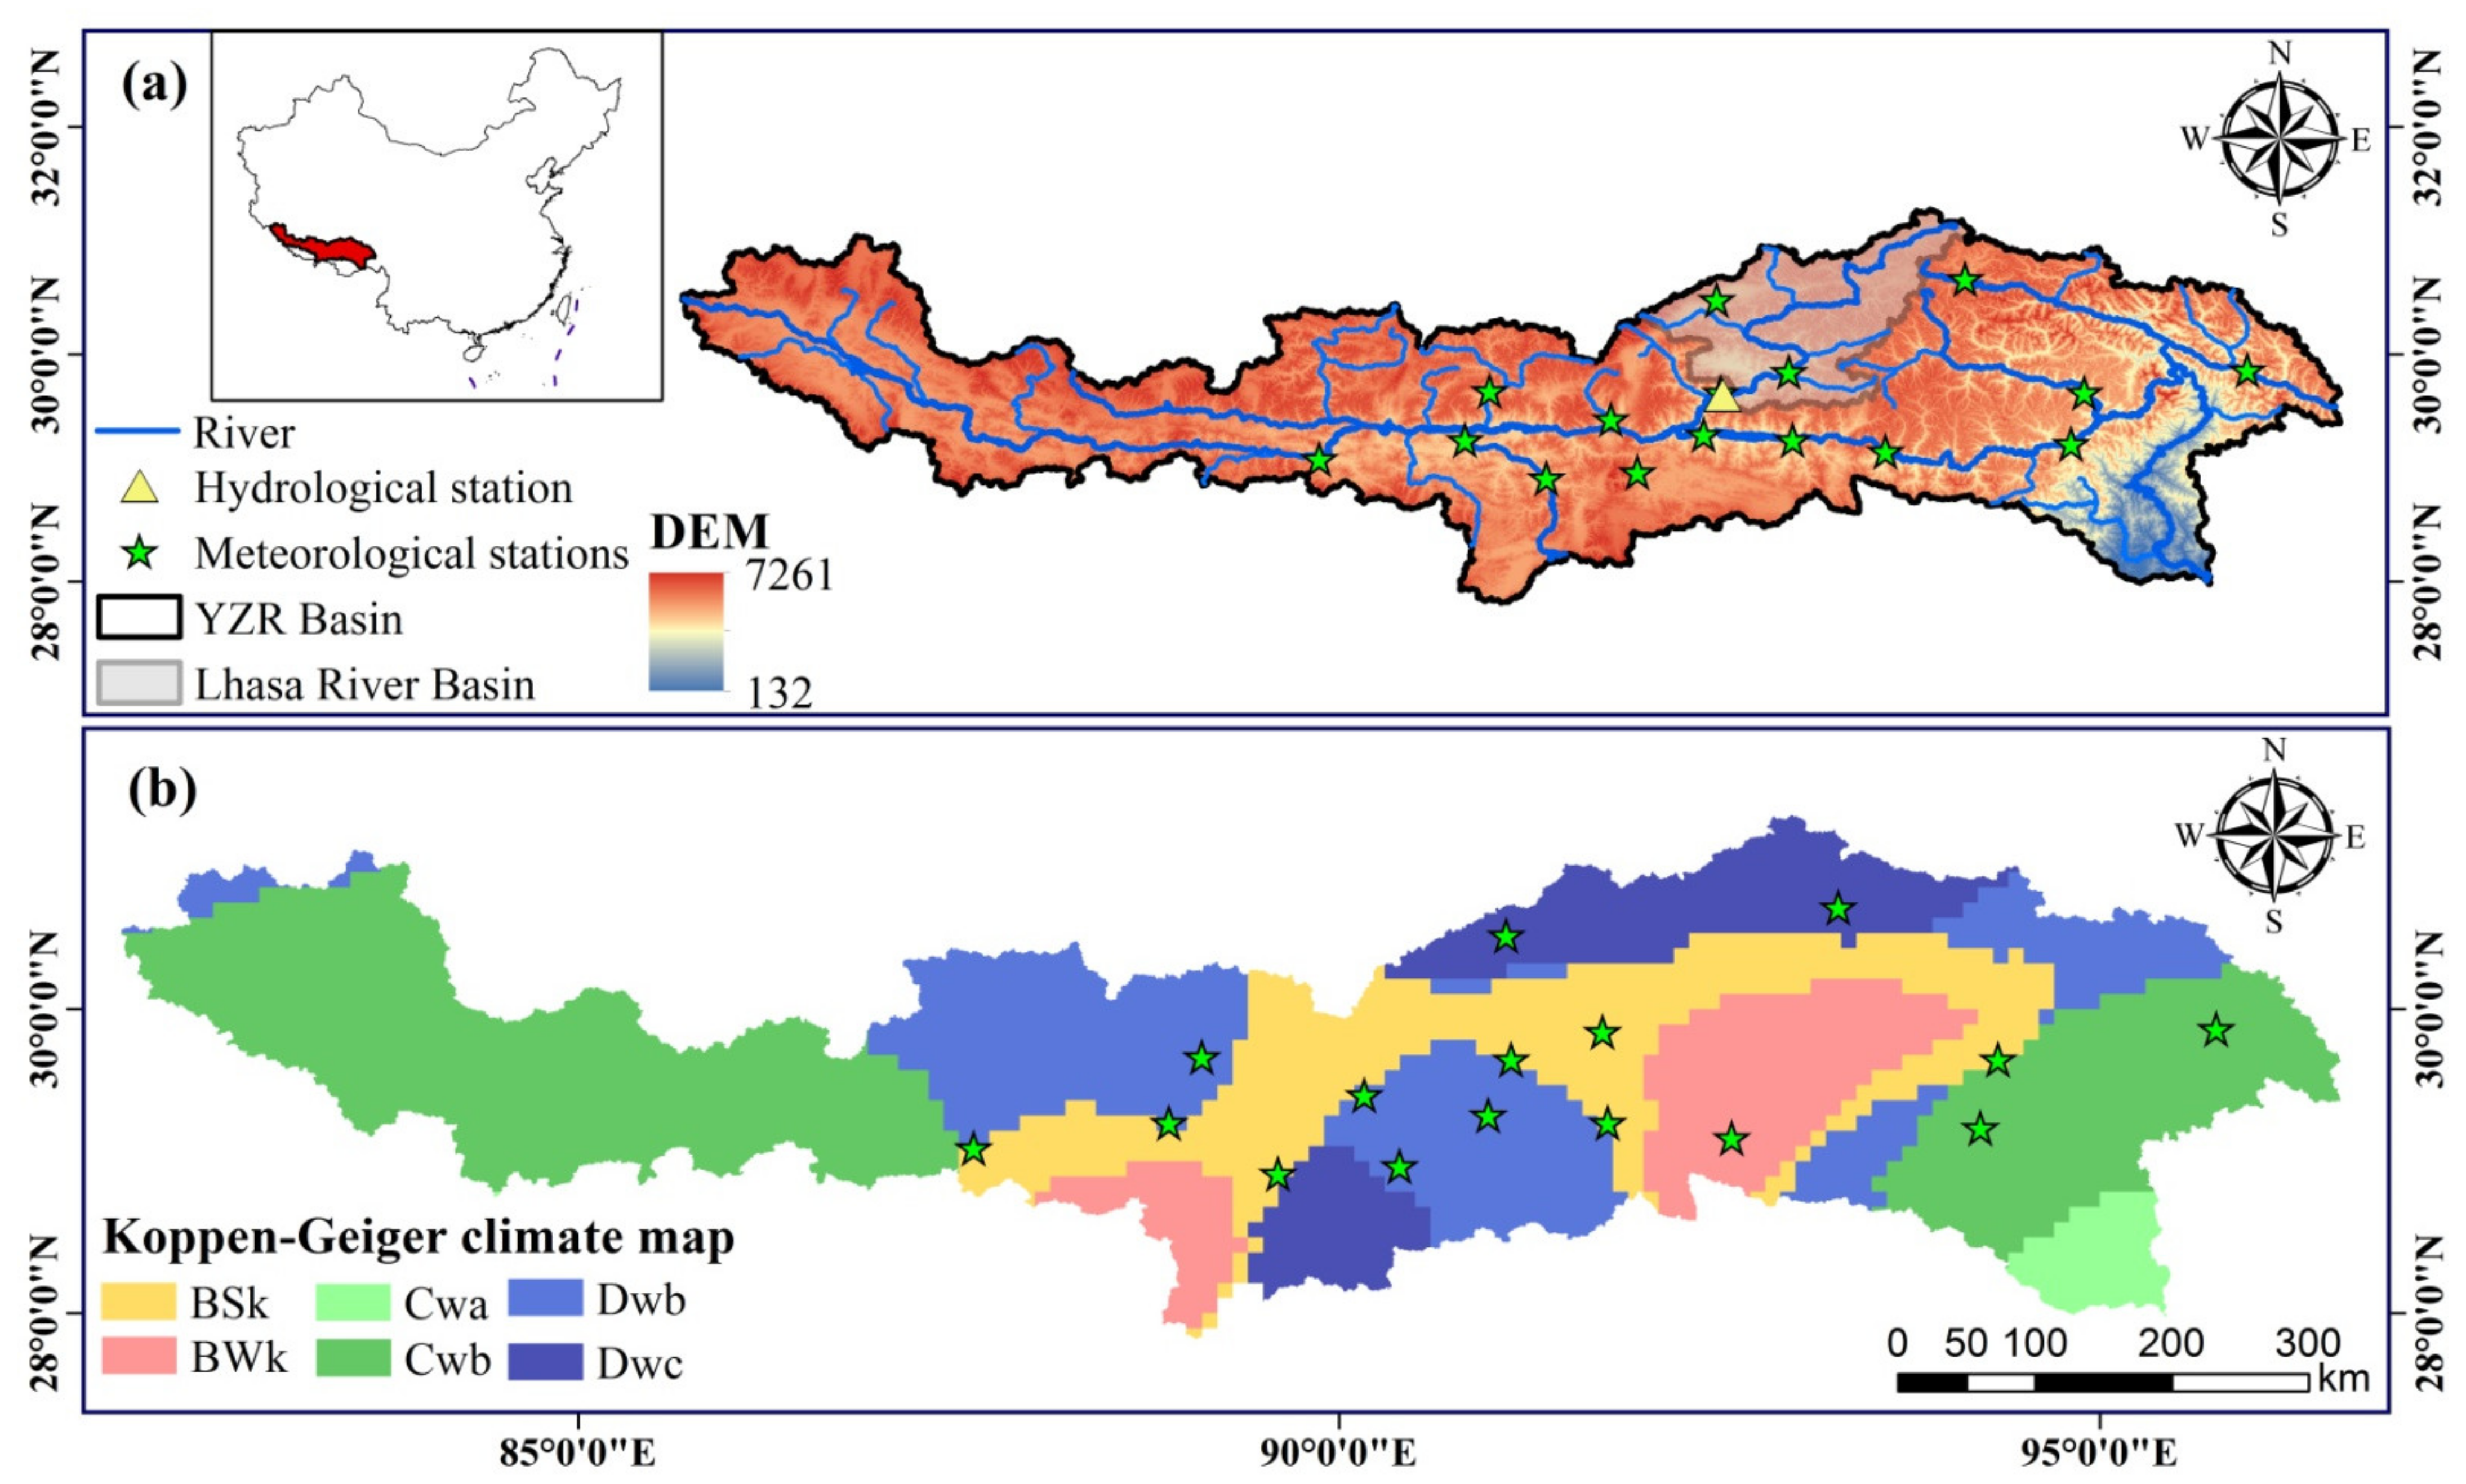
2.1. Study Area

The Yarlung Zangbo River basin (YZR) is located between 27–32°N and 82–97°E, in the southeast of the Qinghai–Tibet Plateau and at the northern foot of the Himalayas (Figure 1). The YZR has numerous tributaries, with a drainage area of approximately 240,000 km2, and the main stream stretches nearly 2000 km [31]. The basin’s water resource status is related to the safety of water in Tibet, China, India, Bangladesh, and other countries in the lower reaches. As shown in Figure 1a, the average altitude of the YZR is 4000 m, and the basin’s geography is high in the west and low in the east, with significant vertical elevation changes [32]. According to the Köppen climate map [33,34] in Figure 1b, the YZR has a variety of climate patterns, including Cold semi-arid climate (BSk), Cold desert climate (BWk), Monsoon-influenced humid subtropical climate (Cwa), Subtropical highland climate (Cwb), Monsoon-influenced warm-summer humid continental climate (Dwb), and Monsoon-influenced subarctic climate (Dwc). The annual average precipitation over the basin is 428.7 mm. Complex climatic conditions and topography result in extremely uneven distribution of precipitation in the YZR.

2.2. Datasets

2.2.1. Ground-Based Observations

In this study, two sets of observed daily precipitation data were selected from the China Meteorological Forcing Dataset (CMFD) and rain gauges, respectively. The former is a product based on the interpolation of Chinese meteorological stations at 0.1-degree grids, which has higher accuracy than other reanalysis products evaluated in China [35,36]. The latter is a collection of 16 reference gauges downloaded from the National Meteorological Data Center of China (http://data.cma.cn/) (accessed on 20 January on 2022).
In addition to precipitation, the model input dataset includes potential evaporation (PE) and Observed runoff (Q). PE is calculated by CMFD temperature data. Q is the measured runoff data from Lhasa hydrological station.

2.2.2. Satellite Precipitation Products

Four satellite products were employed in this study, including the Tropical Rainfall Measuring Mission (TRMM) [6,7], the Precipitation Estimation from Remotely Sensed Information using Artificial Neural Networks-Climate Data Record (PERSIANN) [8,9,10], Climate Hazards Group InfraRed Precipitation with Station data (CHIRPS) [11], and the Climate Prediction Center morphing method (CMORPH) [12,13]. To make the data comparable, the spatial resolution of all products was resampled to 0.1 degrees. At the same time, the daily precipitation products were accumulated to the yearly and monthly scales for comparison with multiple temporal scales. The information on observation data and satellite products is listed in Table 1.
TRMM is a satellite program jointly sponsored by NASA and JAXA from 1997 to 2015. The detectors carried by the satellite include TRMM Microwave Imager (TMI), Precipitation Radar (PR), Visible/Infrared Scanner (VIRS), etc. This study used the TRMM 3B42 satellite radar rainfall product. The 3B42 algorithm is a comprehensive precipitation assessment algorithm developed by the TRMM scientific team. It integrates various high-quality precipitation assessment algorithms such as 2B31, 2A12, SSMI, AMSR, etc. The infrared radiation data obtained by the infrared observation system was calibrated by the 3B42 algorithm. The TRMM 3B42_Daily_7 version was used in this study.
PERSIANN-CDR is a quasi-global (60°S–60°N) precipitation product produced by the University of California. The product generates precipitation estimation from the PERSIANN algorithm of the GridSat-B1 infrared data, and the precipitation is further corrected by an artificial neural network using National Centers for Environmental Prediction (NCEP) training data. The PERSIANN-CDR product is adjusted by the Global Precipitation Climatology Project (GPCP) monthly product. This version of the PERSIANN-CDR v1 Revision 1 was used in the present study. For convenience of description, in the following we use the abbreviation PERSIANN to represent this product.
CHIRPS is a hybrid quasi-global (50°S–50°N) precipitation product developed by the United States Geological Survey (USGS) and the Climate Hazards Group at the University of California. This product combines infrared satellite observations from the Climate Prediction Center (CPC) and the NCDC, satellite estimations from the Global Telecommunication System (GTS), and precipitation measurements from multiple gauges around the world. CHIRPS v2.0 was used in this study.
CMORPH is a quasi-global (60°S–60°N) precipitation product produced by the National Oceanic and Atmospheric Administration (NOAA) using temporal–spatial joint interpolation to integrate multi-platform satellite estimations. The CMORPH’s continuous precipitation distribution is based on high-resolution infrared brightness temperature data observed by geostationary satellites and extrapolated by passive microwave inversion from low-orbit satellites. CMORPH v1.0 CRT was used in this study.

3. Methodology

3.1. Evaluation Methods and Metrics

This study employed the three evaluation methods. The accuracy and deviation of four products were represented by statistical metrics, the precipitation detection capability was represented by categorical metrics, and product suitability for simulation was evaluated using the hydrological model. Meanwhile, all metrics of the four satellite products were validated on a basin-wide and grid-point scale, respectively, using CMFD data and recorded gauges as observations.
In this study, four statistical metrics were used: correlation coefficient (CC), relative bias (Bias), root mean square error (RMSE), and Nash–Sutcliffe efficiency (NSE). CC represents the degree of linear correlation between estimations and observations; Bias shows the ratio of the sum of residuals to the sum of observed data; RMSE is used to reflect the extreme error variation between simulated and observed data; and NSE quantitatively describes the accuracy of model simulation results. Three categorical metrics were used: Probability of detection (POD), False Alarm Ratio (FAR), and Critical Success Index (CSI). The POD indicates the probability of the satellite products correctly estimating precipitation events; the FAR indicates the probability of the precipitation events being incorrectly estimated by satellite products; and the CSI is the overall skill score of accurate estimation when combining POD and FAR. The equations and ideal values of the statistical and categorical metrics are listed in Table 2 below.

3.2. Hydrological Model

The GR2M is a conceptual monthly hydrological model developed by Makhlouf in 1990s [37] which has been continuously updated by many researchers and employed in many areas across the world [38,39,40,41,42,43,44]. The structures and equations of the GR2M model are shown in Figure 2. The GR2M model has two parameters: the ability to keep moisture in the soil (X1) and the exchange coefficient parameter (X2). The GR2M model defines three key state variables, which are Surface runoff (P3), Production store (S), and Routing store (R), respectively. P3 is the sum of Excess precipitation (P1) and Subsurface water (P2) (E5 in Figure 2). S is the basin’s soil moisture, which depends on parameter X1 (E4 in Figure 2). R is the surface runoff that flows into the river combined with the rest water from the previous month, which is calculated by parameter X2 (E6 in Figure 2). Detailed descriptions of the GR2M model can be found in the related literature [39,43].

3.3. Model Evaluation Criteria

Referring to related studies [45,46], we divided the monthly simulated time series into the calibration period (2000–2004) and validation period (2005–2008), which were employed to calibrate the model parameters and validate model results, respectively. The input data required for model simulation included Precipitation (P), Potential Evapotranspiration (PE), and Observed runoff (Q). Because the Lhasa station was chosen for this study, P and PE were the mean value series of the station’s control region, respectively, and Q was the observed runoff of the station. The NSE was taken as the objective function to calibrate the GR2M model (see the equation in Table 2), and the Cumulative Distribution Function (CDF) was used to describe the probability distribution of the model parameters, which is defined as follows:
F X x = P X x
where F X x represents the sum of the probability of occurrence of all values less than or equal to x in the discrete variable X.

4. Results

4.1. Basin-Wide Comparison

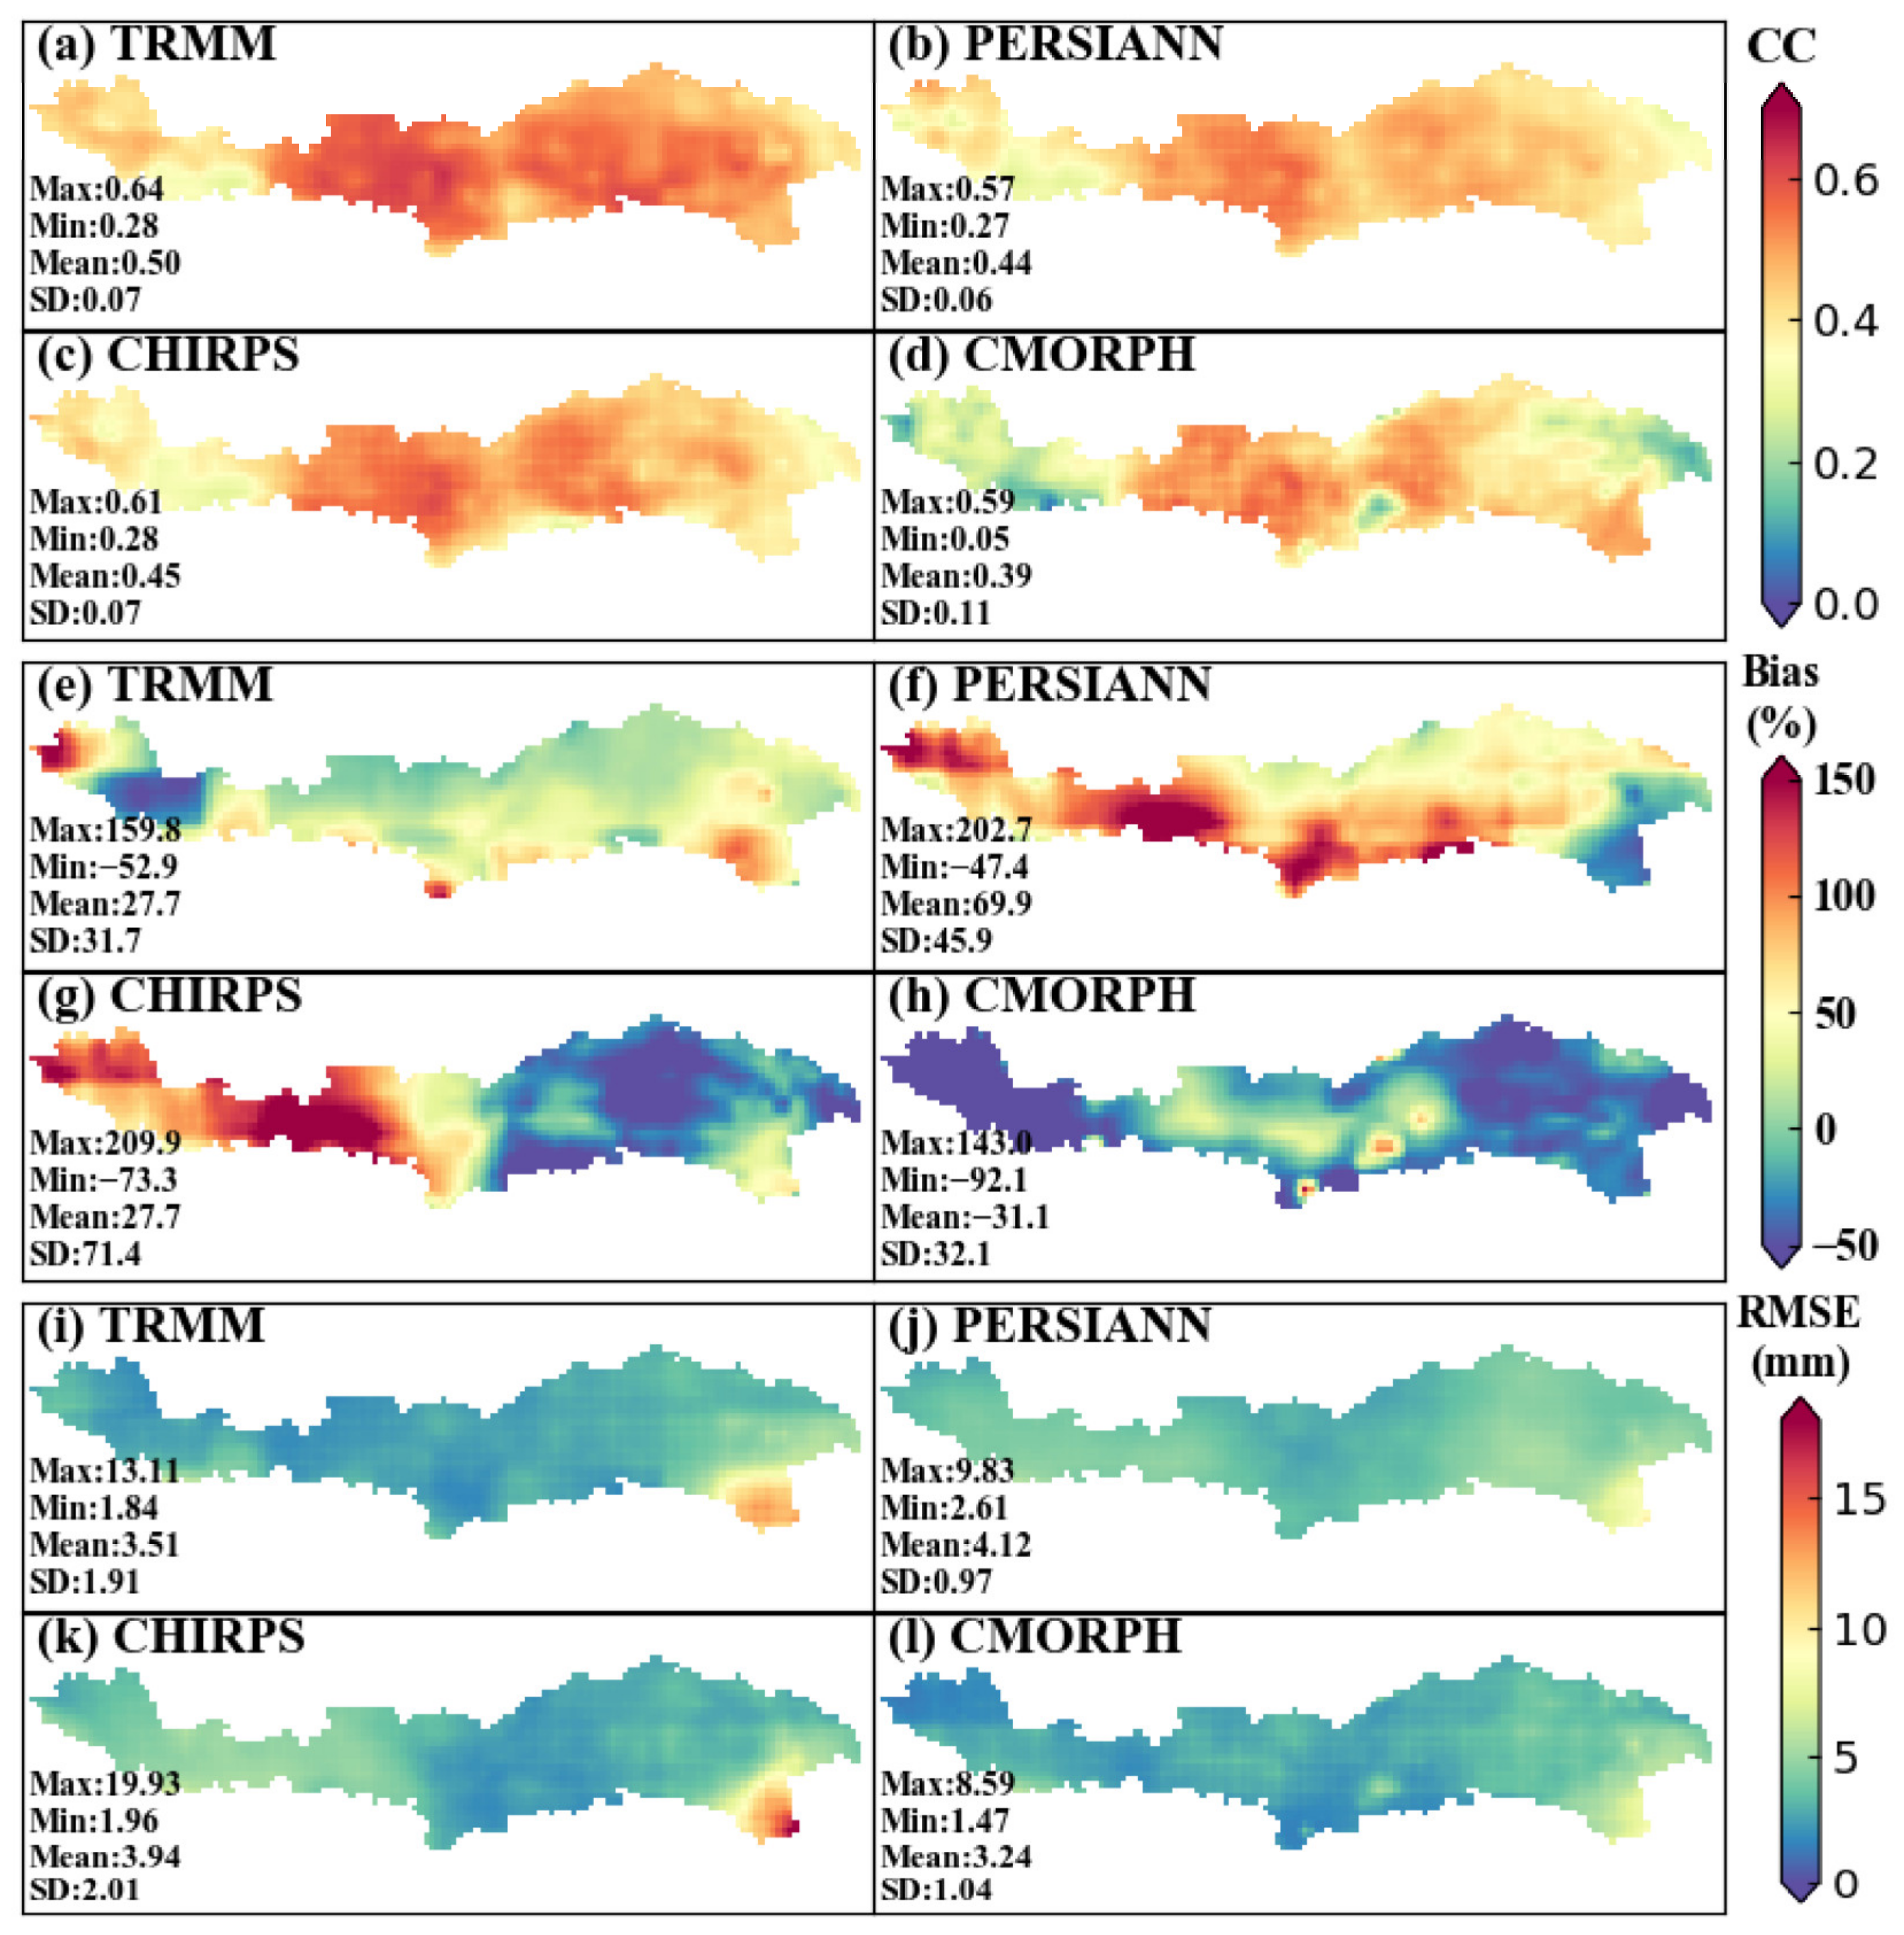
4.1.1. Spatial Distribution of the Evaluation Metrics at Monthly Scale

Figure 3 shows the spatial distribution of the evaluation metrics for the four precipitation products evaluated by CMFD at a monthly scale. In Figure 3a–d, the monthly precipitation of the four products has a similar correlation with the gauge interpolation data (CMFD). TRMM has the same mean CC value as CHIRPS (0.48), which is slightly higher than the other products. In Figure 3e–h, the mean bias of TRMM, PERSIANN and CHIRPS is 27.66%, 69.93%, and 27.74%, which shows a trend of overestimating precipitation. On the other hand, CMORPH shows a distinct negative deviation, with a mean bias value reaching −31.06%. It is worth mentioning that although the mean deviation of TRMM is close to CHIRPS, there is a substantial difference in the standard deviation between the two products; the bias distribution of TRMM is relatively uniform in the whole area while the bias of CHIRPS presents high positive values in the west region and high negative values in the east region. A distribution similar to that of the bias is reflected in Figure 4i–l. Except for the high value in the eastern region, the RMSE of TRMM in the other regions is significantly smaller than that of the other products.

4.1.2. Spatial Distribution of the Evaluation Metrics at Daily Scale

As shown in Figure 4, the four precipitation products were evaluated with CMFD at the daily scale. In Figure 4a–d, the four products show similar correlation coefficient distribution trends. For all grids combined, the median values of CC are 0.5, 0.44, 0.45, and 0.39, respectively. In comparison to the other products, TRMM has a higher correlation over middle and lower Yarlung Zangbo River, with a maximum CC value reaching 0.64. All products indicate weak correlations over the upstream basin (northwest region), with CC values ranging from 0.05 to 0.4. For all four products, the deviation distribution of the daily precipitation is consistent with the monthly precipitation (Figure 4e–h). In Figure 4i–l, the mean RMSE of the four products has no significant difference, ranging from 3.24 to 4.12. In addition, the high-value areas of RMSE are concentrated in the southeast region regardless of product. Generally, TRMM has the highest CC median value, the lowest bias median value, and the lowest RMSE median value among the four products, which shows great agreement with gauge monitoring data on the spatial distribution of daily precipitation.
The spatial distribution of daily precipitation detection ability of the four products is calculated with reference to CMFD at 0.1° × 0.1° resolution (Figure 5). As illustrated in Figure 5a–d, the mean POD value of TRMM and PERSIANN ranges from 0.79 to 0.86, which demonstrates higher detection accuracy than the remaining two products, the mean POD value of which is about 0.61. Moreover, the detection accuracy of all products in the central and eastern parts is significantly higher than in the western, and the FAR value in the middle eastern region is lower than in the western region (Figure 5e–h), which may be related to topographical and climatic features. Although TRMM and PERSIANN outperform CHIRPS and CMORPH in precipitation detection ability, they have higher false alarm rates than other products, especially in the eastern region where the maximum FAR value reaches 0.55. Overall, TRMM and PERSIANN show stronger precipitation detection capabilities (mean CSI ranges from 0.63 to 0.65) than CHIRPS and CMORPH (mean CSI ranges from 0.51 to 0.53), and the critical success index for all four products increases from west to east, with similar patterns. In addition, CMORPH has the highest amplitude of CSI variation, which reflects a poor ability to capture the spatial distribution of precipitation in the whole region (Figure 5i–l).

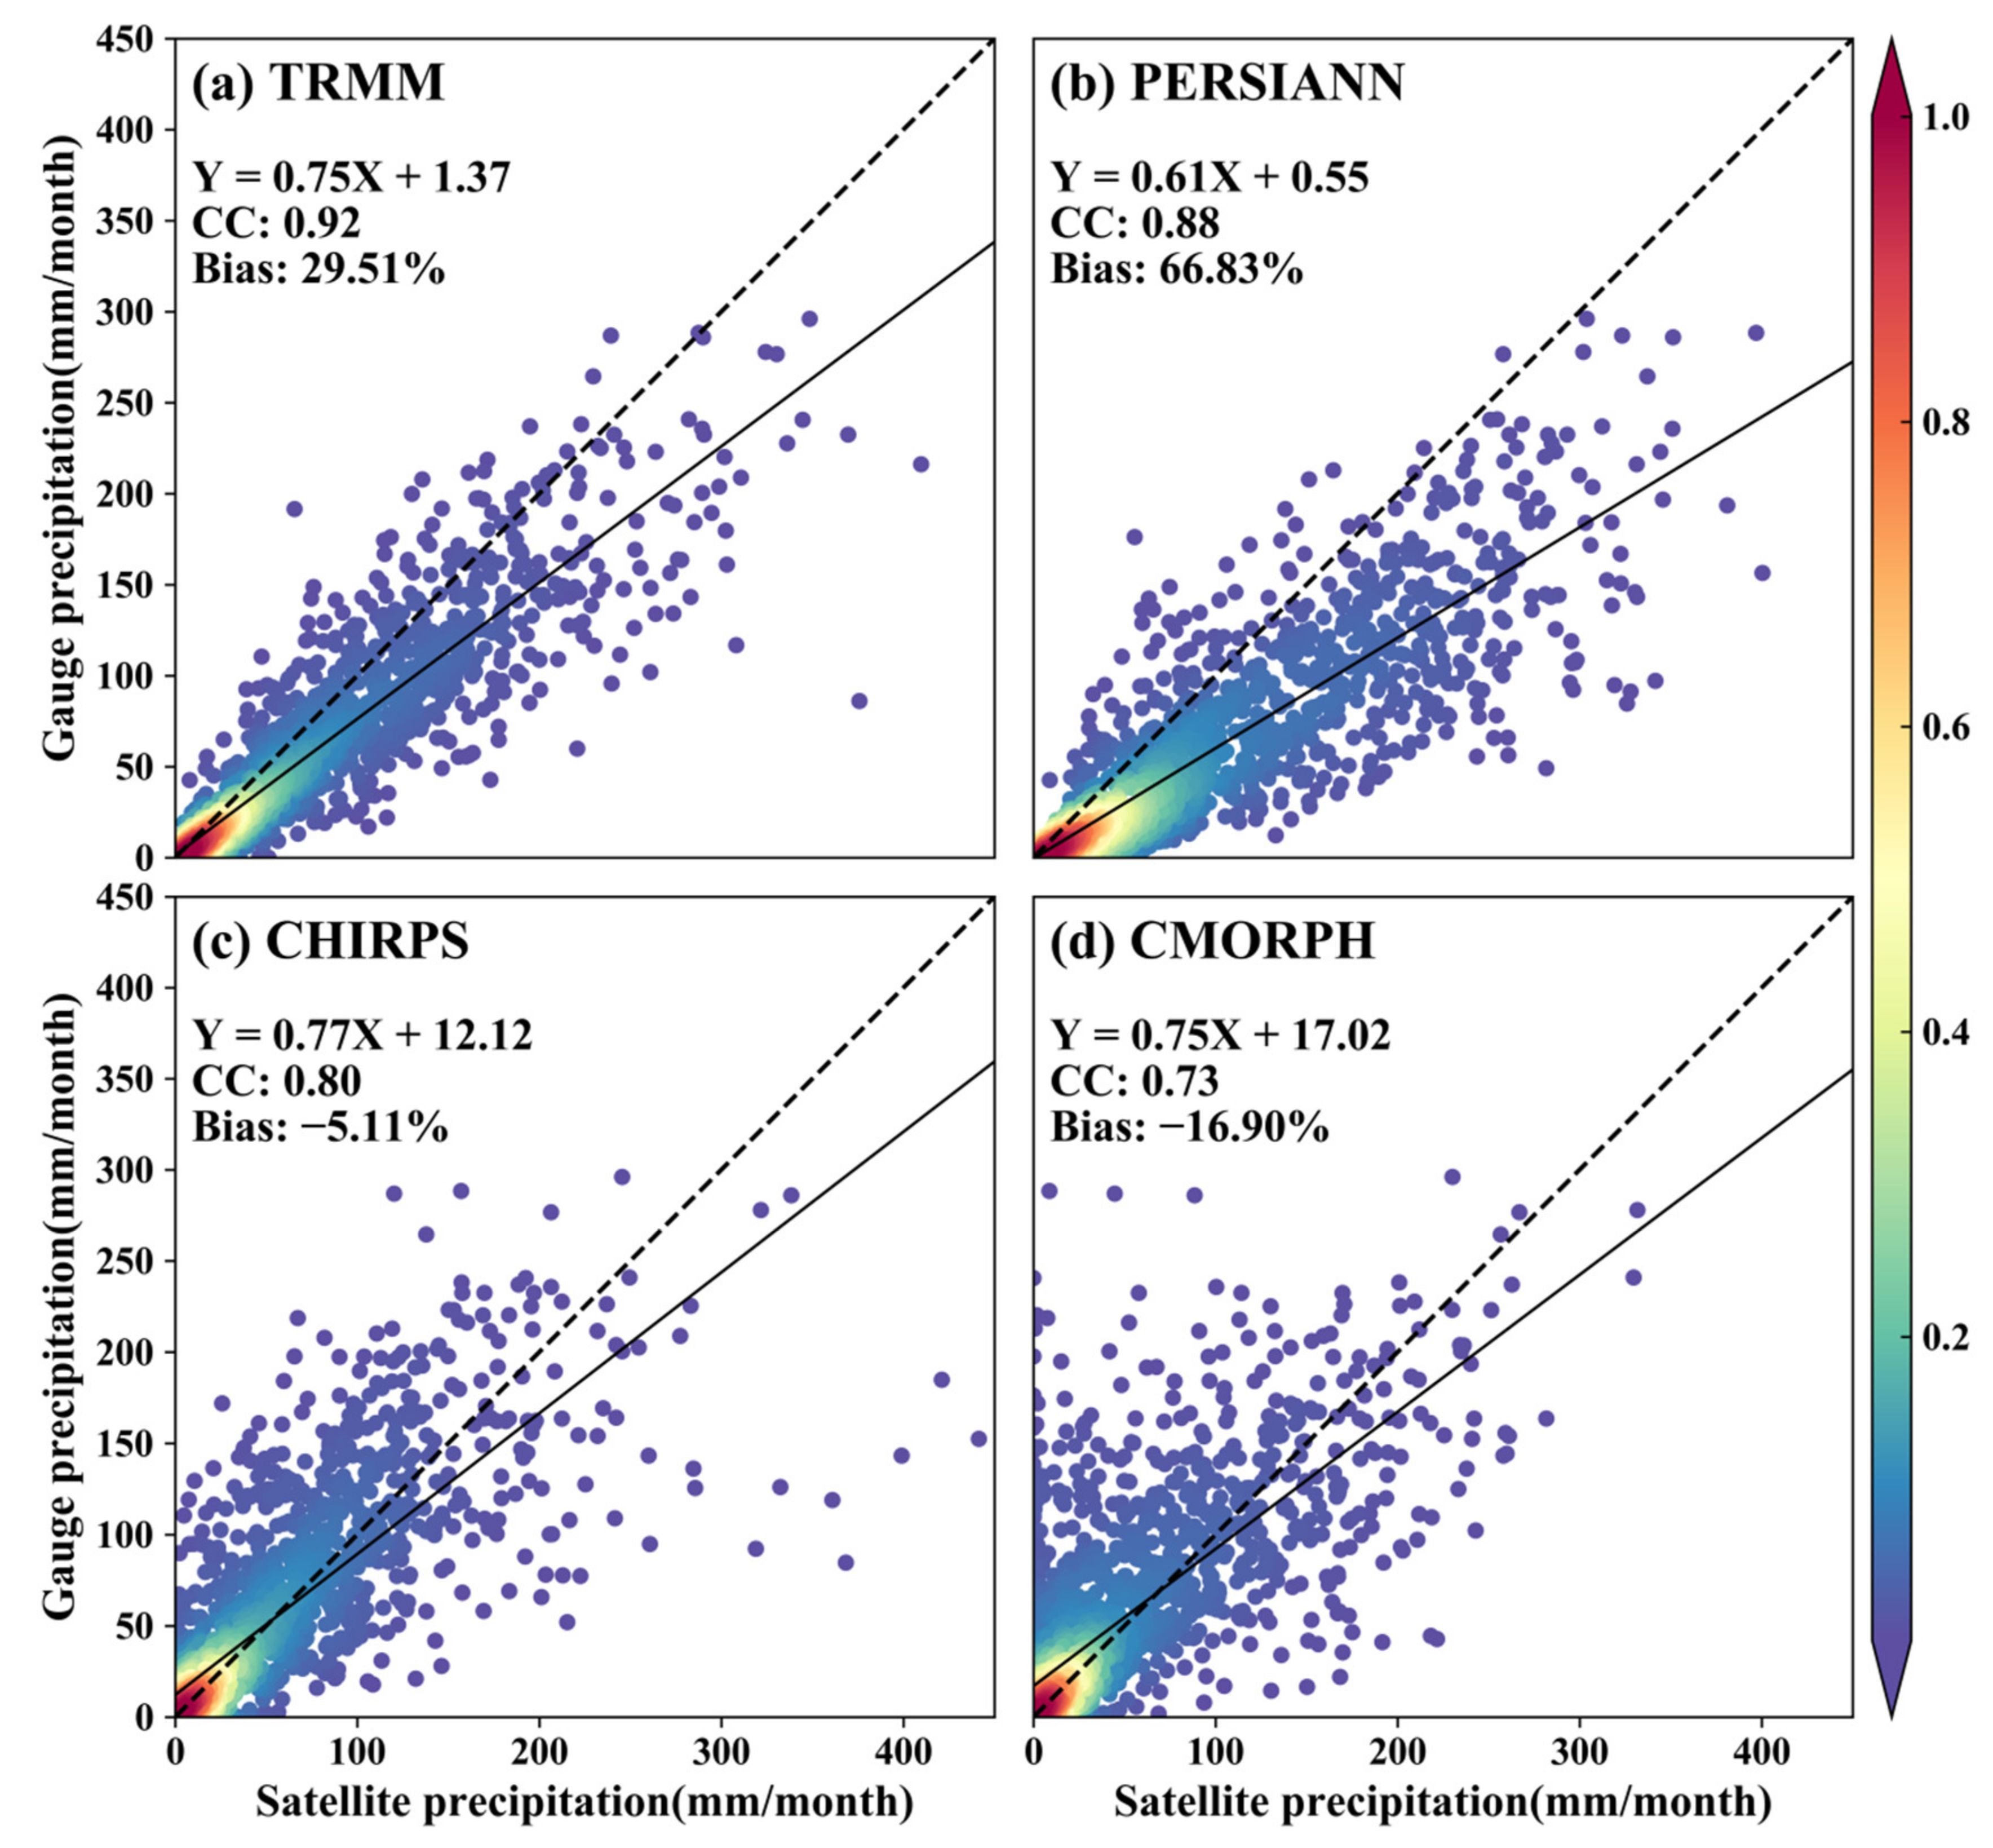
4.2. Grid-Point Comparison

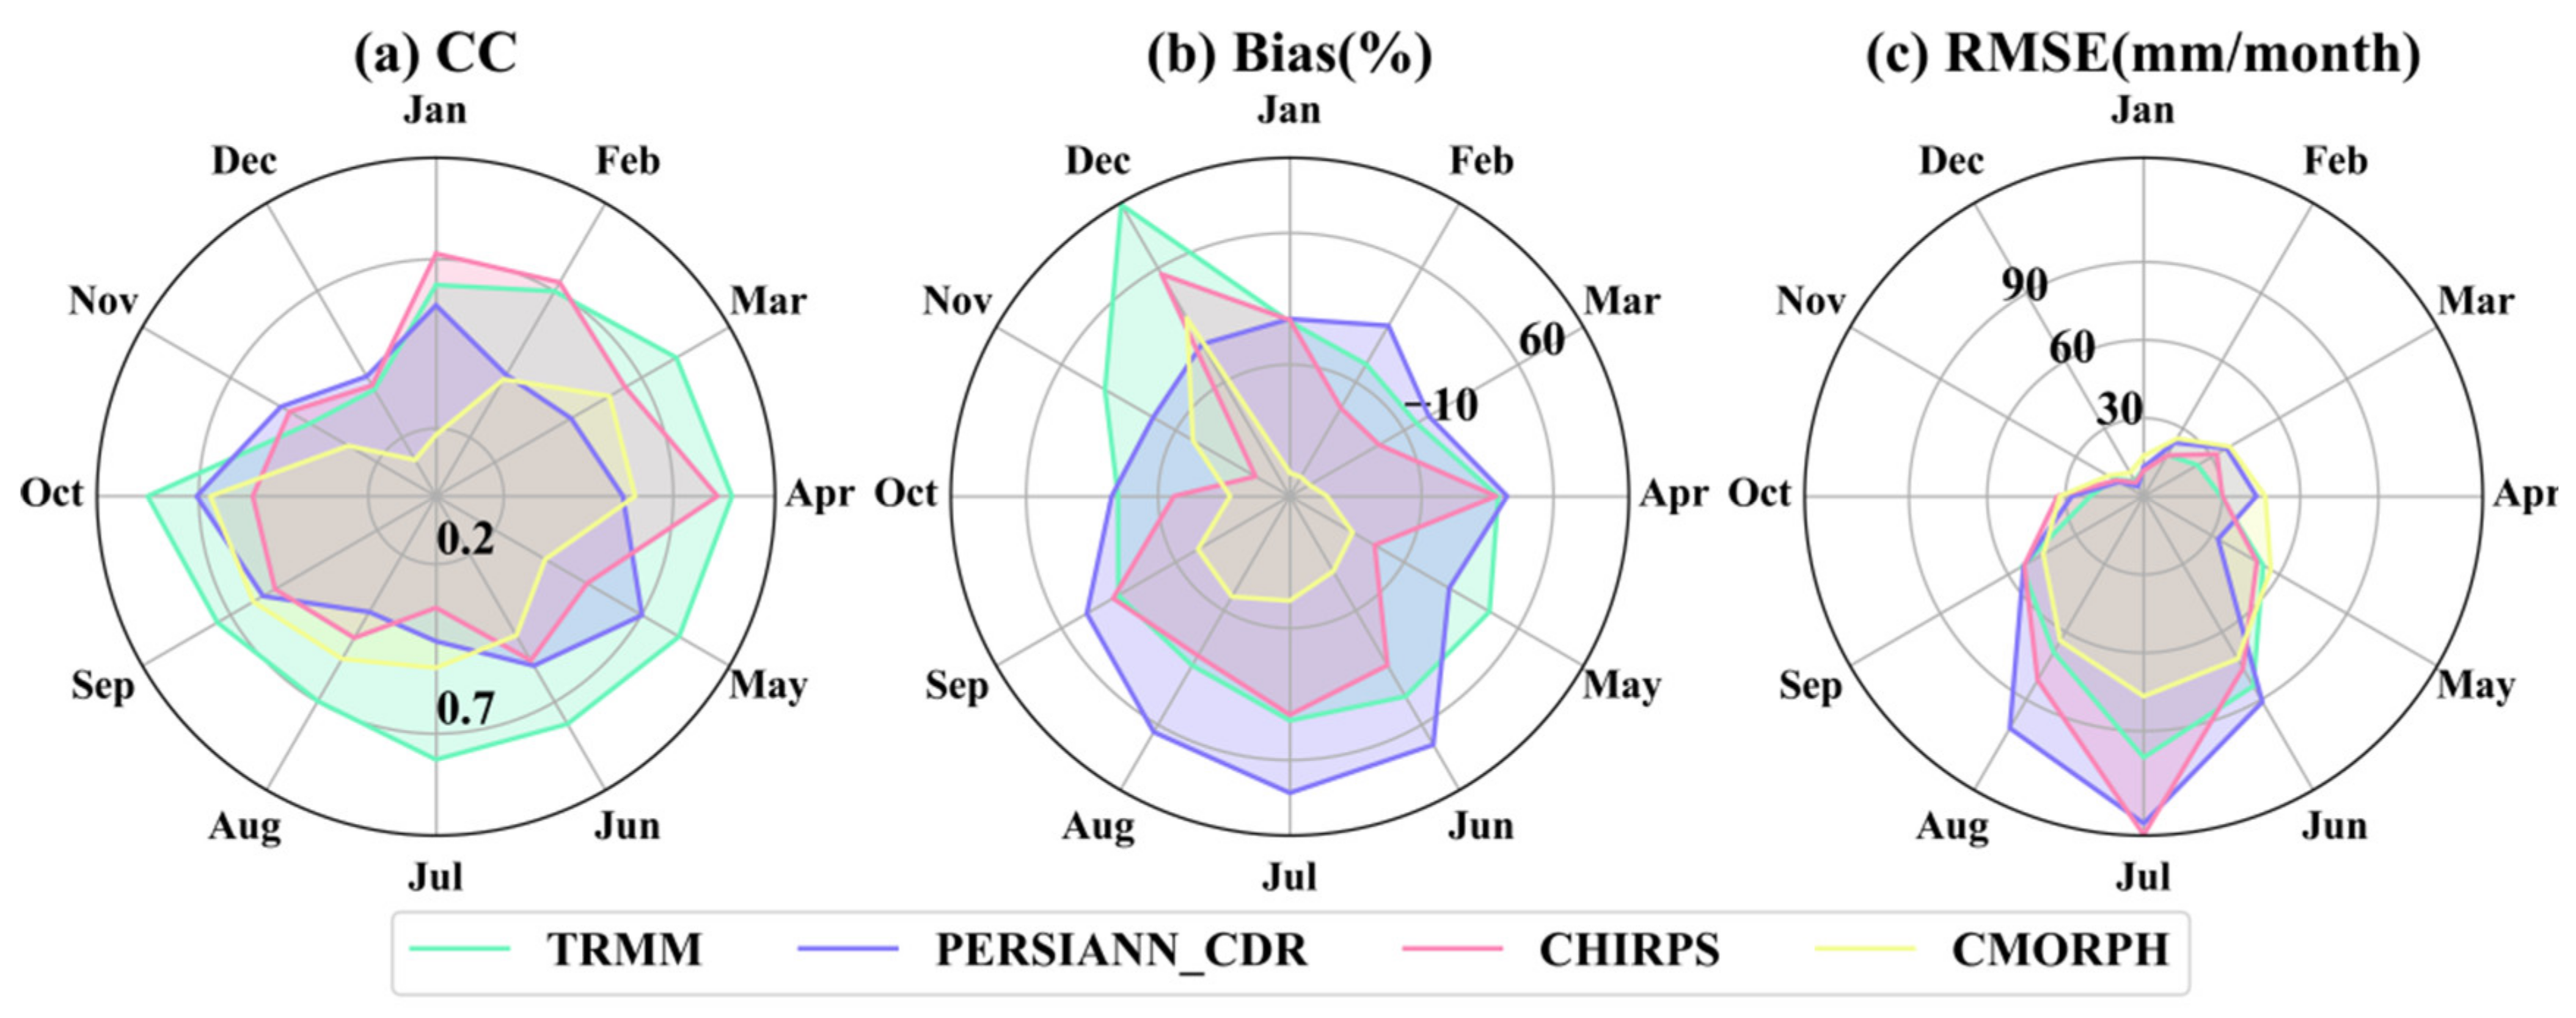
4.2.1. Evaluation Metric Variation at Monthly Scale

Scatter density plots of monthly precipitation series from rain gauges and corresponding product grids are presented in Figure 6. As shown in the figure, the monthly precipitation of all products has a relatively high correlation with gauge monitoring, with CC values ranging from 0.73 to 0.92. TRMM exhibits better performance in the precision of precipitation estimates, compared with other products. It is worth noting that all products tend to overestimate monthly precipitation based on the trend line slope, however, the Aggregate Bias for CHIRPS and CMORPH is negative at all gauge stations. This phenomenon demonstrates that CHIRPS and CMORPH underestimate precipitation in certain months, with CMORPH being the most noticeable at an aggregate bias value of −16.90%.
The radar maps of each month’s precipitation metrics for all gauges and the corresponding product grids are presented in Figure 7. As shown in Figure 7a, the overall performance of TRMM is superior to other products, and the CC value remains consistent at roughly 0.8 from March to October. However, from November to next February, all products perform poorly, with CC ranging from 0.4 to 0.6. The high bias of TRMM and CHIRPS is concentrated in November and December, while that of PERSIANN is focused in June and July (Figure 7b). In addition, CMORPH always displays a negative bias value, except in December. The distribution of the RMSE indicates that all products have the highest deviation from gauge monitoring in July, followed by June and August (Figure 7c).

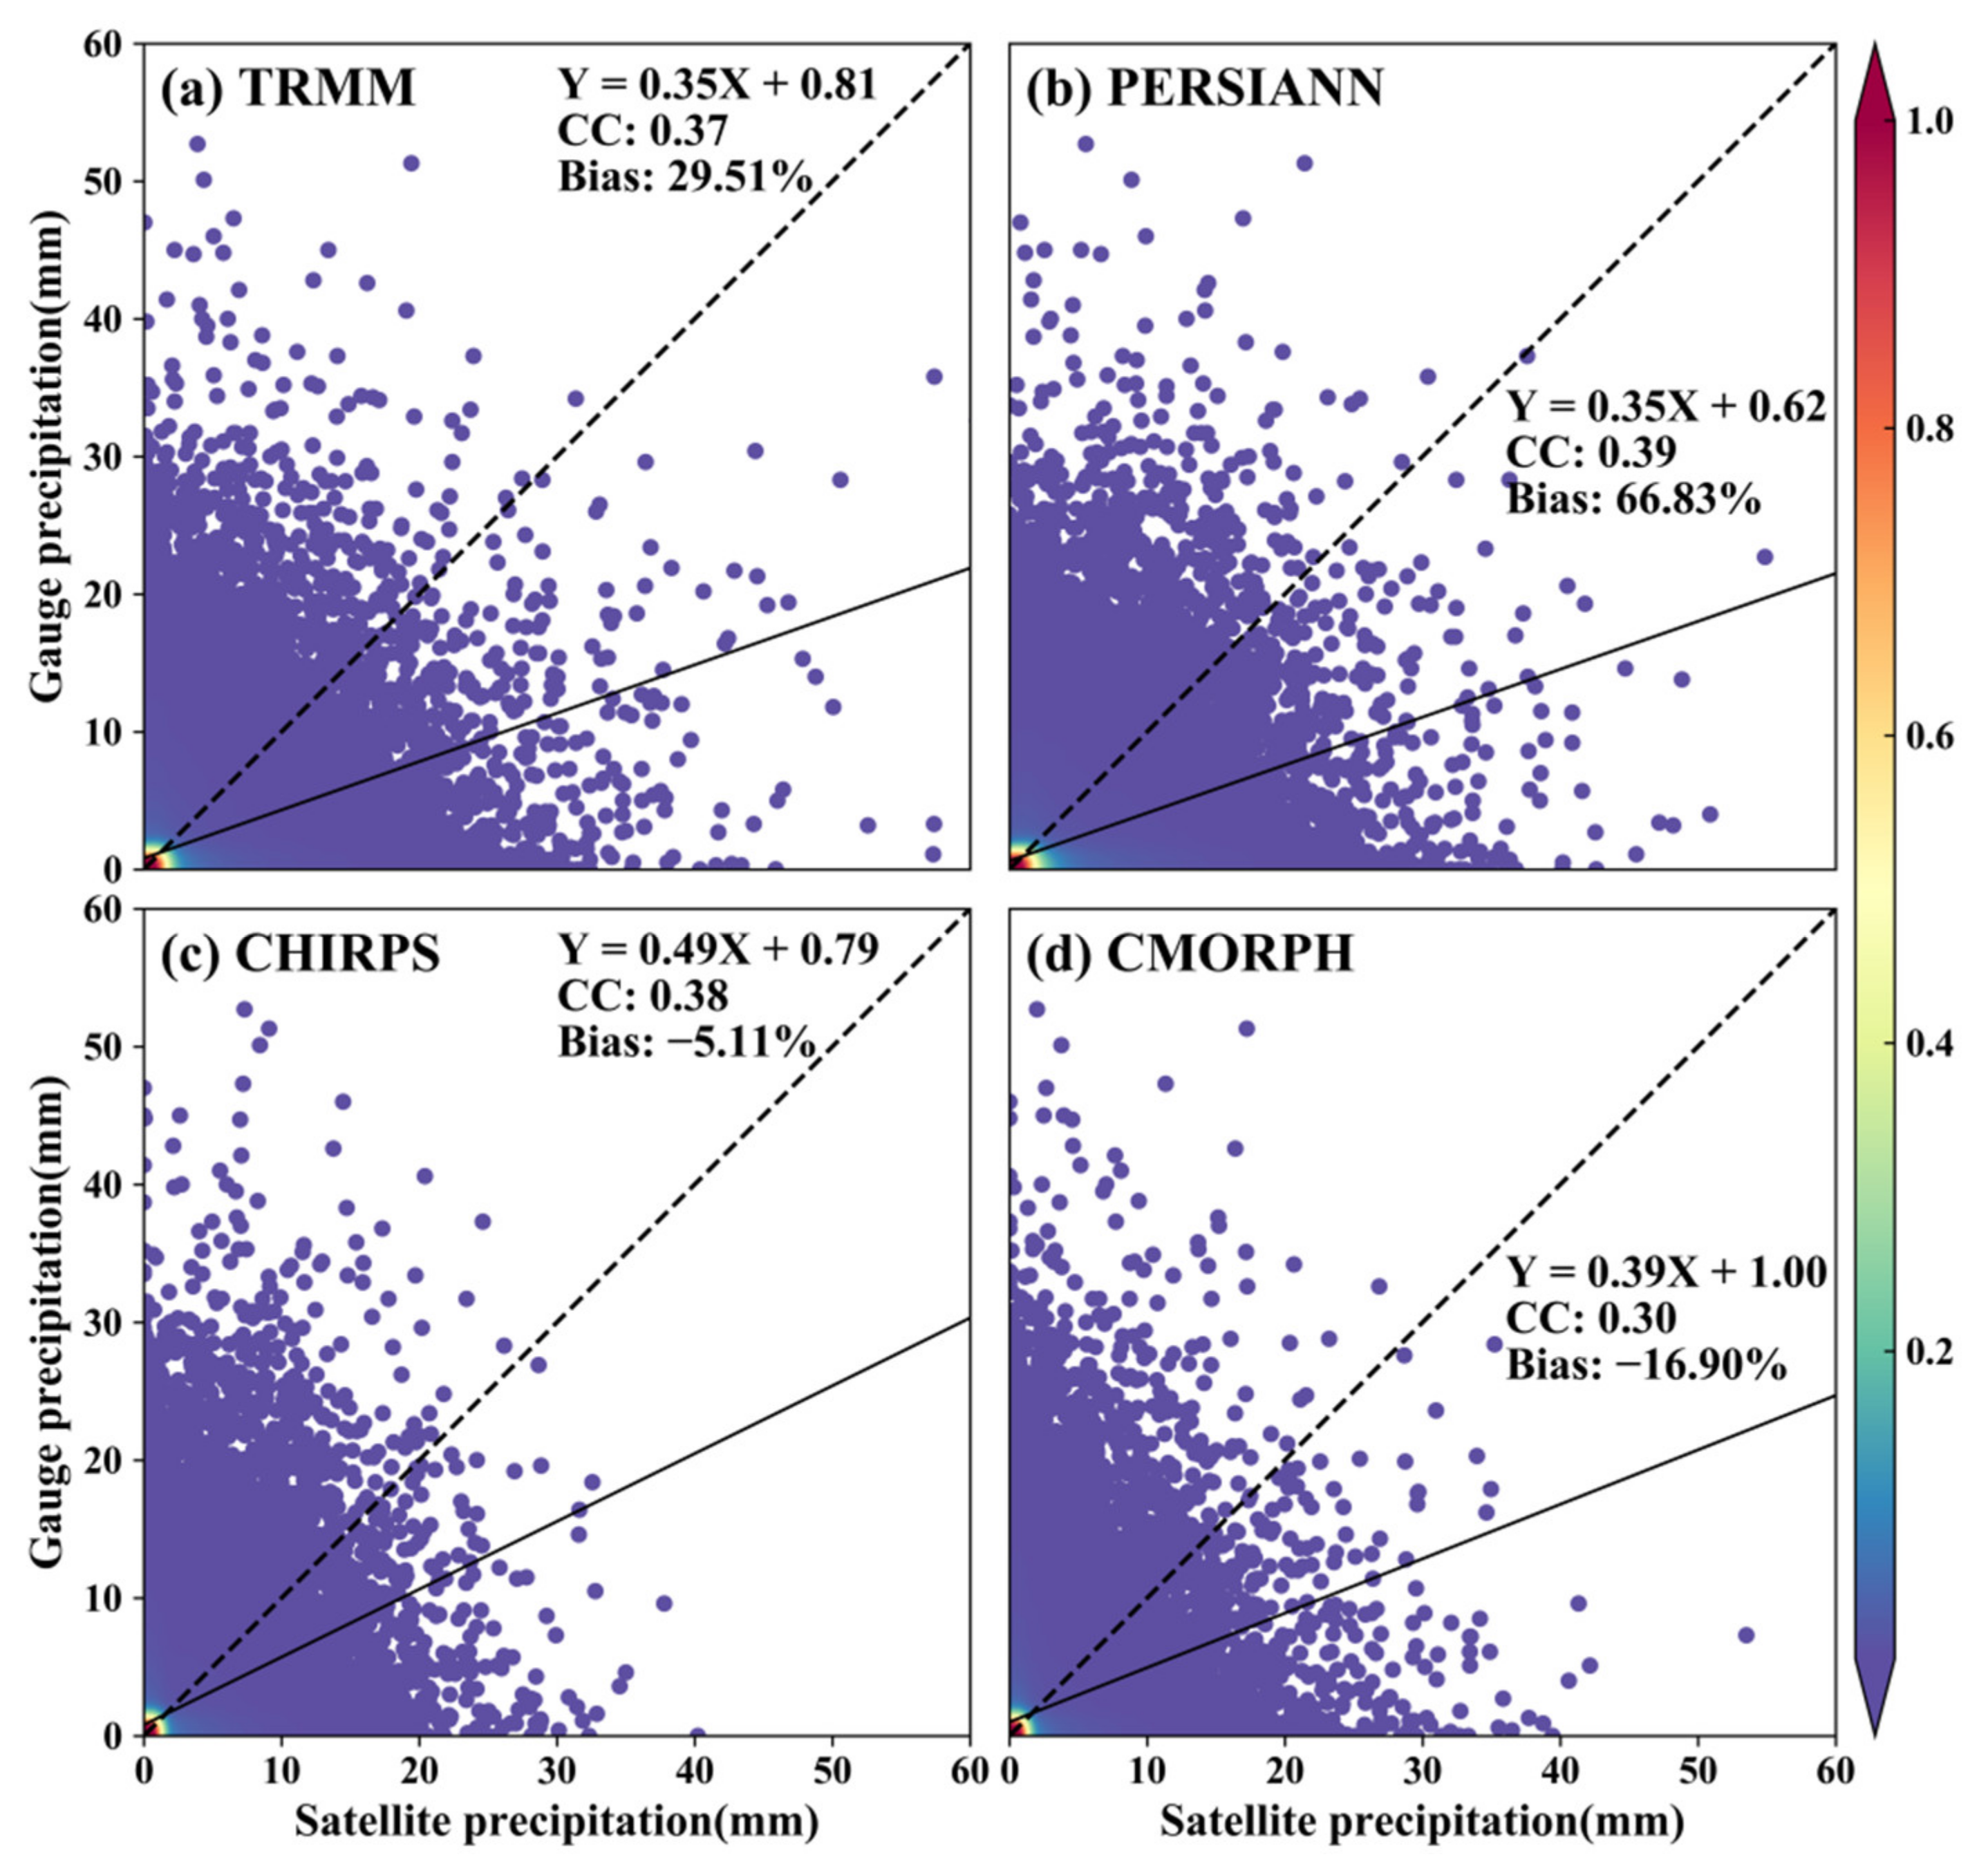
4.2.2. Evaluation Metric Variation at Daily Scale

Scatter density plots of daily precipitation series during from rain gauges and the corresponding product grids are presented in Figure 8. Generally, there is no substantial difference in the degree of correlation between the four products and gauges (CC ranges from 0.30 to 0.39), and all products indicate an apparent trend of underestimating daily precipitation. TRMM and PERSIANN overestimate the precipitation during certain periods of low actual precipitation; thus, both products have a positive bias value (29.51% and 66.83%, respectively). Overall, the four products have both a weak correlation and a large deviation from the measured daily precipitation series.

4.3. Evaluation under Different Climatic and Topographical Conditions

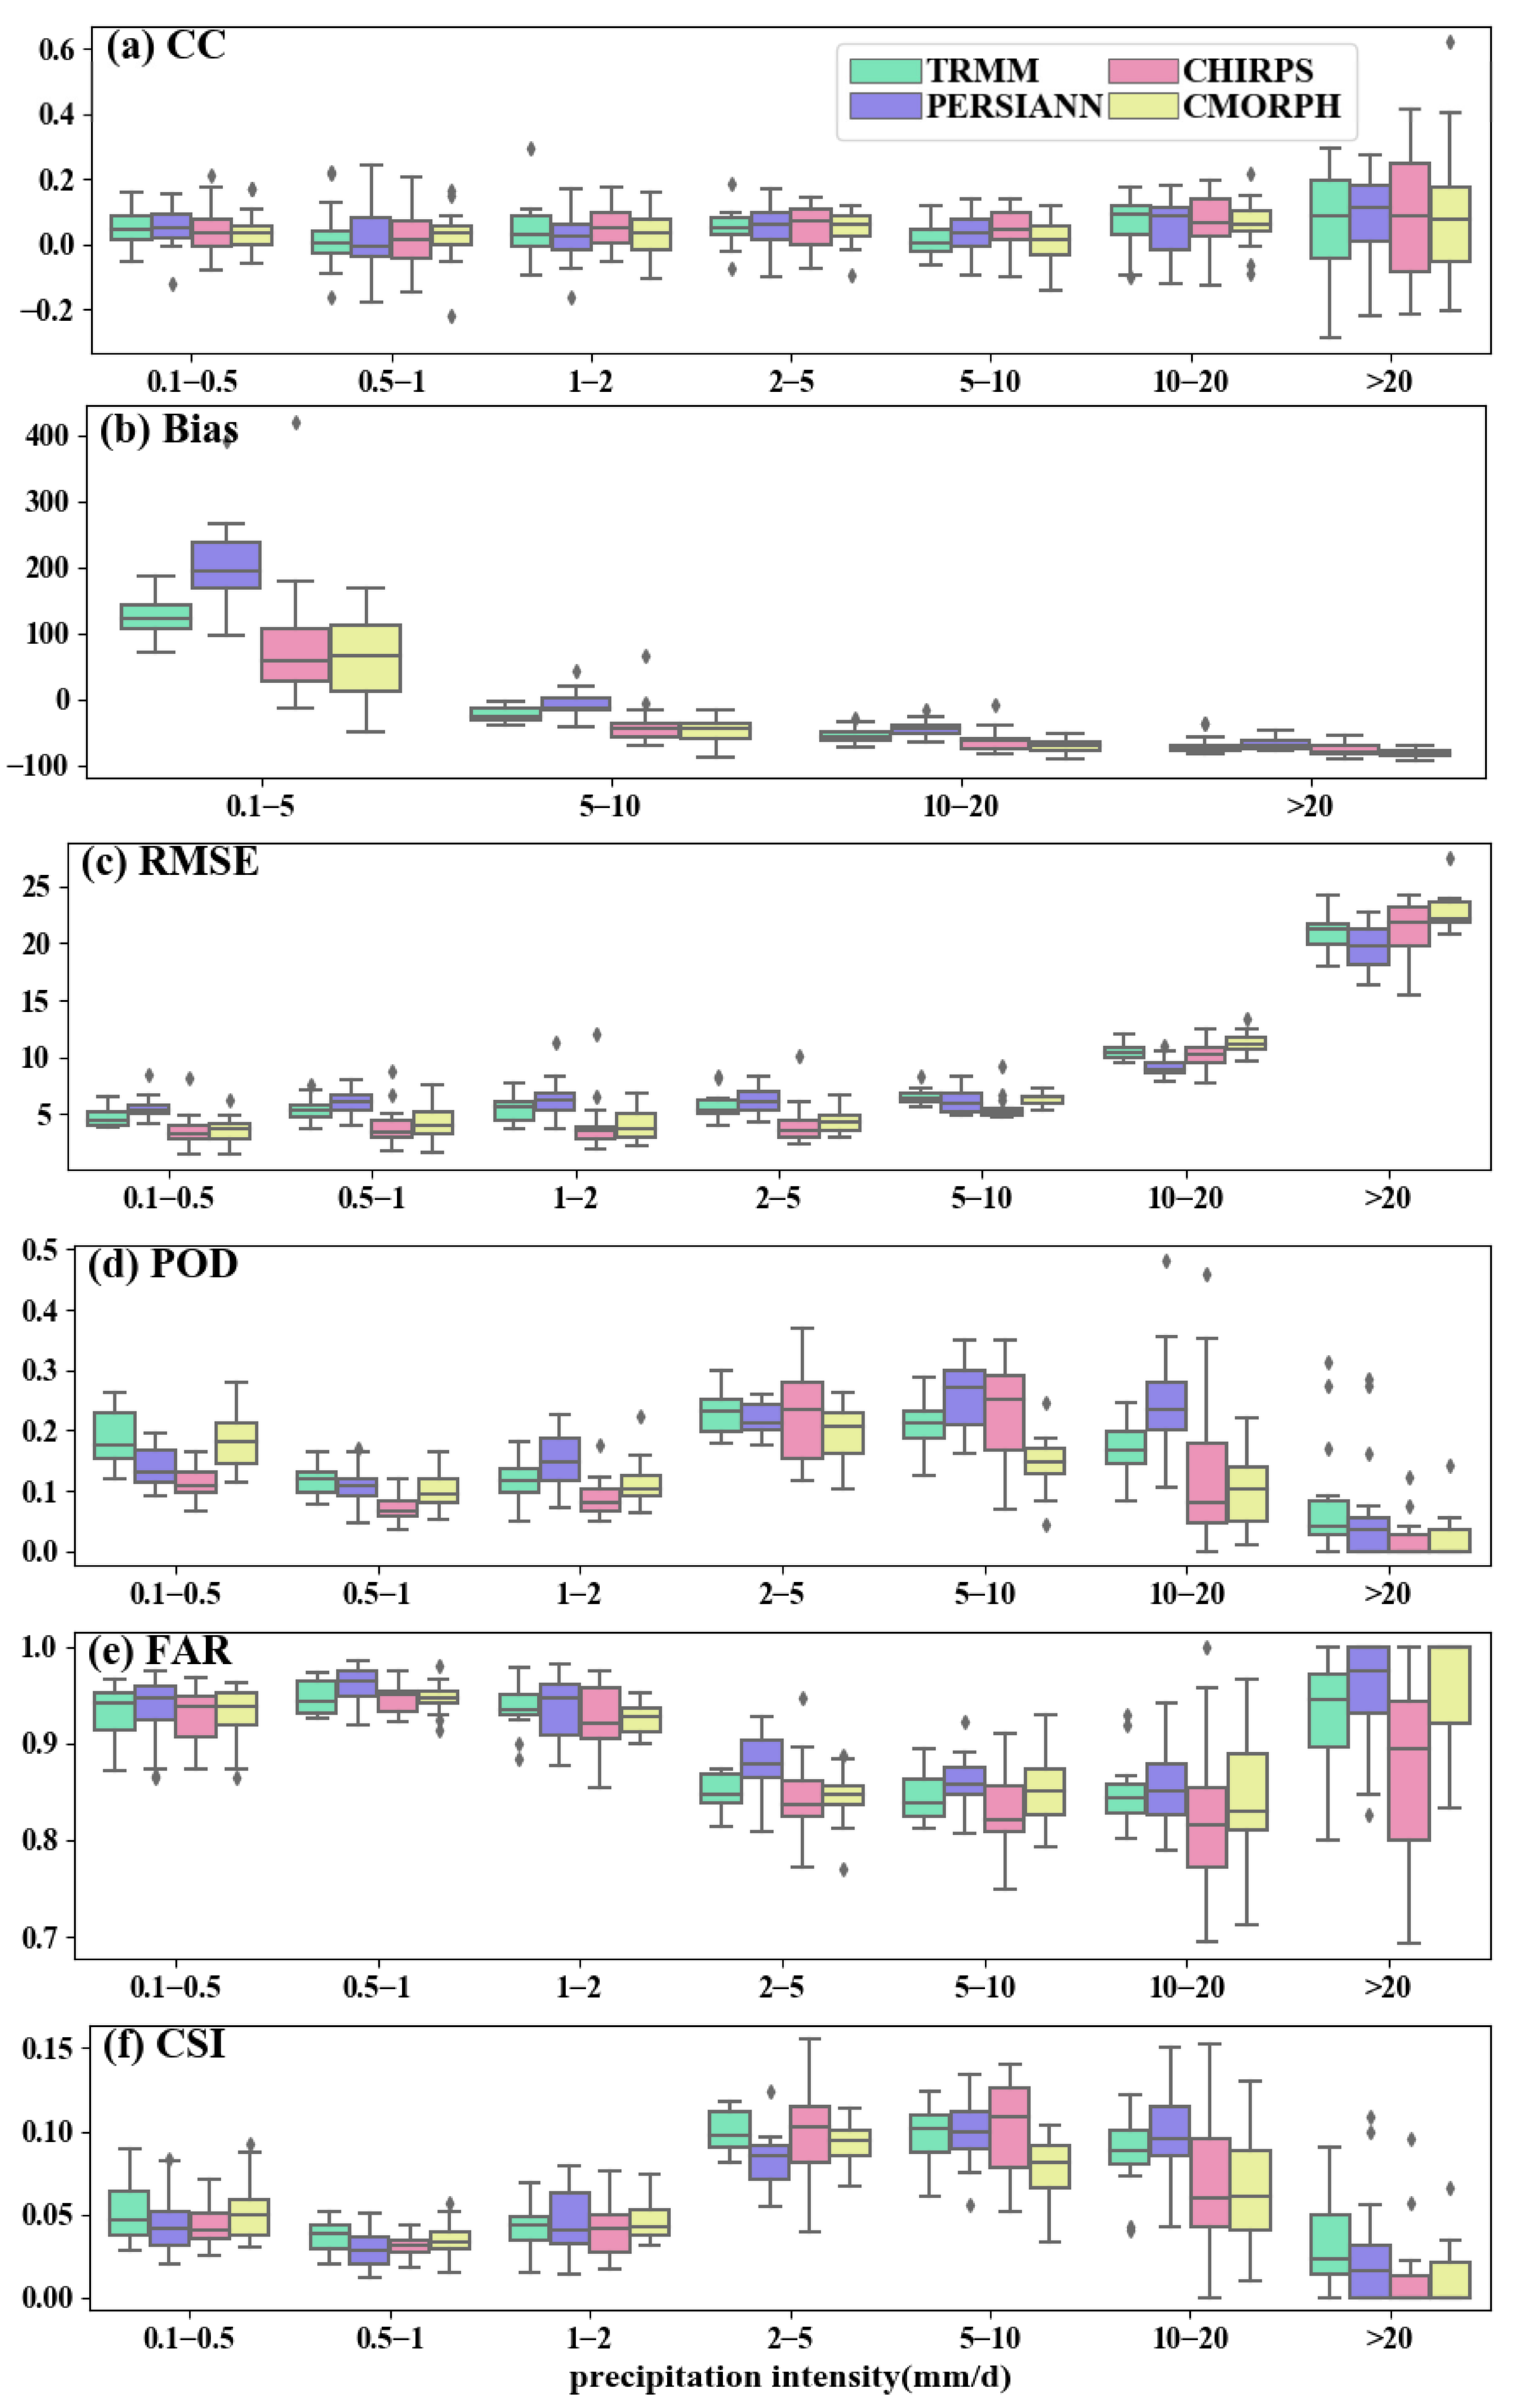
4.3.1. Evaluation Metrics at Different Precipitation Intensity

In order to refine and distinguish the metrics of daily precipitation, we set different precipitation intensity levels and plotted the boxplots of the associated metrics (Figure 9). Figure 9a shows that the CC values of the four products remain stable with an increase in the threshold, while the CC values fluctuate greatly only when the precipitation reaches more than 20 mm/d. Accordingly, the RMSE values show a significant growth trend with the increase of the threshold (Figure 9c). Figure 9b shows that all four products generally overestimate precipitation by 0.1–5 mm/d and underestimate precipitation greater than 5 mm/d, especially PERSIANN. As shown in Figure 9d, the POD of the four products tends to be slightly higher than otherwise when the precipitation threshold is 2–10 mm/d. Moreover, compared with the other products, TRMM and PERSIANN have better performance in precipitation detection accuracy, especially with a precipitation threshold of 10–20 mm/d. In all intervals, the four products have the worst ability to capture precipitation greater than 20 mm/d with a median POD in the 0 to 0.1 range. Correspondingly, the false alarm rate is the highest when precipitation is greater than 20 mm/d (Figure 9e). The high false alarm rate and low detection accuracy result in generally low CIS values in all intervals, which is shown in Figure 9f. These results show that the estimation and detection accuracy of satellite precipitation products for different intensities of precipitation is generally low, and PERSIANN significantly underestimates weak precipitation events (<5 mm/d), which is consistent with previous research results [23,47].

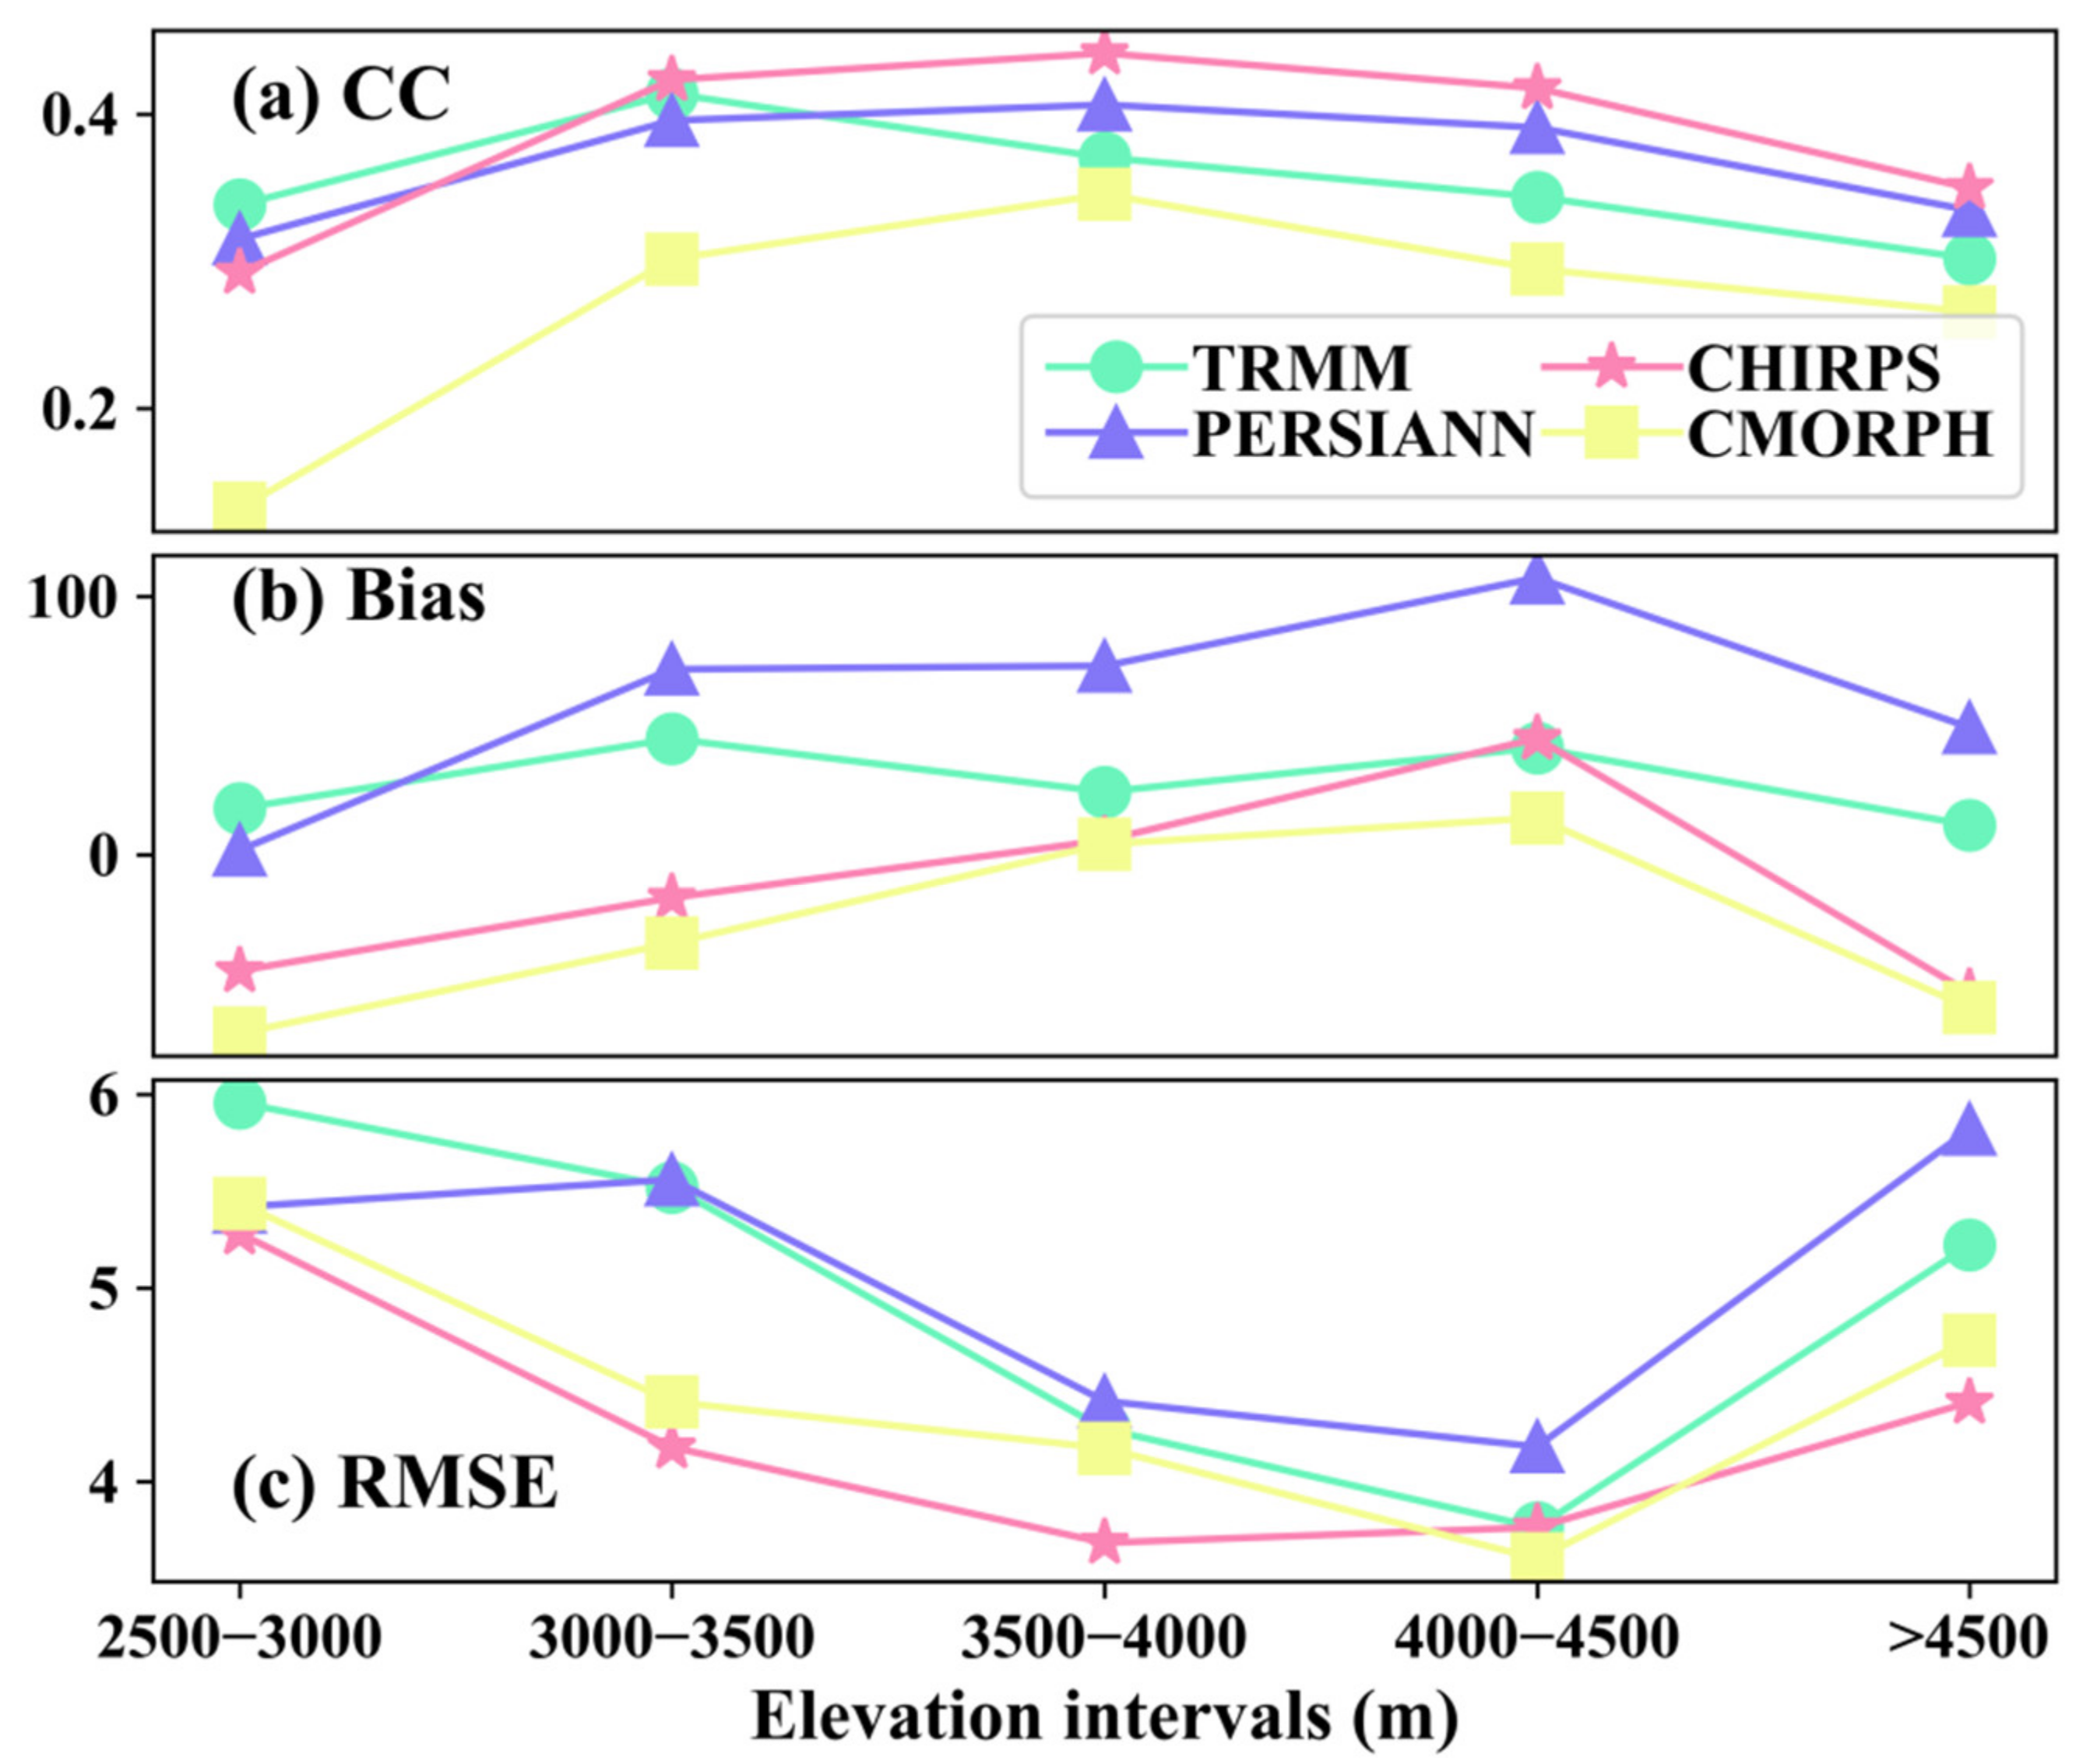
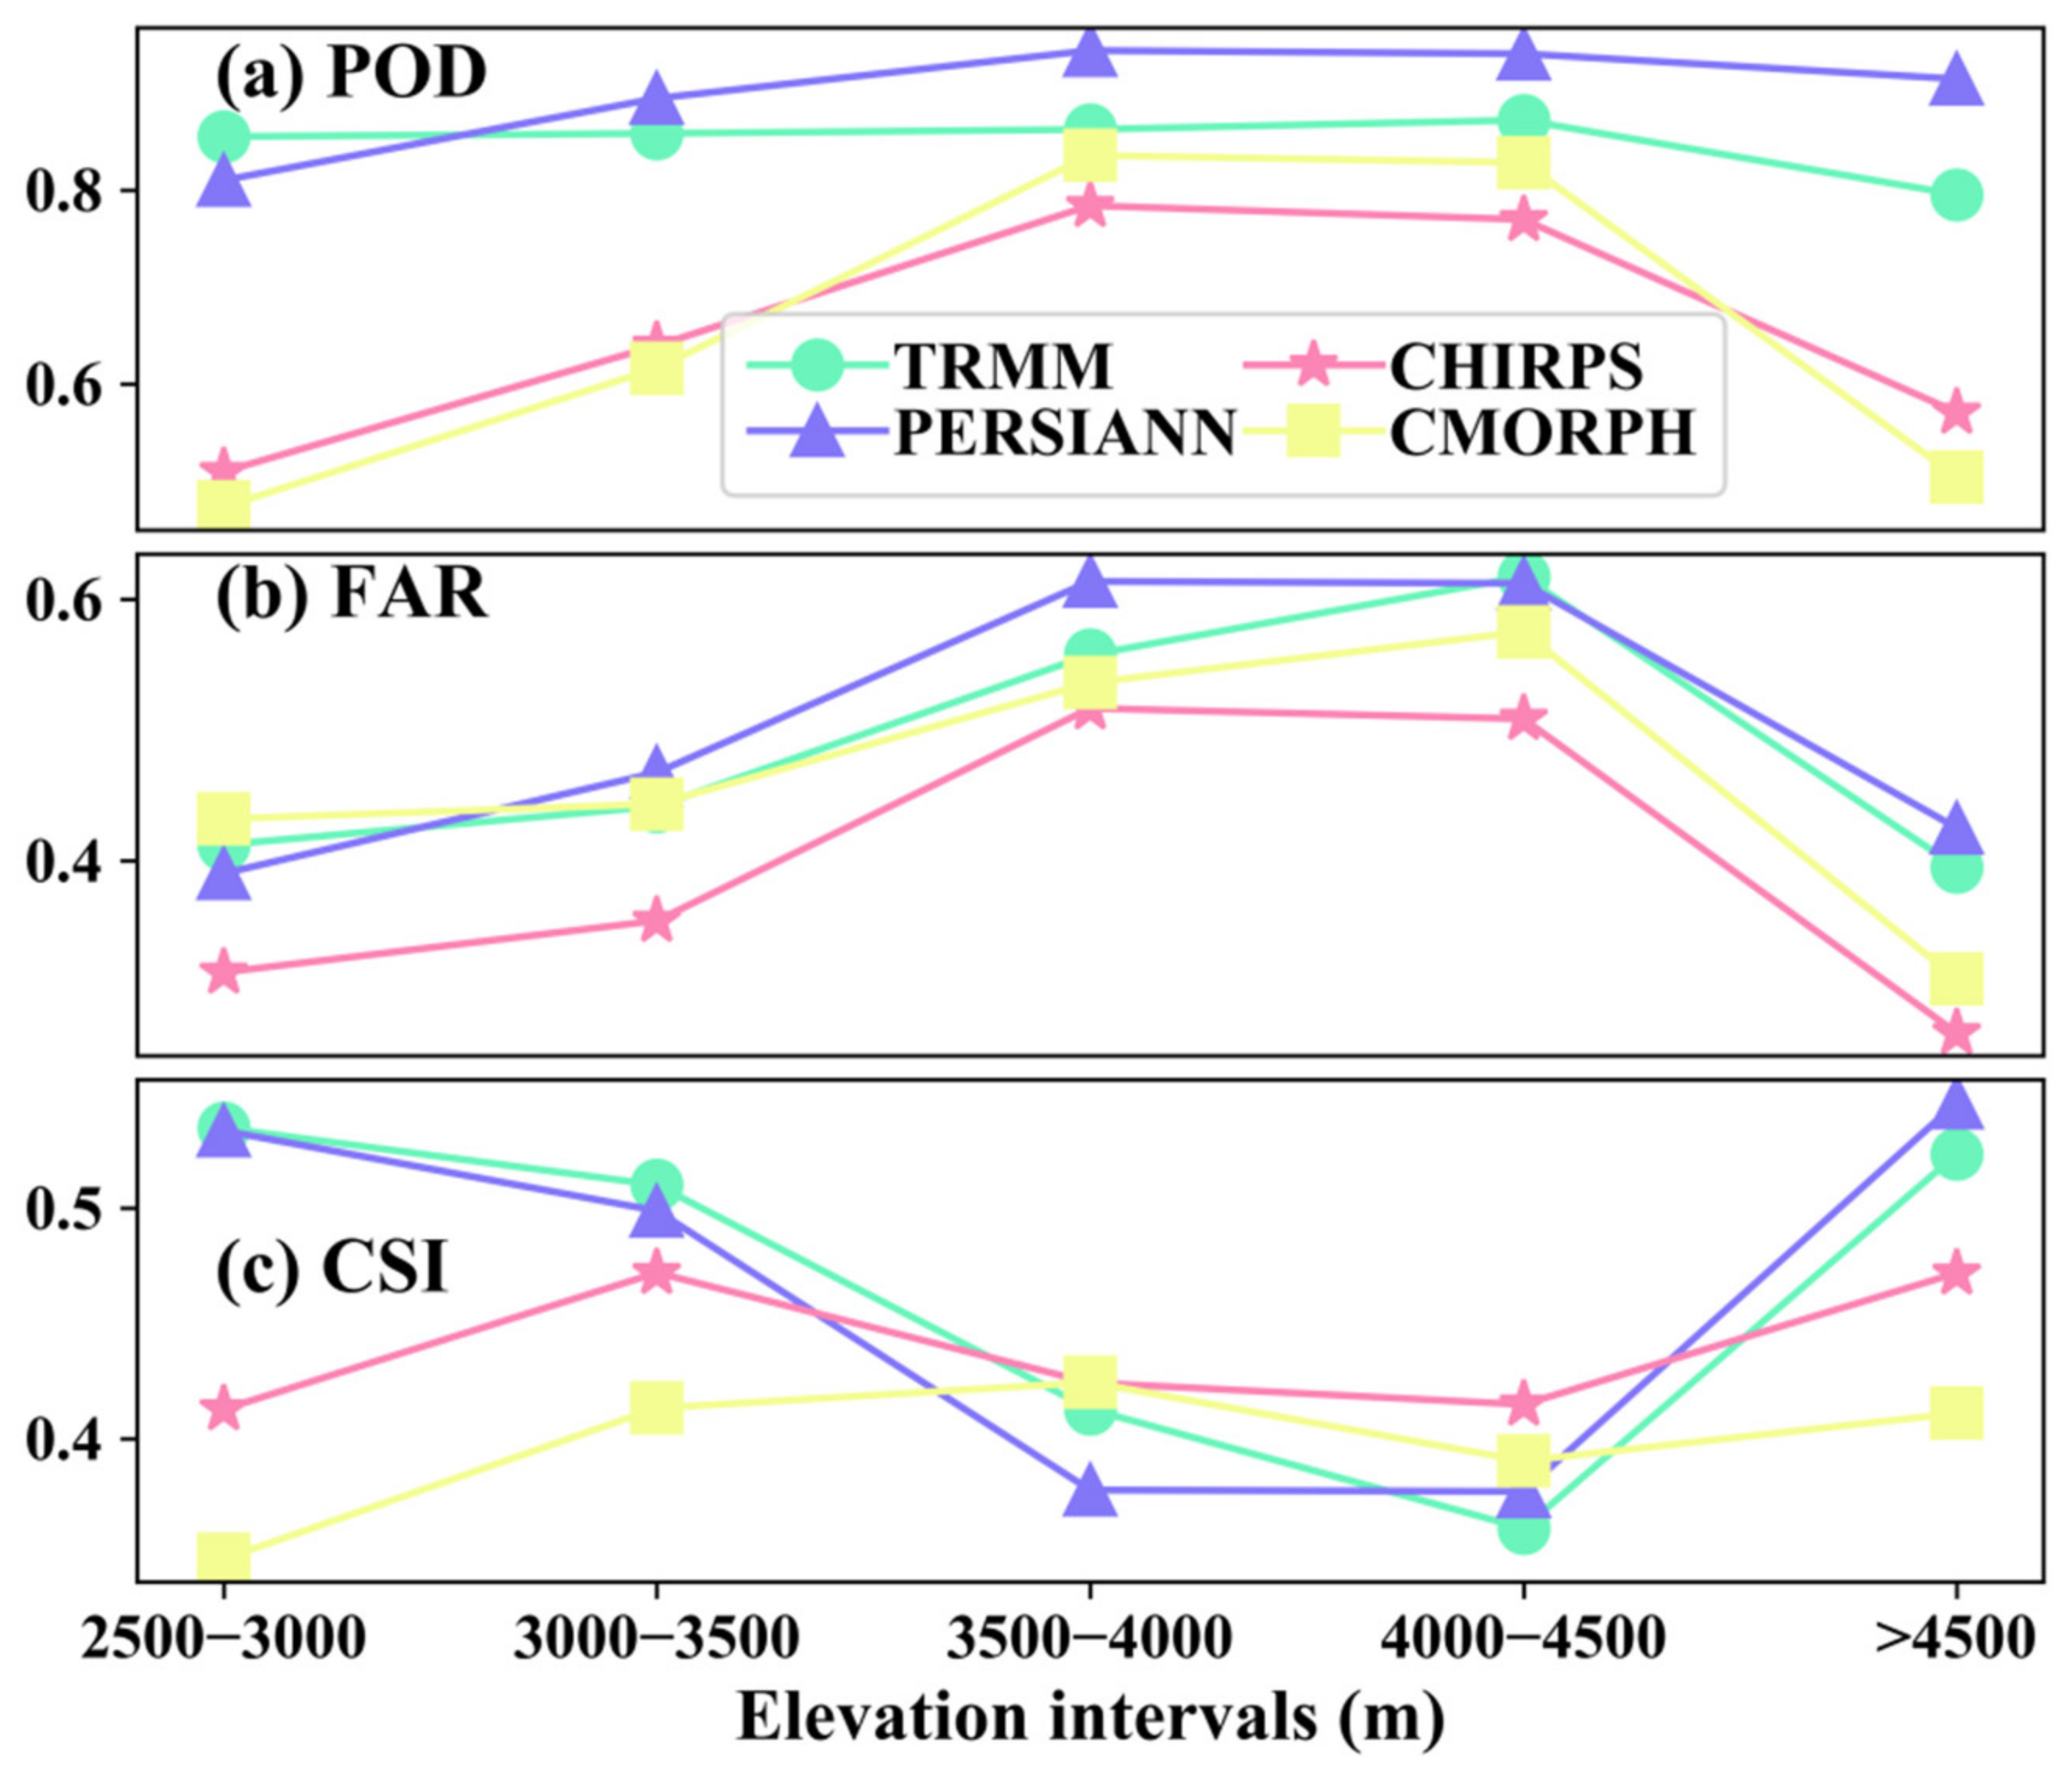
4.3.2. Evaluation Metrics at Different Elevation Intervals

Figure 10 and Figure 11 show the variation of statistical metrics and categorical metrics for the four products with different elevations. As shown in Figure 10a–c, all products generally present similar trends as the elevation increases. The CC values of PERSIANN, CHIRPS, and CMORPH increase gradually when the elevation ranges from 2500 to 4000 m, then decrease as the elevation rises (Figure 10a). In addition, the CC values of TRMM increase to a maximum only between 2500–3500 m. In Figure 10b, PERSIANN shows a positive deviation in all ranges of elevation (bias between 5% and 110%), while CHIRPS and CMORPH show a negative deviation in the interval between 2500–4000 m as well as 4500 m above. In addition, TRMM shows the lowest deviation in all intervals among the four products. As shown in Figure 10c, RMSE values for all products are lowest in the 3500–4500 m interval and increase rapidly when the elevation is above 4500 m.
As illustrated in Figure 11a, the POD values of TRMM and PERSIANN keep in a stable range above 0.8 and have no significant variation with elevation. On the contrary, the POD values of CHIRPS and CMORPH show a trend of first increasing and then decreasing, which reaches a maximum when the elevation ranges from 3500–4500 m. However, the FAR values of the four products reach a maximum in the interval between 3500–4500 m, the same as the high-value region for POD (Figure 11b). When the elevation is greater than 4500 m, both the POD and FAR values decrease rapidly, which may be related to the low weight and short duration of precipitation at high altitudes. In general, TRMM and PERSIANN exhibit distinctly better precipitation detection ability than the other products, especially for elevations ranging from 2500–3500 m. Nevertheless, all products show low accuracy in precipitation detection at elevations between 3500–4000 m (i.e., CSI ranges from 3.5–4.5).

4.3.3. Evaluation Metric at Different Climate Zones

According to Köppen’s climate classification, we selected 16 gauges and corresponding product grids from four climatic zones in the study area and drew the radar map with statistical and categorical metrics (CC, Bias, RMSE, POD, FAR, CSI). The mean metrics of the four products are shown for each climate zone in Figure 12. Across all climatic zones, the CC values of the four products range between 0.2 to 0.5, among which the value of CHIRPS is slightly higher than the others (Figure 12a). There are obvious swings and variances in bias values among the five climate zones, as illustrated in Figure 12b. PERSIANN’s bias values are mostly positive, and are especially high in the Bsk and BWk zones. The bias values of CHIRPS and CMORPH, on the other hand, are generally negative, except in the Bsk zone, and the deviation is greatest in the Cwb and Dwc zones. Furthermore, the RMSE values of all zones are nearly identical, except for the Cwb zone, which has slightly higher values (Figure 12c). In general, the climate has a significant impact on the products’ precipitation estimating capabilities, and all products tend to overestimate precipitation in the Bsk zone in particular. In the Cwb and Dwc regions, the underestimation of precipitation by CMORPH and CHIRPS is particularly noticeable. In contrast, the TRMM product has a more consistent estimate of precipitation.
As shown in Figure 12d, CHIRPS, TRMM, and PERSIANN had higher precipitation accuracy over the Bsk, BWk, Dwb, and Cwb zones, with values ranging from 0.4 to 0.6. However, as seen in Figure 12e, false alarm rates are higher in the Dry (Bsk and BWk) and Continental (Dwb) zones. As a result, the Cwb zone has the highest CSI values compared to other zones, particularly for the TRMM and PERSIANN products (Figure 12f). In general, TRMM and PERSIANN CDR are better at detecting precipitation than CMORPH and CHIRPS, especially in the Temperate (Cwb) zone, although the Dry and Continental zones have a significant impact on the detection accuracy of these products.

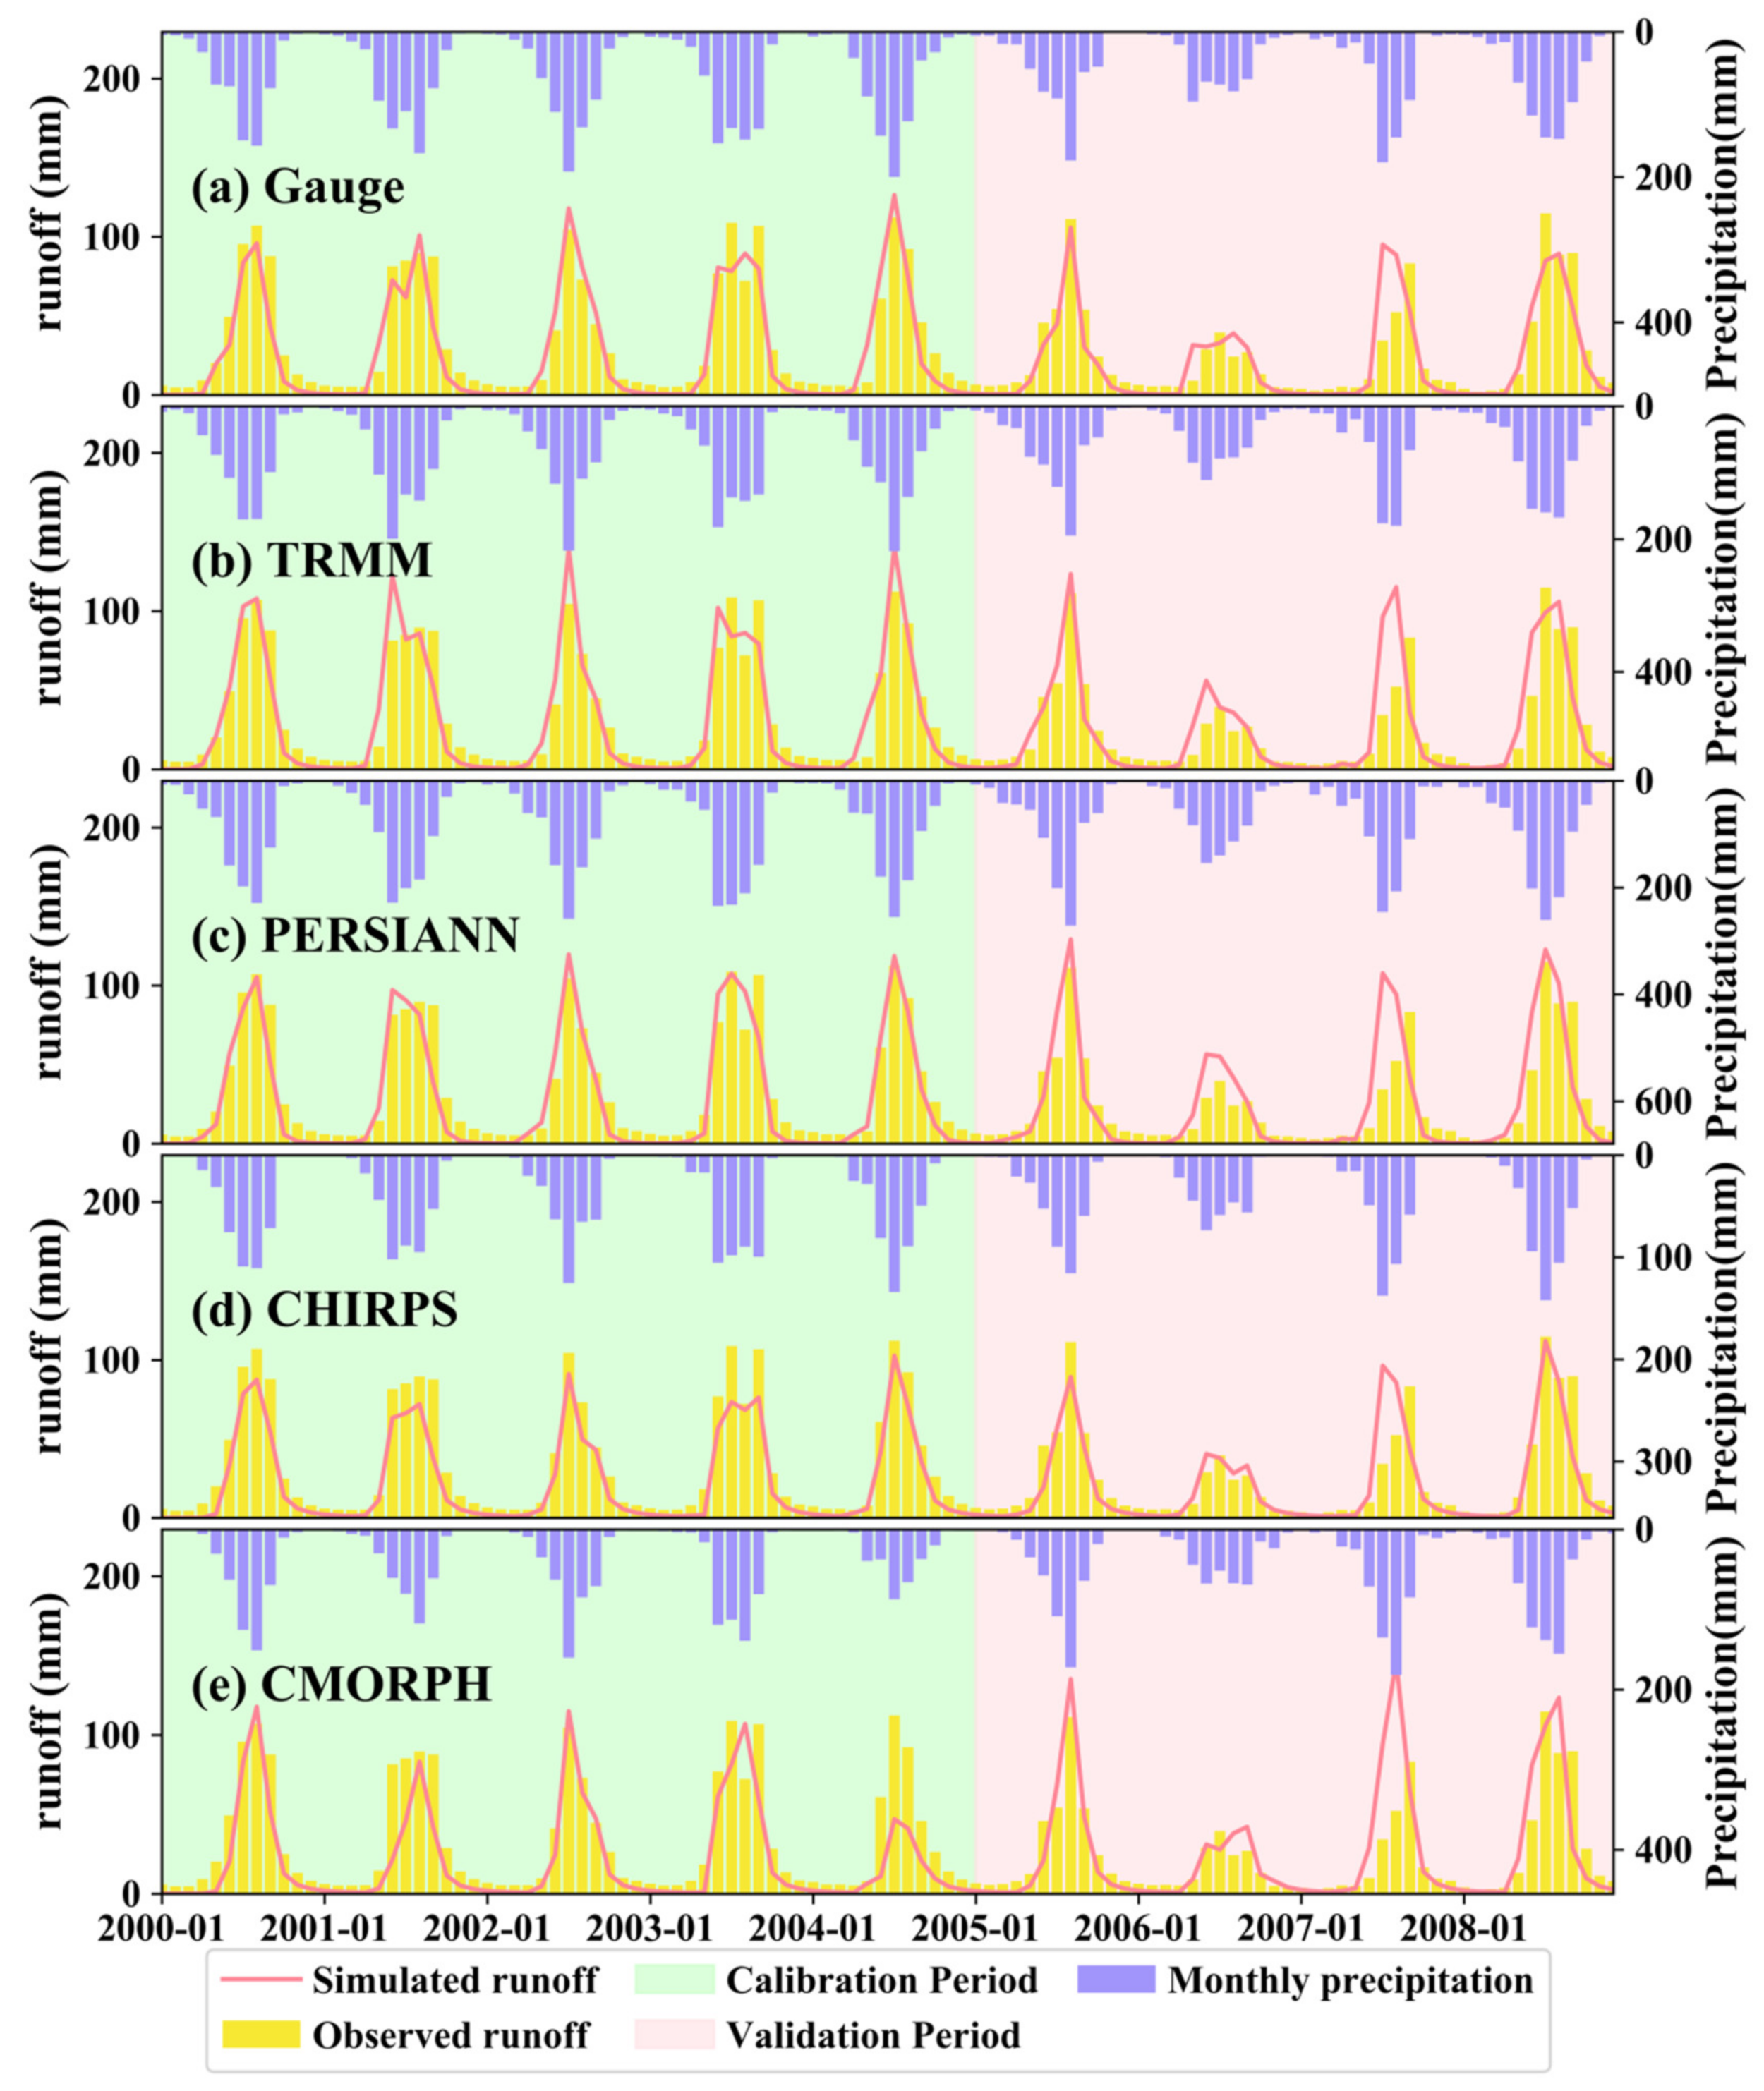
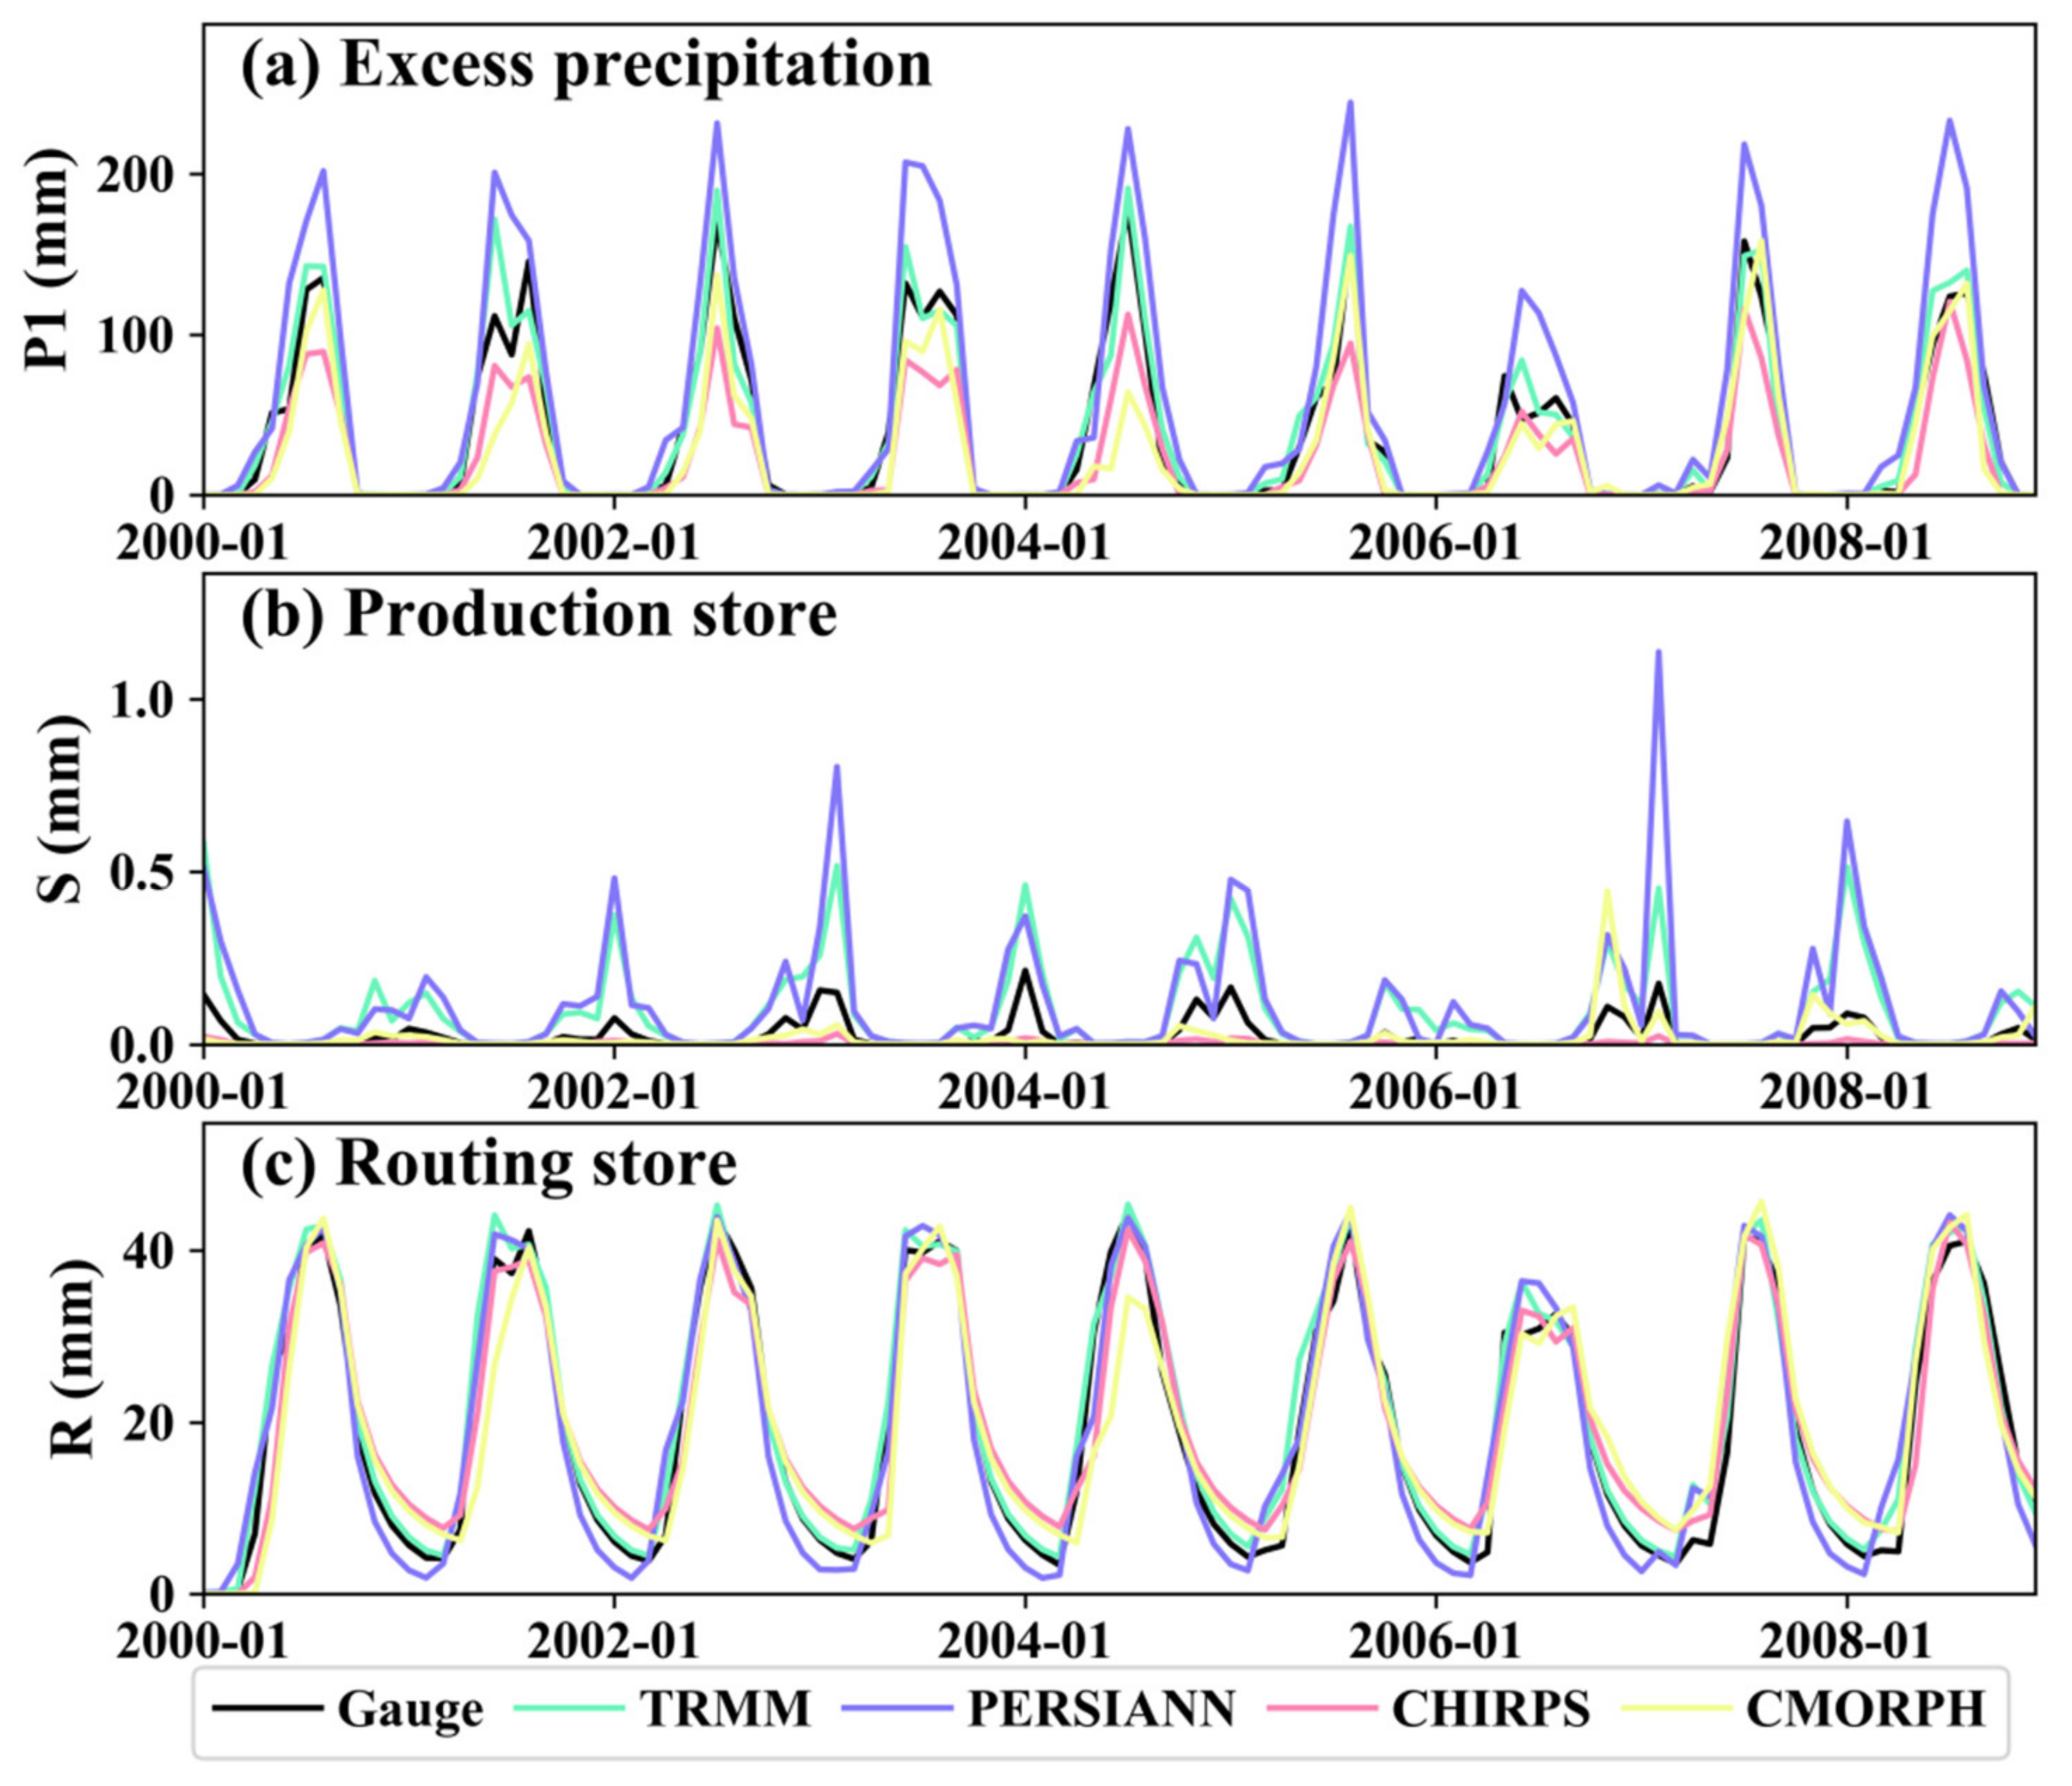
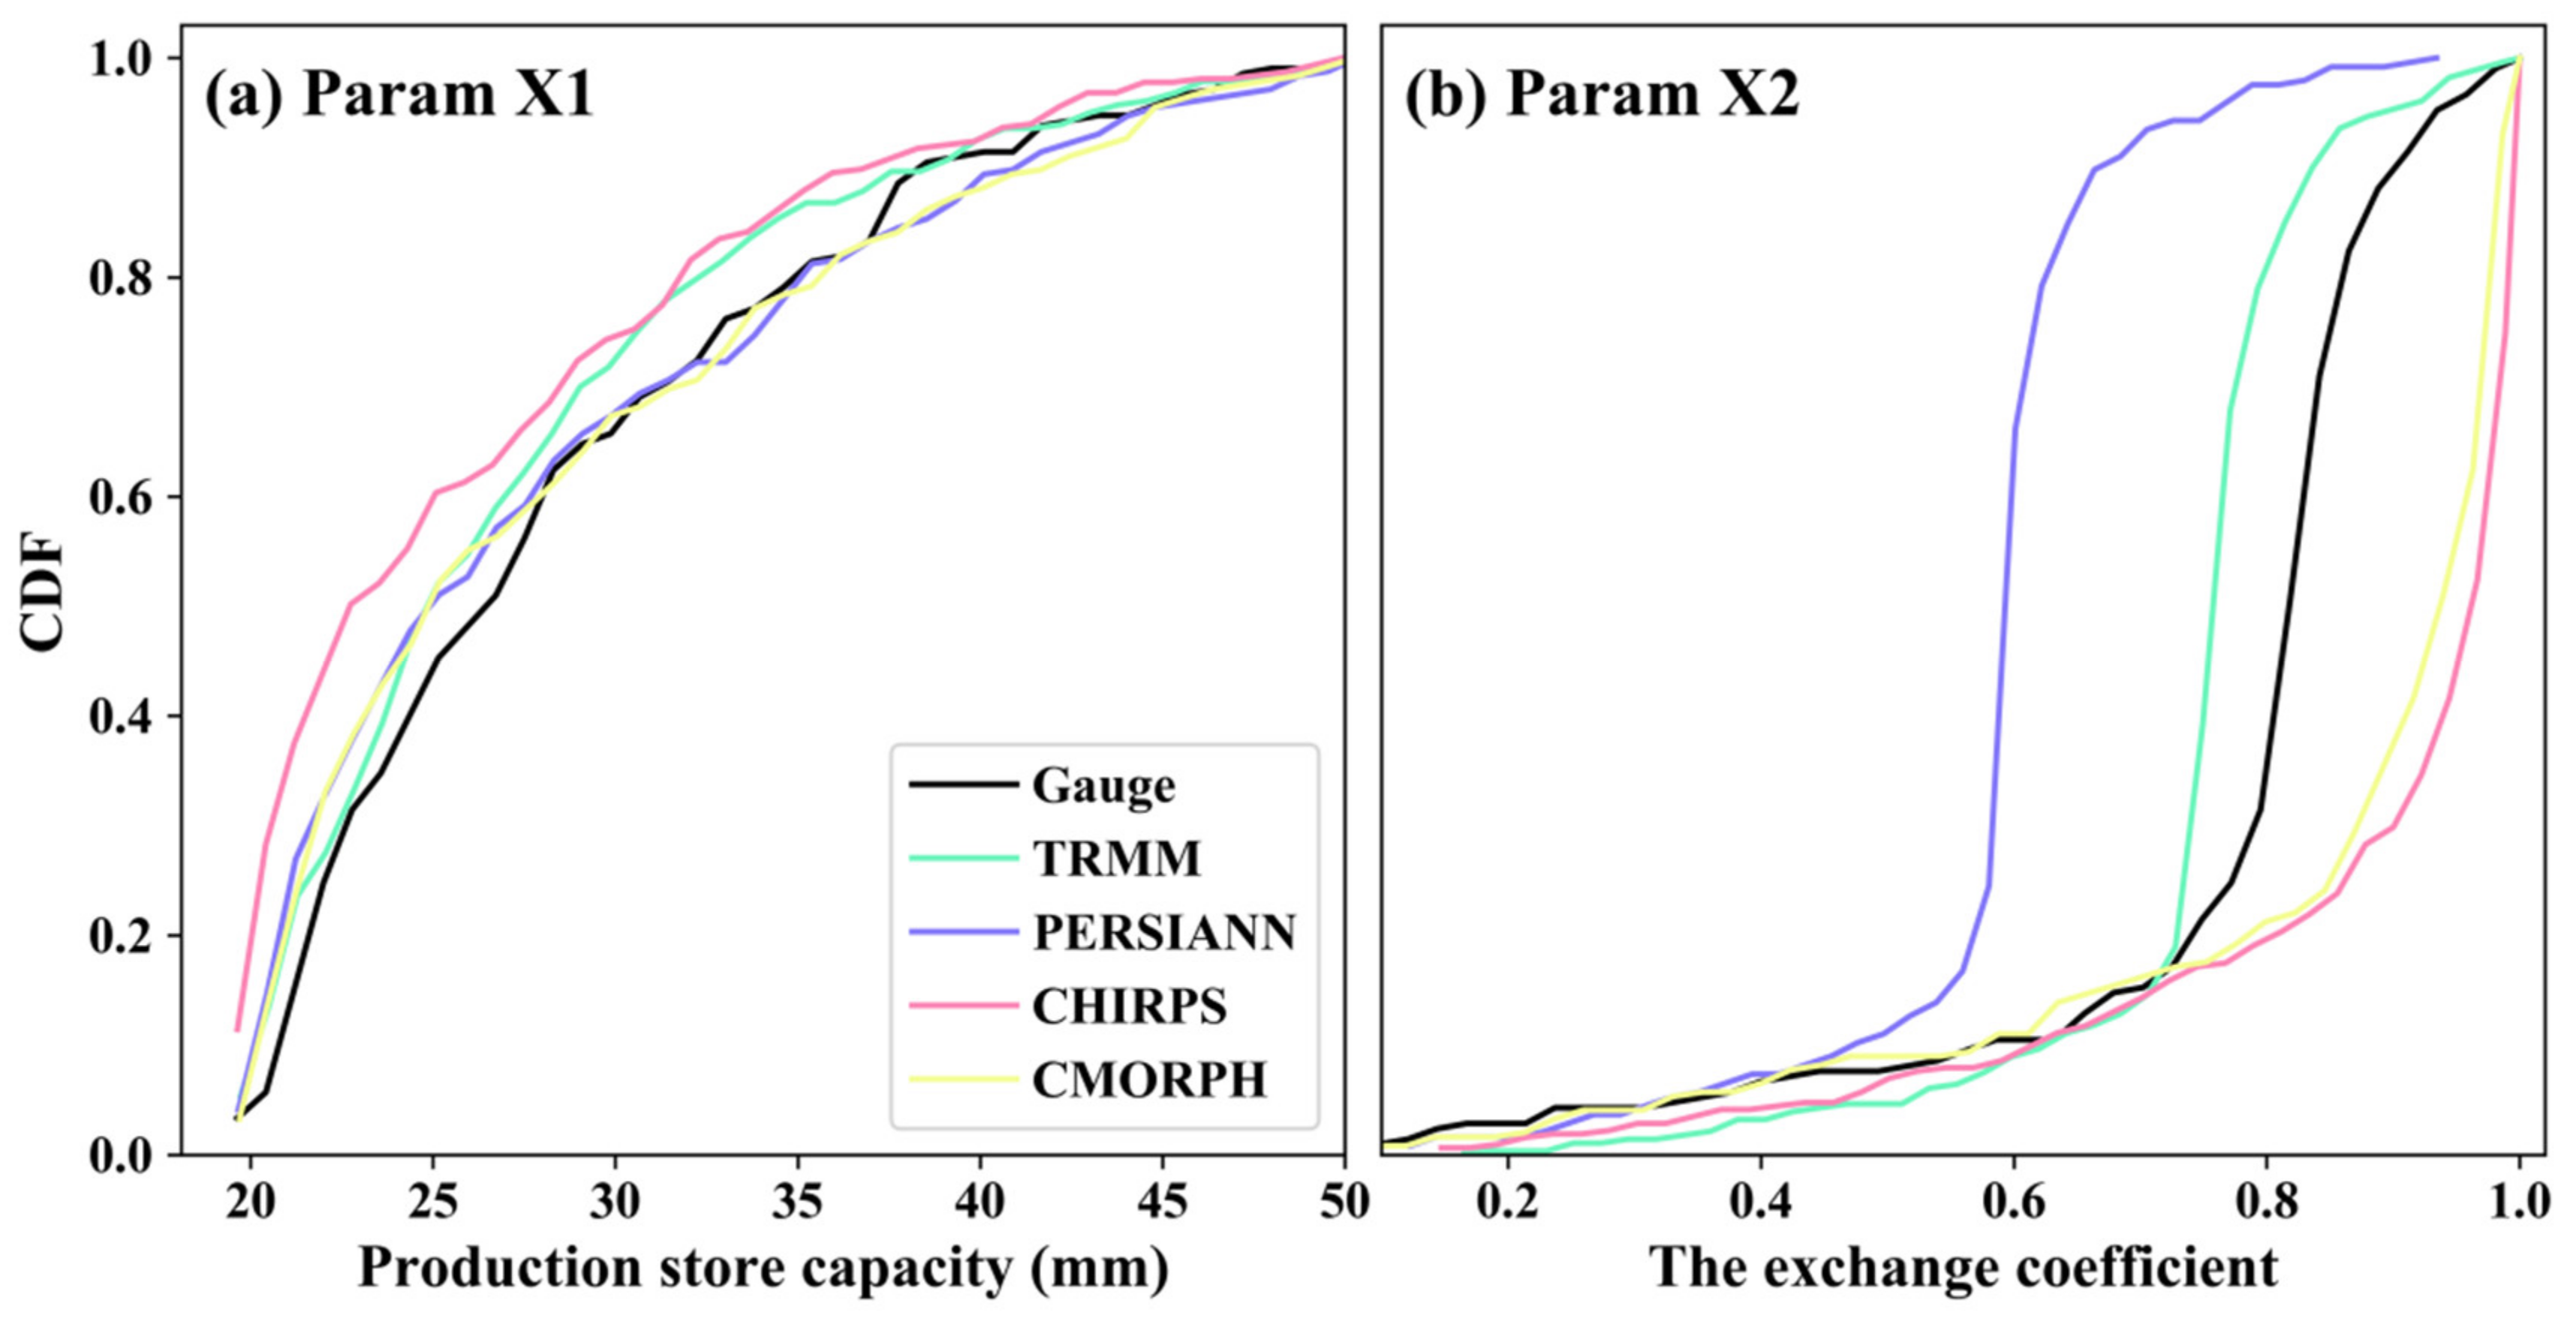
4.4. Hydrological Model Validation

This study used monthly precipitation from gauges and four products as hydrological model input and ran runoff hydrograph simulations at the Lhasa station from 2000 to 2008. Figure 13 depicts the process of simulated and measured hydrographs during the calibration (2000–2004) and validation (2005–2008) periods, along with the corresponding precipitation input process. The chart shows that the simulations of all products and gauges are generally accurate in reflecting the monthly runoff variance trend, especially for the annual peak of monthly runoff. However, when there are two runoff peaks within a year (e.g., 2003), only a few products, such as TRMM and CHIRPS, can simulate the same scenario. Due to TRMM and PERSIANN’s apparent overestimation of precipitation during dry years (e.g., 2006), the associated simulated peaks are significantly higher than those of the other products.
The metrics of the monthly hydrological simulations during the calibration and validation periods are listed in Table 3. During the calibration period, TRMM, PERSIANN, and CHIRPS have similar performance (NSE ranges from 0.84 to 0.86); however, CMORPH’s simulation result is not satisfactory (NSE is 0.65). Meanwhile, all of the products and gauges have high CC values, ranging from 0.88 to 0.97. Furthermore, all products tend to underestimate the runoff, as can be seen from the negative bias values. The bias of the four products ranges from −37.69% to −8.74%. It is worth mentioning that the simulation with TRMM input has an even lower bias than the gauge input. In comparison, during the validation period, the NSE levels drop dramatically, while the CC stays the same. CHIRPS presents consistent NSE values with the gauges (above 0.7), while TRMM, PERSIANN, and CMORPH perform poorly, with NSE values ranging from 0.45 to 0.58. The bias of all products ranges from −13.73% to 5.63%, presenting a significant reduction compared to the calibration period. One probable explanation is that between 2007 and 2008 the high and low estimates of runoff canceled each other out, especially for TRMM and PERSIANN. The RMSE only slightly increases compared to the calibration period, owing to the general overestimation of runoff simulation in May and June 2007.
In conclusion, a simulated gap remains between satellite product input and gauge input. On the one hand, the simulation results of CHIRPS are fairly close to the gauges’ overall metrics in both the calibration period and the validation period. On the other hand, the performance of the remaining three products is relatively poor in the validation period. In addition, TRMM and PERSIANN tend to overestimate annual peak monthly runoff, whereas CHIRPS and CMORPH underestimate it. Although there is a poor fit between the simulated and measured runoff throughout the validation period, it is hard to say that the precipitation input is inaccurate. For instance, all products and gauges show the highest monthly precipitation of the year in May–June 2007, yet the measured runoff value at the corresponding time does not reach the peak value. Instead, the annual peak of monthly runoff appears in July of that year. It is possible that the mismatch between precipitation and runoff is attributable to systematic mistakes in flow observation data.
Figure 14 shows the intermediate process of monthly runoff simulation with gauges and products as inputs from 2000 to 2008. The simulated routing store is similar when different gauges and products are used as inputs, while the simulated excess precipitation and production store are significantly different. In addition, the simulation peaks for excess precipitation and production store processes by PERSIANN are significantly higher than with the other products. In Figure 15, the Cumulative Distribution Function (CDF) of the model parameters shows differences in the optimal parameter distributions between the different products, especially for the exchange coefficient parameter (X2). As a result, both the output accuracy and the hydrological model of the internal water cycle process should be considered while calibrating the hydrological model.

5. Discussion

5.1. Results of Basin-Wide Validation

In general, all products exhibit a similar distribution of evaluation metrics on monthly and daily scales in YZR. The precipitation distribution of the observed data is the most comparable to TRMM and the least similar to PERSIANN. PERSIANN overestimated precipitation in the middle and lower reaches of the YZR. This may be due to interference with the inversion by infrared satellites caused by the complex terrain in the alpine and canyon areas [15,25,48]. The influence of terrain on the accuracy of satellite precipitation estimation can be seen more clearly on the daily scale. All products show the best precipitation accuracy in the middle of the YZR (the area with the smallest topographic change), followed by the east, and are worst in the west. Relevant studies have shown that satellite precipitation estimates are affected by topography and are closely related to the distribution of climate zones [49,50,51]. The western part of the YZR belongs to the Subtropical highland climate zone (Cwb), where the annual average precipitation is less than 200 mm and is covered by glaciers. In this area, all products exhibit a significant amount of bias in their precipitation estimations. However, the directions of bias differ between the products. Specifically, PERSIANN and CHIRPS have a positive bias, whereas TRMM and CMORPH have a negative bias in the same area. The distribution of the satellites’ precipitation detection capability is consistent with the precipitation accuracy, which gradually increases from west to east in the YZR. It is worth noting that despite its excellent detection accuracy, PERSIANN has the highest false alarm rates among the four products. This may be related to the general overestimation of precipitation events at high altitudes by PERSIANN [25]. Considering both precipitation precision and detection accuracy, TRMM is the closest to the observed precipitation on the spatial scale in the YZR, followed by CHIRPS, then PERSIANN, and CMORPH is the worst.

5.2. Results of Grid-Point Validation

On the monthly scale, although all products have a high correlation with observed precipitation, there is a large deviation in the estimation of precipitation. Specifically, all products significantly overestimate precipitation in June–August, except CMORPH, which exhibits an underestimation trend. Furthermore, in December, CMORPH, CHIRPS, and TRMM all indicate a considerable overestimation of precipitation. Both TRMM and CHIRPS outperform the other products with higher correlation and less bias, which is consistent with the findings of related studies [23,47].
On the daily scale, all products generally show a low correlation with observed precipitation. In the YZR, the CC values of daily precipitation range from 0.30 to 0.39, which is lower than the values of the same products in other basins, such as Huifa River [27], Blue Nile [52], Huaihe River [13], etc. It can be further seen from the statistical and categorical metrics that the accuracy of the satellite precipitation products has a strong dependence on rainfall intensity [24]. PERSIANN significantly overestimates weak precipitation events (<5 mm/d), and all products generally underestimate precipitation greater than 5 mm/d in the YZR. According to the CSI index, TRMM outperforms other products in detecting events with precipitation rates of 0.1–10 mm/d and greater than 20 mm/d. PERSIANN performs better in detecting precipitation events of 10–20 mm/d, which is the same result as found in the Mekong River basin [53].
From the change in metrics with elevation, it can be seen that the performance of all products is the best within the elevation range of 3000–4000 m (Figure 10 and Figure 11). Correspondingly, in the areas with relatively high elevations (>4000 m), the performance of the products is not satisfactory [23]. In mountainous areas, satellites distinguish between precipitation clouds and non-precipitation clouds based on cloud-top infrared temperature, and infrared sensors cannot detect precipitation from topographic warm clouds [54]. This may result in a consequent drop in the accuracy of precipitation estimation. In addition, the precipitation conditions of the high-elevation areas are complex in the YZR, including snow, sleet, etc., which increases the difficulty of precipitation estimation [55].
According to the changes in the metrics with climate zones (Figure 12), it is further verified that the spatial variability of satellite product performance is affected by climate. TRMM, PERSIANN, and CHIRPS all show a tendency to overestimate precipitation in the Bsk zone. A possible explanation is that the precipitation detected by satellites in arid zones may evaporate before reaching the surface, and thus not be recorded by the gauges [56,57,58]. This may explain why the false alarm rate of precipitation in arid zones (Bsk and BWk) is higher than in relatively humid zones (Cwb). In general, compared to other products, TRMM has more stable precipitation estimation accuracy and detection ability in each climate zone.

5.3. Results of Hydrological Model Validation

Through the comparison of monthly runoff simulations with different products as input (Figure 13), it can be seen that all products have ideal simulation accuracy during the calibration period. However, the products did not perform satisfactorily during the validation period. Only the NSE values of CHIRPS are close to the gauge precipitation input. This is similar to the findings of a study of the Huaihe River in China [13]. TRMM and PERSIANN tend to overestimate runoff, while CMORPH tends to underestimate runoff. From the intermediate process of the runoff simulation, it can be further found that although the simulation process of the four products at R is similar, the simulation process of PERSIANN at P1 and S is significantly higher than the others. The main reason for this is that PERSIANN generally overestimates precipitation.
Numerous studies have shown that parameter uncertainty may have a greater impact on model simulation results than the accuracy of input data [13,27,28]. To fit the observed runoff process, the calibration of the model will continuously iterate the parameter. This may lead to the equifinality of model parameters and even unrealistic parameter settings [59,60]. As shown in Figure 15b, the CDF of parameter X2 exhibits different optimal distribution intervals, and the rationality of the parameters needs to be further verified. After all, unrealistic parameter settings may ultimately limit the model’s prediction ability under changing climate conditions and different initial conditions [18].

6. Conclusions

At present, due to the complex topography and climate of the YZR, few studies have systematically evaluated satellite precipitation products in this region. This study not only validates the performance of four satellite products at monthly and daily scales from a basin-wide and grid-point perspective, it evaluates the products’ simulation suitability using a monthly hydrological model in the YZR. The main conclusions based on the findings are summarized as follows:
  • For basin-wide validation, the four products show similar spatial patterns of CC on monthly and daily scales, among which TRMM’s precipitation distribution is closest to the observed data, followed by CHIRPS. For daily precipitation, all products have the highest estimation accuracy and strongest detection ability in the central YZR, followed by the east, and are worst in the west.
  • For grid point validation, all products significantly overestimate precipitation in June–August, except CMORPH, which shows an underestimation trend. In December, CMORPH, CHIRPS, and TRMM indicate a severe overestimation of precipitation. All products overestimate precipitation by 0.1–5 mm/d and underestimate precipitation above 5 mm/d, especially PERSIANN. The CC and RMSE values increase together during extreme precipitation events (>20 mm/d).
  • For different elevation and climate zones, TRMM has relatively stable estimation accuracy and detection ability in the YZR. The products tend to perform well in the elevation range of 3000–4000 m and in relatively humid zones (Cwb, Dwc, and Dwb).
  • For hydrological model validation, TRMM has the best performance during the calibration period, while it shows lower NSE (0.58) than CHIRPS (0.71) during the validation period. The runoff simulation bias of all products is higher than that of TRMM, especially for CHIRPS.
In summary, TRMM exhibits the best performance in the YZR according to the comparison of spatial and temporal metrics. However, the accuracy of daily precipitation estimation for all products is not satisfactory. The key limitation is the detection and estimation of light precipitation in high elevations or arid zones. In addition, the applicability of satellite products for hydrological simulation in the YZR needs further study, including the rationality of parameter selection and the intermediate simulation process.

Author Contributions

Conceptualization, X.Y.; methodology, X.Y.; software, X.Y.; validation, X.Y.; formal analysis, X.Y.; investigation, X.Y.; resources, X.Y. and Y.G.; data curation, X.Y.; writing—original draft preparation, X.Y.; writing—review and editing, X.Y. and Y.G.; visualization, X.Y.; supervision, Z.W.; project administration, L.L. and J.T.; funding acquisition, Z.W. All authors have read and agreed to the published version of the manuscript.

Funding

This research and the APC was funded by [The Second Tibetan Plateau Scientific Expedition and Research Program (STEP)] grant number [No. 2019QZKK0903].

Data Availability Statement

The observed meteorological data were provided by the China Meteorological Administration (http://cdc.cma.gov.ac) (accessed on 23 January 2022). The CMFD dataset was provided by the National Tibetan Plateau Data Center. The TRMM dataset was provided by NASA and the Japanese Aerospace Exploration Agency, JAXA. The PERSIANN dataset was provided by the University of California. The CHIRPS dataset was provided by the U.S. Geological Survey (USGS). The CMORPH dataset was provided by the National Oceanic and Atmospheric Administration (NOAA).

Conflicts of Interest

The authors declare no conflict of interest.

References

  1. Bai, P.; Liu, X.M.; Zhang, D.; Liu, C.M. Estimation of the Budyko model parameter for small basins in China. Hydrol. Process. 2020, 34, 125–138. [Google Scholar] [CrossRef]
  2. Tapiador, F.J.; Turk, F.J.; Petersen, W.; Hou, A.Y.; García-Ortega, E.; Machado, L.A.T.; Angelis, C.F.; Salio, P.; Kidd, C.; Huffman, G.J.; et al. Global precipitation measurement: Methods, datasets and applications. Atmos. Res. 2012, 104, 70–97. [Google Scholar] [CrossRef]
  3. Sunilkumar, K.; Rao, T.N.; Saikranthi, K.; Rao, M.P. Comprehensive evaluation of multisatellite precipitation estimates over India using gridded rainfall data. J. Geophys. Res. Atmos. 2015, 120, 8987–9005. [Google Scholar] [CrossRef] [Green Version]
  4. Liang, P.; Ding, Y. The long-term variation of extreme heavy precipitation and its link to urbanization effects in Shanghai during 1916–2014. Adv. Atmos. Sci. 2017, 34, 321–334. [Google Scholar] [CrossRef]
  5. Beck, H.E.; Vergopolan, N.; Pan, M.; Levizzani, V.; van Dijk, A.I.J.M.; Weedon, G.P.; Brocca, L.; Pappenberger, F.; Huffman, G.J.; Wood, E.F. Global-scale evaluation of 22 precipitation datasets using gauge observations and hydrological modeling. Hydrol. Earth Syst. Sci. 2017, 21, 6201–6217. [Google Scholar] [CrossRef] [Green Version]
  6. Huffman, G.J.; Bolvin, D.T.; Nelkin, E.J.; Wolff, D.B.; Adler, R.F.; Gu, G.; Hong, Y.; Bowman, K.P.; Stocker, E.F. The TRMM Multisatellite Precipitation Analysis (TMPA): Quasi-Global, Multiyear, Combined-Sensor Precipitation Estimates at Fine Scales. J. Hydrometeorol. 2007, 8, 38–55. [Google Scholar] [CrossRef]
  7. Yong, B.; Chen, B.; Gourley, J.J.; Ren, L.; Hong, Y.; Chen, X.; Wang, W.; Chen, S.; Gong, L. Intercomparison of the Version-6 and Version-7 TMPA precipitation products over high and low latitudes basins with independent gauge networks: Is the newer version better in both real-time and post-real-time analysis for water resources and hydrologic extremes? J. Hydrol. 2014, 508, 77–87. [Google Scholar] [CrossRef]
  8. Ashouri, H.; Hsu, K.-L.; Sorooshian, S.; Braithwaite, D.K.; Knapp, K.R.; Cecil, L.D.; Nelson, B.R.; Prat, O.P. PERSIANN-CDR: Daily Precipitation Climate Data Record from Multisatellite Observations for Hydrological and Climate Studies. Bull. Am. Meteorol. Soc. 2015, 96, 69–83. [Google Scholar] [CrossRef] [Green Version]
  9. Miao, C.; Ashouri, H.; Hsu, K.-L.; Sorooshian, S.; Duan, Q. Evaluation of the PERSIANN-CDR Daily Rainfall Estimates in Capturing the Behavior of Extreme Precipitation Events over China. J. Hydrometeorol. 2015, 16, 1387–1396. [Google Scholar] [CrossRef] [Green Version]
  10. Nguyen, P.; Shearer, E.J.; Tran, H.; Ombadi, M.; Hayatbini, N.; Palacios, T.; Huynh, P.; Braithwaite, D.; Updegraff, G.; Hsu, K.; et al. The CHRS Data Portal, an easily accessible public repository for PERSIANN global satellite precipitation data. Sci. Data 2019, 6, 180296. [Google Scholar] [CrossRef] [Green Version]
  11. Funk, C.; Peterson, P.; Landsfeld, M.; Pedreros, D.; Verdin, J.; Shukla, S.; Husak, G.; Rowland, J.; Harrison, L.; Hoell, A.; et al. The climate hazards infrared precipitation with stations—A new environmental record for monitoring extremes. Sci. Data 2015, 2, 150066. [Google Scholar] [CrossRef] [PubMed] [Green Version]
  12. Joyce, R.J.; Janowiak, J.E.; Arkin, P.A.; Xie, P.P. CMORPH: A method that produces global precipitation estimates from passive microwave and infrared data at high spatial and temporal resolution. J. Hydrometeorol. 2004, 5, 487–503. [Google Scholar] [CrossRef]
  13. Sun, R.; Yuan, H.; Liu, X.; Jiang, X. Evaluation of the latest satellite–gauge precipitation products and their hydrologic applications over the Huaihe River basin. J. Hydrol. 2016, 536, 302–319. [Google Scholar] [CrossRef]
  14. Hou, A.Y.; Kakar, R.K.; Neeck, S.; Azarbarzin, A.A.; Kummerow, C.D.; Kojima, M.; Oki, R.; Nakamura, K.; Iguchi, T. The global precipitation measurement mission. Bull. Am. Meteorol. Soc. 2014, 95, 701–722. [Google Scholar] [CrossRef]
  15. Iqbal, M.F.; Athar, H. Validation of satellite based precipitation over diverse topography of Pakistan. Atmos. Res. 2018, 201, 247–260. [Google Scholar] [CrossRef]
  16. Kim, J.; Han, H. Evaluation of the CMORPH high-resolution precipitation product for hydrological applications over South Korea. Atmos. Res. 2021, 258, 105650. [Google Scholar] [CrossRef]
  17. Tian, W.; Liu, X.; Wang, K.; Bai, P.; Liang, K.; Liu, C. Evaluation of six precipitation products in the Mekong River Basin. Atmos. Res. 2021, 255, 105539. [Google Scholar] [CrossRef]
  18. Xue, X.; Hong, Y.; Limaye, A.S.; Gourley, J.J.; Huffman, G.J.; Khan, S.I.; Dorji, C.; Chen, S. Statistical and hydrological evaluation of TRMM-based Multi-satellite Precipitation Analysis over the Wangchu Basin of Bhutan: Are the latest satellite precipitation products 3B42V7 ready for use in ungauged basins? J. Hydrol. 2013, 499, 91–99. [Google Scholar] [CrossRef]
  19. Sun, Q.; Miao, C.; Duan, Q.; Ashouri, H.; Sorooshian, S.; Hsu, K.-L. A review of global precipitation data sets: Data sources, estimation, and intercomparisons. Rev. Geophys. 2018, 56, 79–107. [Google Scholar] [CrossRef] [Green Version]
  20. Tang, G.; Behrangi, A.; Long, D.; Li, C.; Hong, Y. Accounting for spatiotemporal errors of gauges: A critical step to evaluate gridded precipitation products. J. Hydrol. 2018, 559, 294–306. [Google Scholar] [CrossRef] [Green Version]
  21. Chen, H.; Yong, B.; Gourley, J.J.; Liu, J.; Ren, L.; Wang, W.; Hong, Y.; Zhang, J. Impact of the crucial geographic and climatic factors on the input source errors of GPM-based global satellite precipitation estimates. J. Hydrol. 2019, 575, 1–16. [Google Scholar] [CrossRef]
  22. Derin, Y.; Yilmaz, K.K. Evaluation of Multiple Satellite-Based Precipitation Products over Complex Topography. J. Hydrometeorol. 2014, 15, 1498–1516. [Google Scholar] [CrossRef] [Green Version]
  23. Montes, C.; Acharya, N.; Hassan, S.M.Q.; Krupnik, T.J. Intense precipitation events during the monsoon season in Bangladesh as captured by satellite-based products. J. Hydrometeorol. 2021, 22, 1405–1419. [Google Scholar] [CrossRef]
  24. Meng, C.; Mo, X.; Liu, S.; Hu, S. Extensive evaluation of IMERG precipitation for both liquid and solid in Yellow River source region. Atmos. Res. 2021, 256, 105570. [Google Scholar] [CrossRef]
  25. Ullah, W.; Wang, G.; Ali, G.; Hagan, D.F.T.; Bhatti, A.S.; Lou, D. Comparing Multiple Precipitation Products against In-Situ Observations over Different Climate Regions of Pakistan. Remote Sens. 2019, 11, 628. [Google Scholar] [CrossRef] [Green Version]
  26. Yu, C.; Hu, D.; Di, Y.; Wang, Y. Performance evaluation of IMERG precipitation products during typhoon Lekima (2019). J. Hydrol. 2021, 597, 126307. [Google Scholar] [CrossRef]
  27. Zhu, H.; Li, Y.; Huang, Y.; Li, Y.; Hou, C.; Shi, X. Evaluation and hydrological application of satellite-based precipitation datasets in driving hydrological models over the Huifa river basin in Northeast China. Atmos. Res. 2018, 207, 28–41. [Google Scholar] [CrossRef]
  28. Sun, R.; Yuan, H.; Yang, Y. Using multiple satellite-gauge merged precipitation products ensemble for hydrologic uncertainty analysis over the Huaihe River basin. J. Hydrol. 2018, 566, 406–420. [Google Scholar] [CrossRef] [Green Version]
  29. Liu, J.; Xu, Z.; Bai, J.; Peng, D.; Ren, M. Assessment and Correction of the PERSIANN-CDR Product in the Yarlung Zangbo River Basin, China. Remote Sens. 2018, 10, 2031. [Google Scholar] [CrossRef] [Green Version]
  30. Sun, W.; Wang, Y.; Fu, Y.H.; Xue, B.; Wang, G.; Yu, J.; Zuo, D.; Xu, Z. Spatial heterogeneity of changes in vegetation growth and their driving forces based on satellite observations of the Yarlung Zangbo River Basin in the Tibetan Plateau. J. Hydrol. 2019, 574, 324–332. [Google Scholar] [CrossRef]
  31. Jia, Y.; Lei, H.; Yang, H.; Hu, Q. Terrestrial Water Storage Change Retrieved by GRACE and Its Implication in the Tibetan Plateau: Estimating Areal Precipitation in Ungauged Region. Remote Sens. 2020, 12, 3129. [Google Scholar] [CrossRef]
  32. Liu, S.; Yao, Y.; Kuang, X.; Zheng, C. A preliminary investigation on the climate-discharge relationship in the upper region of the Yarlung Zangbo River basin. J. Hydrol. 2021, 603, 127066. [Google Scholar] [CrossRef]
  33. Beck, H.E.; Zimmermann, N.E.; McVicar, T.R.; Vergopolan, N.; Berg, A.; Wood, E.F. Present and future Köppen-Geiger climate classification maps at 1-km resolution. Sci. Data 2018, 5, 180214. [Google Scholar] [CrossRef] [PubMed] [Green Version]
  34. Kottek, M.; Grieser, J.; Beck, C.; Rudolf, B.; Rubel, F. World map of the Köppen-Geiger climate classification updated. Meteorol. Z. 2006, 15, 259–263. [Google Scholar] [CrossRef]
  35. He, J.; Yang, K.; Tang, W.; Lu, H.; Qin, J.; Chen, Y.; Li, X. The first high-resolution meteorological forcing dataset for land process studies over China. Sci. Data 2020, 7, 25. [Google Scholar] [CrossRef] [Green Version]
  36. Yang, K.; He, J.; Tang, W.; Qin, J.; Cheng, C.C. On downward shortwave and longwave radiations over high altitude regions: Observation and modeling in the Tibetan Plateau. Agric. For. Meteorol. 2010, 150, 38–46. [Google Scholar] [CrossRef]
  37. Makhlouf, Z.; Michel, C. A two-parameter monthly water balance model for French watersheds. J. Hydrol. 1994, 162, 299–318. [Google Scholar] [CrossRef]
  38. Bachir, S.; Nouar, B.; Hicham, C.; Azzedine, H.; Larbi, D. Application of GR2M for rainfall-runoff modeling in Kébir Rhumel Watershed, north east of Algeria. World Appl. Sci. J. 2015, 33, 1623–1630. [Google Scholar]
  39. Dezetter, A.; Girard, S.; Paturel, J.; Mahé, G.; Ardoin-Bardin, S.; Servat, E. Simulation of runoff in West Africa: Is there a single data-model combination that produces the best simulation results? J. Hydrol. 2008, 354, 203–212. [Google Scholar] [CrossRef]
  40. Ditthakit, P.; Pinthong, S.; Salaeh, N.; Binnui, F.; Khwanchum, L.; Pham, Q.B. Using machine learning methods for supporting GR2M model in runoff estimation in an ungauged basin. Sci. Rep. 2021, 11, 1–16. [Google Scholar] [CrossRef]
  41. Fathi, M.M.; Awadallah, A.G.; Abdelbaki, A.M.; Haggag, M. A new Budyko framework extension using time series SARIMAX model. J. Hydrol. 2019, 570, 827–838. [Google Scholar] [CrossRef]
  42. Huard, D.; Mailhot, A. Calibration of hydrological model GR2M using Bayesian uncertainty analysis. Water Resour. Res. 2008, 44, 206. [Google Scholar] [CrossRef] [Green Version]
  43. Mouelhi, S.; Michel, C.; Perrin, C.; Andréassian, V. Stepwise development of a two-parameter monthly water balance model. J. Hydrol. 2006, 318, 200–214. [Google Scholar] [CrossRef]
  44. Paturel, J.E.; Mahé, G.; Diello, P.; Barbier, B.; Dezetter, A.; Dieulin, C.; Karambiri, H.; Yacouba, H.; Maiga, A. Using land cover changes and demographic data to improve hydrological modeling in the Sahel. Hydrol. Process. 2016, 31, 811–824. [Google Scholar] [CrossRef] [Green Version]
  45. Sirisena, T.; Maskey, S.; Ranasinghe, R. Hydrological Model Calibration with Streamflow and Remote Sensing Based Evapotranspiration Data in a Data Poor Basin. Remote Sens. 2020, 12, 3768. [Google Scholar] [CrossRef]
  46. Zhang, L.; Xin, Z.; Zhou, H. Assessment of TMPA 3B42V7 and PERSIANN-CDR in Driving Hydrological Modeling in a Semi-Humid Watershed in Northeastern China. Remote Sens. 2020, 12, 3133. [Google Scholar] [CrossRef]
  47. Gao, F.; Zhang, Y.; Chen, Q.; Wang, P.; Yang, H.; Yao, Y.; Cai, W. Comparison of two long-term and high-resolution satellite precipitation datasets in Xinjiang, China. Atmos. Res. 2018, 212, 150–157. [Google Scholar] [CrossRef]
  48. Li, X.; Zhang, Q.; Xu, C.-Y. Assessing the performance of satellite-based precipitation products and its dependence on topography over Poyang Lake basin. Arch. Meteorol. Geophys. Bioclimatol. Ser. B 2013, 115, 713–729. [Google Scholar] [CrossRef]
  49. Mantas, V.M.; Liu, Z.; Caro, C.; Pereira, A.J.S.C. Validation of TRMM multi-satellite precipitation analysis (TMPA) products in the Peruvian Andes. Atmos. Res. 2015, 163, 132–145. [Google Scholar] [CrossRef]
  50. Thiemig, V.; Rojas, R.; Zambrano-Bigiarini, M.; Levizzani, V.; De Roo, A. Validation of Satellite-Based Precipitation Products over Sparsely Gauged African River Basins. J. Hydrometeorol. 2012, 13, 1760–1783. [Google Scholar] [CrossRef]
  51. Zambrano-Bigiarini, M.; Nauditt, A.; Birkel, C.; Verbist, K.; Ribbe, L. Temporal and spatial evaluation of satellite-based rainfall estimates across the complex topographical and climatic gradients of Chile. Hydrol. Earth Syst. Sci. 2017, 21, 1295–1320. [Google Scholar] [CrossRef] [Green Version]
  52. Abdourahamane, Z.S. Evaluation of fine resolution gridded rainfall datasets over a dense network of rain gauges in Niger. Atmos. Res. 2021, 252, 105459. [Google Scholar] [CrossRef]
  53. Tang, X.; Zhang, J.; Gao, C.; Ruben, G.B.; Wang, G. Assessing the Uncertainties of Four Precipitation Products for Swat Modeling in Mekong River Basin. Remote Sens. 2019, 11, 304. [Google Scholar] [CrossRef] [Green Version]
  54. Tian, Y.; Peters-Lidard, C.D.; Eylander, J.B.; Joyce, R.J.; Huffman, G.J.; Adler, R.F.; Hsu, K.; Turk, F.J.; Garcia, M.; Zeng, J. Component analysis of errors in satellite-based precipitation estimates. J. Geophys. Res. Atmos. 2009, 114, D24101. [Google Scholar] [CrossRef] [Green Version]
  55. Hussain, Y.; Satgé, F.; Hussain, M.B.; Martinez-Carvajal, H.; Bonnet, M.-P.; Cárdenas-Soto, M.; Roig, H.L.; Akhter, G. Performance of CMORPH, TMPA, and PERSIANN rainfall datasets over plain, mountainous, and glacial regions of Pakistan. Arch. Meteorol. Geophys. Bioclimatol. Ser. B 2017, 131, 1119–1132. [Google Scholar] [CrossRef]
  56. Kazemzadeh, M.; Noori, Z.; Alipour, H.; Jamali, S.; Akbari, J.; Ghorbanian, A.; Duan, Z. Detecting drought events over Iran during 1983–2017 using satellite and ground-based precipitation observations. Atmos. Res. 2022, 269, 106052. [Google Scholar] [CrossRef]
  57. Rahman, K.U.; Shang, S.; Shahid, M.; Li, J. Developing an Ensemble Precipitation Algorithm from Satellite Products and Its Topographical and Seasonal Evaluations Over Pakistan. Remote Sens. 2018, 10, 1835. [Google Scholar] [CrossRef] [Green Version]
  58. Mccollum, J.R.; Gruber, A.; Ba, M.B. Discrepancy between Gauges and Satellite Estimates of Rainfall in Equatorial Africa. J. Appl. Meteorol. 2000, 39, 666–679. [Google Scholar] [CrossRef]
  59. Beven, K. A manifesto for the equifinality thesis. J. Hydrol. 2006, 320, 18–36. [Google Scholar] [CrossRef] [Green Version]
  60. Khatami, S.; Peel, M.C.; Peterson, T.J.; Western, A.W. Equifinality and Flux Mapping: A New Approach to Model Evaluation and Process Representation Under Uncertainty. Water Resour. Res. 2019, 55, 8922–8941. [Google Scholar] [CrossRef]
Figure 1. The location of Yarlung Zangbo River Basin: (a) mainly represents the distribution of meteorological and hydrological stations in the basin, as well as elevation changes, while (b) represents the difference in climatic zones within the basin.
Remotesensing 14 03350 g001
Figure 2. The conceptual framework of the GR2M model [31,34].
Remotesensing 14 03350 g002
Figure 3. Spatial distribution of correlation metrics (CC, Bias, RMSE) of monthly precipitation during 2000–2008: (ad) the spatial distribution of CC values; (eh) the spatial distribution of B\bias values; (il) the spatial distribution of RMSE values.
Remotesensing 14 03350 g003
Figure 4. Spatial distribution of correlation metrics (CC, Bias, RMSE) of daily precipitation during 2000–2008: (ad) the spatial distribution of CC values; (eh) the spatial distribution of bias values; (il) the spatial distribution of RMSE values.
Remotesensing 14 03350 g004
Figure 5. Spatial distribution of precipitation detection ability metrics (POD, FAR, CSI) of daily precipitation during 2000–2008: (ad) spatial distribution of POD values; (eh) spatial distribution of FAR values; (il) spatial distribution of CSI values.
Remotesensing 14 03350 g005
Figure 6. Scatter density of rain gauged precipitation at monthly scale and corresponding grids for four products from 2000 to 2008: (ad) plots of TRMM, PERSIANN, CHIRPS, and COMRPH, respectively.
Remotesensing 14 03350 g006
Figure 7. Evaluation metrics calculated by each month’s precipitation for rain gauges and four corresponding product grids: (ac) CC, Bias, and RMSE, respectively.
Remotesensing 14 03350 g007
Figure 8. Scatter density plot of time series of daily precipitation from rain gauges and corresponding grids for four products from 2000 to 2008: (ad) plots of TRMM, PERSIANN, CHIRPS, and COMRPH, respectively.
Remotesensing 14 03350 g008
Figure 9. Box plots of the statistical metrics of daily precipitation for different precipitation intensity intervals: (a) CC, (b) Bias, (c) RMSE, (d) POD, (e) FAR, and (f) CSI. Each box ranges from the lower quartile (25th) to the upper quartile (75th). The middle line indicates the median value in the box. The whiskers show the largest and smallest values within 1.5 times the interquartile range. The diamond presents the points beyond the whiskers.
Remotesensing 14 03350 g009
Figure 10. The line chart of the evaluation metrics calculated by daily precipitation for the four products at five altitude intervals: (a) CC, (b) Bias, (c) RMSE.
Remotesensing 14 03350 g010
Figure 11. The line chart of the evaluation metrics calculated by daily precipitation for the four products at five altitude intervals: (a) POD, (b) FAR, (c) CSI.
Remotesensing 14 03350 g011
Figure 12. Radar map for the daily precipitation metrics of all gauges and corresponding product grids over different climatic zones: (af) CC, Bias, RMSE, POD, FAR, and CSI, respectively. The label abbreviations are explained below. Bsk: Cold semi-arid climate; BWk: Cold desert climate; Cwb: Subtropical highland climate; Dwb: Monsoon-influenced warm-summer humid continental climate; Dwc: Monsoon-influenced subarctic climate.
Remotesensing 14 03350 g012
Figure 13. The monthly observed ( Q o b s ) and the simulated ( Q s i m ) runoff hydrographs for four products and gauges at Lhasa station from 2000 to 2008. The input data of (ae) are Gauge, TRMM, PERSIANN, CHIRPS, and CMORPH, respectively. The calibration period is 2000–2004 and the validation period is 2005–2008.
Remotesensing 14 03350 g013
Figure 14. The intermediate process of monthly runoff simulation with gauges and products as inputs during 2000–2008: (ac) are the process of Excess precipitation, Production store, and Routing store, respectively.
Remotesensing 14 03350 g014
Figure 15. The Cumulative Distribution Function (CDF) of model parameters for all products and gauges: (a) parameter X1 represents the capacity of production; (b) parameter X2 represents the exchange coefficient.
Remotesensing 14 03350 g015
Table 1. Information about the observation data and satellite products.
NameVersionTime RangeTemporal ResolutionSpatial ResolutionData Source
CMFDv1.01979–2018Daily0.10 deg.https://data.tpdc.ac.cn/zh-hans/data/8028b944-daaa-4511-8769-965612652c49/ (accessed on 21 January 2022)
TRMM3B42_Daily_71998–2020Daily0.25 deg.https://disc.gsfc.nasa.gov/datasets/TRMM_3B42_Daily_7/summary?keywords=TRMM (accessed on 21 January 2022)
PERSIANNCDR v1 Revision 11983–2017Daily0.25 deg.https://www.ncei.noaa.gov/data/precipitation-persiann/access/ (accessed on 21 January 2022)
CHIRPSv2.01981–2017Daily0.25 deg.https://data.chc.ucsb.edu/products/CHIRPS-2.0/ (accessed on 21 January 2022)
CMORPHv1.0 CRT1998–2021Daily0.25 deg.https://ftp.cpc.ncep.noaa.gov/precip/CMORPH_V1.0/CRT/ (accessed on 21 January 2022)
Table 2. Equations and ideal values of the statistical and categorical metrics.
MetricsEquationIdeal Value
CC P i P ¯ G i G ¯ P i P ¯ 2 G i G ¯ 2 1
Bias P i G i G i × 100 % 0
RMSE i = 1 N P i G i 2 N 0
NSE 1 i = 1 N Q o b s , i Q s i m , i 2 i = 1 N Q o b s , i Q ¯ o b s 2 1
POD H H + M 1
FAR F H + F 0
CSI H H + M + F 1
where P i and G i are the precipitation/runoff of satellite products and gauges, respectively, on different temporal and spatial scales; P ¯ and G ¯ are the corresponding mean values; N is the length of precipitation/runoff time series; Q o b s , i and Q s i m , i represents the observed and simulated runoff in a single time period, respectively, and Q ¯ o b s represents the mean observed runoff value; H represents the frequency of observed precipitation detected by satellite; M represents the frequency of observed precipitation not detected by satellite; and F represents the frequency of false precipitation detected by satellite.
Table 3. The metrics for the monthly runoff simulation for four products and gauge at Lhasa station during 2000–2008. The calibration period is 2000–2004 and the validation period is 2005–2008.
Input SourceCalibration Period (2000–2004)Validation Period (2005–2008)
NSECCBias (%)RMSE (mm)NSECCBias (%)RMSE (mm)
Gauge0.840.93−19.0314.640.740.88−13.1214.87
TRMM0.840.94−8.7414.370.580.830.9519.03
PERSIANN0.860.95−17.1313.690.550.841.4019.60
CHIRPS0.840.97−32.0814.460.710.87−13.7315.56
CMORPH0.650.88−37.6921.430.450.825.6321.59
Publisher’s Note: MDPI stays neutral with regard to jurisdictional claims in published maps and institutional affiliations.

