Article

Aerosol Mineralogical Study Using Laboratory and IASI Measurements: Application to East Asian Deserts

1
Laboratoire d’Optique Atmosphérique, LOA, UMR 8518, CNRS, Université de Lille, F-59000 Lille, France
2
Physicochimie des Processus de Combustion et de l’Atmosphère, PC2A, UMR 8522, CNRS, Université de Lille, F-59000 Lille, France
3
Laboratoire des Biomatériaux and des Matériaux Intelligents, LBMI, Université Libanaise Faculté des Sciences II, Jdeidet P.O. Box 90656, Lebanon
*
Author to whom correspondence should be addressed.
Remote Sens. 2022, 14(14), 3422; https://doi.org/10.3390/rs14143422
Submission received: 15 June 2022 / Revised: 6 July 2022 / Accepted: 8 July 2022 / Published: 16 July 2022
(This article belongs to the Special Issue Remote Sensing of Atmospheric Aerosol Using Spaceborne Observations)

Abstract

:
East Asia is the second-largest mineral dust source in the world, after the Sahara. When dispersed in the atmosphere, mineral dust can alter the Earth’s radiation budget by changing the atmosphere’s absorption and scattering properties. Therefore, the mineralogical composition of dust is key to understanding the impact of mineral dust on the atmosphere. This paper presents new information on mineralogical dust during East Asian dust events that were obtained from laboratory dust measurements combined with satellite remote sensing dust detections from the Infrared Atmospheric Sounding Interferometer (IASI). However, the mineral dust in this region is lifted above the continent in the lower troposphere, posing constraints due to the large variability in the Land Surface Emissivity (LSE). First, a new methodology was developed to correct the LSE from a mean monthly emissivity dataset. The results show an adjustment in the IASI spectra by acquiring aerosol information. Then, the experimental extinction coefficients of pure minerals were linearly combined to reproduce a Gobi dust spectrum, which allowed for the determination of the mineralogical mass weights. In addition, from the IASI radiances, a spectral dust optical thickness was calculated, displaying features identical to the optical thickness of the Gobi dust measured in the laboratory. The linear combination of pure minerals spectra was also applied to the IASI optical thickness, providing mineralogical mass weights. Finally, the method was applied after LSE optimization, and mineralogical evolution maps were obtained for two dust events in two different seasons and years, May 2017 and March 2021. The mean dust weights originating from the Gobi Desert, Taklamakan Desert, and Horqin Sandy Land are close to the mass weights in the literature. In addition, the spatial variability was linked to possible dust sources, and it was examined with a backward trajectory model. Moreover, a comparison between two IASI instruments on METOP-A and -B proved the method’s applicability to different METOP platforms. Due to all of the above, the applied method is a powerful tool for exploiting dust mineralogy and dust sources using both laboratory optical properties and IASI detections.

1. Introduction

Mineral dust is the product of wind erosion of the land surface in arid and semi-arid regions [1]. Due to its essential impact on the climate system, more attention has been paid to mineral dust, which plays a fundamental role in air quality [2]. Moreover, climate change and desertification amplify global dust emissions in the atmosphere [3]. Dust can directly perturb the radiative flux by interacting with solar and thermal radiation through absorption and scattering processes [4]. It can also indirectly affect clouds, ice formation, and nucleation [5]. Climate alteration depends on the physicochemical properties of dust, since the forcing effect is associated with dust mineralogical composition changes in the atmosphere [6]. The sulfuric acid coating can affect ice nucleation, depending on the mineral composition of dust [7]. In addition, iron solubilization depends on the dust mineralogy, and it is mainly linked to the presence of clay minerals [8].
Mineral dust presents one of the most abundant sources of Particulate Matter (PM) originating from natural sources in the atmosphere [9]. In particular, East Asia can produce up to 800 Tg y−1 of mineral dust [10], with the most frequent dust storms occurring in springtime [11]. The Gobi Desert, Taklamakan Desert, and nearby plateaus are considered the primary dust sources in Asia [12]. Dust masses are transported downwind from Mongolia and China [13], crossing the Korean Gulf and Japan [14] to the Pacific Ocean until they reach the North American continent [15], and sometimes reaching Europe [16]. One of the particularities of this region is the diversity in its mineralogical composition; the dust is rich in silicates and carbonates, which are considered source tracers in East Asia [17].
Previous studies have analyzed desert dust mineralogical properties from East Asia using experimental methods, i.e., geochemical tracing methods, to link dust mineralogy and sources depending on the geology [18]. Scanning Electron Microscopy (SEM) was used to exploit the quartz and illite/quartz ratio contents and link them to particle size distribution [19]. In addition, using X-ray Diffractometry (XRD), it was proven that, from West to East Asia, the calcite content decreases and the feldspar content increases [20]. Moreover, dust optical properties derived from Fourier transform infrared spectrometry (FTIR)—extinction coefficient spectra—exhibited mineralogical fingerprints showing chemical information about different desert dust sources [21].
Satellite instruments detect dust plume distribution and evolution at a global scale, e.g., lidars. Cloud-Aerosol Lidar with Orthogonal Polarization (CALIOP) based on the CALIPSO satellite, provide dust altitude and layer thickness information [22]. In addition, multispectral radiometers can outline dust plume evolution, e.g., the geostationary satellite HIMAWARI 8 RGB imager [23] and the Moderate Resolution Imaging Spectroradiometer (MODIS), which also differentiates natural dust from anthropogenic dust with lower Aerosol Optical Depth (AOD) values [24]. Furthermore, spectrometers with high spectral resolution allow for quantifying aerosol parameters such as the effective radius from the Atmospheric Infrared Sounder (AIRS) [25] and the Infrared Atmospheric Sounding Interferometer (IASI) [26].
Until now, no mineralogical aerosol information has been investigated from satellite spectrometers. This may be due to the challenges posed by the lack of experimental optical properties of pure minerals and dust, as well as the encountered satellite remote sensing limitations. The latter includes cloud coverage, which can mask aerosol detections, and the land surface effect, which contaminates observations. In particular, East Asian dust is uplifted near the surface in the troposphere above the continent [27], where the Land Surface Emissivity (LSE) variability affects remote sensing detection [28]. This presents a primary error source, as it impacts clear sky and dust layer detection above the land [29].
This work investigates the capability of IASI spectra to provide the composition of mineralogical dust using the optical properties of pure minerals found in the laboratory. In Section 2, the IASI instrument is demonstrated to have different advantages in infrared detection. We also discuss the false IASI dust detection caused by the LSE and the use of a mean monthly emissivity atlas that can underestimate or overestimate the IASI radiances. Then, we introduce a new LSE correction method to optimize the LSE dataset; a new diagram scheme is presented with the optimization equations. Next, we determine the optical thickness spectrum derived from IASI radiances, and we use it to verify the LSE optimization method. In Section 3, we present new experimental optical properties (i.e., the extinction coefficient spectra) measured using Thermal Infrared (TIR) data for Gobi dust and pure minerals (quartz, illite, and calcite). An effective extinction coefficient is simulated using a linear combination of the pure mineral extinctions spectra to reproduce both the Gobi dust spectrum and IASI dust detection. In Section 4, laboratory measurements are compared to the IASI optical thickness, showing the same molecular features. Finally, we couple the IASI optical thickness with a linear combination of pure mineral spectra to compute the mineralogical dust mass weights. In Section 5, we apply the method to a dust storm that occurred between 3–7 May 2017, using IASI observations based on METOP-A. Finally, we summarize the work by comparing the results with METOP B and a second dust event between 14–22 March 2021.

2. Gobi Dust Detection from Satellite Remote Sensing

2.1. IASI

The IASI instrument is a central element of the METOP satellite series launched by the European meteorological polar orbit. Developed by CNES and in cooperation with EUMETSAT, three sun-synchronized METOP satellites (-A, -B, and -C) have been dispatched in the last 15 years with IASI-A, -B, and -C on board, and in the next 20 years, a new generation of IASI-NG will continue the IASI mission with increased resolution and radiometric performance [30]. The instrument scans in nadir view with a swath of 2200 km. Each field of view corresponds to 2 × 2 circular pixels, each with a 12 km diameter footprint in nadir. The IASI covers a continuous infrared spectral range between 645 and 2760 cm−1 (3.62 and 15.5 μm) and provides 8461 channels with a high spectral resolution of 0.5 cm−1 and low radiometric noise [31]. In addition, IASI has shown high-stability performance over time, with 1.8 million atmospheric detections per day above the Earth’s surface [32]. It was fundamentally developed for meteorological operations and atmospheric gas estimation [33,34]. Recently, studies have proven the use of IASI spectral detections in aerosol applications [26,35]. However, few have been exploited due to the lack of optical property references that are a fundamental element in aerosol characterization.
Figure 1 shows three IASI detection examples of a clear sky above the sea, clear sky above the desert, and mineral dust. An observation of a clear sky above the sea with a negligible LSE contribution shows a flat brightness temperature spectrum in the atmospheric windows (780 to 980 cm−1 and 1070 to 1210 cm−1). Conversely, the detection of a clear sky above the desert has high LSE variability that is characterized by a peak at 1159 cm−1, with a lower shift in its brightness temperature between 1069 and 1250 cm−1. These two features appear due to a high reflectance phenomenon called the ‘Reststrahlen Effect’ that occurs on surfaces rich in quartz and arises from coherent oscillations of vibrational optical phonon modes [36]. It is triggered by a sudden drop in the real refractive index value [37]. As the real part becomes smaller than the imaginary part, the reflectance increases to a value of 1, which results in a quartz-rich surface decreasing in the LSE to values of less than 1 in the Reststrahlen region.
Dust is detectable in the atmospheric window, where only narrow gas bands are exhibited. It produces a ’V shape’ and the LSE signal can affect the spectrum when detections are above the desert. Carbon dioxide, ozone, and water vapor enhance wide absorption bands (displayed in shaded gray in Figure 1) as well as narrow absorption bands in the spectra [33]. For simplicity, the wide bands are removed from the IASI spectra discussed in the next graphs. IASI dust spectra are selected by applying conditions to the difference in the brightness temperature Δ T B , which is calculated by subtracting two brightness temperature values T B , v 1 and T B , v 2 for two wavenumbers v 1 and v 2 respectively, and is written as follows:
Δ T B = T B , v 1 T B , v 2
In this study, two brightness temperature differences were considered for dust selection: Δ T B 1 = T B , 809.25 T B , 988   and Δ T B 2 = T B , 1191.25 T B , 1112 . Particular wavenumber values were selected to prevent the selection of narrow water vapor bands in the spectrum. Without considering an LSE correction, the dust selection can be misleading, as mineral dust detection can be more likely inclined due to the surface signal, especially in the band where the Reststrahlen region is present. Figure 2a shows the IASI dust selection ( Δ T B 1 and Δ T B 2 ) during a Gobi dust storm on 4 May 2017 at 3:00 UTC; however, to visualize and study the surface effect, only Δ T B 2 is illustrated. A false dust detection in the dashed black circle was selected, while the same region detected by MODIS showed a negligible daily average AOD (Figure 2b). The false detection and selection from the IASI spectra are related to the LSE constraints.
To solve the problem found in aerosols and gases retrievals, many studies have used an IASI mean monthly emissivity dataset provided by Zhou et al. (2014) with 0.25 ° × 0.25 ° latitude-longitude grids [38,39,40]. The data are produced with an algorithm that validates the surface emissivity products from the IASI by comparing and validating them with independent in situ and satellite measurements [41,42,43].
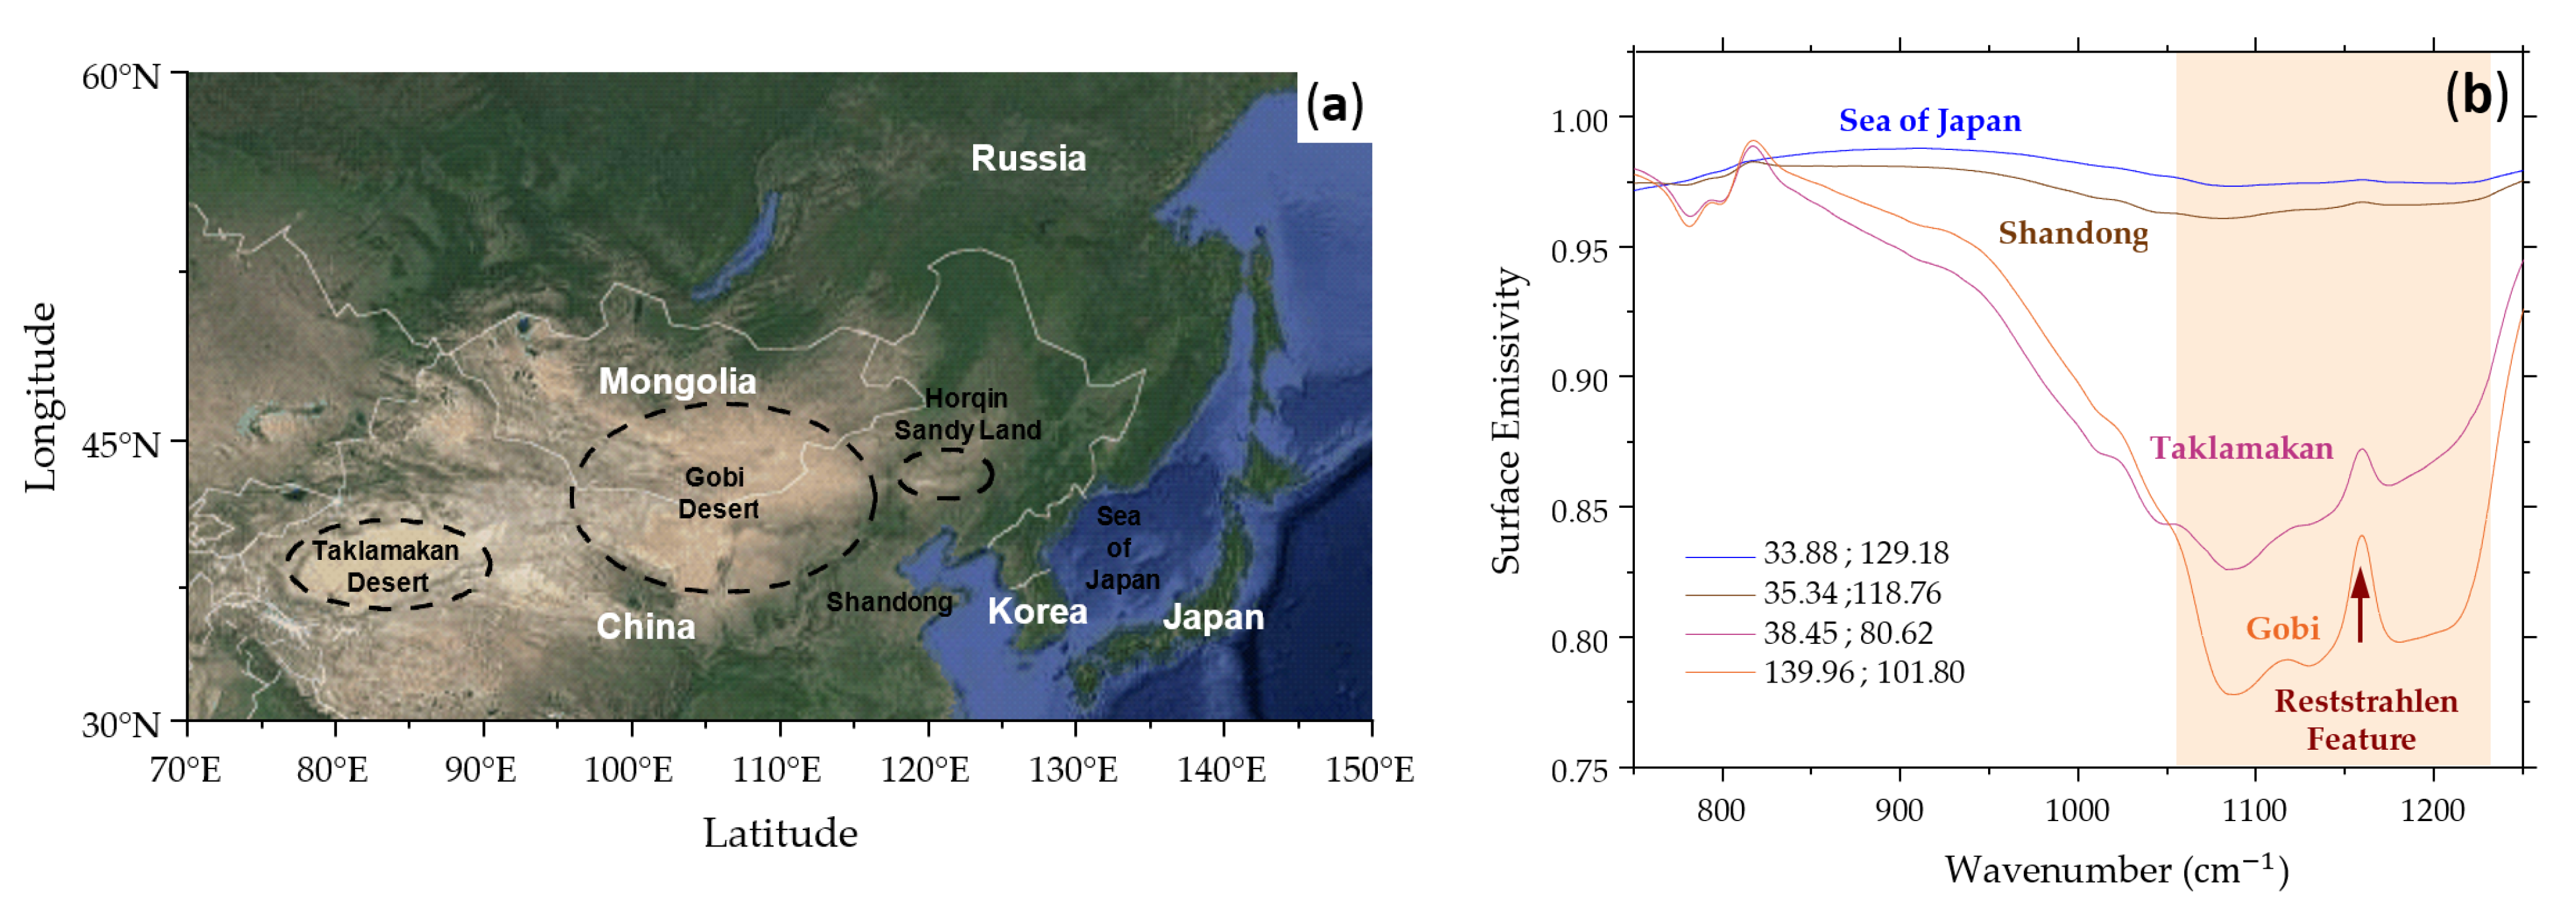
For example, the topography in East Asia is diverse. There are desert surfaces such as the Gobi and Taklamakan, as well as the Horqin Sandy Land between North China and Mongolia. In contrast, more vegetation is found in the eastern regions, with urban and populated cities, such as Shandong (Figure 3a). Based on the mean monthly emissivity dataset for May, the grids of four different surfaces are shown in Figure 3b; the LSE variability is low at the Sea of Japan and Shandong [44]. Notably, the surface composition is rich in quartz, e.g., from the Taklamakan and Gobi Deserts, showing high LSE variability between 1069 and 1250 cm−1, with a feature peak at 1159 cm−1, which is identical to the spectral desert detection from the IASI illustrated in Figure 1.
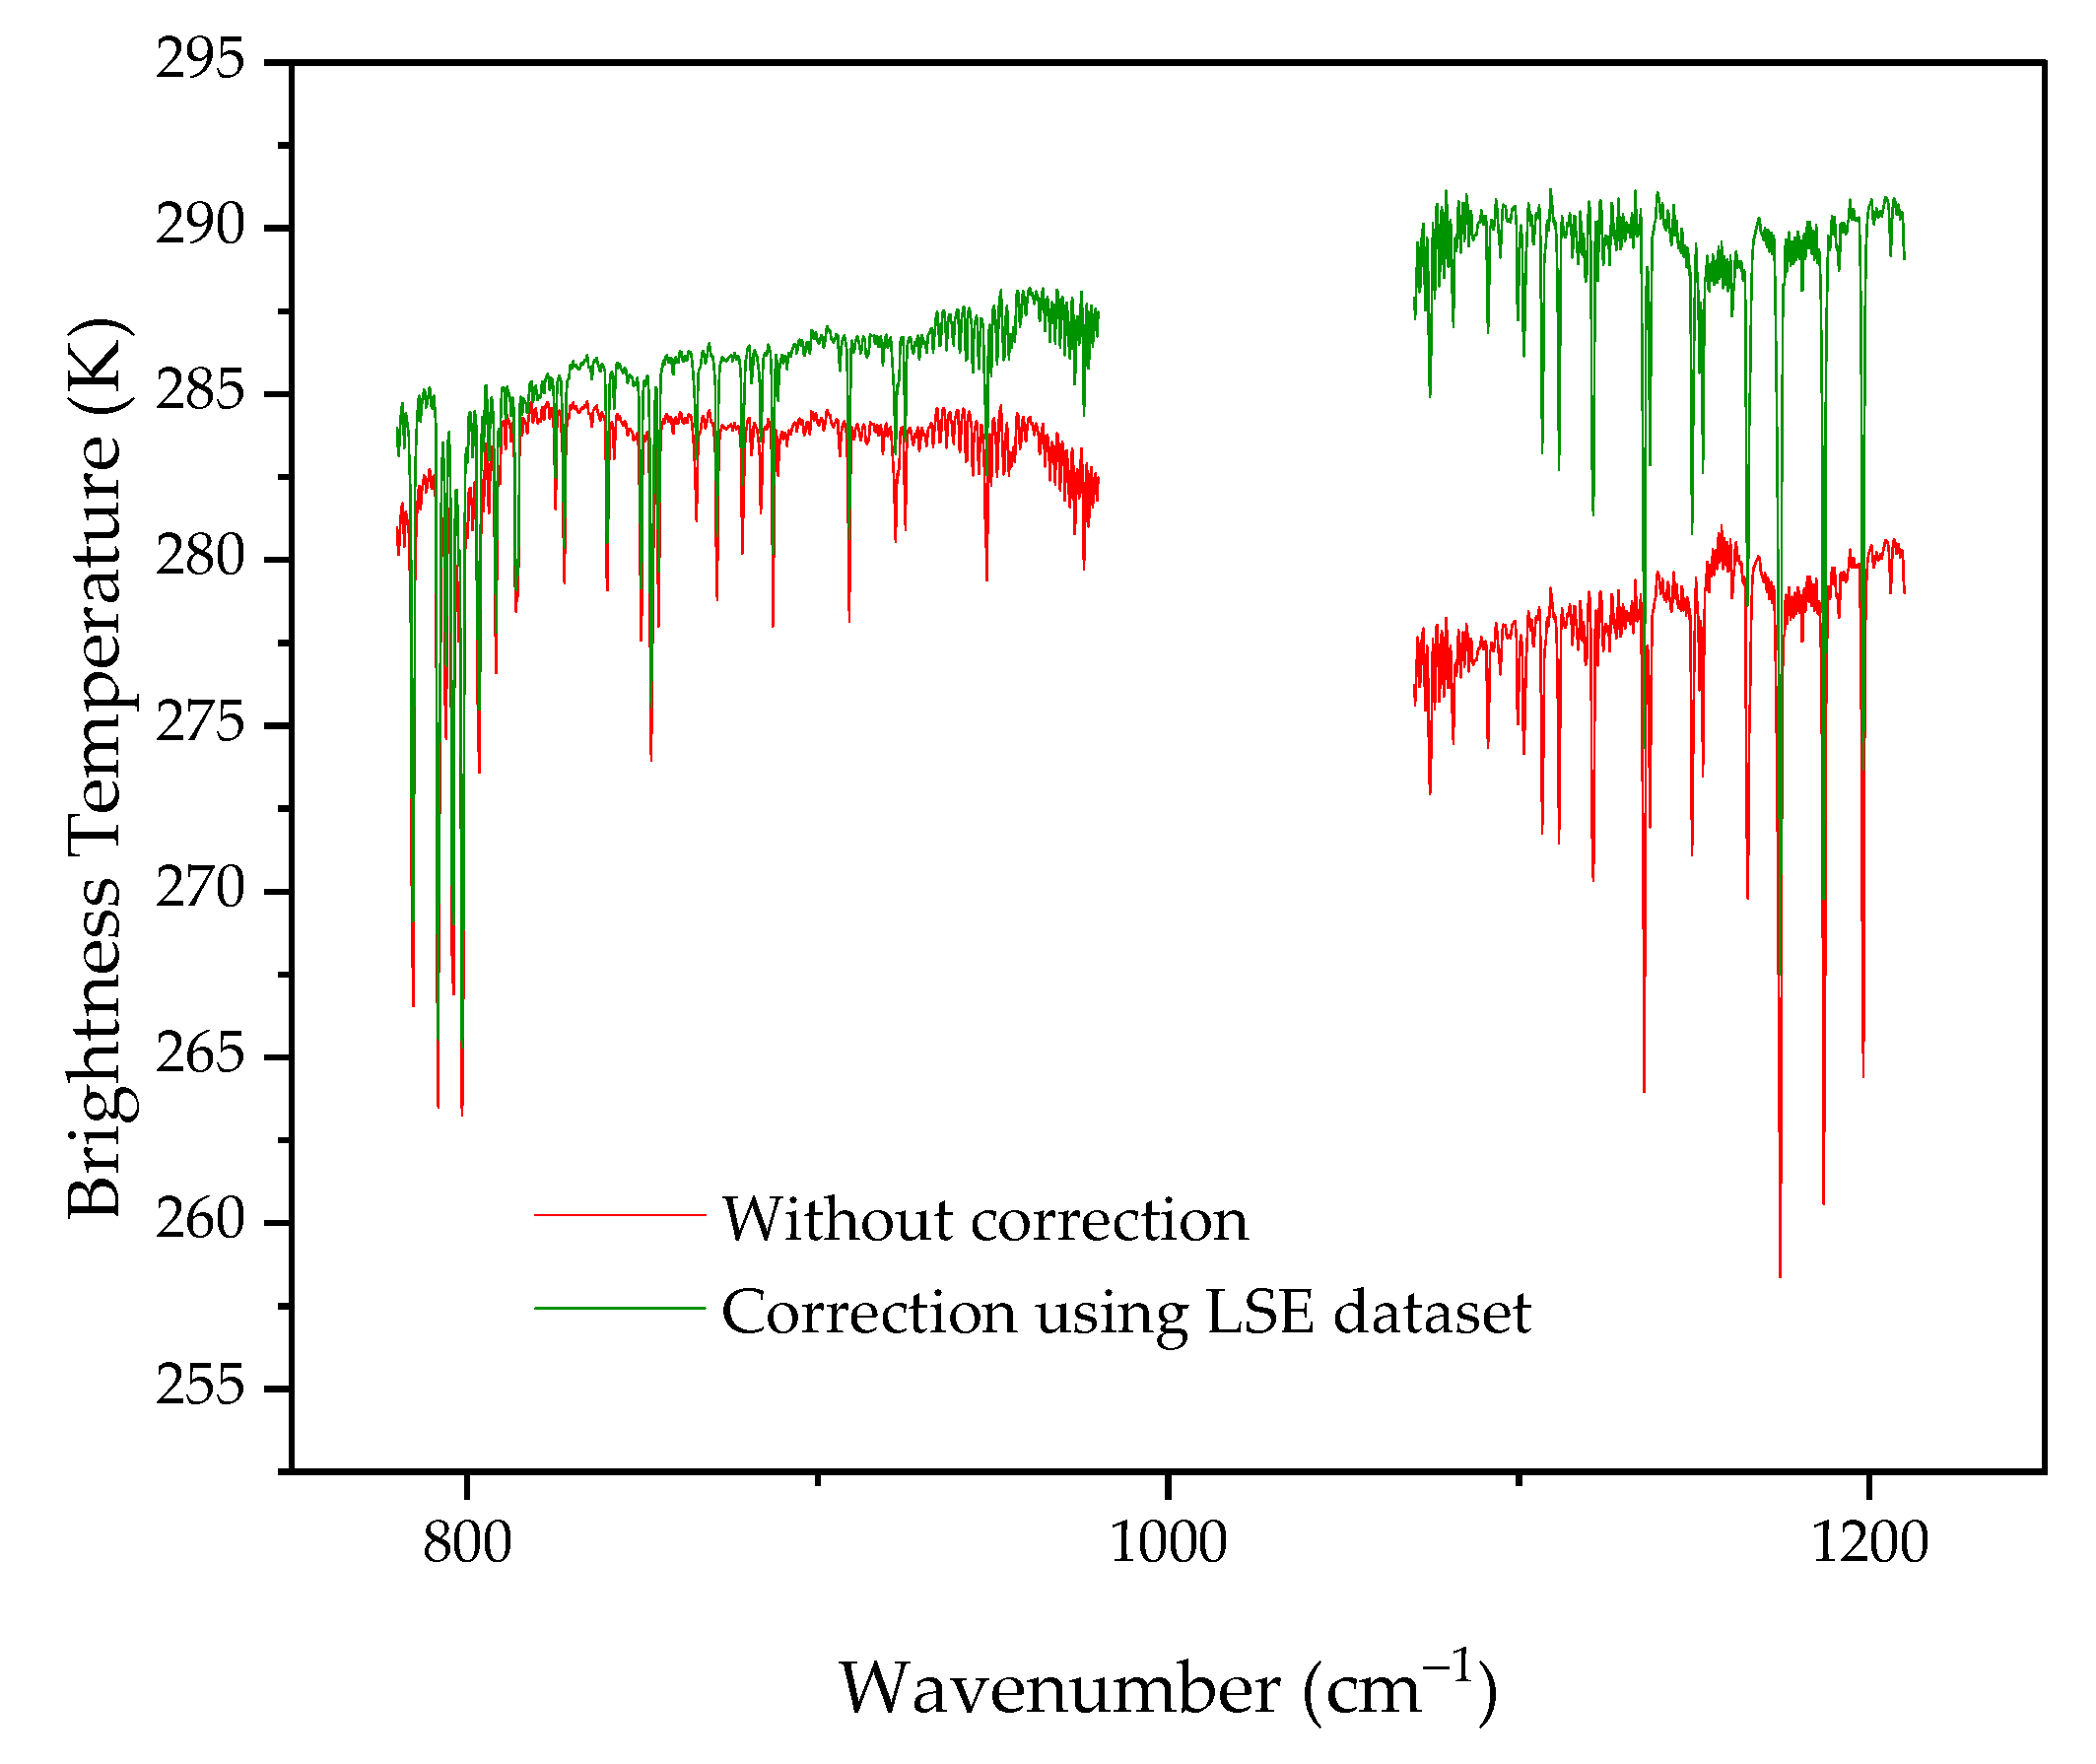
The direct use of this dataset can underestimate or overestimate the spectral observation, and this can be due to the LSE variability caused by diurnal and seasonal cycles, the satellite viewing angles, or surface type variation [45]. The correction is expected to reproduce a clear sky spectrum above the sea. This is not the case in the example shown in Figure 4. with an over correction of a desert spectrum in green. The brightness temperature is strongly altered after applying the correction at 1059 cm−1, resulting a trough instead of the Reststrahlen peak and a higher shift in the brightness temperature between 1069 and 1250 cm−1 instead of a flat clear sky above the sea detection. This result indicates that the direct use of the dataset can amplify the LSE correction and alter the atmospheric information in question. Hence, optimization of the LSE is crucial to finding an optimal aerosol quantification. As a result, establishing the surface contribution and removing it from satellite observations remains challenging.

2.2. Surface Emissivity Optimization Method and Dust Spectral Selection

The intensity of the Reststrahlen feature is proportional to the particle size. As the mean particle diameter decreases, the surface scattering increases, resulting in increased absorption energy and hence a lower reflectance [46]. Based on this, the Reststrahlen feature can be used as a surface effect indicator; it is highly visible on desert surface detections compared to airborne dust. Therefore, in order to optimize the LSE effect on IASI radiances, a new methodology was developed by calculating the Reststrahlen relative value X m ( v ) of a spectrum m ( v ) for both the IASI spectral radiance and the mean monthly emissivity value at the same pixel. The method expresses the relative value between the observed spectrum with the Reststrahlen effect m w / ( v R ) at the Reststrahlen wavenumber v R = 1159 cm−1 and the expected value of the observation spectrum without the Reststrahlen effect m w / o ( v R ) and it is written as follows:
X m ( v R ) = m w / ( v R )   m w / o ( v R ) m w / o ( v R )
where m w / o ( v R ) is computed by solving a linear function of the form y = ax + b   calculated in the neighboring Reststrahlen feature and taking into consideration the narrow gas bands.
Then, we define the emissivity correction factor C as follows:
C = X L ( v R ) X ε ( v R )
With C being the ratio between the Reststrahlen relative value for the spectral radiance detection X L ( v R )   and the Reststrahlen relative value for the mean monthly emissivity spectrum X ε ( v R )   for the same detected grid, both calculated by Equation (2).
The corrected surface emissivity ε C ( v )   is estimated from the mean monthly surface emissivity ε ¯ ( v ) and the correction factor C, and it is written as follows:
ε C ( v ) = 1 + C ( ε ¯ ( v ) 1 )
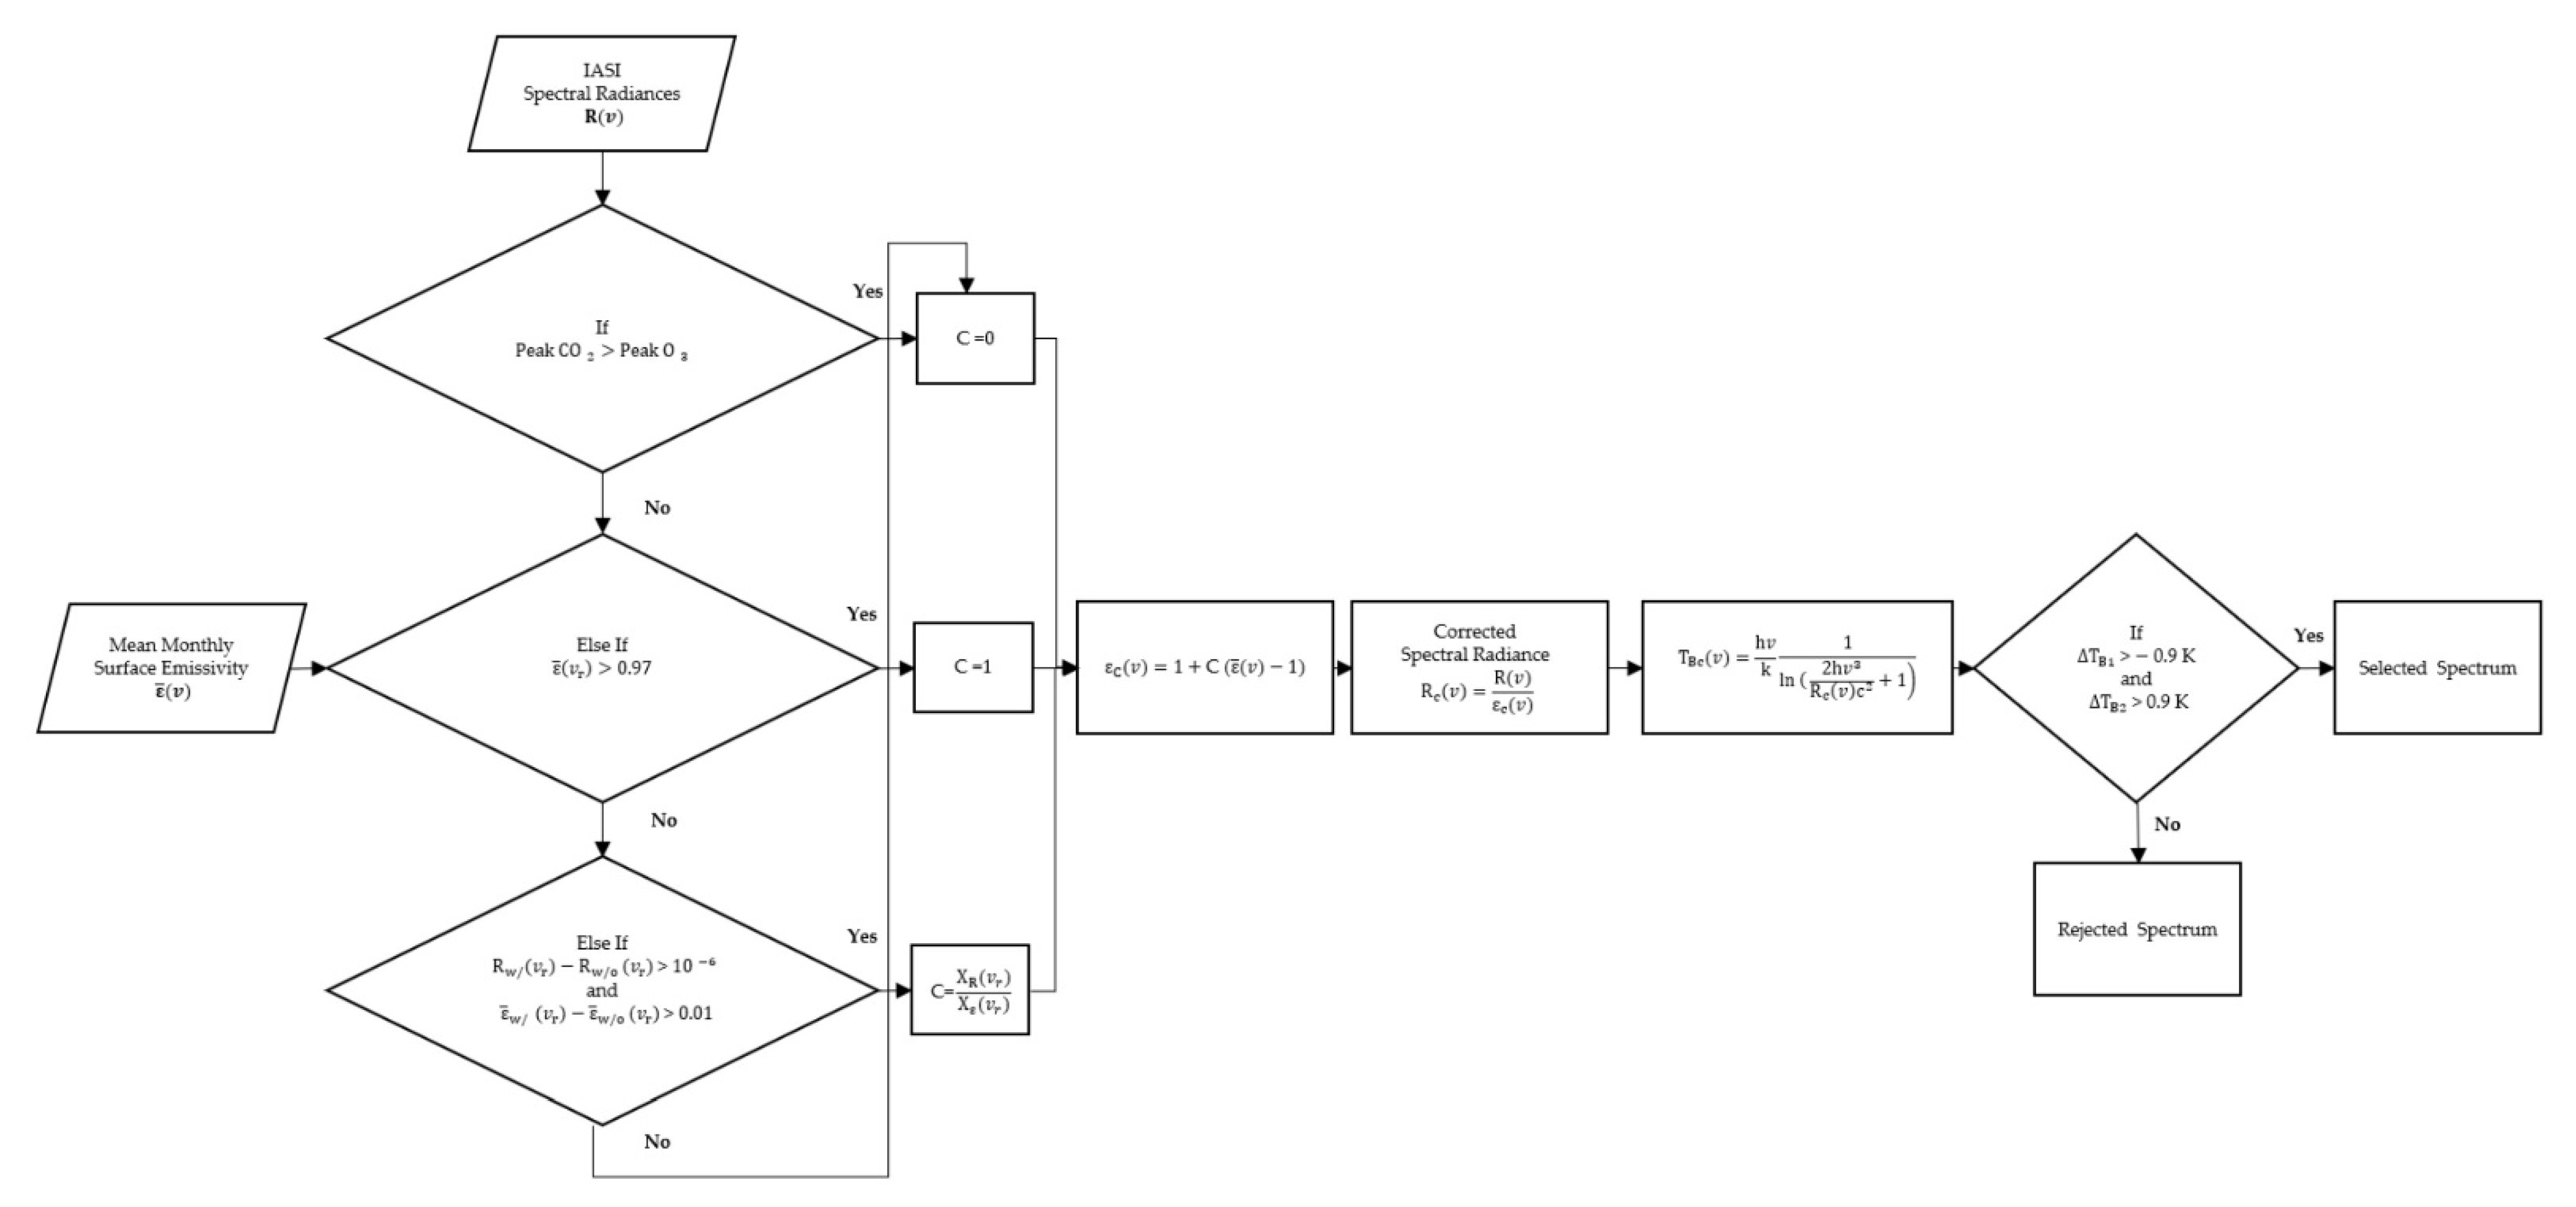
The correction in Equation (3) is calculated when a significant Reststrahlen effect is present. A minimum condition is applied to the   m w / ( v R ) m w / o ( v R ) value of both the radiance and emissivity spectra. A particular case is applied to the detection of concentrated dust layers and saturated clouds in which the surface is masked and no emissivity correction is taken into consideration. The correction factor C is 0; hence, the corrected surface emissivity ε C   is 1. The saturated cloud spectra are characterized by having a   CO 2   brightness temperature peak 668 cm−1 higher than the O 3   peak at 1044 cm−1. However, when the LSE variability is small, the Reststrahlen wavenumber ε ¯ ( v R )   approaches 1. In this case, the correction factor C equals 1, and the literature dataset is directly used ( ε C ( v ) = ε ¯ ( v ) ) . After solving Equation (4) to obtain the optimized emissivity   ε C ( v ) , the corrected spectral radiance L c ( v )   is calculated. The dust spectra are then selected by converting the radiance to the brightness temperature T Bc ( v ) spectra and applying conditions to Δ T B 1 and Δ T B 2 (defined in Section 2.1). Figure 5 illustrates the flowchart of the optimization method described.
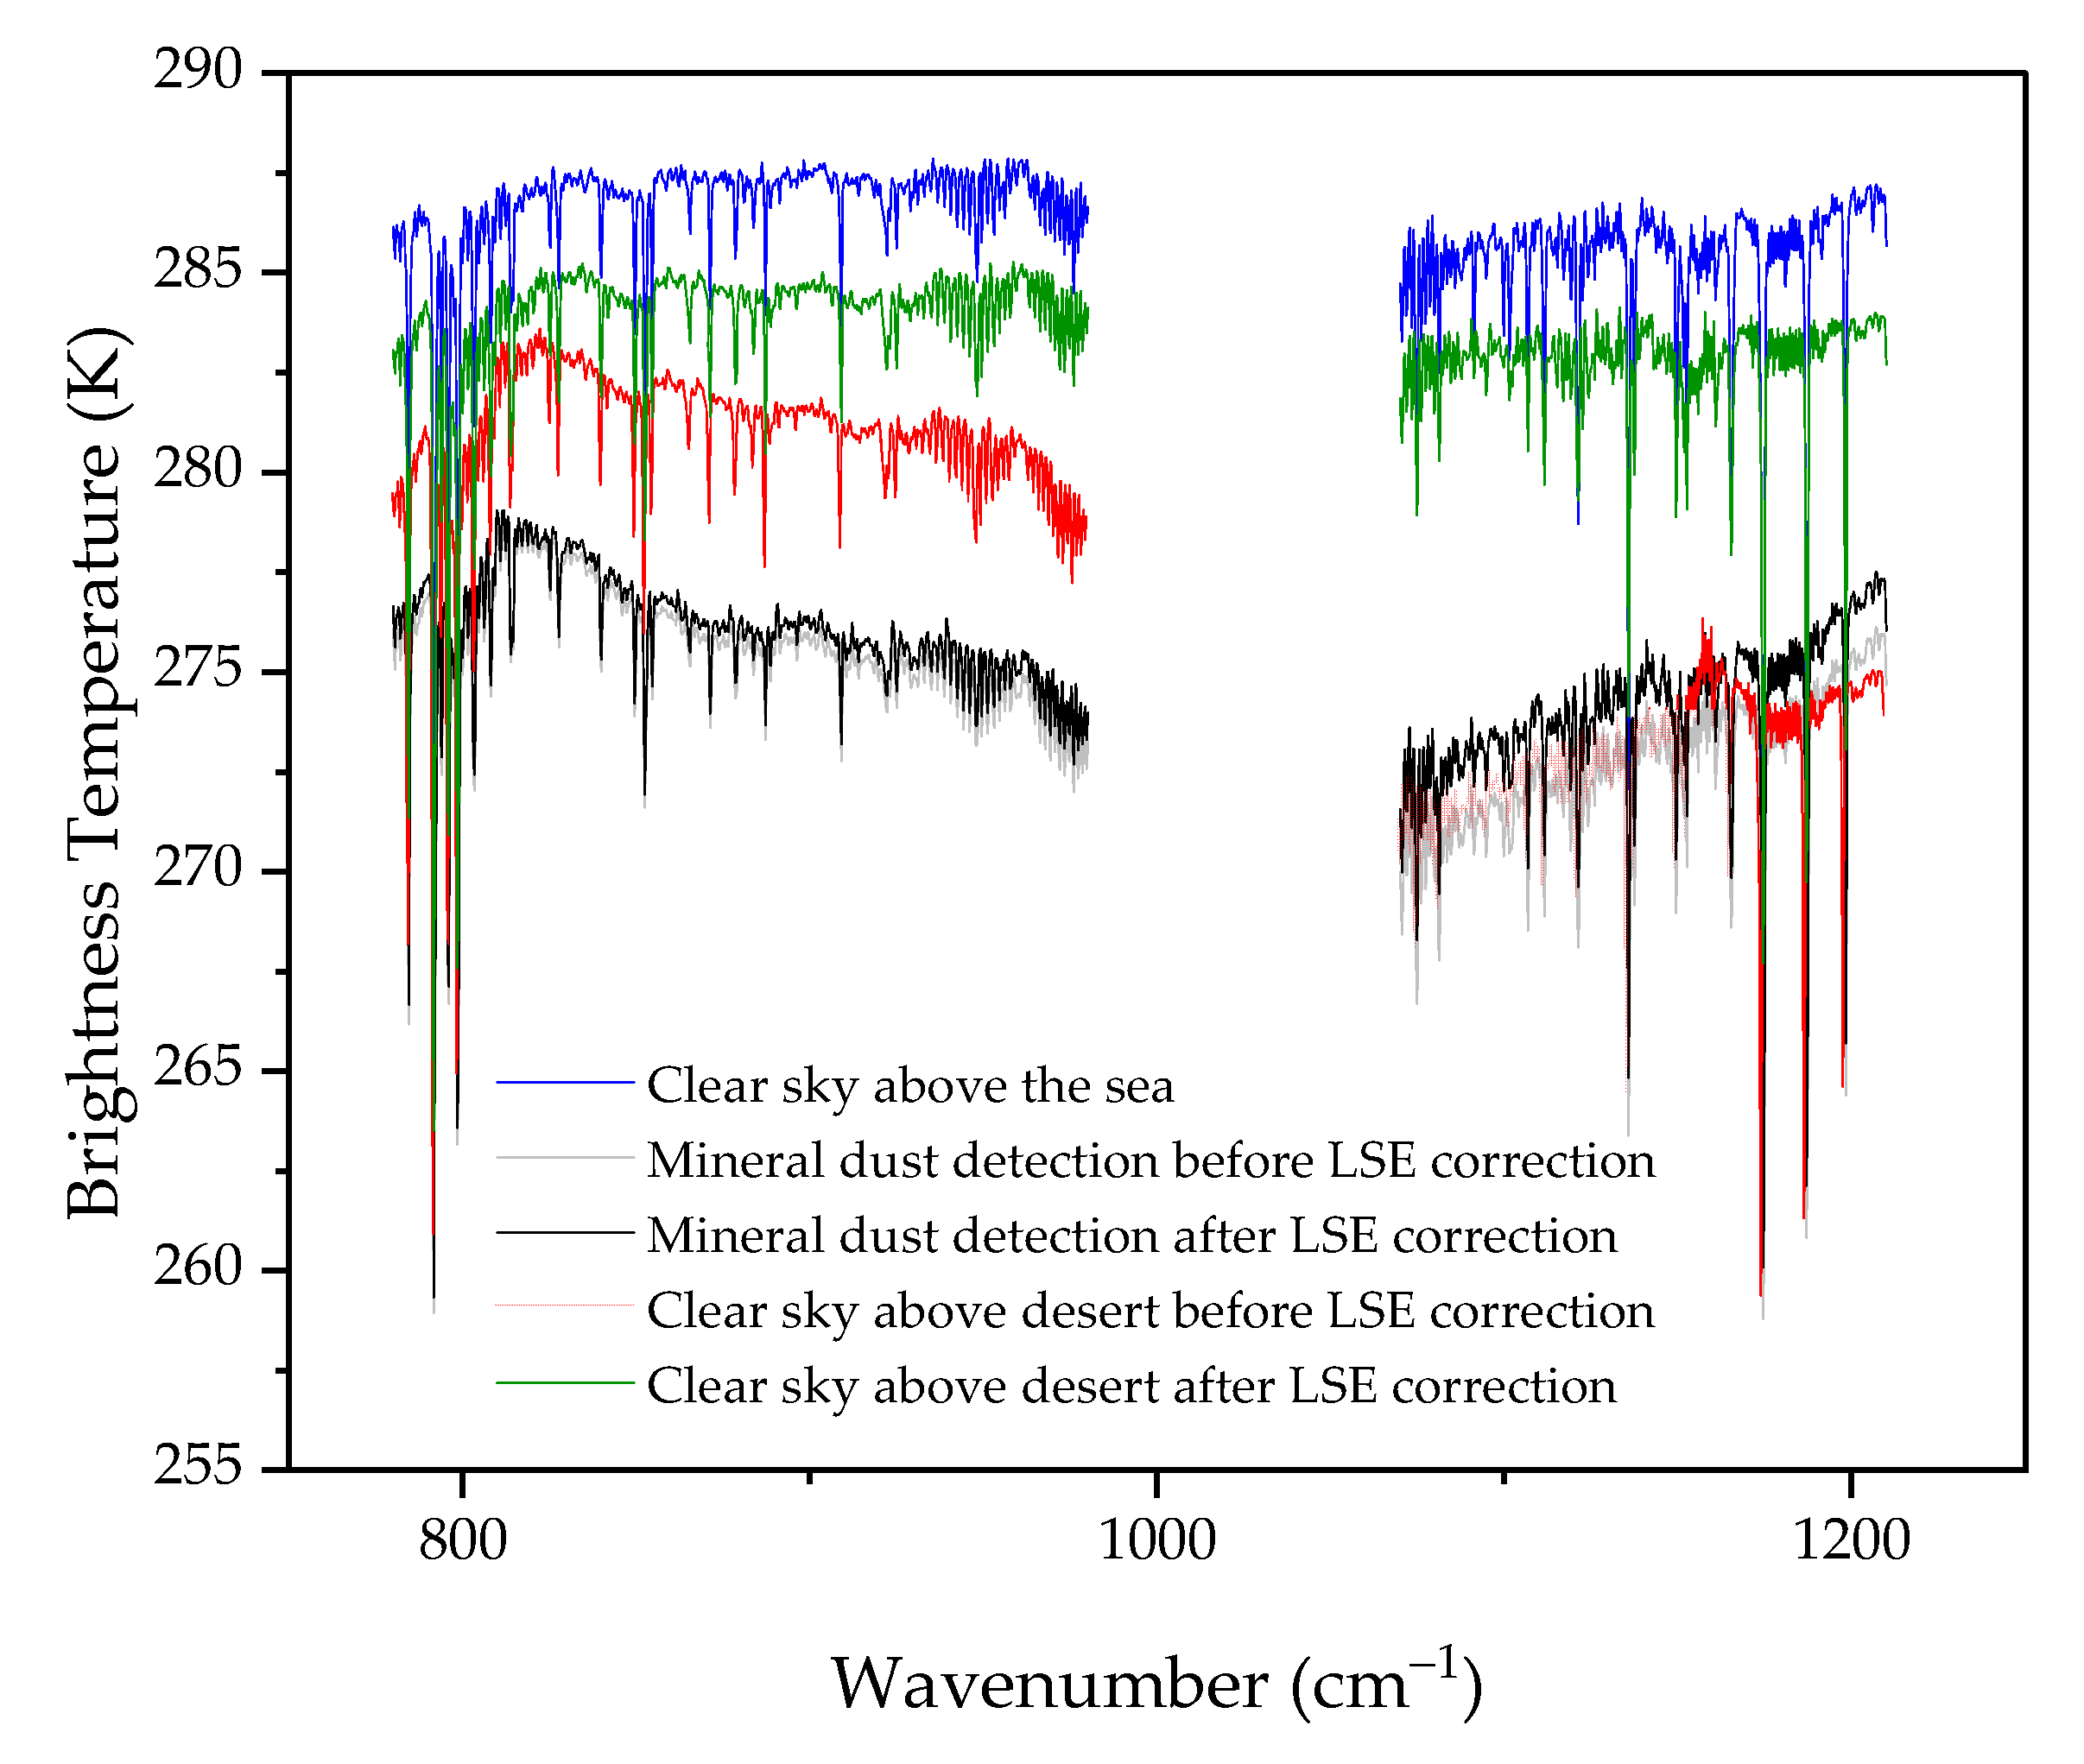
In Figure 6, the optimization method is applied to two IASI observation examples, detections of a clear sky (in red) and mineral dust (in gray) above the desert. The green spectrum shows that all the effects dominated by the Reststrahlen phenomenon are removed from the clear sky above the desert, as if a clear sky above the sea (in blue) was detected after the correction. The peak at 1059 cm−1 was optimized and the lower shift between 1069 and 1250 cm−1 was flattened. In contrast, the modification in the mineral dust detection (in black) was minimal, with the dust spectral signature maintaining a ‘V-shaped’ brightness temperature.

2.3. IASI Optical Thickness

The radiative transfer equation depends on the surface emission, the absorption in the atmosphere, and the surface reflection and scattering. In particular, the thermal window region of the spectrum is the primary contributor to the measured radiance and comes from the surface emission, and it is written as follows:
R ( v ) = ε ( v ) B ( v , T S ) e 0 H k v ( h ) dh
where the spectrum R ( v )   is a function of the surface emissivity ε ( v ) , the surface temperature T s described by the Planck function B ( v , T ) , and the total extinction   k v   of the atmospheric layers of thickness H, containing gases, aerosols, and clouds.
Consider a homogeneous and stratified dust layer of thickness L. The Beer–Lambert law can be applied to this dust layer. For an incident spectral radiance R 0 ( v )   at wavenumber v , the attenuated amount of   R obs (v) passing through a dust layer of thickness L has an extinction coefficient   K ext aerosol ( v )   resulting from the absorption and scattering, and it is written as follows:
R obs ( v ) = R 0 ( v ) e k ext aerosol ( v ) L
The incident spectral radiance R 0 ( v )   represents a clear sky spectrum above the sea where R 0 ( v )   R obs ( v ) . The spectrum is selected from the same observation date with the sea detection nearest to the dust observation.
From IASI radiances, we can calculate the optical thickness τ ( v ) , and this is obtained by the natural logarithm of the ratio of a clear sky spectral radiance   R 0 ( v ) and a spectral radiance observation R obs ( v ) :
τ ( v ) = ln ( R 0 ( v ) R obs ( v ) )
This ratio becomes independent from the Planck function B ( v , T s )   by subtracting it in the calculation, and unconstrained by the surface emissivity after applying the LSE optimization method discussed above. What remains in the equation is the aerosol extinction multiplied by the layer thickness L with an error ϵ Re , which includes noise and the remaining residue of gas present in the spectrum. Thus, Equation (7) is written as follows:
τ ( v ) = ln ( e k ext gases ( v ) · H e k ext gases ( v ) · H   k ext aerosol ( v ) · L ) = k ext aerosol ( v ) L + ϵ τ
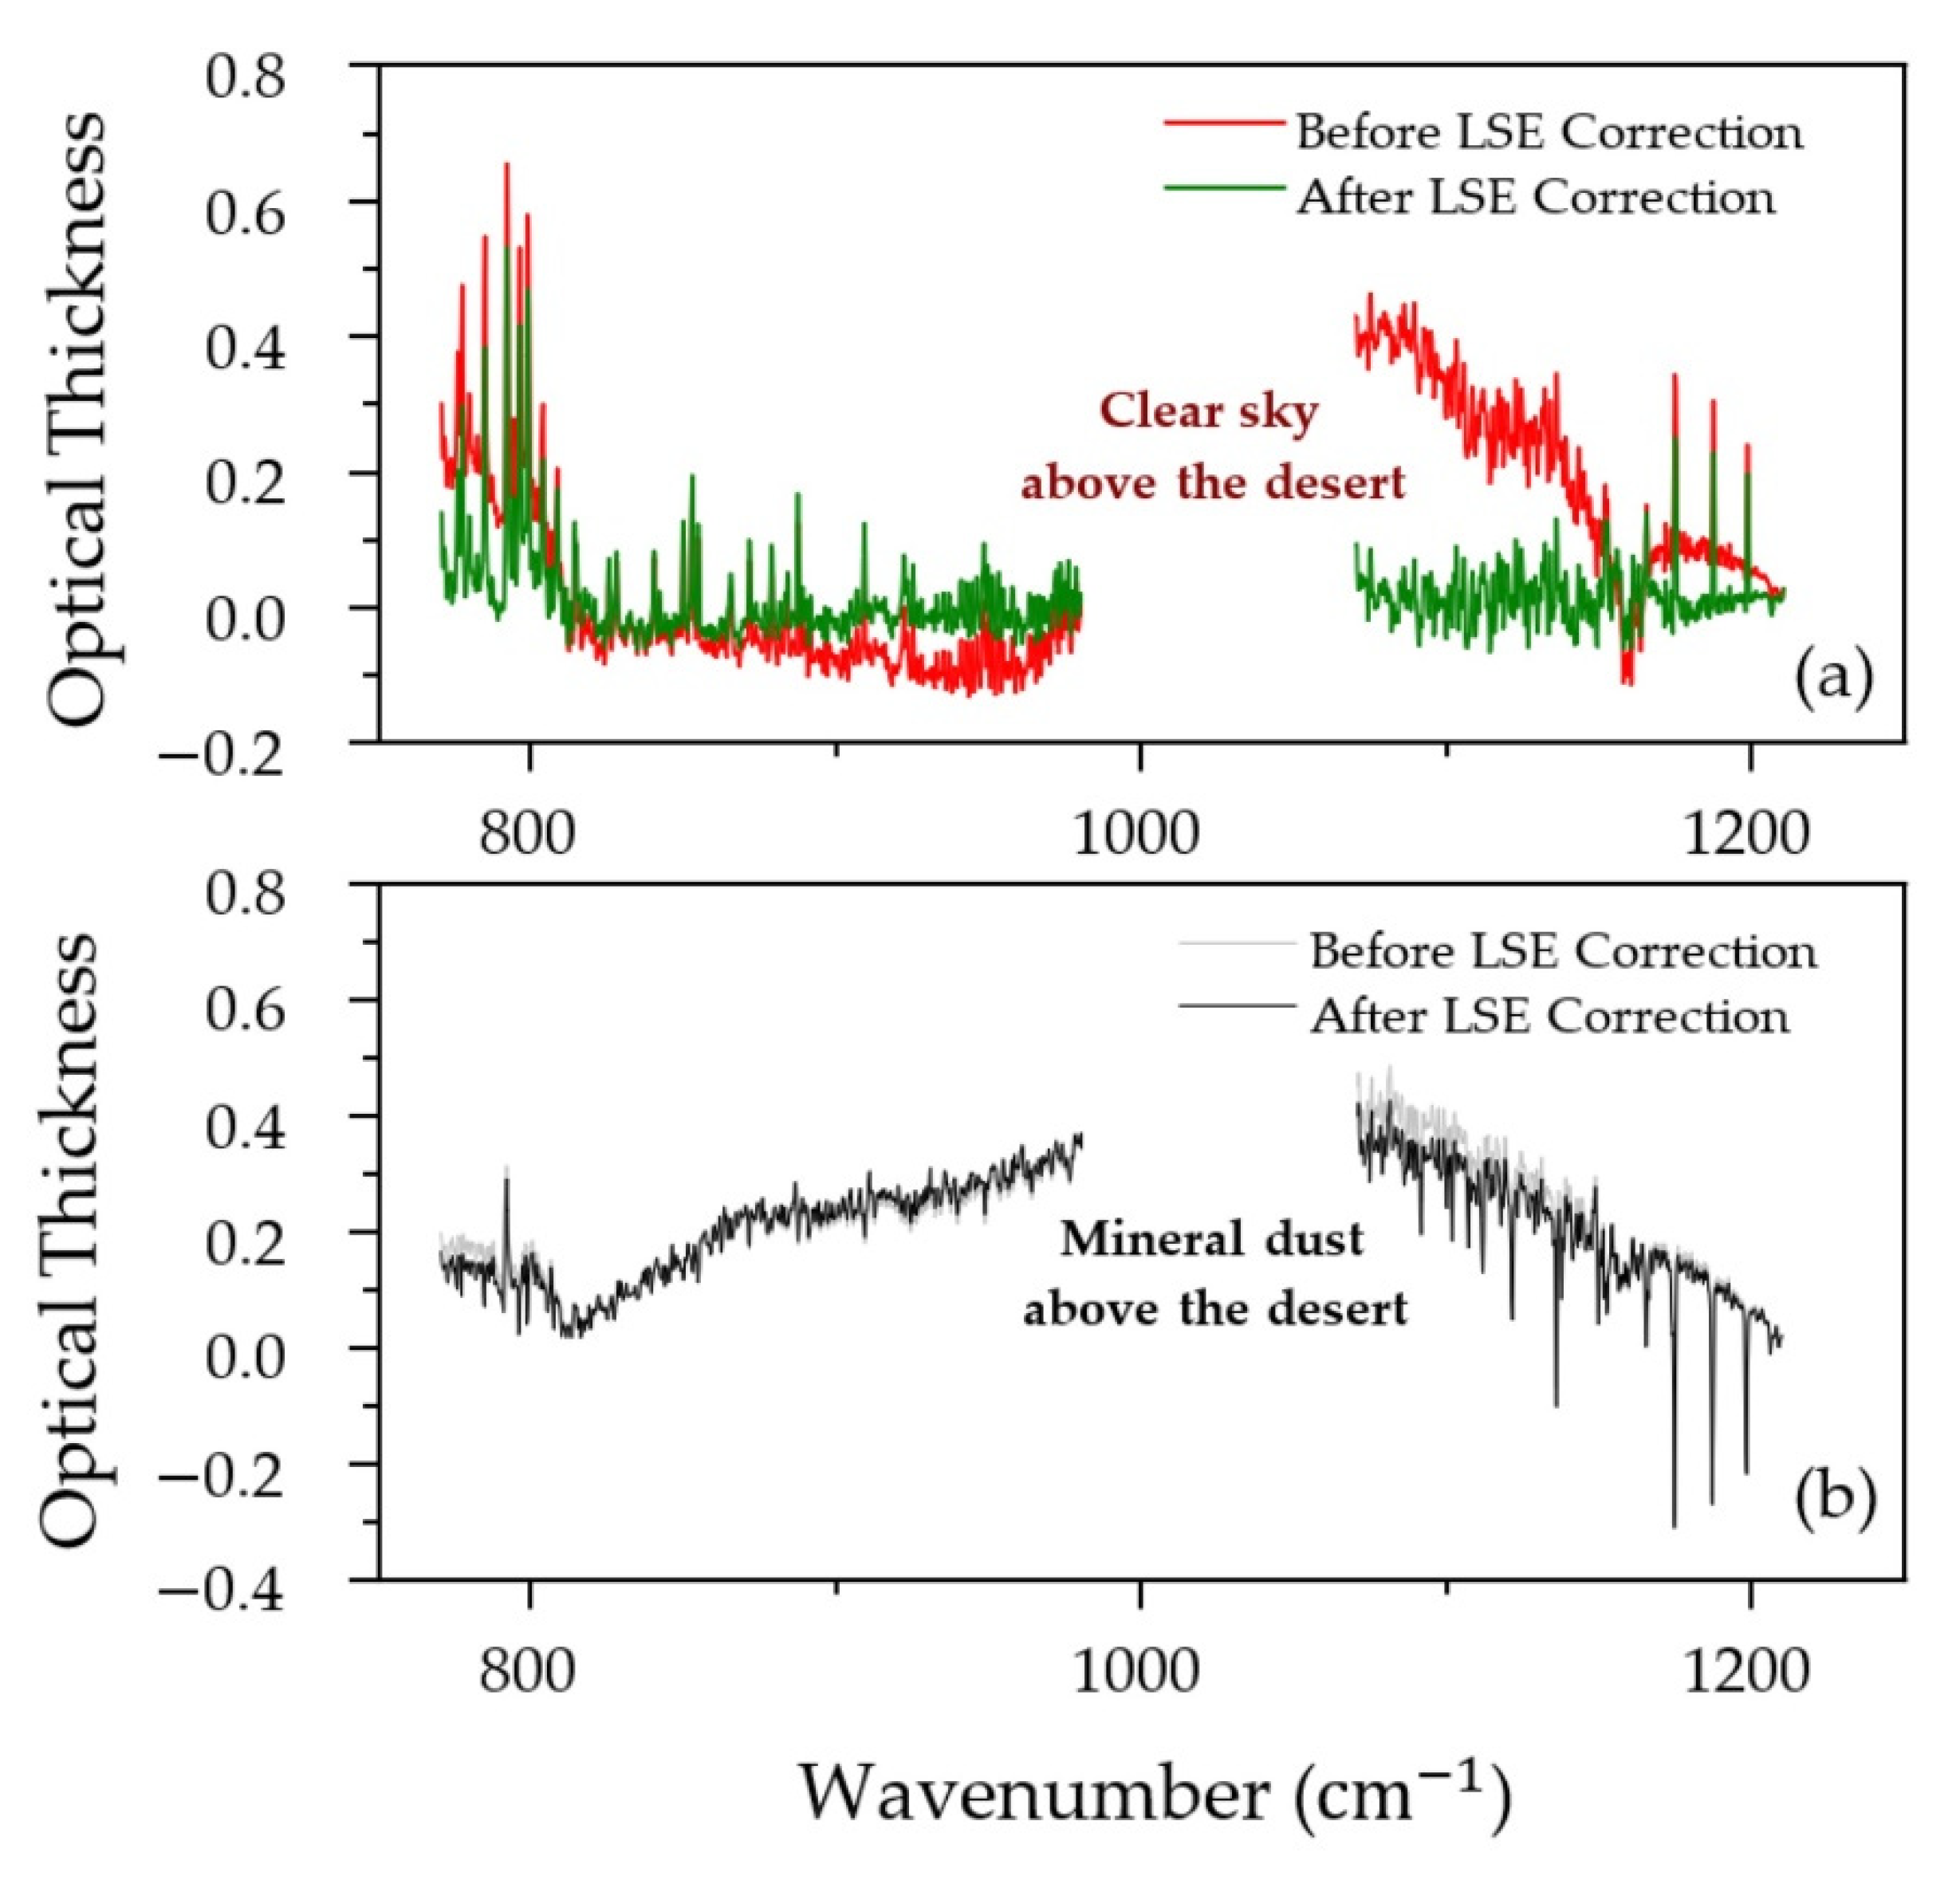
Equation (8) has been applied to the example spectra shown in Figure 6. Before the LSE correction of the clear sky detection above the desert, the optical thickness spectrum has an extinction coefficient of a land surface, i.e., a sand surface contaminated by the Reststrahlen effect (Figure 7a). After the LSE correction, only the optical thickness approaches zero with no aerosol features. This indicates that the spectral signal comes entirely from the land surface. However, merely a minor optimization affected the optical thickness of the mineral dust detection above the desert (Figure 7b) with an aerosol extinction signal remaining. This result verifies that the LSE optimization method corrected only land surface signals without removing the aerosol fingerprints that present crucial data to quantify the aerosol physicochemical properties.

2.4. Cloud Selection

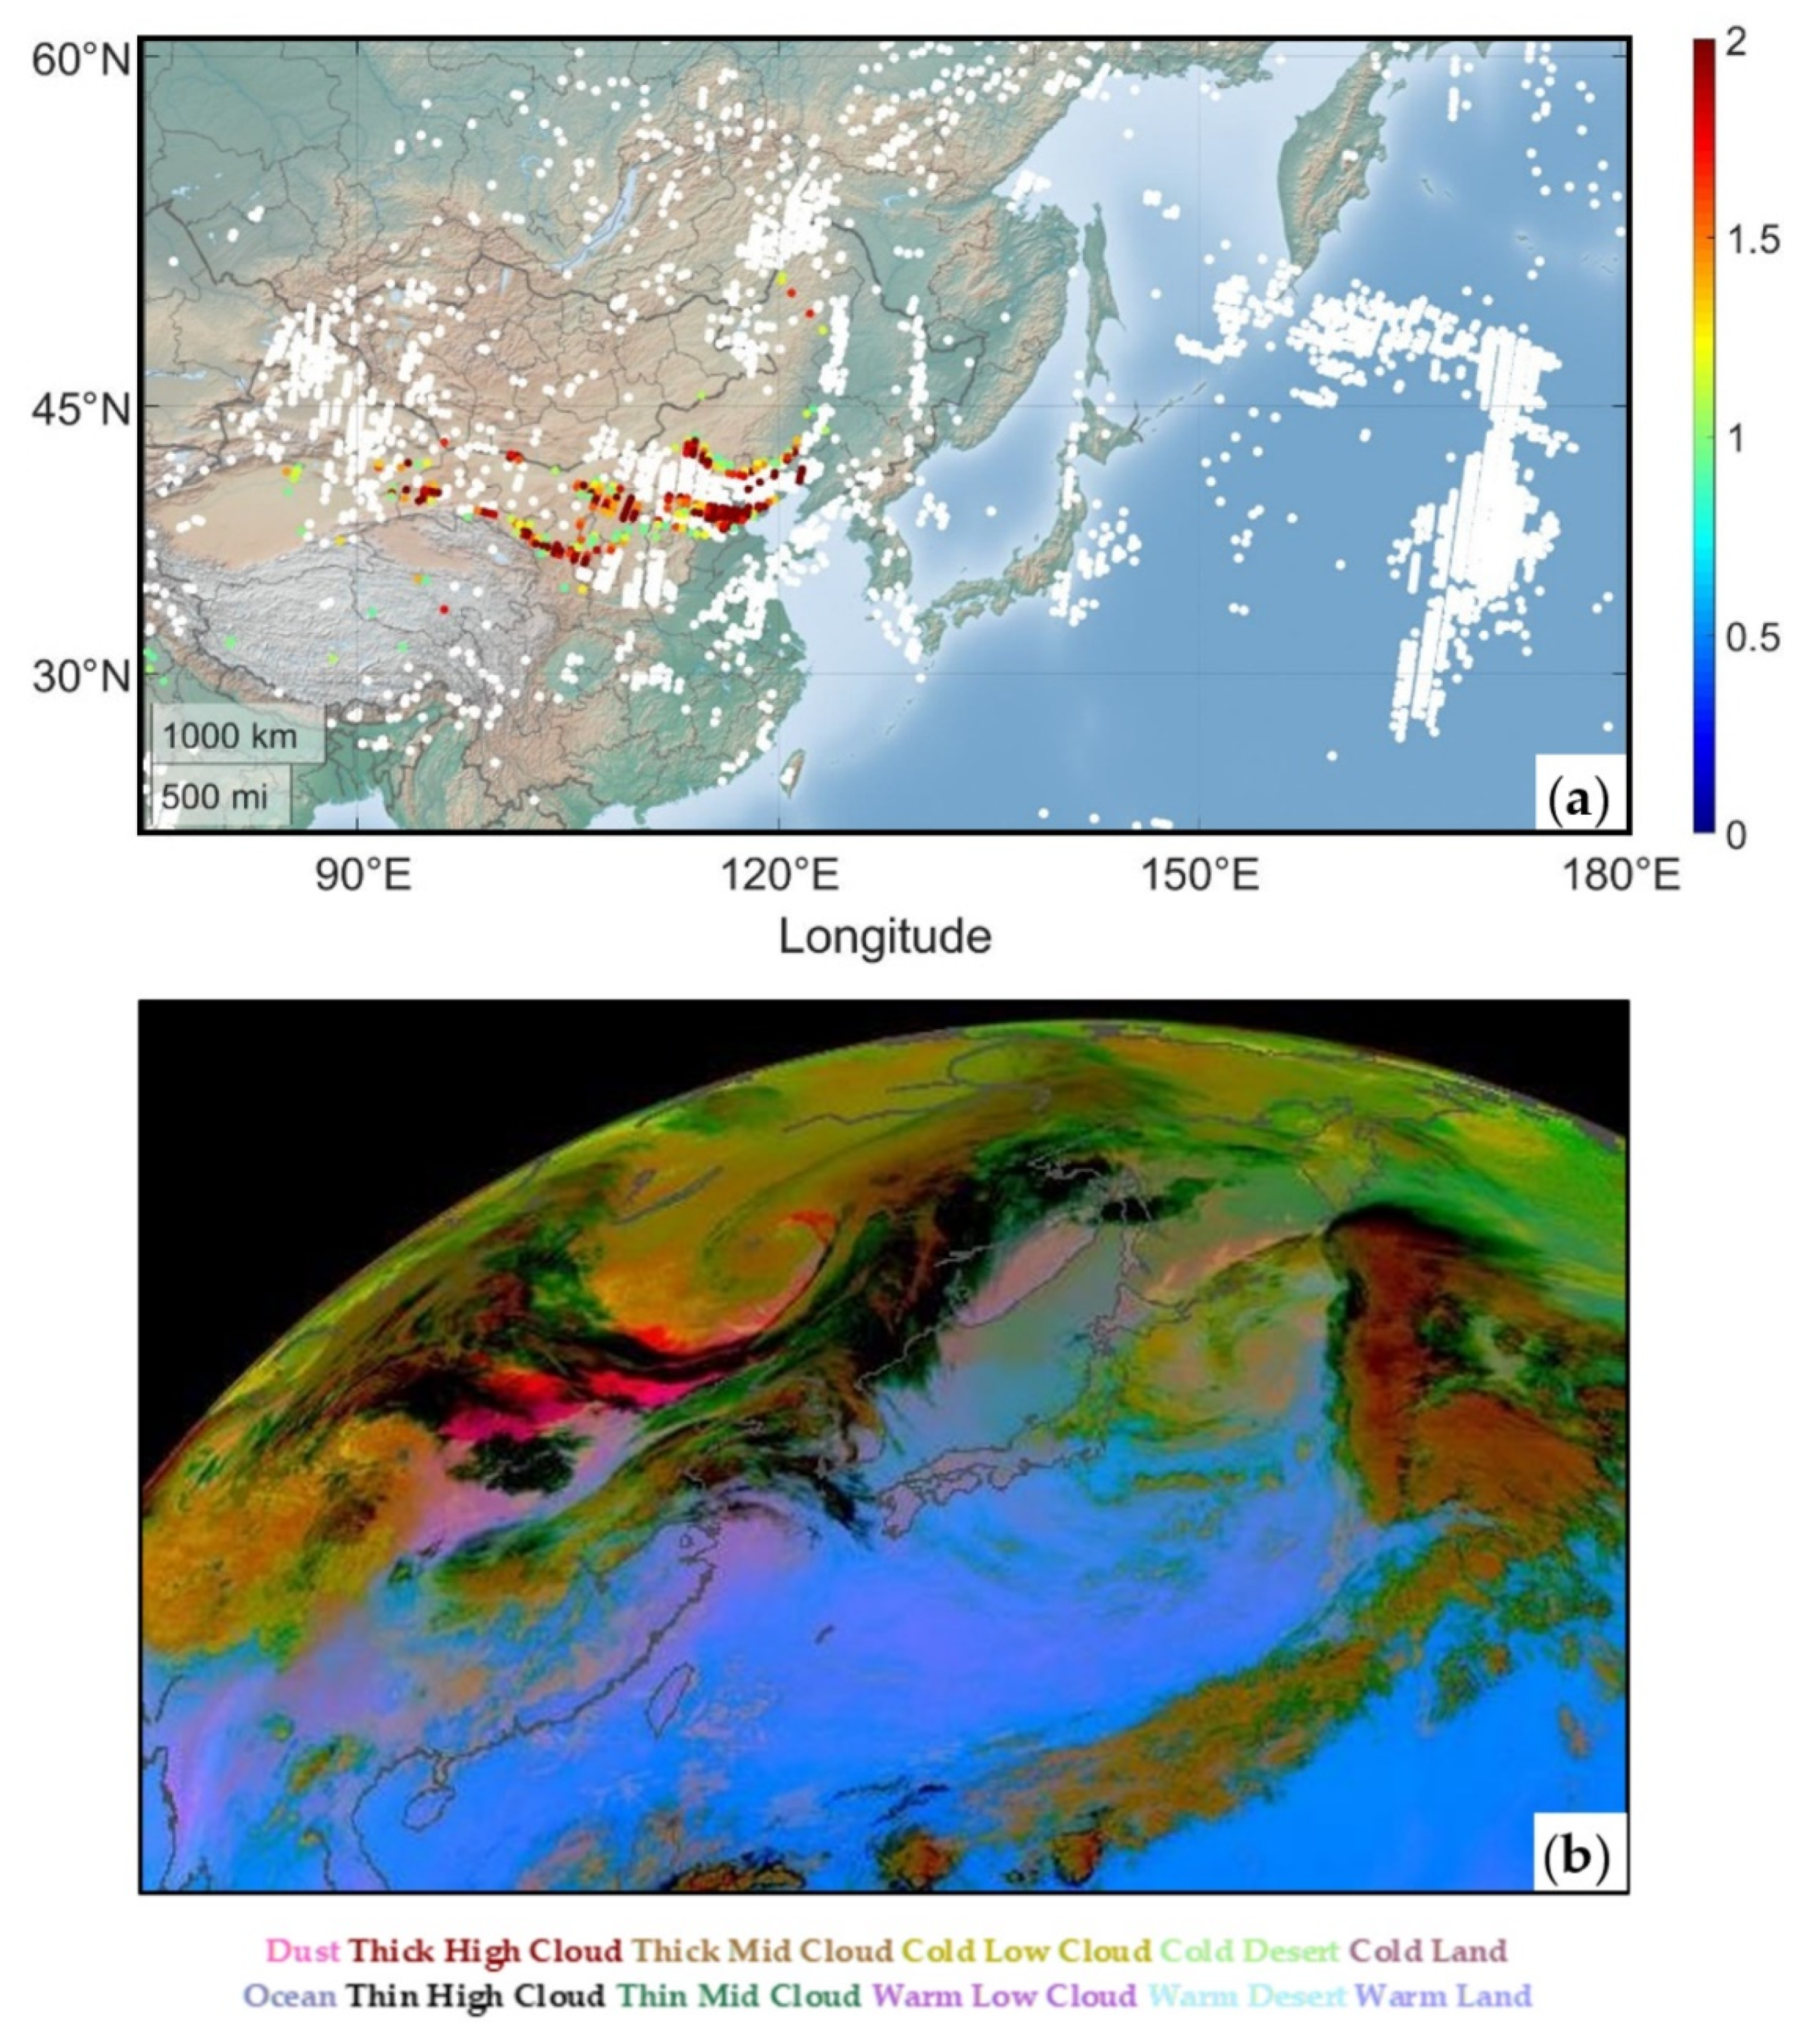
East Asia is also characterized by high coverage of clouds that can mask aerosol detection. The cloud selection was computed using a principal component analysis (PCA) code developed in Laboratoire d’Optique Atmosphérique (LOA) [47]. An example is shown in Figure 8a for IASI detection, where clouds (in gray) mixed with the dust plume and separated the detection into four different loads. IASI detection and selection are consistent with the RGB image in Figure 8b showing geostationary HIMAWARI 8 RGB imagery, where thin high clouds (in olive color) contaminated the plume into four different aerosol sections (in pink). The IASI map with a Mercator projection shows homogeneous cloud selection with the same morphology but with a different projection than the HIMAWARI 8 imagery, which has a polar projection. The inverted ‘L-shape’ cloud selection from the IASI map has the same shape in the imagery but is elongated. This comparison indicates the consistency of the IASI cloud and the dust selections.
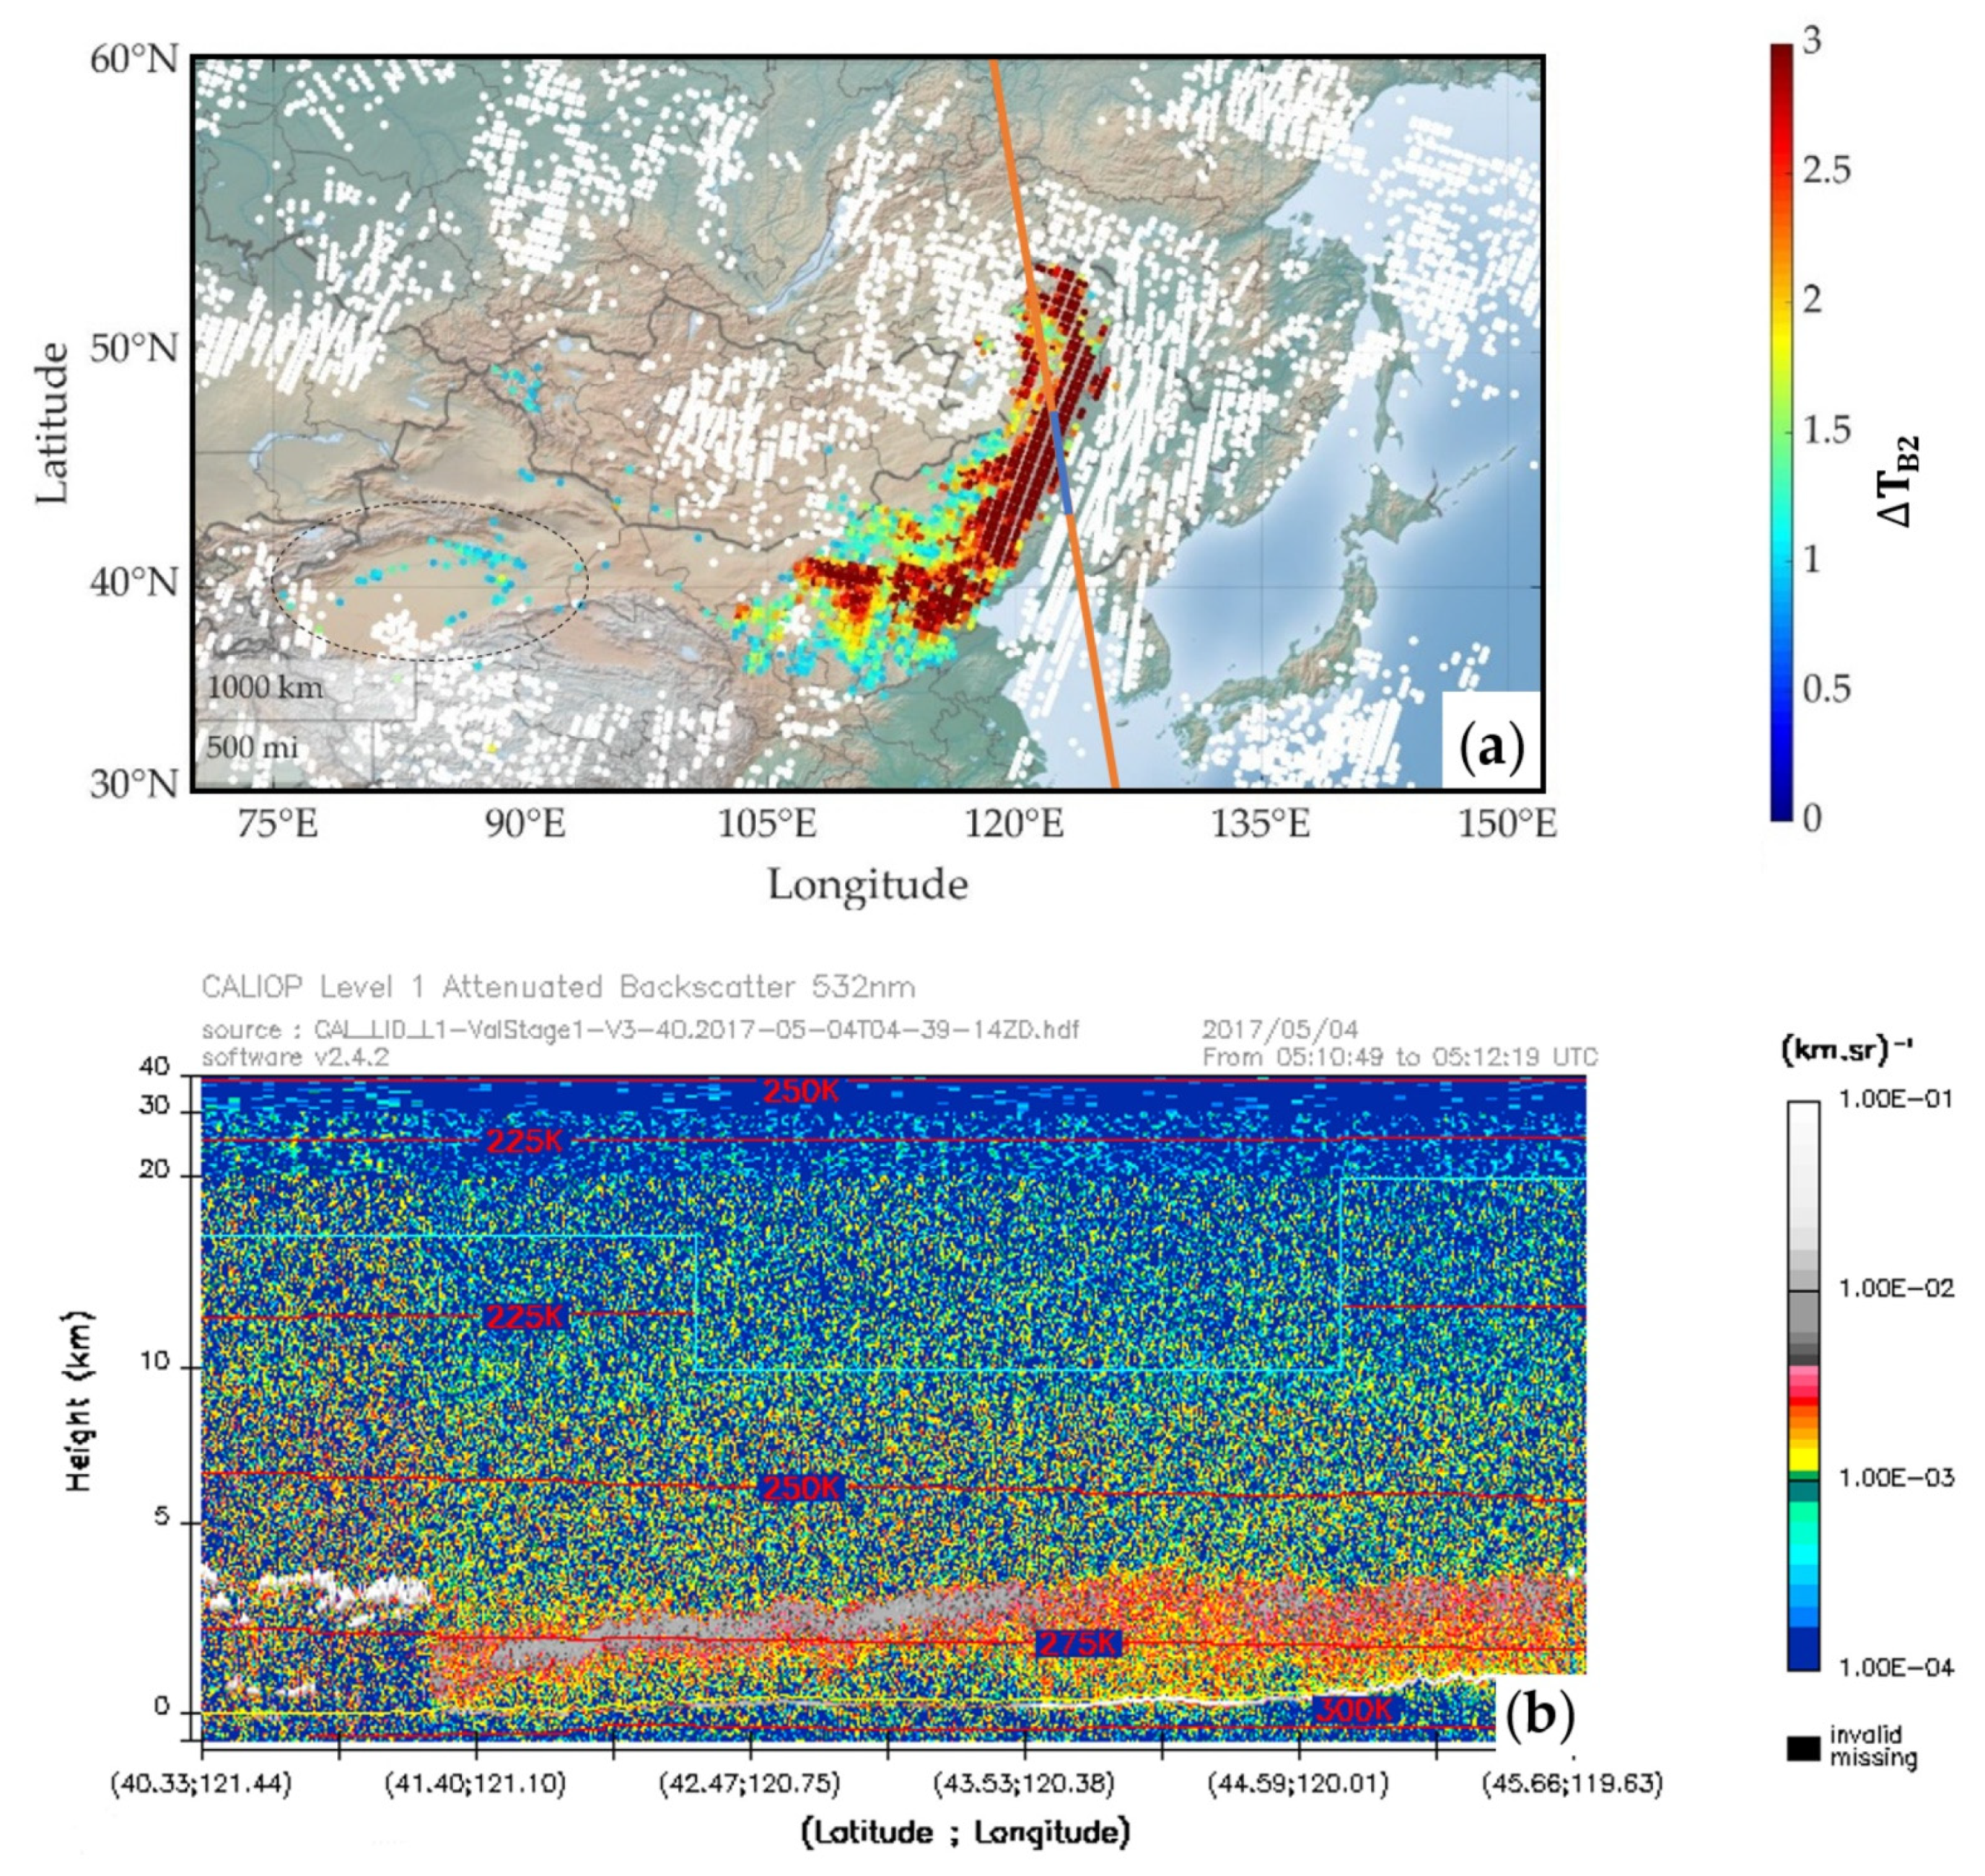
Finally, the methodology was applied to the same detection example of the 2017 dust storm on May 4 previously presented in Figure 2a, before the LSE correction, and it is plotted in Figure 9a, after the LSE correction. The selection above the Taklamakan desert is eliminated and a minor change can be seen in the dust plume that originated from the Gobi Desert. The dust selection after LSE optimization and approved with CALIOP-attenuated backscattering at 532 nm is shown in Figure 9b. A thick aerosol layer was detected in the low troposphere between 1 and 3 km. Hence, an optimized LSE correction and dust selection were established without dust signal elimination. Therefore, by using the new LSE method, dust selection was established considering cloud detection.

3. Experimental Laboratory Data

3.1. Gobi Mineralogical Dust Composition

In general, mineral dust is composed of both silicates and carbonates. One of the major mineralogical families is the phyllosilicates group (including illite, kaolinite, and smectite), which is abundant in Asian dust, with a dominance of illite [17]. Members of the tectosilicates group, i.e., quartz and feldspars, form 75% of the Earth’s crust and appear in desert dust samples. The carbonate family contains calcite and dolomite, which are considered tracers of East Asian dust [48].
A study provided an estimate of the global mineralogy of a soil and airborne dust dataset based on 120 soil units of clay and silt fraction. In airborne dust, phyllosilicates were abundant, with 74.6% of the weight mass and illite, kaolinite, and smectite as the major minerals. Quartz and feldspars were minor, with an average of 4.9% and 3.7%, respectively. Calcite represented 8.9% of the total weight mass, and minor minerals represented 8.1% [49].

3.2. Extinction Coefficient Spectra and Molecular Assignments

The laboratory setup and experimental procedure are described in detail in the references [50,51], and are only summarized herein. The experimental study was performed by two laboratories: PhysicoChimie des Processus de Combustion et de l’Atmosphère (PC2A) and Laboratoire d’Optique Atmosphérique (LOA). The analyzed samples included pure quartz crystal, pure amorphous illite, and pure calcite crystal [52], in addition to the analysis of Gobi dust samples that were collected in Yanchi, Ningxia province in China (107.475211°E, 36.487333°N) [53]. Sample particles (5 g of mass) were placed in suspension by maintaining mechanical agitation using a magnetic stirrer. Using a mass flow controller set at 2 L · min 1 , the particles were carried by pure nitrogen gas into a buffer volume to ensure homogeneous aerosol flow and then into two consecutive spectrometer setups. The first was a Fourier transform infrared spectrometer with a 10 m multipass cell, which measured the extinction coefficient in the spectral range between 650 and 9000 cm−1. The second was a UV-visible spectrometer with a 1 m cell measuring extinction coefficients between 10,000 and 40,000 cm−1. At the exit of the cell, a scanning mobility particle sizer (SMPS) and an aerodynamic particle sizer (APS) were simultaneously used to record the size distribution generated by the apparatus between 100 nm and 20 µm. Only TIR spectra were used in this study between 750 and 1250 cm−1 in the atmospheric window corresponding to the aerosol detection.
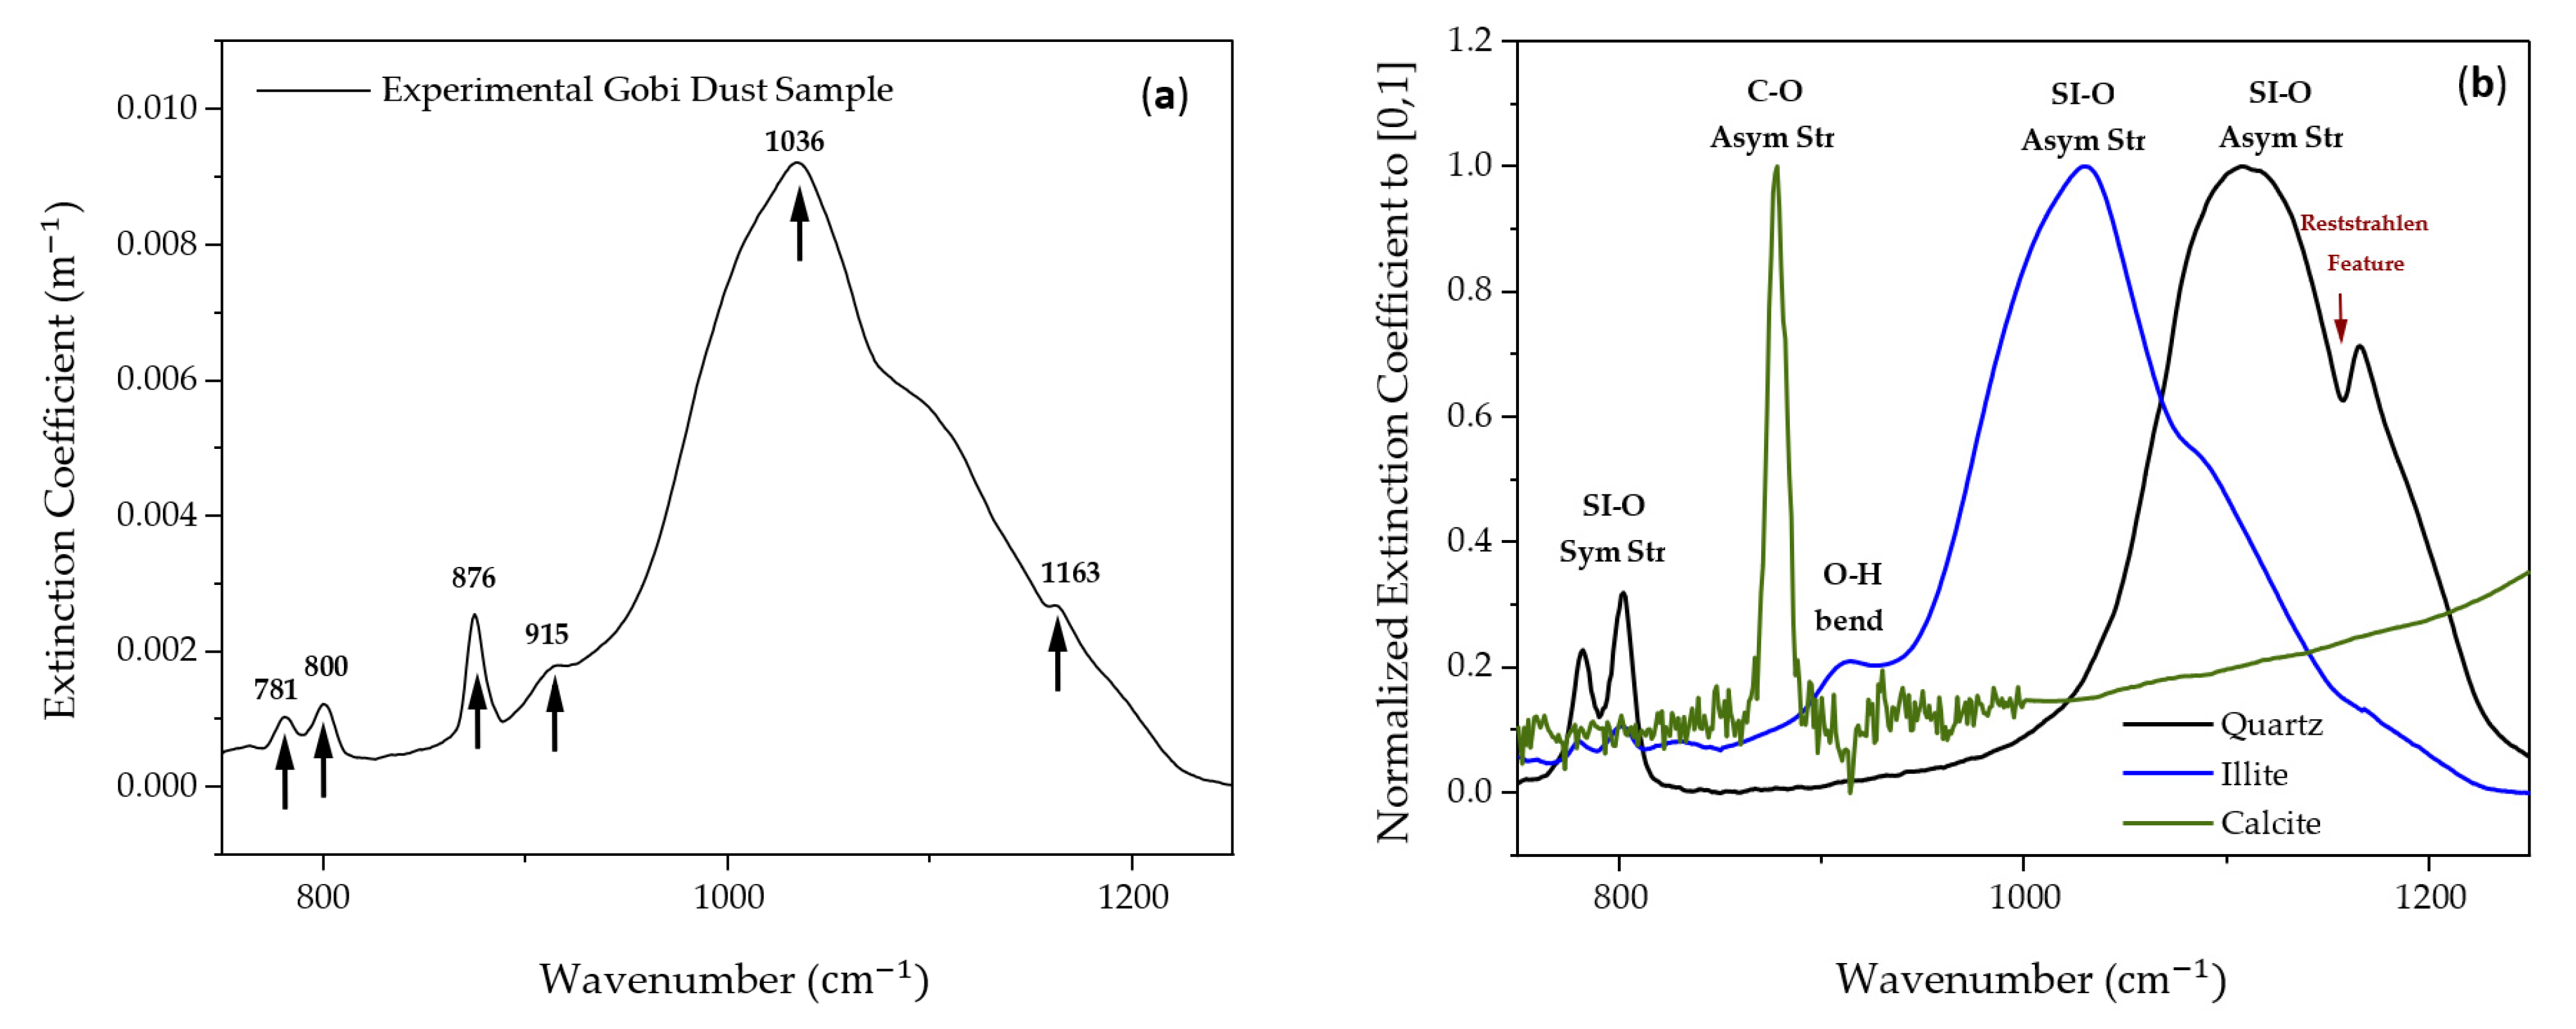
The extinction coefficient of the Gobi dust sample in Figure 10a shows absorption peaks identical to the peaks of the pure mineral extinction coefficients of quartz, illite, and calcite illustrated in Figure 10b [52]. These extinction coefficients present a measurement of each individual mineral and were normalized to remove the dependency on concentration. These optical properties are in accordance with the mineralogy in the literature, where mineral fingerprints show the presence of the three mineral families: tectosilicates, phyllosilicates, and carbonates, with the presence of quartz, illite, and calcite from each family, respectively.
The most intense bands for quartz from the tectosilicates family are between 1080 and 1177 cm−1, generated by Si-O asymmetrical stretching. The Si-O symmetrical stretching produces a doublet at 778 and 795 cm−1 [54,55]. This doublet caused by the same Si-O stretching is also found in phyllosilicates or clay minerals (e.g., illite, kaolinite…) [56]. The major peak present in the latter group at 1033 cm−1 is due to the Si-O asymmetrical stretching. This shift difference with respect to the stretching mode in quartz is explained by cation substitutions, particularly Al2+ for Si2+. The peak at 916 cm−1 for illite is assigned to the -O-H bending associated with Al, Fe, or Mg cations [57]. The fundamental vibrations of CO3 anions in carbonates (e.g., calcite, dolomite, etc.) show a spectral feature at 885 cm−1 of carbonates in TIR caused by C-O asymmetrical stretching [58,59]. Table 1 summarizes the molecular assignments in the active thermal infrared (TIR) of the abundant minerals of the three main mineral groups in desert dust from previous studies.
Airborne dust particles occur as a mixture of pure minerals, where the distribution of the molecules can be heterogeneous in the volume of a particle in the case of an internal mixture, or homogeneous in the case of an external mixture. In the case of an external mixture of mineral dust, the optical properties of individual minerals can be used to model the optical properties. An effective extinction coefficient k eff ( v )   can be obtained from a linear combination (LC) of the individual mineral extinctions [61]. The combination is calculated from the normalized experimental extinction coefficients of quartz k ¯ Q , illite k ¯ I ,   and calcite k ¯ Ca   , with an extinction fraction of the mineral groups in question, f Tec ,   f Phy , and f Ca ,   respectively, and it is calculated by:
k eff ( v ) =   f Tec k ¯ Q ( v ) +   f Phy k ¯ I ( v ) +   f Ca k ¯ Ca ( v )
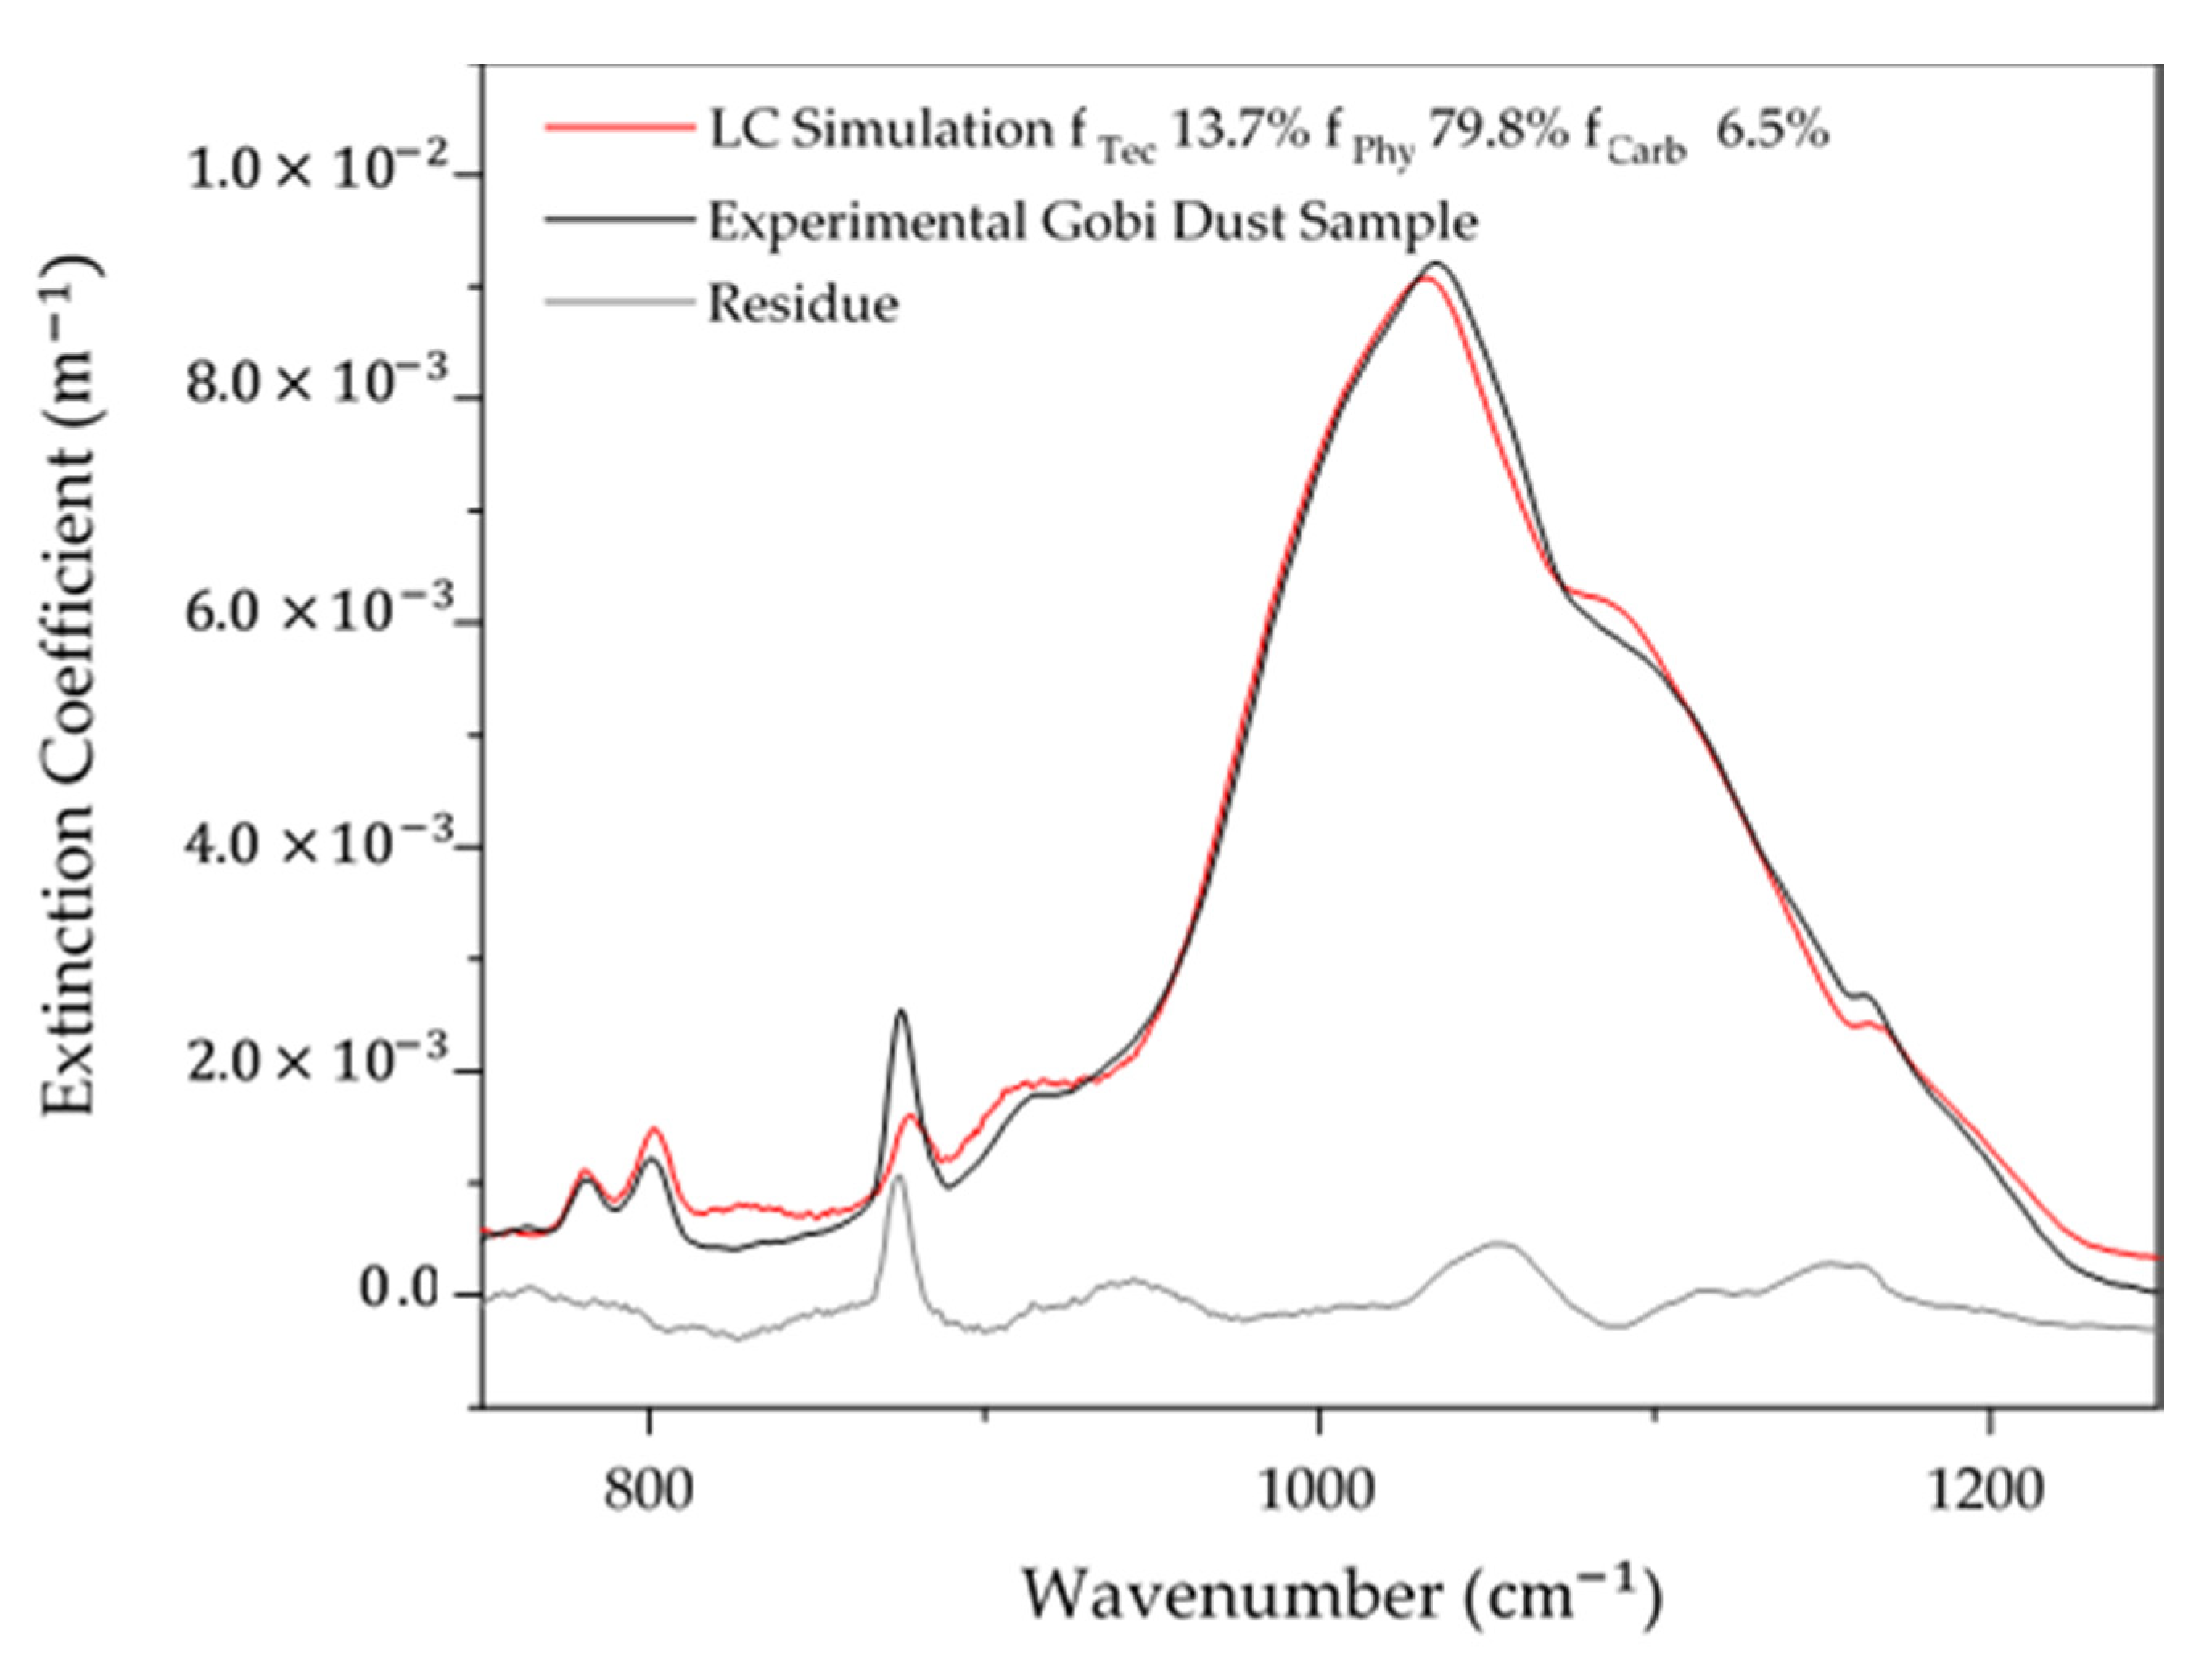
Figure 11 shows an LC simulation fitted to the Gobi dust spectrum. The individual mineral spectra reproduced a fit with 13.7% of quartz, 79.8% of illite, and 6.5% of calcite to obtain an external mineral mixture spectrum with the remaining residue R e from the predicted spectrum k eff ( v ) and the experimental spectrum k exp ( v ) . The residue difference between the LC simulated spectrum and the Gobi dust spectrum is 2.5%. This result suggests that the Gobi dust sample was made up of external mixtures of minerals, which is in accordance with the SEM experimental results showing external mixtures of this Gobi dust sample [62].
In order to compare the results with the data in the literature, it is important to convert the extinction weights to mass weights. This can be performed by obtaining the mass extinction coefficient (MEC; m 2 · g 1 ), which can be calculated from the maximum value of the extinction coefficient k i max ( v )   divided by the mass concentration MC i   for the mineral i :
MEC i   = k i max ( v )   MC i    
where MC   i is obtained from the particle size distribution recorded experimentally by the APS and the SMPS. The densities used in this study for the mineral components quartz (Q), illite (I), and calcite (Ca) were ρ Q = 2.65   g · cm 3 ,   ρ I = 2.8   g · cm 3 ,   and   ρ Ca = 2.71   g · cm 3 , respectively.
Hence, the mass weight w   i   is obtained as follows:
w i   = f i   MEC i   i f i   MEC i  
Then, by applying Equation (10) to the experimental normalized extinction coefficients, the extinction masses of quartz, illite, and calcite were MEC Q   = 0.189   m 2 · g 1 ,   MEC I   = 0.209   m 2 · g 1 , and MEC Ca   = 0.187   m 2 · g 1 , respectively. Finally, the obtained mass weights from Equation (11) were w Tec   = 15.3 % ,   w Phy   = 80 % , and w Carb   = 4.7 % , respectively.
The mass weight values of the phyllosilicates and carbonates are in agreement with percentages found by Journet et al., (2014) [49]. However, in this example, the percentage of tectosilicates was more than the average by approximately 8% (for quartz and feldspars).

4. Mineralogical Mapping Method

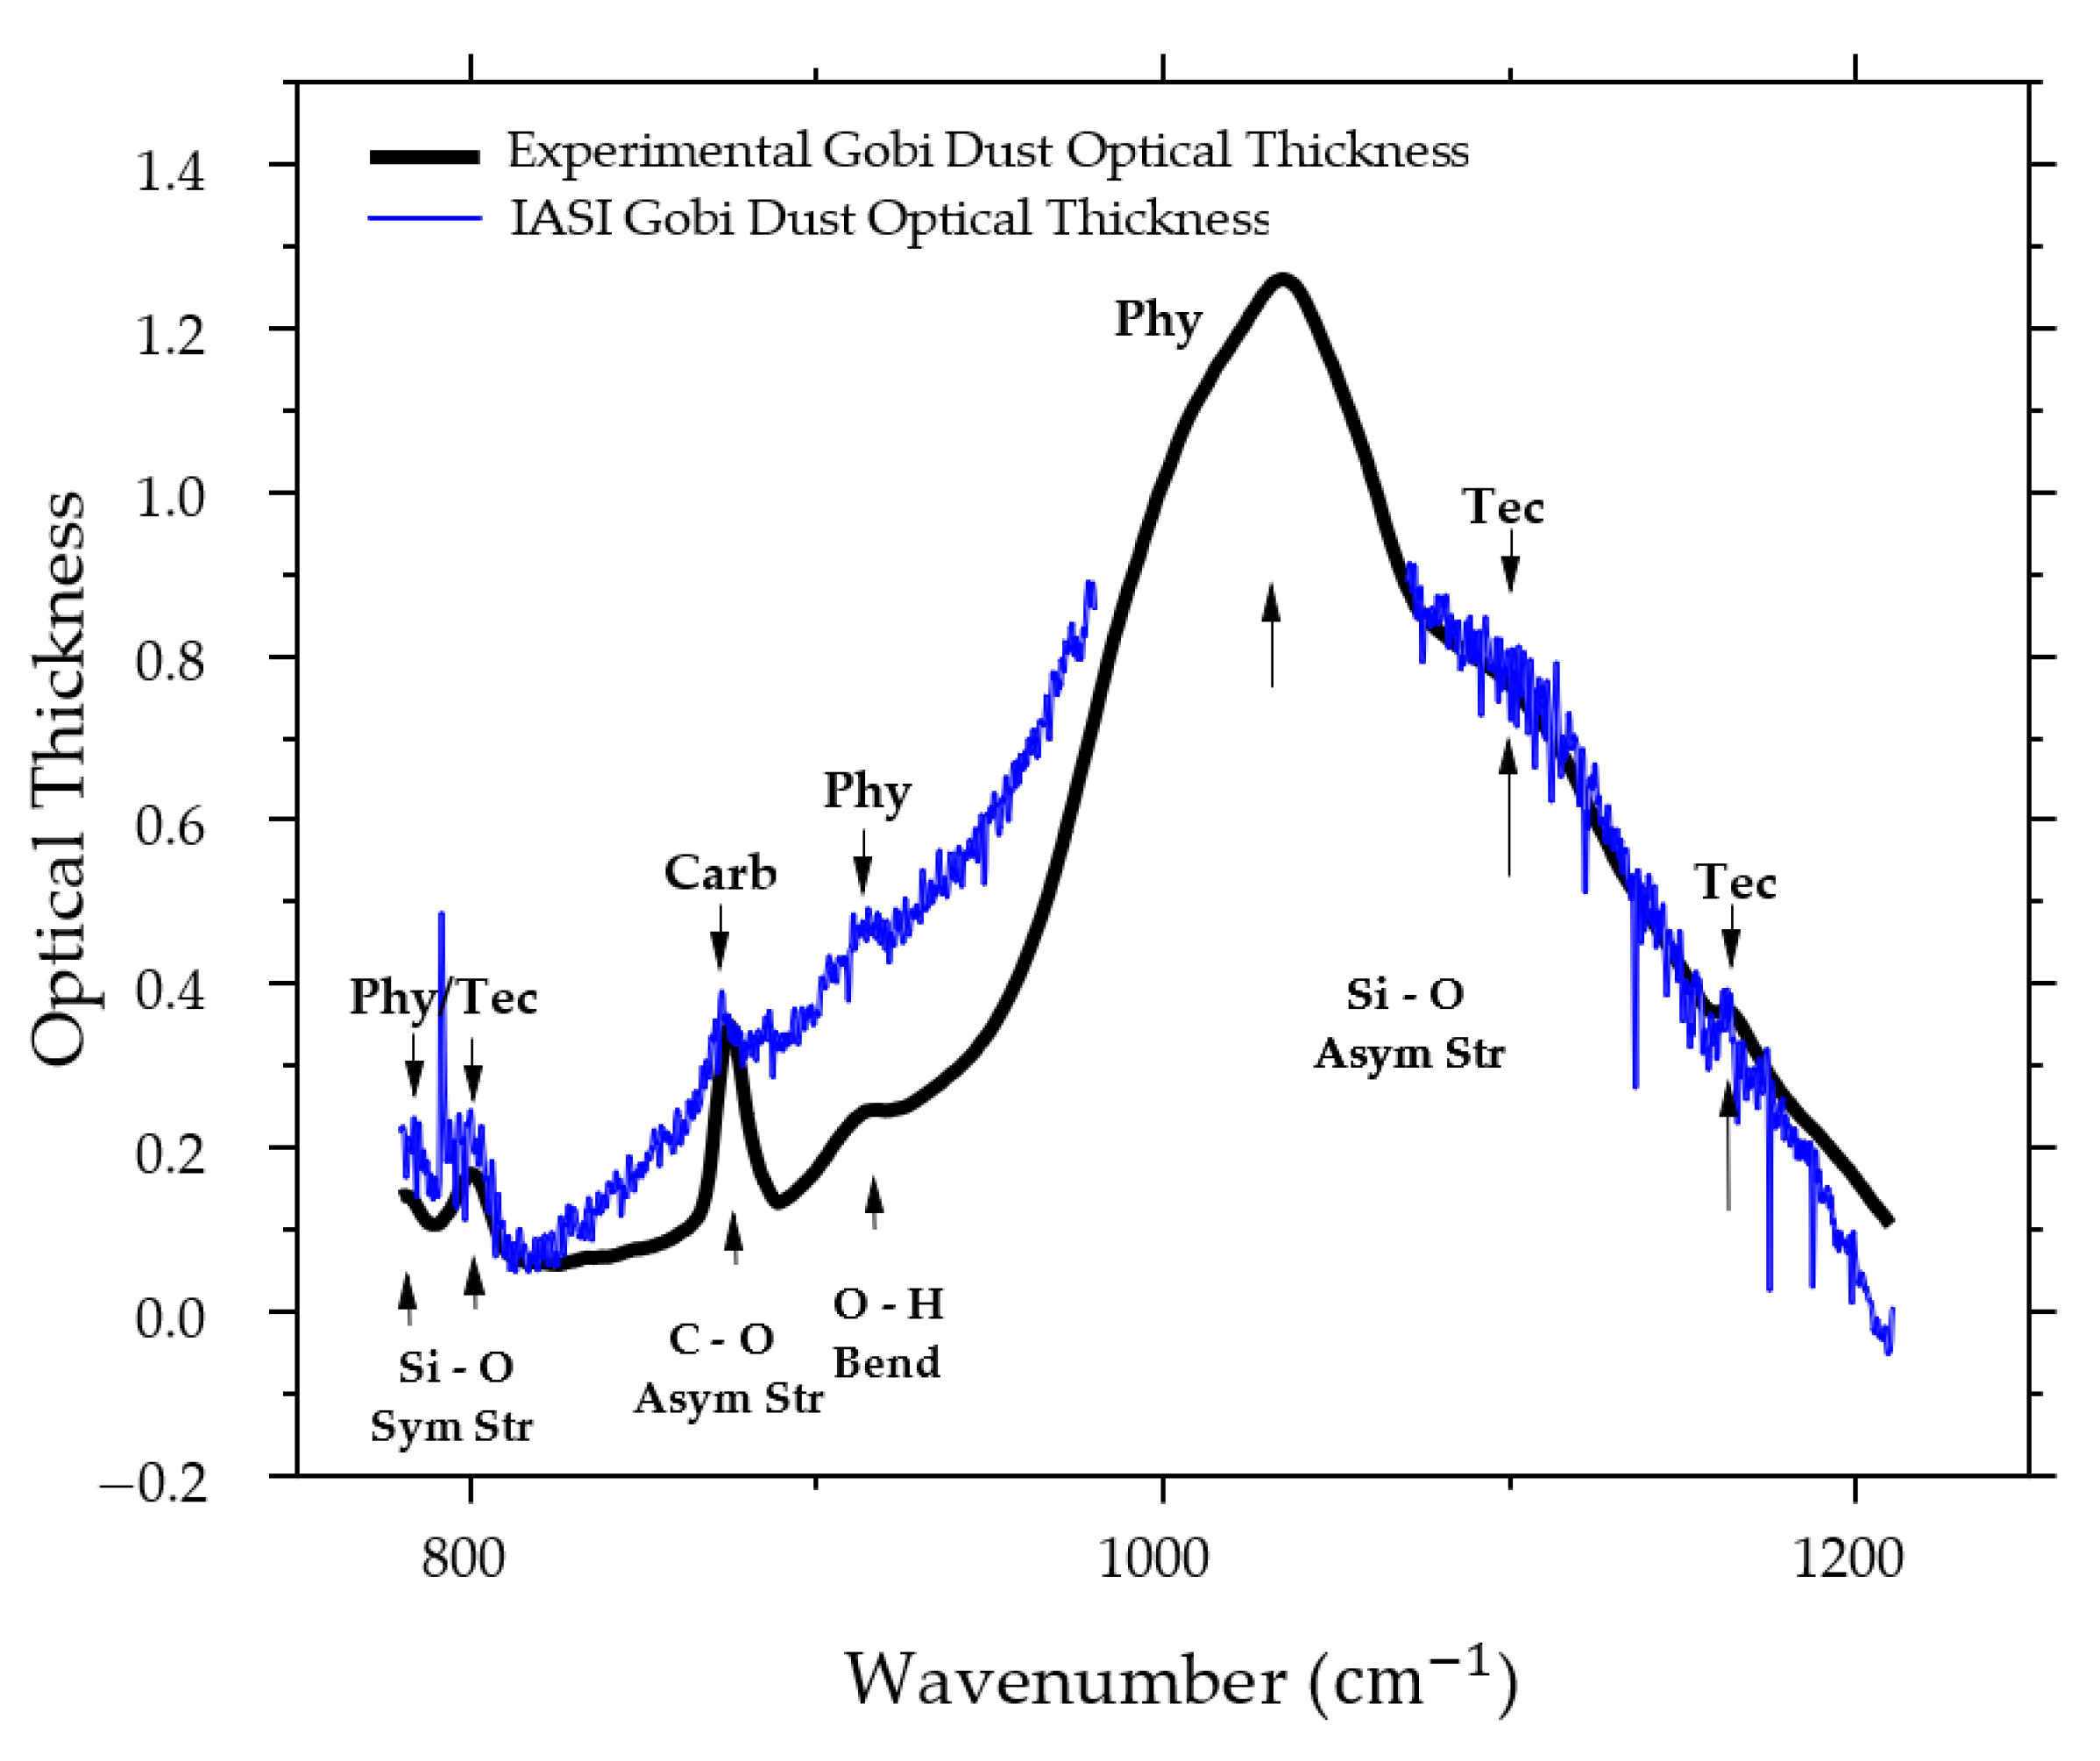
As defined in Section 2, the optical thickness was derived from the IASI radiance, and it corresponds to the dust extinction coefficient multiplied by a dust layer. Furthermore, it was discussed in Section 3 that the experimental extinction coefficient allows for the identification of spectral assignments. To compare the satellite dust detection to the experimental dust measurements, an example of an IASI optical thickness spectrum of Gobi dust detected on 4 May 2017 was compared with the laboratory optical thickness spectrum of Gobi dust (Figure 12). The results show spectral signatures identical to the laboratory dust features, which can provide information about the mineral families present in each detection. The C-O asymmetrical stretching allows for the detection of carbonates, and the O-H bending indicates the presence of phyllosilicates. In addition, tectosilicates or phyllosilicates can be distinguished by the Si-O asymmetrical stretching assignment position in the spectrum as it shifts position between the two families. In addition, the Si-O symmetrical stretching reveals the possibility of having either tectosilicates or phyllosilicates in the detection, as the doublets are present at the same wavenumbers for the two groups. Therefore, the use of an experimental dust extinction coefficient allows for the identification of the mineralogical component in the IASI residue and can be used to obtain information about the extinction weights of each mineral family.
Dust sampling depends on the location and the date of the sample collection. This can pose a challenge when it is difficult to collect dust from a particular dust event. To remove this dependency, the linear combination of the pure mineral extinctions of quartz, illite, and calcite described in Section 3 was used to obtain the mineralogical extinction fractions. The equality between the IASI spectral optical thickness τ ( v ) from Equation (7) and the linear combination from Equation (9) is solved as follows:
τ ( v ) = [   f Tec k ¯ Q ( v ) +   f Phy k ¯ I ( v ) +   f Ca k ¯ Ca ( v ) ] × L   + ϵ
where the total error ϵ is the sum of the residue error ϵ Re and the error of having other minor families not taken into consideration ϵ minor .   The layer thickness L value does not affect the result, as it is considered constant for each pixel.
In Figure 13, Equations (11) and (12) were applied to an example from the May 2017 dust event. The LC method gives 16.8% for tectosilicates, 78.3% for phyllosilicates, and 4.9% for carbonates. The IASI optical thickness shows intense narrow bands of gases, which increases the residue by up to 20%. By removing the gas effect to smooth the fitting, the residue dropped to 5%, indicating a significant error caused by the gases present in the atmosphere. In addition, the percentages calculated are close to the percentages calculated using the experimental spectrum (Section 3), with an increase in the percentage of tectosilicates.

5. Case Studies

5.1. May 2017 from IASI-A

An intense dust storm occurred from 3 to 8 May 2017, affecting visibility in North China as dust loads crossed the region. The storm started in the southwest of Inner Mongolia, where the dust plume moved southeastward, passing through North China, the Korean peninsula, and Japan before finally dissipating in Russia. Three cold fronts generated dust during this event. The first two fronts lifted dust from the Gobi Desert on May 3. On May 4, at night, a third front started and different blown dust loads were generated and merged between May 4–6, from both the Horqin Sandy Land and the Gobi Desert [63]. Figure 14 shows the evolution of the dust plume mass weights for tectosilicates, phyllosilicates, and carbonates in May 2017 between May 3–6. In addition to the RMS of the residue using the LC method and the optical thickness at 1072.5 cm−1, no dust plume was detectable by IASI on May 7 and 8. The LC method was applied to this case study with 8% of rejected solutions having negative mass weights. The latter results are linked to the difference in the particle size distribution between the detected dust and the experimental dust used for the LC fitting. Further knowledge of the microphysical dust parameters is essential for better mineralogical estimation. The IASI optical thickness at 1072.5 cm−1 shows the homogeneous temporal evolution between the day and night detections. When the optical thickness decreased, the RMS for the residue increased.
Wide spatial variability was reported for all the mineral families. This is linked to the diversity of the mineralogical composition in East Asian dust sources. Regionally, from West to East Asia, the carbonate content in the desert soil decreases, and the feldspar content increases [20]. Previously, three broad types of dust sources were identified [64]. Type I deserts are located in topographic lows, such as the Taklamakan Desert; these deserts are associated with fluvial fans [65]. Type II deserts are located on the plateau, with natural dust sources coming from the Gobi Desert of Inner Mongolia. Type III deserts are in dry agricultural areas, e.g., the Horqin Sandy Land, which had a particular influence on this dust storm [63]. Table 2 presents the half-day mean mass weight values, RMS, and the optical thickness at 1077 cm−1.
During this dust event, the mean value of tectosilicates was 48.5% in type I, whereas in types II and III, it was less than half of that. Conversely, the contents of phyllosilicates in types II and III were close to 73% and were 46% in type I. The carbonate content in the three regions had values of around 5.5%.
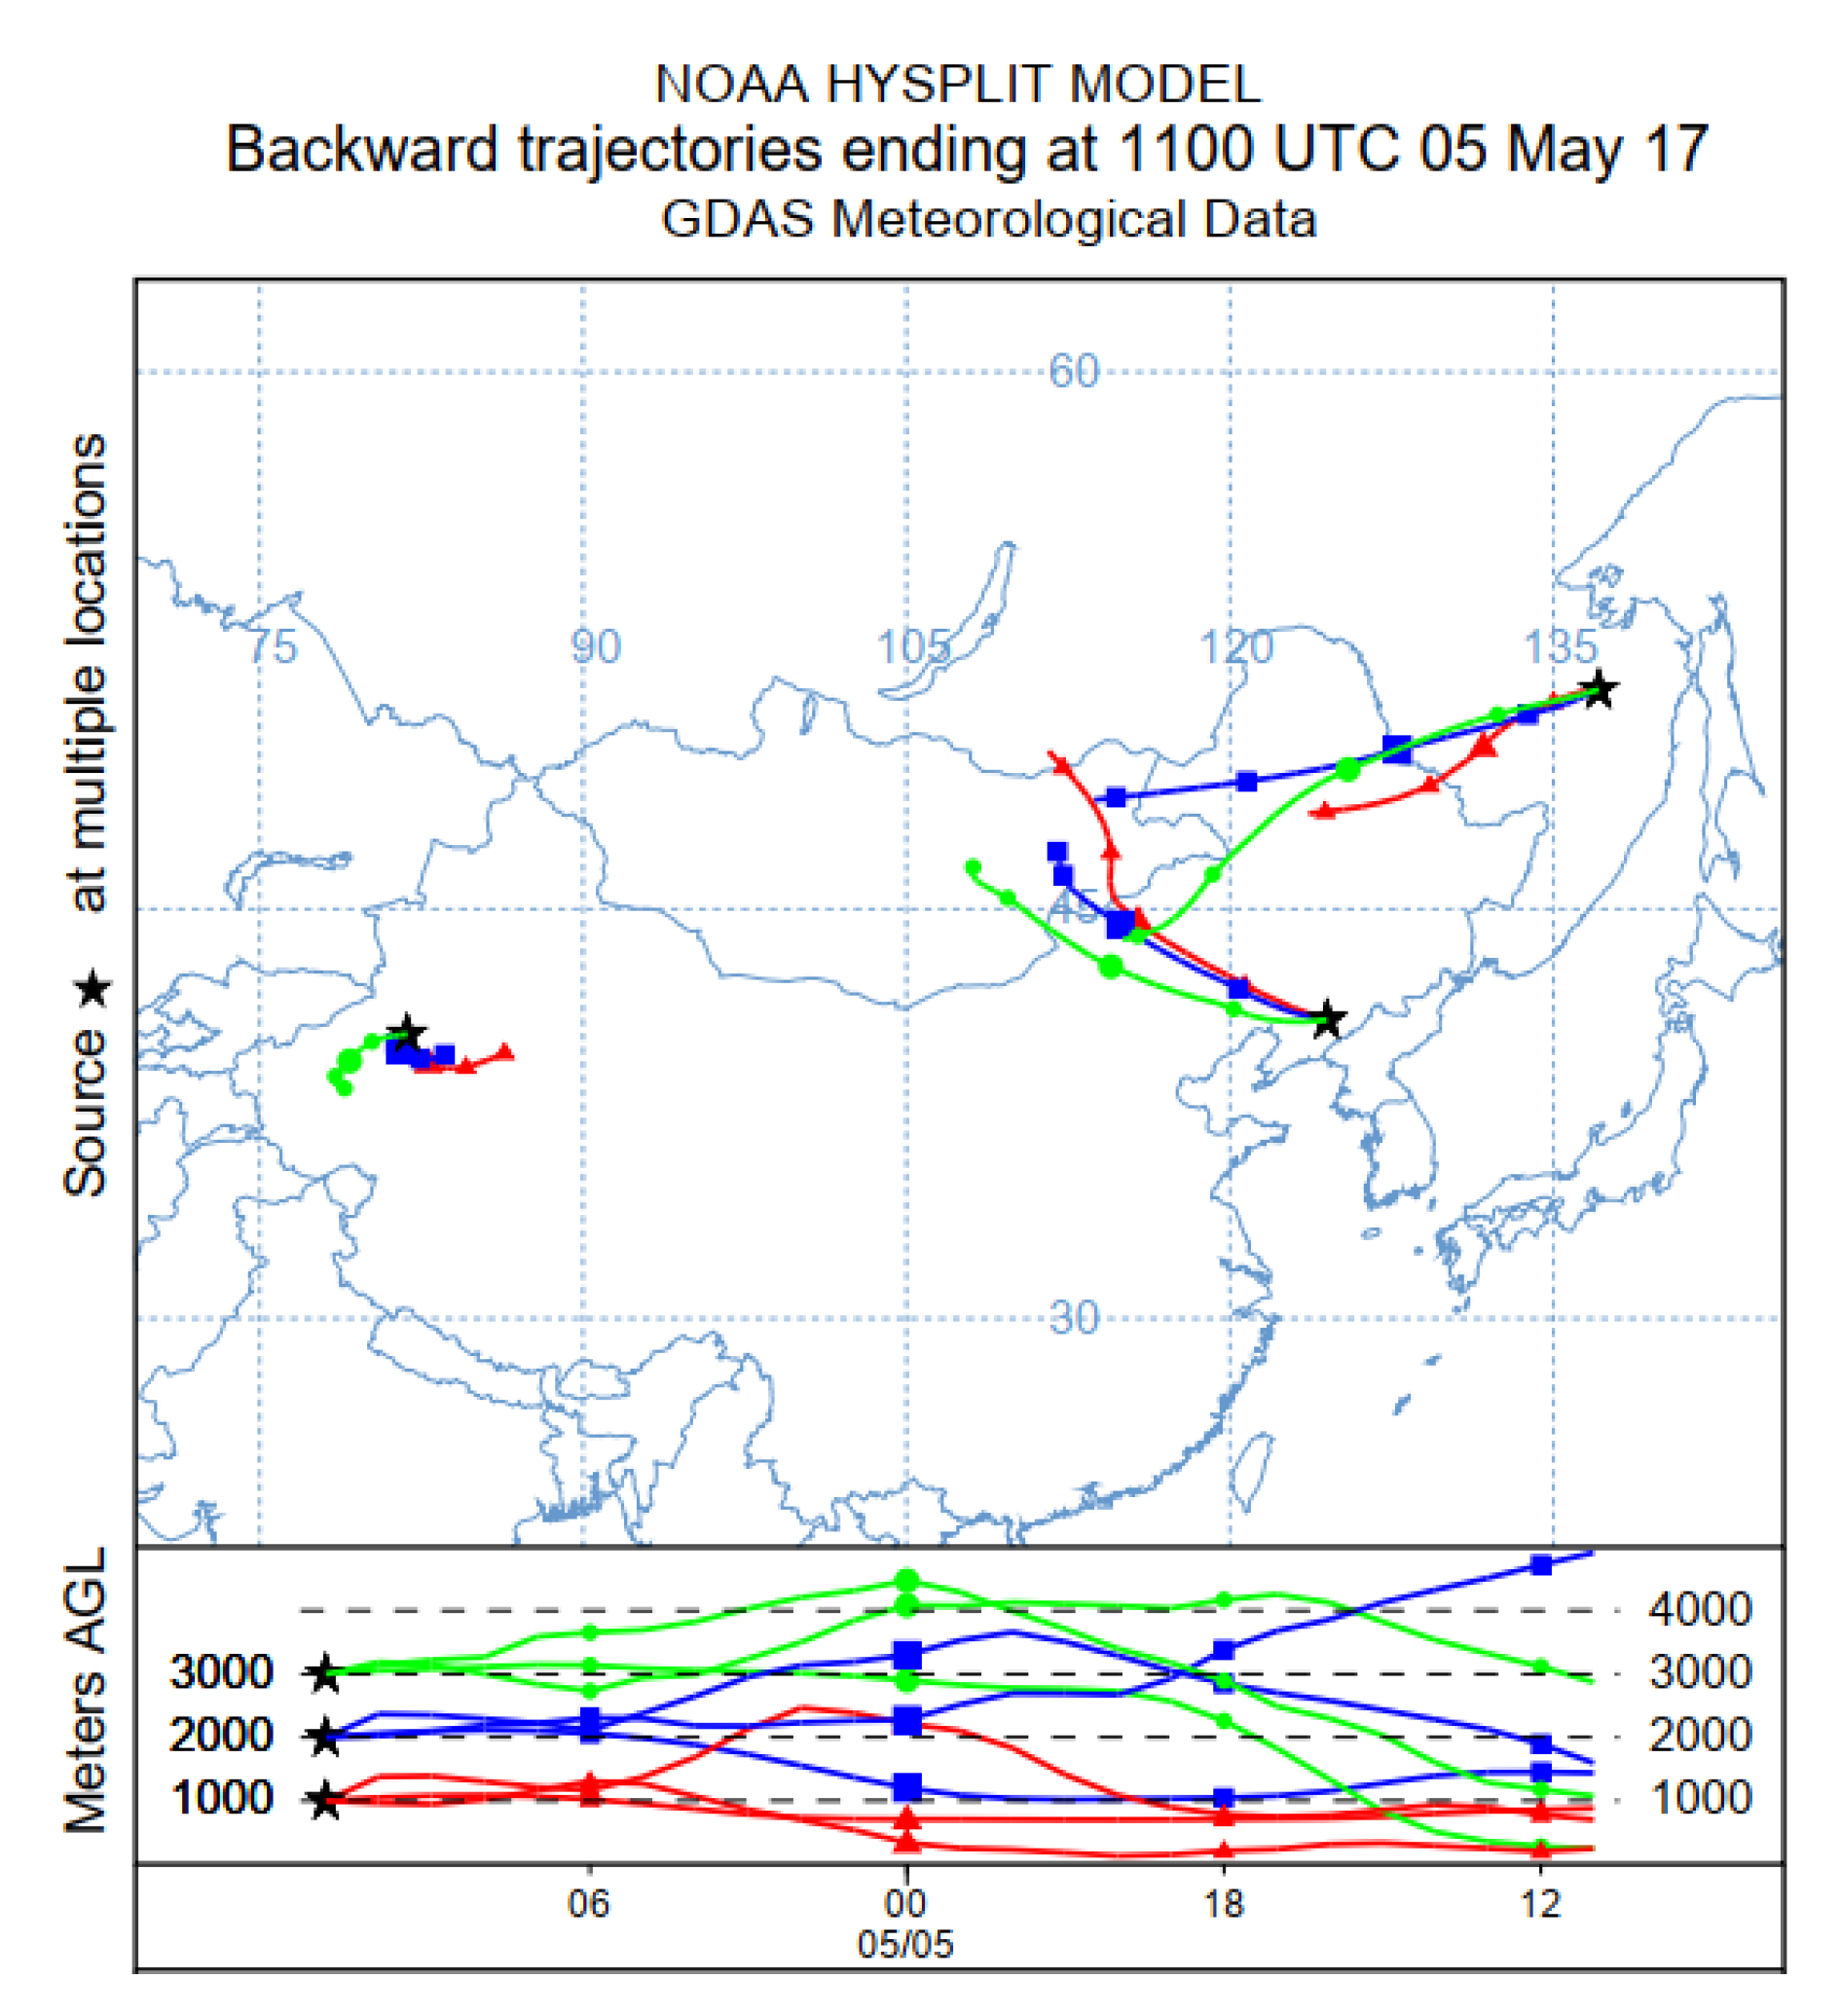
The hybrid single-particle Lagrangian integrated trajectory (HYSPLIT) model showing 24 h of backward trajectories on May 5 at 11 UTC (Figure 15) validates the sources of these dust masses. The first (I) comes from the Taklamakan Desert. Dust particles are emitted in the region without long-distance transport, and this is explained by the high content of tectosilicates and the lower content of phyllosilicates. The second (II) is created by the Gobi Desert, with the lowest tectosilicate content and the highest carbonate content. The third (III) is a mix from the Gobi and Horqin Deserts. In the example of May 5 during the day (5D), the weight of the tectosilicates strengthened again after a third cold front mixed dust from both deserts since the Horqin Sandy Land is rich in feldspars [20]. Finally, the mean mass weight values of the phyllosilicates and carbonates show results that are consistent with the literature data presented in Section 3, while the tectosilicate content was higher in this study.

5.2. Generalization

5.2.1. IASI-A and IASI-B

METOP-A ended its mission in November and December 2021, and only METOP-B and -C continue the mission [66]. Hence, a comparison between IASI-A and IASI-B is crucial to test the applicability of this study on the present IASI platforms. The comparison was applied to the 2017 case study, where only two METOPs, A and B, were in an orbital phase with a time gap of 45 min, with similar views from both satellites ensuring the maximum daily coverage. The results from 4 May 2017 during the day are shown in Figure 16, with no notable spatial shift between the two platforms as the dust plume traveled slowly from west to east. The plume mineralogical extinction evolution increased consistently in mineral weights after 45 min according to IASI-B, with continuous dust emissions from the Gobi Desert. These results confirm the ability to apply this method using different IASI platforms, in addition to the ability to identify the dust emission source.

5.2.2. March 2021 from IASI-A

The mineralogical mapping method was applied to a more recent dust storm that occurred in March 2021. The first dust plume was generated from the Mongolian Gobi Desert on 14 March, with winds blowing on 15 March uplifting aerosols from the Gobi Desert and Horqin Sandy Land together, to travel southeastward. On 16 March, another dust plume was produced from the Taklamakan Desert, floating and mixing with loads already present in the atmosphere. A previous study investigated dust sources only originating from the Gobi Desert between 14 and 15 March [67].
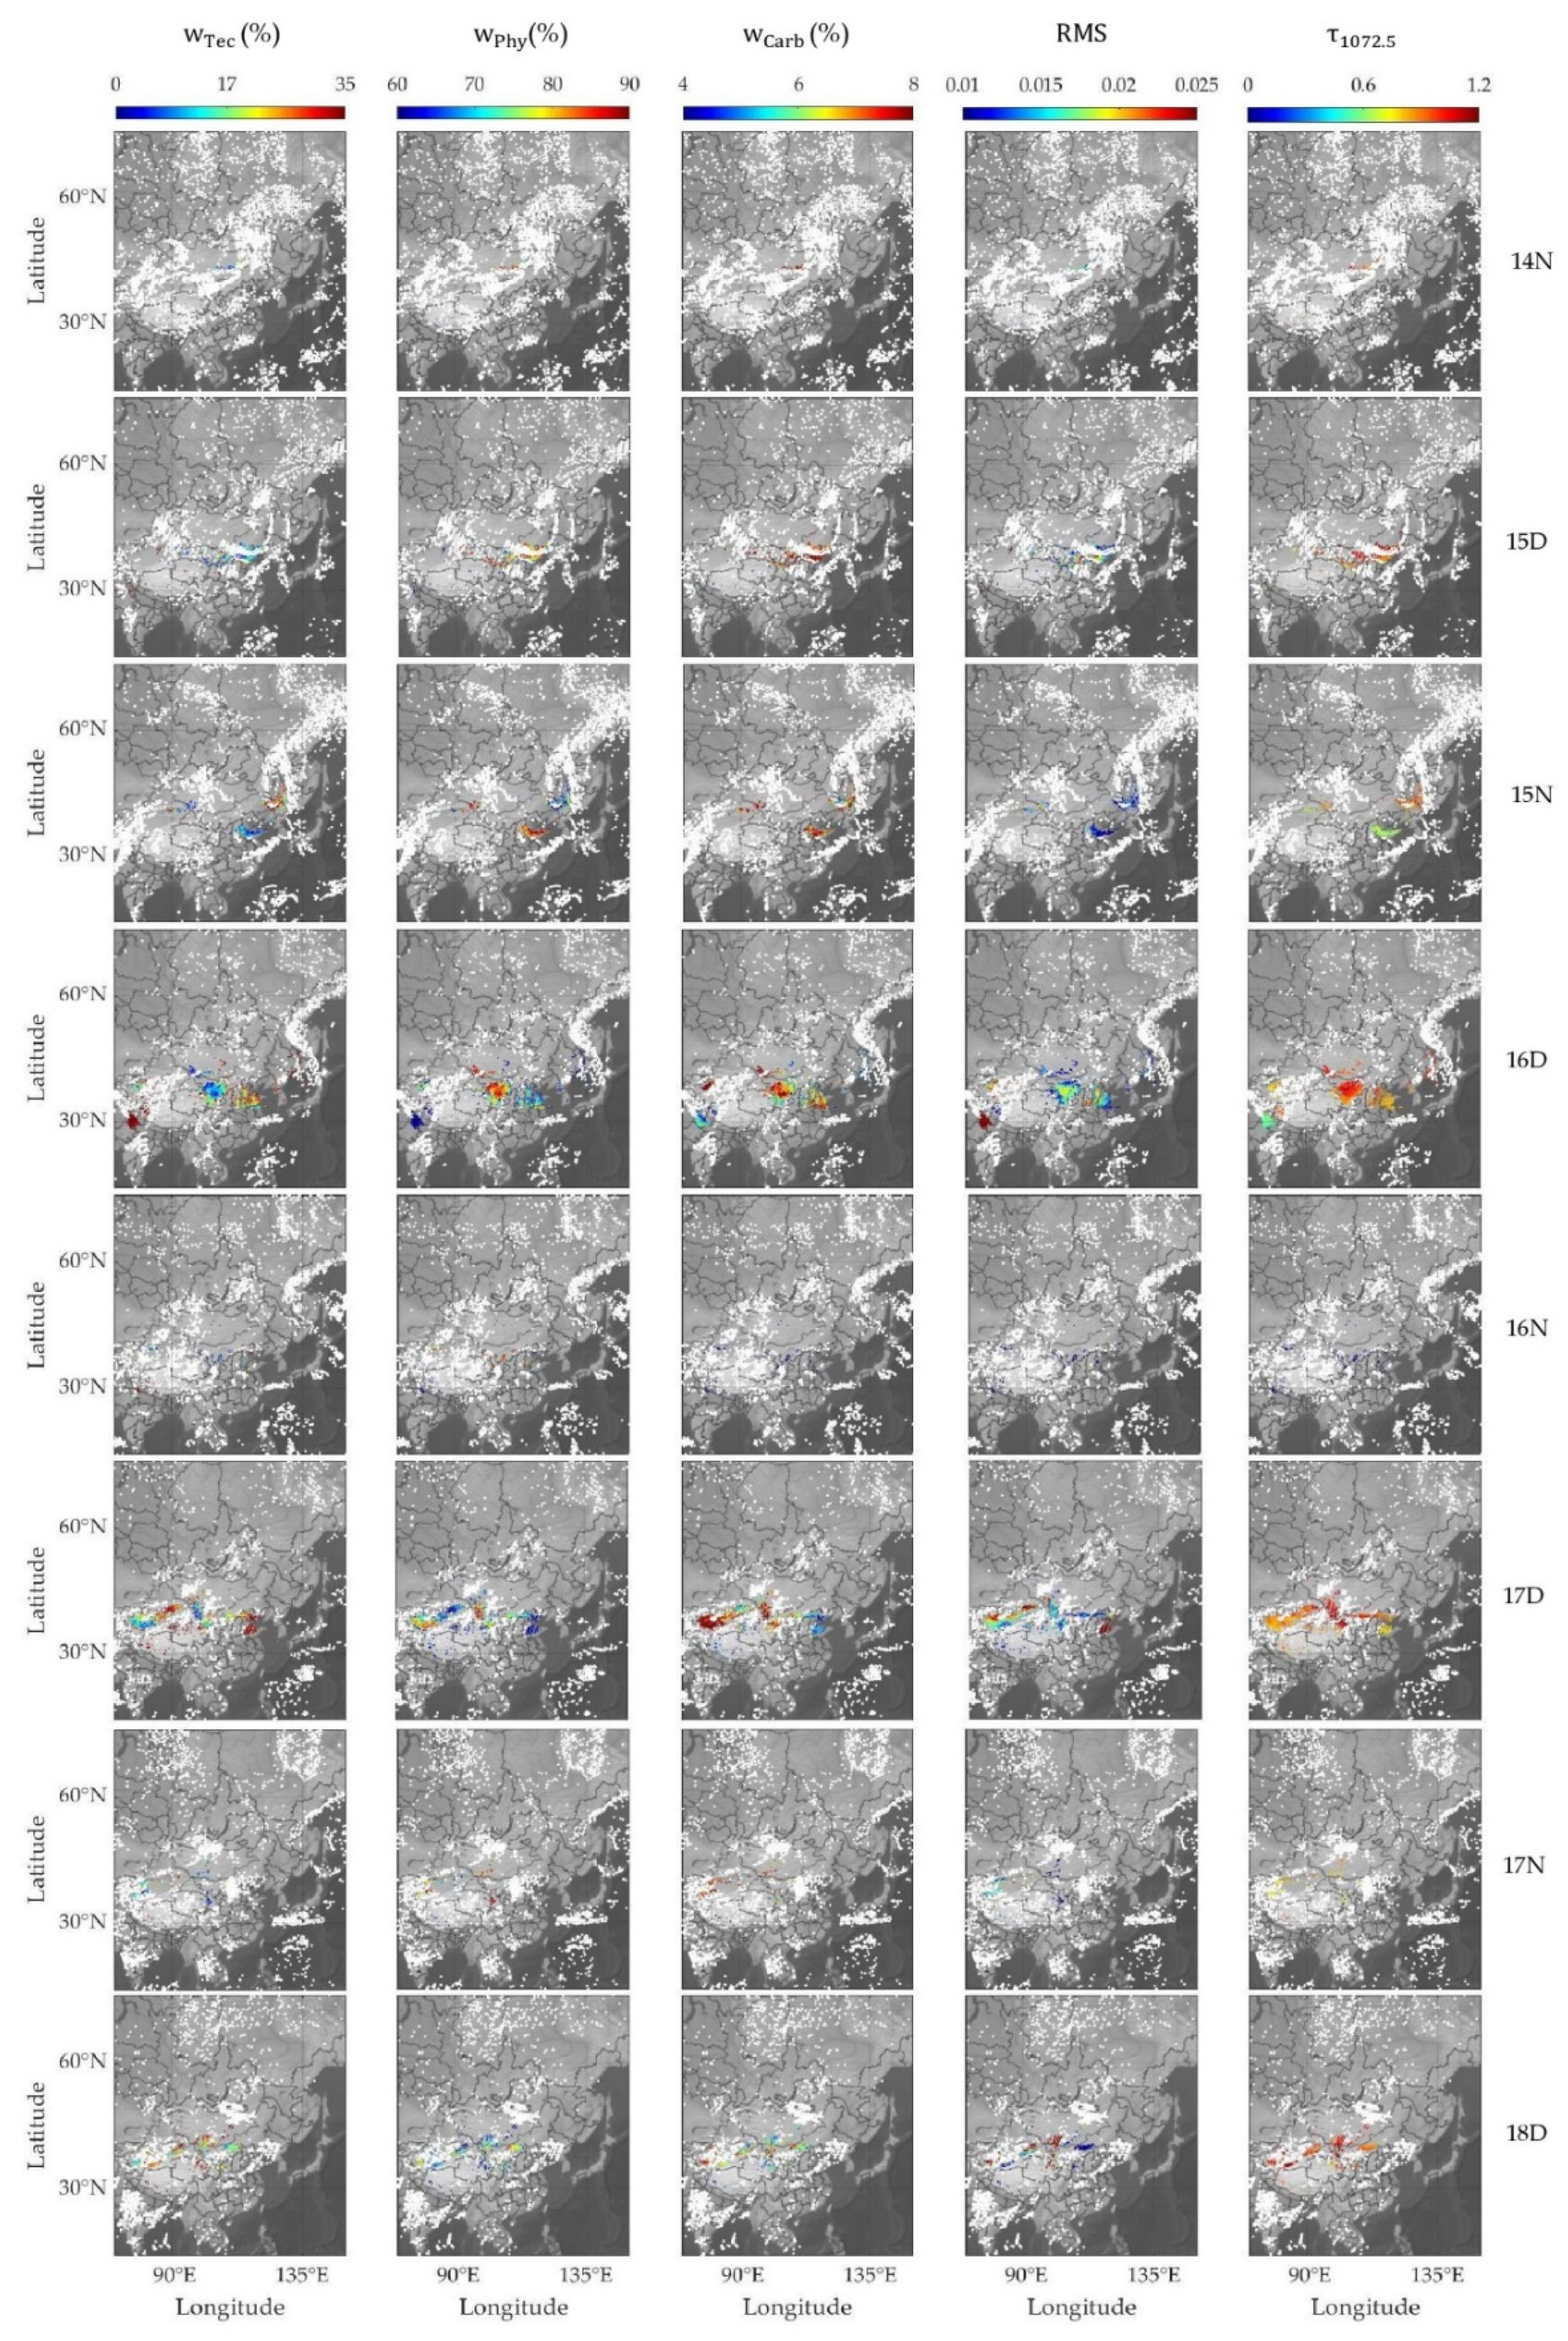
The study applied to a time interval between 14 March at night and 18 March during the day, as shown in Figure 17, where the mineralogical weights showed a regular temporal evolution as the first and second dust plumes were carried into the atmosphere. After applying the LC method, 15% of the values are rejected, the double of the percentage value of the first case. This can be linked to the difference in the size distribution between the emissions for the two cases in the study; the PM10 concentration emissions were double in March 2021 [67,68]. Likewise, in this case, the optical thickness was inverse to the residue RMS.
Table 3 shows the half-day mean mineralogical values, with the RMS and the optical thickness at 1072.5 cm−1. In this case, the mean mass weight value of the tectosilicates was   25 % of type I, unlike in May 2017. Intense dust emissions from this region started on 16 March during the day (16D), made up of 66% phyllosilicates and 7.4% carbonates. In type II, the results show consistency with the previous case study. However, type III indicates the uplift of heavier tectosilicate particles and fewer phyllosilicate fine particles. The carbonate mean values were close for types I and II, with the highest peak from type I at 9% and the lowest from type III at 5.2%. More intense optical thickness values were found in this case since the dust mass concentration emitted reached almost 1 × 10⁴ μ g / m 3 of the May 2017 values of less than 5 × 10³ μ g / m 3 [67,68].
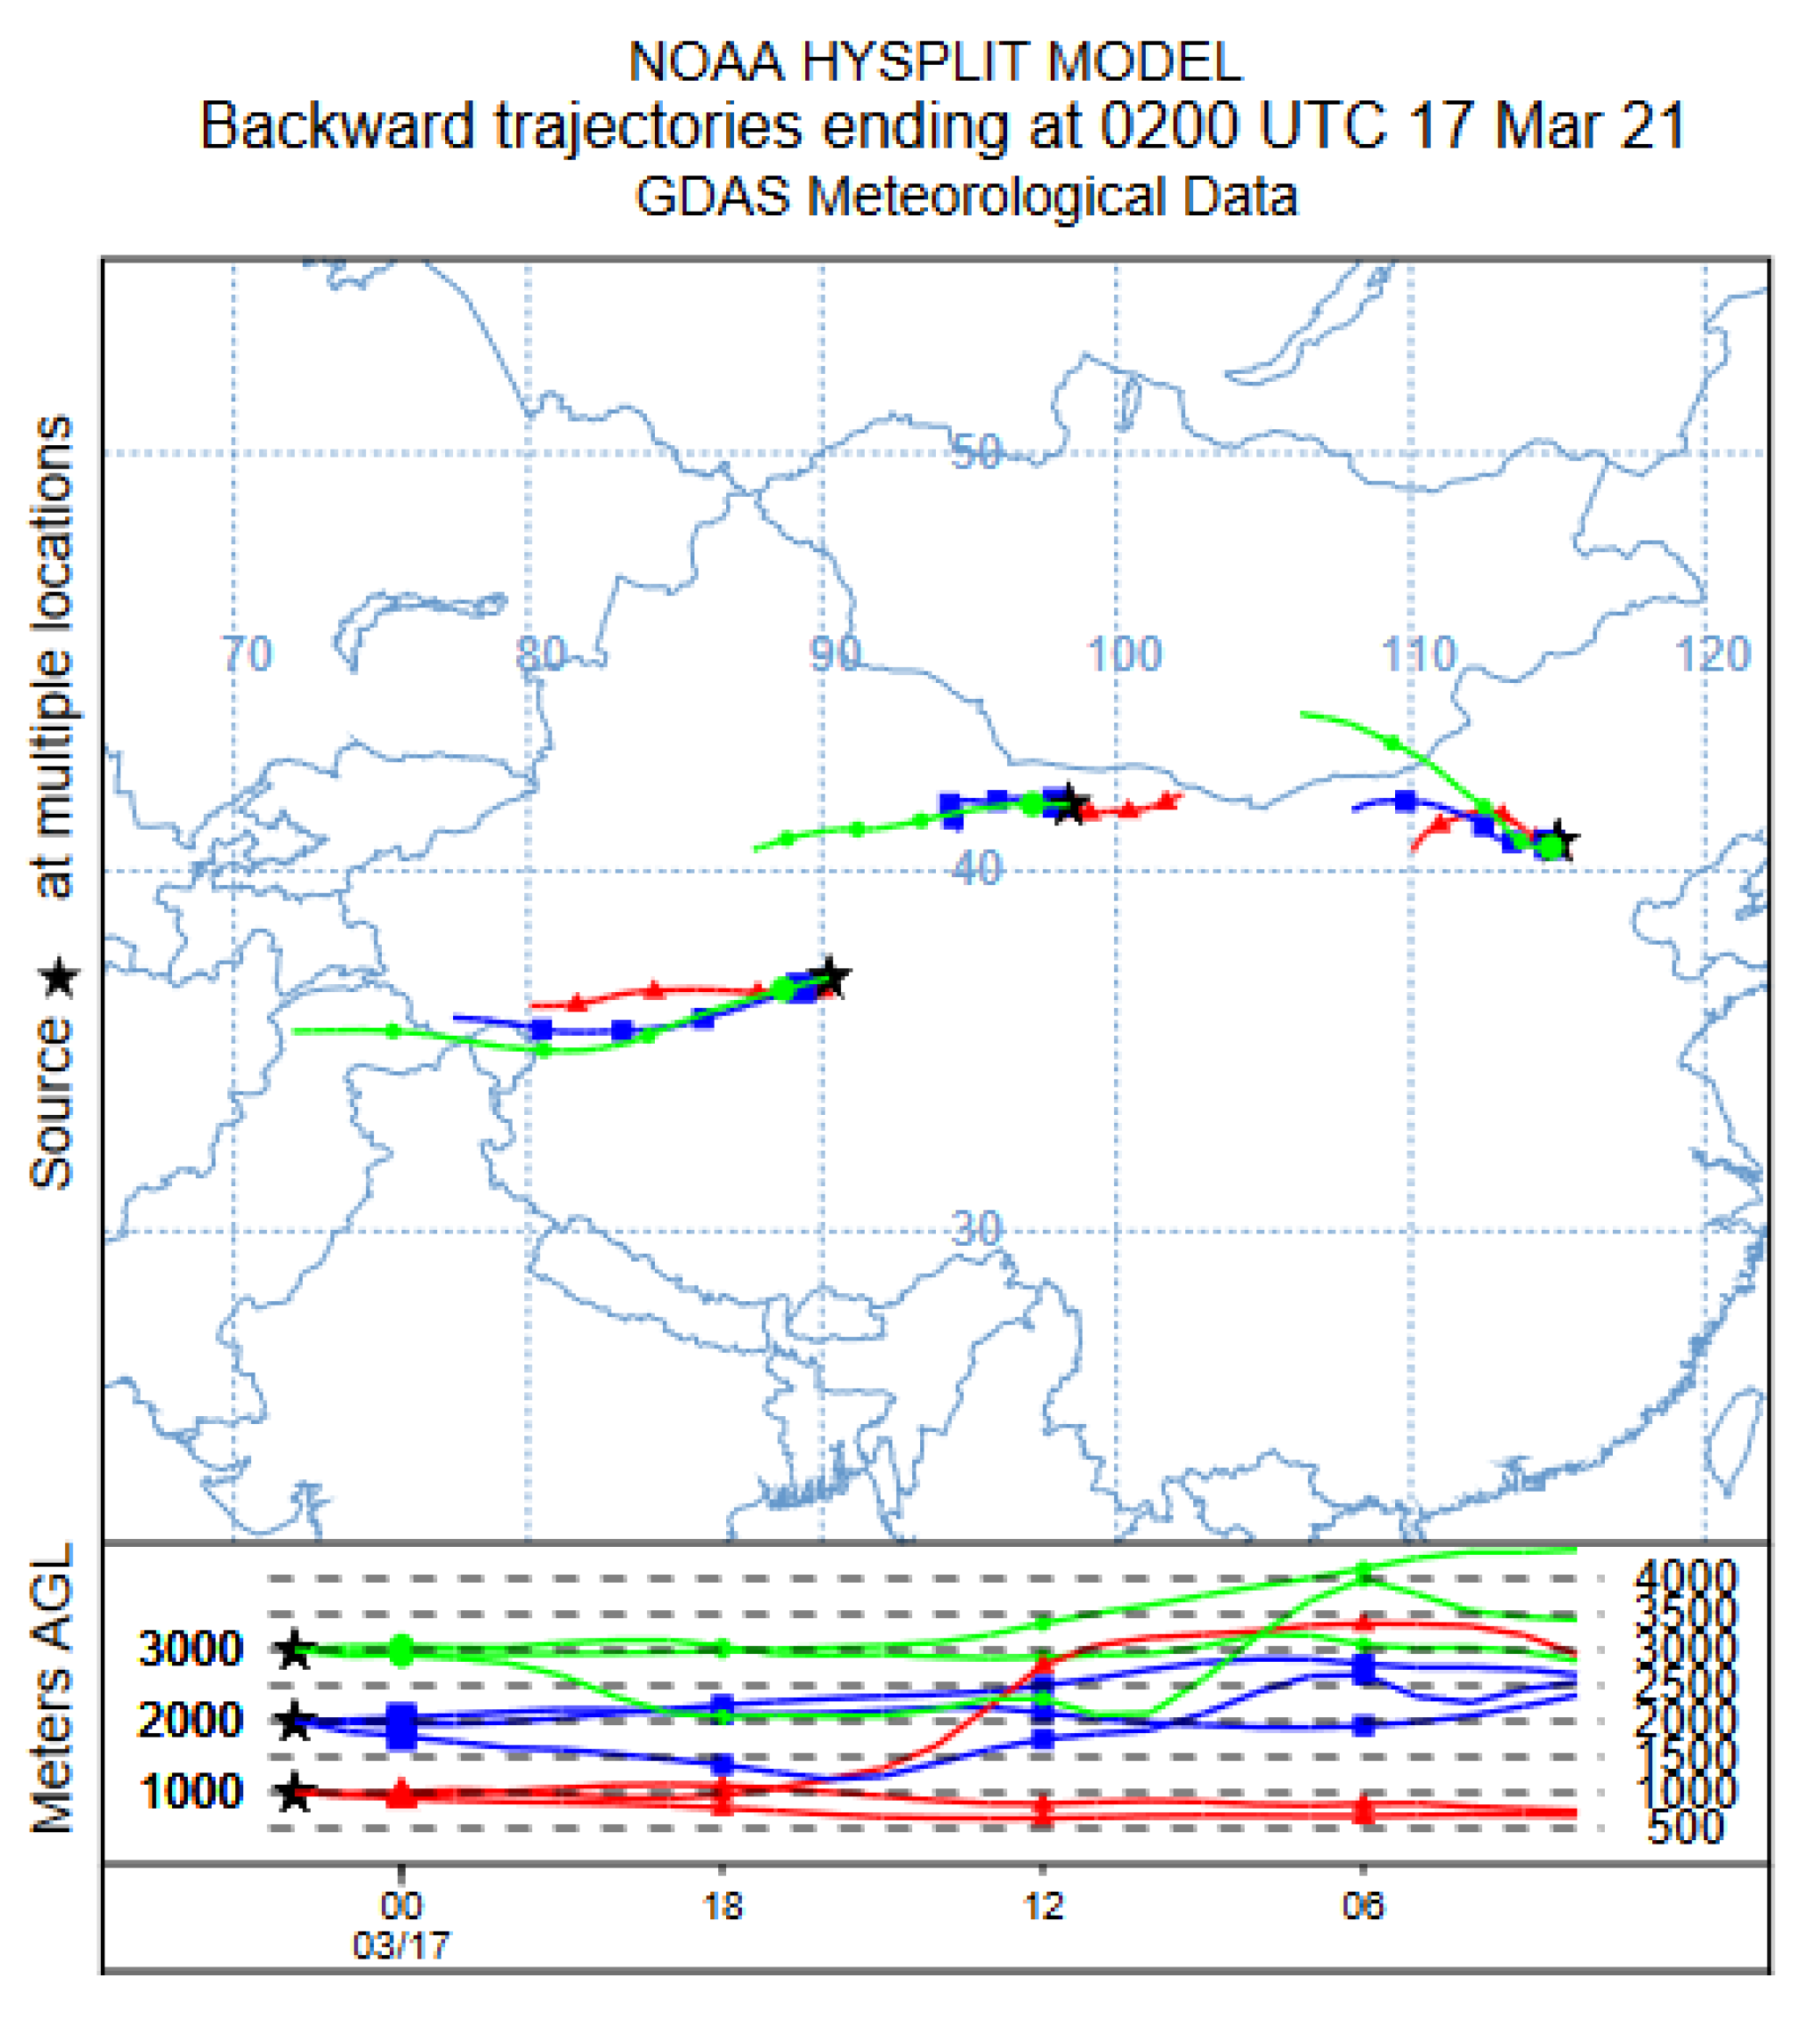
First, on 15 March, dust mass III was a mixture of the Gobi and Horqin sources, with high tectosilicate content. This agrees with the results obtained in May 2017, with the Horqin Sandy Land source causing the increase in tectosilicate weight. This can be compared to dust mass II, presenting lower tectosilicate content as it originated only from the Gobi Desert. In addition, the weight of phyllosilicates was higher in II compared to III, suggesting that dust emissions in II were from the Gobi Desert. By the nights of 16 and 17 March (16N and 17N), clouds covered the region, masking dust plume detection. On 17 March by day (17D), the mineralogical weights had heterogeneous variability in the three different regions, each related to a different source. In Figure 18, the HYSPLIT 24 h backward trajectory of that day indicates the presence of another type I dust load from the Taklamakan Desert, originating from the emissions of 16 March by day and traveling in the same direction as the uplifted masses of type II from the Gobi Desert. In addition, another mass traveled from Central Asia, showing different mineralogy that was particularly rich in tectosilicates (the values of this plume are not shown in Table 3).

6. Conclusions

This paper introduced a method for computing mineralogical weights during dust storm events using both experimental optical properties and satellite detections from IASI.
First, we found that dust detections above land were highly affected by LSE. Soil that is highly rich in quartz generates the Reststrahlen phenomenon, altering the IASI observation and causing false aerosol selection and characterization. To solve this problem, a mean monthly emissivity dataset was used. However, the direct use of these data can strongly change spectral detection, losing aerosol signals. Due to this, a new LSE optimization method was developed using the same data and is based on the Reststrahlen feature at 1159 cm−1. A correction factor was calculated and applied to the IASI detection spectra. This method allowed for improving the surface effect of the aerosol detections without altering the mineral dust information from both day and night observations, as applied to the two case studies with different temporal and seasonal characteristics. This indicates the ability to apply the LSE correction method to different case studies.
Second, we considered that dust presents a heterogeneous mixture of pure minerals. Thus, we applied an LC method to the laboratory extinction coefficients of pure minerals to fit the Gobi dust spectrum, showing a residue of 2.5%. This indicates that the Gobi dust was an external mixture of individual minerals. In addition, after LSE correction, an aerosol optical thickness spectrum from the IASI was derived, with molecular features similar to the optical thickness of the experimental Gobi dust sample. The LC was also applied to the satellite optical thickness and the residue shifted to 20% due to the presence of narrow gas bands. However, this residue dropped to 5% after smoothing the spectrum.
Third, mineralogical weight maps were obtained for three mineral families: tectosilicates, phyllosilicates, and carbonates, with the RMS and the optical thickness at 1077 cm−1. The method was applied to two case studies detected from IASI-A by day and night, in two different seasons, with a time gap of 5 years between them: spring 2017 and winter 2021. The results also show mean mineralogical weights close to the literature. With high temporal and spatial variability for tectosilicates and carbonates, the weights were linked to the dust source. Hence, this method presents a powerful tool to link dust mineralogy to the original sources.
These results imply the temporal stability of IASI-A in a time gap of five years and show the ability to use IASI detection in different seasons. In addition, IASI-A and IASI-B were compared, giving consistent mineral weights, which allows for the application of this work using different IASI platforms in the future.
Finally, laboratory optical properties exploited with IASI measurements allowed for obtaining new information about mineralogical dust composition in the East Asian deserts. An important link between the LC rejected values and the particle size distribution was also determined. This highlights the importance of the quantification of the size distribution parameter. In future work, we will use laboratory complex refractive indices derived from extinction spectra to retrieve the microphysical and mineralogical dust properties.

Author Contributions

Conceptualization, H.H.; methodology, H.H. and P.A.; software, P.A. and H.H.; validation, P.A., H.H., L.D., A.A.C. and D.P.; formal analysis, P.A., H.H. and L.D.; investigation, P.A. and H.H.; writing—original draft preparation, P.A. and H.H.; writing—review and editing, P.A., H.H., L.D., A.A.C. and D.P.; supervision, H.H.; project administration, H.H.; funding acquisition, H.H. All authors have read and agreed to the published version of the manuscript.

Funding

This work is a contribution to the LabEx CaPPA project funded by the French National Research Agency under contract ‘ANR-11-LABX-0005-01’ and to the CPER research project CLIMIBIO funded by the French Ministère de l’Enseignement Supérieur et de la Recherche. The authors thank the Regional Council ‘Hauts-de-France’ and the European Regional Development Fund for their financial support for these projects.

Acknowledgments

Special thanks to Frédéric Thevenet from the Sciences de l’Atmosphère et Génie de l’Environnement (SAGE) at IMT Lille Douai, and Xianjie Wang from the Physique des Plasmas (LPP) at Sorbornne University for providing us with Gobi dust samples. We thank the AERIS/ICARE Data and Services Center for providing data processing and tools. We also thank Daniel Zhou for providing the surface emissivity atlas. Finally, we would like to thank EUMETSAT for providing us with IASI data L1_C and L2 products.

Conflicts of Interest

The authors declare no conflict of interest.

References

  1. Duniway, M.C.; Pfennigwerth, A.A.; Fick, S.E.; Nauman, T.W.; Belnap, J.; Barger, N.N. Wind erosion and dust from US drylands: A review of causes, consequences, and solutions in a changing world. Ecosphere 2019, 10, e02650. [Google Scholar] [CrossRef] [Green Version]
  2. Querol, X.; Tobías, A.; Pérez, N.; Karanasiou, A.; Amato, F.; Stafoggia, M.; Pérez García-Pando, C.; Ginoux, P.; Forastiere, F.; Gumy, S.; et al. Monitoring the impact of desert dust outbreaks for air quality for health studies. Environ. Int. 2019, 130, 104867. [Google Scholar] [CrossRef] [PubMed]
  3. Safriel, U.N. The assessment of global trends in land degradation. In Climate and Land Degradation; Sivakumar, M.V.K., Ndiang’ui, N., Eds.; Springer: Berlin/Heidelberg, Germany, 2007; pp. 1–38. ISBN 978-3-540-72438-4. [Google Scholar]
  4. Bi, J.; Huang, J.; Shi, J.; Hu, Z.; Zhou, T.; Zhang, G.; Huang, Z.; Wang, X.; Jin, H. Measurement of scattering and absorption properties of dust aerosol in a Gobi farmland region of northwestern China—A potential anthropogenic influence. Atmos. Chem. Phys. 2017, 17, 7775–7792. [Google Scholar] [CrossRef] [Green Version]
  5. Kanji, Z.A.; Sullivan, R.C.; Niemand, M.; DeMott, P.J.; Prenni, A.J.; Chou, C.; Saathoff, H.; Möhler, O. Heterogeneous ice nucleation properties of natural desert dust particles coated with a surrogate of secondary organic aerosol. Atmos. Chem. Phys. 2019, 19, 5091–5110. [Google Scholar] [CrossRef] [Green Version]
  6. Michel, A.E.; Usher, C.R.; Grassian, V.H. Reactive uptake of ozone on mineral oxides and mineral dusts. Atmos. Environ. 2003, 37, 3201–3211. [Google Scholar] [CrossRef]
  7. Augustin-Bauditz, S.; Wex, H.; Kanter, S.; Ebert, M.; Niedermeier, D.; Stolz, F.; Prager, A.; Stratmann, F. The immersion mode ice nucleation behavior of mineral dusts: A comparison of different pure and surface modified dusts. Geophys. Res. Lett. 2014, 41, 7375–7382. [Google Scholar] [CrossRef]
  8. Marcotte, A.R.; Anbar, A.D.; Majestic, B.J.; Herckes, P. Mineral Dust and Iron Solubility: Effects of Composition, Particle Size, and Surface Area. Atmosphere 2020, 11, 533. [Google Scholar] [CrossRef]
  9. Washington, R.; Todd, M.C. Atmospheric controls on mineral dust emission from the Bodélé Depression, Chad: The role of the low level jet. Geophys. Res. Lett. 2005, 32, 1–5. [Google Scholar] [CrossRef]
  10. An, L.; Che, H.; Xue, M.; Zhang, T.; Wang, H.; Wang, Y.; Zhou, C.; Zhao, H.; Gui, K.; Zheng, Y.; et al. Temporal and spatial variations in sand and dust storm events in East Asia from 2007 to 2016: Relationships with surface conditions and climate change. Sci. Total Environ. 2018, 633, 452–462. [Google Scholar] [CrossRef]
  11. Xie, Y.; Liu, Z.; Wen, T.; Huang, X.; Liu, J.; Tang, G.; Yang, Y.; Li, X.; Shen, R.; Hu, B.; et al. Characteristics of chemical composition and seasonal variations of PM2.5 in Shijiazhuang, China: Impact of primary emissions and secondary formation. Sci. Total Environ. 2019, 677, 215–229. [Google Scholar] [CrossRef]
  12. Wu, J.; Kurosaki, Y.; Shinoda, M.; Kai, K. Regional Characteristics of Recent Dust Occurrence and Its Controlling Factors in East Asia. SOLA 2016, 12, 187–191. [Google Scholar] [CrossRef] [Green Version]
  13. Chen, Y.; Luo, B.; Xie, S. dong Characteristics of the long-range transport dust events in Chengdu, Southwest China. Atmos. Environ. 2015, 122, 713–722. [Google Scholar] [CrossRef]
  14. Mikami, M.; Shi, G.Y.; Uno, I.; Yabuki, S.; Iwasaka, Y.; Yasui, M.; Aoki, T.; Tanaka, T.Y.; Kurosaki, Y.; Masuda, K.; et al. Aeolian dust experiment on climate impact: An overview of Japan–China joint project ADEC. Glob. Planet. Chang. 2006, 52, 142–172. [Google Scholar] [CrossRef]
  15. Guo, J.; Lou, M.; Miao, Y.; Wang, Y.; Zeng, Z.; Liu, H.; He, J.; Xu, H.; Wang, F.; Min, M.; et al. Trans-Pacific transport of dust aerosols from East Asia: Insights gained from multiple observations and modeling. Environ. Pollut. 2017, 230, 1030–1039. [Google Scholar] [CrossRef] [PubMed]
  16. Grousset, F.E.; Ginoux, P.; Bory, A.; Biscaye, P.E. Case study of a Chinese dust plume reaching the French Alps. Geophys. Res. Lett. 2003, 30, 1277. [Google Scholar] [CrossRef]
  17. Young Jeong, G. Mineralogy and geochemistry of Asian dust: Dependence on migration path, fractionation, and reactions with polluted air. Atmos. Chem. Phys. 2020, 20, 7411–7428. [Google Scholar] [CrossRef]
  18. Chen, J.; Li, G.J. Geochemical studies on the source region of Asian dust. Sci. China Earth Sci. 2011, 54, 1279–1301. [Google Scholar] [CrossRef]
  19. Shao, L.Y.; Li, W.J.; Yang, S.S.; Shi, Z.B.; Lü, S.L. Mineralogical characteristics of airborne particles collected in Beijing during a severe Asian dust storm period in spring 2002. Sci. China Ser. D Earth Sci. 2007, 50, 953–959. [Google Scholar] [CrossRef]
  20. Shen, Z.; Caquineau, S.; Cao, J.; Zhang, X.; Han, Y.; Gaudichet, A.; Gomes, L. Mineralogical characteristics of soil dust from source regions in northern China. Particuology 2009, 7, 507–512. [Google Scholar] [CrossRef]
  21. Di Biagio, C.; Formenti, P.; Styler, S.A.; Pangui, E.; Doussin, J.F. Laboratory chamber measurements of the longwave extinction spectra and complex refractive indices of African and Asian mineral dusts. Geophys. Res. Lett. 2014, 41, 6289–6297. [Google Scholar] [CrossRef]
  22. Wainker, D.M.; Tackett, J.L.; Getzewich, B.J.; Liu, Z.; Vaughan, M.A.; Rogers, R.R. The global 3-D distribution of tropospheric aerosols as characterized by CALIOP. Atmos. Chem. Phys. 2013, 13, 3345–3361. [Google Scholar] [CrossRef] [Green Version]
  23. Wang, Z.; Uno, I.; Yumimoto, K.; Pan, X.; Chen, X.; Li, J.; Wang, Z.; Shimizu, A.; Sugimoto, N. Dust Heterogeneous Reactions during Long-Range Transport of a Severe Dust Storm in May 2017 over East Asia. Atmosphere 2019, 10, 680. [Google Scholar] [CrossRef] [Green Version]
  24. Ginoux, P.; Garbuzov, D.; Hsu, N.C. Identification of anthropogenic and natural dust sources using Moderate Resolution Imaging Spectroradiometer (MODIS) Deep Blue level 2 data. J. Geophys. Res. Atmos. 2010, 115, 5204. [Google Scholar] [CrossRef] [Green Version]
  25. Pierangelo, C.; Mishchenko, M.; Balkanski, Y.; Chédin, A. Retrieving the effective radius of Saharan dust coarse mode from AIRS. Geophys. Res. Lett. 2005, 32, 1–4. [Google Scholar] [CrossRef]
  26. Klüser, L.; Martynenko, D.; Holzer-Popp, T. Thermal infrared remote sensing of mineral dust over land and ocean: A spectral SVD based retrieval approach for IASI. Atmos. Meas. Tech. 2011, 4, 757–773. [Google Scholar] [CrossRef] [Green Version]
  27. Chen, S.Y.; Huang, J.P.; Li, J.X.; Jia, R.; Jiang, N.X.; Kang, L.T.; Ma, X.J.; Xie, T.T. Comparison of dust emissions, transport, and deposition between the Taklimakan Desert and Gobi Desert from 2007 to 2011. Sci. China Earth Sci. 2017, 60, 1338–1355. [Google Scholar] [CrossRef]
  28. Masiello, G.; Serio, C.; Venafra, S.; DeFeis, I.; Borbas, E.E. Diurnal variation in Sahara desert sand emissivity during the dry season from IASI observations. J. Geophys. Res. Atmos. 2014, 119, 1626–1638. [Google Scholar] [CrossRef] [Green Version]
  29. Ackerman, S.A. Remote sensing aerosols using satellite infrared observations. J. Geophys. Res. Atmos. 1997, 102, 17069–17079. [Google Scholar] [CrossRef]
  30. Crevoisier, C.; Clerbaux, C.; Guidard, V.; Phulpin, T.; Armante, R.; Barret, B.; Camy-Peyret, C.; Chaboureau, J.P.; Coheur, P.F.; Crépeau, L.; et al. Towards IASI-New Generation (IASI-NG): Impact of improved spectral resolution and radiometric noise on the retrieval of thermodynamic, chemistry and climate variables. Atmos. Meas. Tech. 2014, 7, 4367–4385. [Google Scholar] [CrossRef] [Green Version]
  31. Blumstein, D.; Chalon, G.; Carlier, T.; Buil, C.; Hebert, P.; Maciaszek, T.; Ponce, G.; Phulpin, T.; Tournier, B.; Simeoni, D.; et al. IASI instrument: Technical overview and measured performances. Infrared Spaceborne Remote Sens. XII 2004, 5543, 196. [Google Scholar] [CrossRef]
  32. Hilton, F.; Armante, R.; August, T.; Barnet, C.; Bouchard, A.; Camy-Peyret, C.; Capelle, V.; Clarisse, L.; Clerbaux, C.; Coheur, P.-F.; et al. Hyperspectral Earth Observation from IASI: Five Years of Accomplishments. Bull. Am. Meteorol. Soc. 2012, 93, 347–370. [Google Scholar] [CrossRef]
  33. Clerbaux, C.; Boynard, A.; Clarisse, L.; George, M.; Hadji-Lazaro, J.; Herbin, H.; Hurtmans, D.; Pommier, M.; Razavi, A.; Turquety, S.; et al. Atmospheric Chemistry and Physics Monitoring of atmospheric composition using the thermal infrared IASI/MetOp sounder. Atmos. Chem. Phys 2009, 9, 6041–6054. [Google Scholar] [CrossRef] [Green Version]
  34. Van Damme, M.; Clarisse, L.; Heald, C.L.; Hurtmans, D.; Ngadi, Y.; Clerbaux, C.; Dolman, A.J.; Erisman, J.W.; Coheur, P.F. Global distributions, time series and error characterization of atmospheric ammonia (NH3) from IASI satellite observations. Atmos. Chem. Phys. 2014, 14, 2905–2922. [Google Scholar] [CrossRef] [Green Version]
  35. Wei, S.-W.; Lu, C.-H.; Liu, Q.; Collard, A.; Zhu, T.; Grogan, D.; Li, X.; Wang, J.; Grumbine, R.; Bhattacharjee, P.S. The Impact of Aerosols on Satellite Radiance Data Assimilation Using NCEP Global Data Assimilation System. Atmosphere 2021, 12, 432. [Google Scholar] [CrossRef]
  36. Griffiths, P.R.; De Haseth, J.A. Fourier Transform Infrared Spectrometry, 2nd ed.; Wiley: Hoboken, NJ, USA, 2007; ISBN 978-0-471-19404-0. [Google Scholar]
  37. Bohren, C.F.; Huffman, D.R. Absorption and Scattering of Light by Small Particles; Wiley: Hoboken, NJ, USA, 1989; ISBN 047105772X. [Google Scholar]
  38. Bauduin, S.; Clarisse, L.; Theunissen, M.; George, M.; Hurtmans, D.; Clerbaux, C.; Coheur, P.F. IASI’s sensitivity to near-surface carbon monoxide (CO): Theoretical analyses and retrievals on test cases. J. Quant. Spectrosc. Radiat. Transf. 2017, 189, 428–440. [Google Scholar] [CrossRef]
  39. Clarisse, L.; Clerbaux, C.; Franco, B.; Hadji-Lazaro, J.; Whitburn, S.; Kopp, A.K.; Hurtmans, D.; Coheur, P.-F. A Decadal Data Set of Global Atmospheric Dust Retrieved From IASI Satellite Measurements. J. Geophys. Res. Atmos. 2019, 124, 1618–1647. [Google Scholar] [CrossRef] [Green Version]
  40. Piontek, D.; Bugliaro, L.; Kar, J.; Schumann, U.; Marenco, F.; Plu, M.; Voigt, C. The New Volcanic Ash Satellite Retrieval VACOS Using MSG/SEVIRI and Artificial Neural Networks: 2. Validation. Remote Sens. 2021, 13, 3128. [Google Scholar] [CrossRef]
  41. Zhou, D.K.; Smith, W.L.; Larar, A.M.; Liu, X.; Taylor, J.P.; Schlüssel, P.; Strow, L.L.; Mango, S.A. All weather IASI single field-of-view retrievals: Case study—Validation with JAIVEx data. Atmos. Chem. Phys. 2009, 9, 2241–2255. [Google Scholar] [CrossRef] [Green Version]
  42. Zhou, D.K.; Larar, A.M.; Liu, X.; Smith, W.L.; Strow, L.L.; Yang, P.; Schlüssel, P.; Calbet, X. Global land surface emissivity retrieved from satellite ultraspectral IR measurements. IEEE Trans. Geosci. Remote Sens. 2011, 49, 1277–1290. [Google Scholar] [CrossRef]
  43. Zhou, D.K.; Larar, A.M.; Liu, X. Monitoring surface climate with its emissivity derived from satellite measurements. Land Surf. Remote Sens. 2012, 8524, 55–61. [Google Scholar] [CrossRef] [Green Version]
  44. Zhou, D.K.; Larar, A.M.; Liu, X. Update on Iasi Emissivity Atlas. In Proceedings of the 19th International TOVS Study Conference (ITSC-19), Jeju Island, Korea, 26 March–1 April 2014. [Google Scholar]
  45. Huang, X.; Chen, X.; Zhou, D.K.; Liu, X. An Observationally Based Global Band-by-Band Surface Emissivity Dataset for Climate and Weather Simulations. J. Atmos. Sci. 2016, 73, 3541–3555. [Google Scholar] [CrossRef]
  46. Simms, J.E.; Berney, I.E.S.; Harrelson, D.W.; Corcoran, M.K.; Castellane, R.M. Analysis of Long Wave Infrared (LWIR) Soil Data to Predict Reflectance Response; Engineer Research And Development Center Vicksburg Ms Geotechnical And Structures Lab: Vicksburg, MS, USA, 2009. [Google Scholar]
  47. Herbin, H. Cloud Spectral Detection from IASI Using Principal Component Analysis. 2022; unpublished work. [Google Scholar]
  48. Formenti, P.; Schütz, L.; Balkanski, Y.; Desboeufs, K.; Ebert, M.; Kandler, K.; Petzold, A.; Scheuvens, D.; Weinbruch, S.; Zhang, D. Recent progress in understanding physical and chemical properties of African and Asian mineral dust. Atmos. Chem. Phys. 2011, 11, 8231–8256. [Google Scholar] [CrossRef] [Green Version]
  49. Journet, E.; Balkanski, Y.; Harrison, S.P. A new data set of soil mineralogy for dust-cycle modeling. Atmos. Chem. Phys. 2014, 14, 3801–3816. [Google Scholar] [CrossRef] [Green Version]
  50. Herbin, H.; Pujol, O.; Hubert, P.; Petitprez, D. New approach for the determination of aerosol refractive indices—Part I: Theoretical bases and numerical methodology. J. Quant. Spectrosc. Radiat. Transf. 2017, 200, 311–319. [Google Scholar] [CrossRef]
  51. Hubert, P.; Herbin, H.; Visez, N.; Pujol, O.; Petitprez, D. New approach for the determination of aerosol refractive indices—Part II: Experimental set-up and application to amorphous silica particles. J. Quant. Spectrosc. Radiat. Transf. 2017, 9, 37. [Google Scholar] [CrossRef]
  52. Deschutter, L.; Herbin, H.; Petitprez, D. Optical properties of Gobi dust and its pure compounds: Experimental extinction spectra and complex refractive indices determination. In Proceedings of the 23rd EGU General Assembly, Online, 19–30 April 2021; p. EGU21-2115. [Google Scholar]
  53. Romanias, M.N.; Zeineddine, M.N.; Gaudion, V.; Lun, X.; Thevenet, F.; Riffault, V. Heterogeneous Interaction of Isopropanol with Natural Gobi Dust. Environ. Sci. Technol. 2016, 50, 11714–11722. [Google Scholar] [CrossRef]
  54. Spitzer, W.G.; Kleinman, D.A. Infrared Lattice Bands of Quartz. Phys. Rev. 1961, 121, 1324. [Google Scholar] [CrossRef]
  55. Reig, F.B.; Adelantado, J.V.G.; Moya Moreno, M.C.M. FTIR quantitative analysis of calcium carbonate (calcite) and silica (quartz) mixtures using the constant ratio method. Application to geological samples. Talanta 2002, 58, 811–821. [Google Scholar] [CrossRef]
  56. Madejova, J.; Komadel, P. Baseline Studies of the Clay Minerals Society Source Clays: Infrared Methods. Clays Clay Miner. 2001, 49, 410–432. [Google Scholar] [CrossRef]
  57. Madejová, J.; Gates, W.P.; Petit, S. IR Spectra of Clay Minerals. In Developments in Clay Science; Elsevier: Amsterdam, The Netherlands, 2017; Volume 8, pp. 107–149. [Google Scholar]
  58. Green, D.; Schodlok, M. Characterisation of carbonate minerals from hyperspectral TIR scanning using features at 14 000 and 11 300 nm. Aust. J. Earth Sci. 2016, 63, 951–957. [Google Scholar] [CrossRef]
  59. Bishop, J.L.; King, S.J.; Lane, M.D.; Brown, A.J.; Lafuente, B.; Hiroi, T.; Roberts, R.; Swayze, G.A.; Lin, J.F.; Sánchez Román, M. Spectral Properties of Anhydrous Carbonates and Nitrates. Earth Sp. Sci. 2021, 8, e2021EA001844. [Google Scholar] [CrossRef]
  60. He, M.; Yan, W.; Chang, Y.; Liu, K.; Liu, X. Fundamental infrared absorption features of α-quartz: An unpolarized single-crystal absorption infrared spectroscopic study. Vib. Spectrosc. 2019, 101, 52–63. [Google Scholar] [CrossRef]
  61. Sokolik, I.N.; Toon, O.B. Incorporation of mineralogical composition into models of the radiative properties of mineral aerosol from UV to IR wavelengths. J. Geophys. Res. Atmos. 1999, 104, 9423–9444. [Google Scholar] [CrossRef]
  62. Bichon, J.; Lavancier, M.; Petitprez, D.; Deguine, A.; Hourlier, D.; Deboudt, K.; Herbin, H.; Ducournau, G.; Peretti, R.; Eliet, S. Complex refractive indices in the TeraHertz domain of samples from atmospheric aerosol sources. In Proceedings of the International Conference on Infrared, Millimeter, and Terahertz Waves, IRMMW-THz, Chengdu, China, 29 August–3 September 2021. [Google Scholar]
  63. Minamoto, Y.; Nakamura, K.; Wang, M.; Kawai, K.; Ohara, K.; Noda, J.; Davaanyam, E.; Sugimoto, N.; Kai, K. Large-scale dust event in East Asia in May 2017: Dust emission and transport from multiple source regions. Sci. Online Lett. Atmos. 2018, 14, 33–38. [Google Scholar] [CrossRef] [Green Version]
  64. Xuan, J.; Sokolik, I.N. Characterization of sources and emission rates of mineral dust in Northern China. Atmos. Environ. 2002, 36, 4863–4876. [Google Scholar] [CrossRef]
  65. Ginoux, P.; Prospero, J.M.; Gill, T.E.; Hsu, N.C.; Zhao, M. Global-scale attribution of anthropogenic and natural dust sources and their emission rates based on MODIS Deep Blue aerosol products. Rev. Geophys. 2012, 50, 388. [Google Scholar] [CrossRef]
  66. Plans for Metop-A End of Life|EUMETSAT. Available online: https://www.eumetsat.int/plans-metop-end-life (accessed on 16 December 2021).
  67. Wang, F.; Yang, T.; Wang, Z.; Cao, J.; Liu, B.; Liu, J.; Chen, S.; Liu, S.; Jia, B.; Chan, L.; et al. A Comparison of the Different Stages of Dust Events over Beijing in March 2021: The Effects of the Vertical Structure on Near-Surface Particle Concentration. Remote Sens. 2021, 13, 3580. [Google Scholar] [CrossRef]
  68. She, L.; Xue, Y.; Guang, J.; Che, Y.; Fan, C.; Li, Y.; Xie, Y. Towards a comprehensive view of dust events from multiple satellite and ground measurements: Exemplified by the May 2017 East Asian dust storm. Nat. Hazards Earth Syst. Sci. 2018, 18, 3187–3201. [Google Scholar] [CrossRef] [Green Version]
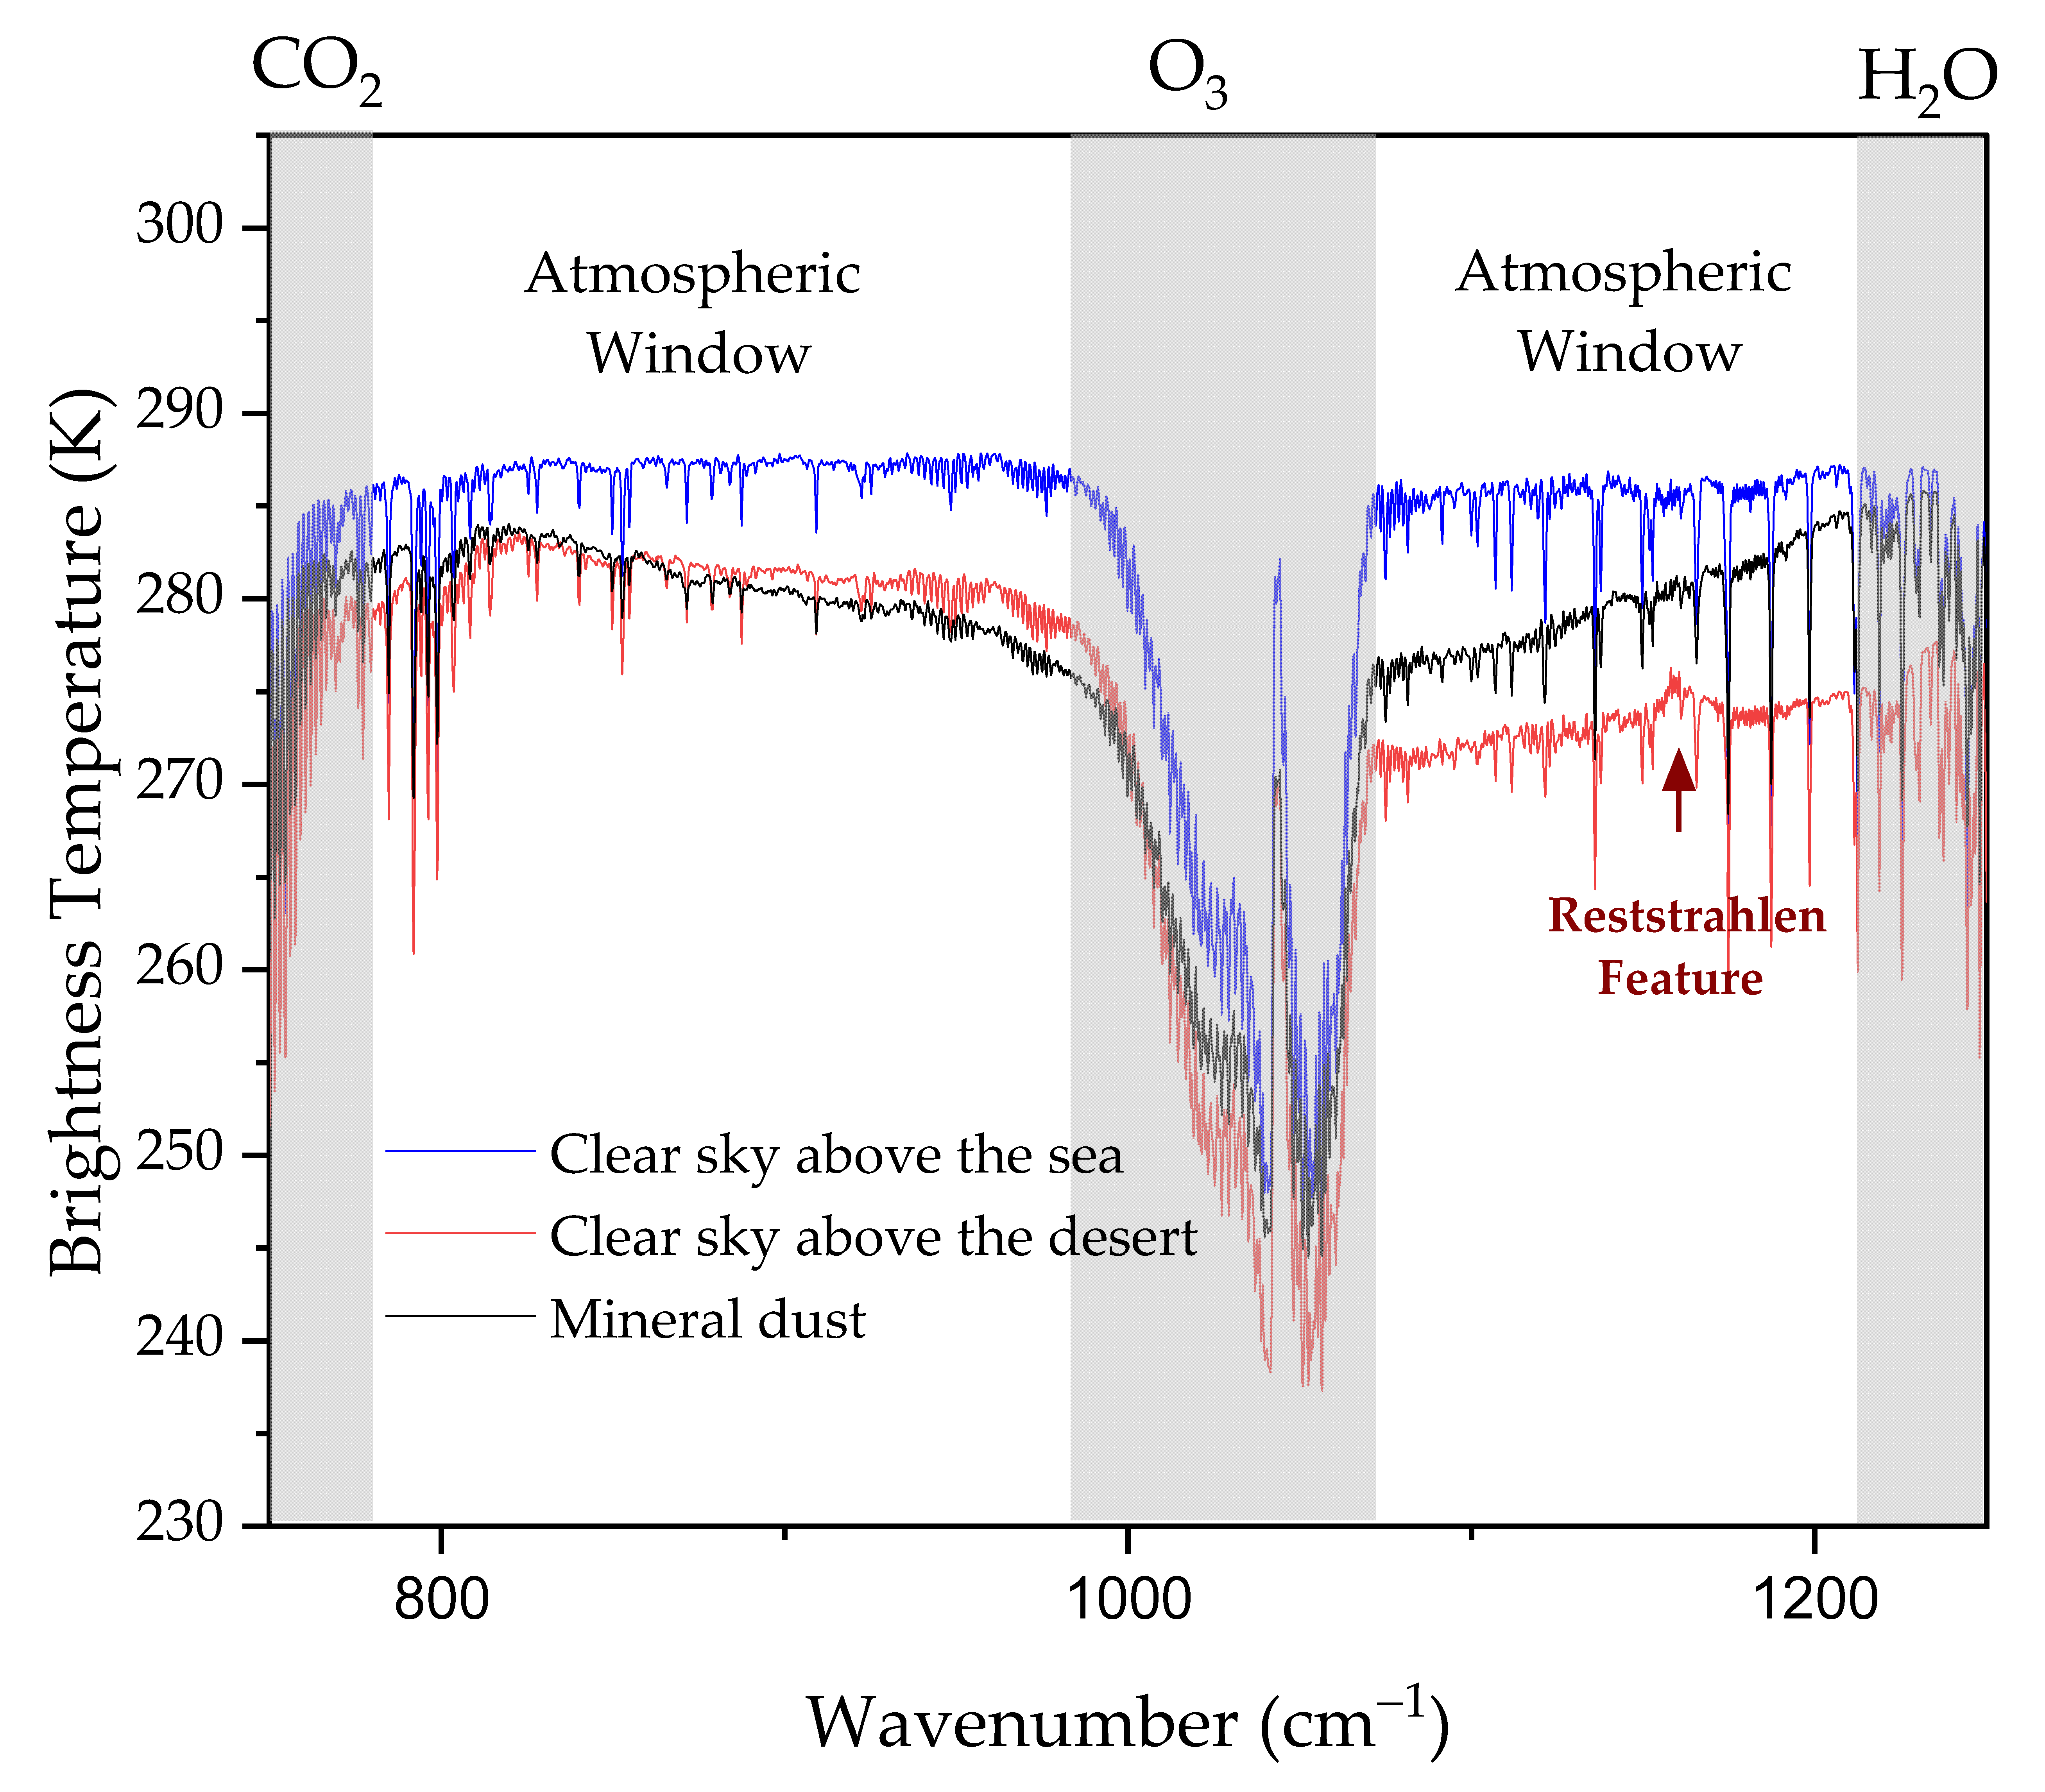
Figure 1. IASI detection spectra of a clear sky above the sea (in blue), a clear sky above the desert (in red) with a Reststrahlen feature, and mineral dust above the desert (in gray). Carbon dioxide, ozone, and water vapor absorption bands are presented in patterned regions, masking atmospheric detection.
Remotesensing 14 03422 g001
Figure 2. (a) Difference in the brightness temperature of the IASI dust selection during the dust storm on 4 May 2017, by day; (b) merged dark target/deep blue aerosol optical depth from MODIS/Terra on 4 May 2017 (https://worldview.earthdata.nasa.gov, accessed on 1 December 2021). The dashed black circle region presents the false aerosol detection region.
Remotesensing 14 03422 g002
Figure 3. (a) Topographic map of East Asia region with dashed black circles around the main desert sources; (b) mean monthly surface emissivity of four different surfaces during the month of May (Adapted with permission from Ref. [44], 2021, Daniel Zhou). The shaded orange box indicates the Reststrahlen region.
Remotesensing 14 03422 g003
Figure 4. Brightness temperature desert spectrum example before and after the LSE correction using a monthly average emissivity value (Adapted with permission from Ref. [44], 2021, Daniel Zhou).
Remotesensing 14 03422 g004
Figure 5. LSE correction scheme diagram.
Remotesensing 14 03422 g005
Figure 6. IASI spectral detection example for a clear sky above the sea compared to a clear sky above the desert and mineral dust detection before and after LSE optimization.
Remotesensing 14 03422 g006
Figure 7. Example optical thickness spectra of (a) a clear sky above the desert and (b) mineral dust above the desert before and after LSE correction.
Remotesensing 14 03422 g007
Figure 8. (a) IASI dust and cloud selection on 15 March 2021; (b) RGB Dust False-like SEVIRI from HIMAWARI (www.icare.univ-lille.fr, accessed on 1 December 2021).
Remotesensing 14 03422 g008
Figure 9. (a) The difference in the brightness temperature of the IASI dust selection after LSE optimization during the dust storm on 4 May 2017, in daytime. The dashed black circles present the removed false aerosol detection region. The orange line is the CALIOP orbit track, and the blue line is the CALIOP viewing section; (b) CALIOP-attenuated backscatter at 532 nm (www.icare.univ-lille.fr, accessed on 27 November 2021).
Remotesensing 14 03422 g009
Figure 10. Laboratory extinction coefficient by FTIR of (a) Gobi dust samples, with arrows indicating extinction peaks, and (b) normalized extinction coefficient to [0, 1] for the pure minerals quartz, illite, and calcite with their molecular assignments (Adapted with permission from Ref. [52]). Sym Str: symmetrical stretching; Asym Str: asymmetrical stretching; Bend: bending.
Remotesensing 14 03422 g010
Figure 11. Simulation of the linear combination of pure mineral coefficients (red) fitted with the experimental Gobi dust extinction spectrum (black) with the remaining residue from the simulation and experimental spectrum (gray) and the RMS (light gray envelope).
Remotesensing 14 03422 g011
Figure 12. The laboratory Gobi dust spectrum with the molecular assignment for each fingerprint is in black. Sym Str: symmetrical stretching; Asym Str: asymmetrical stretching; Bend: bending. The IASI spectral residue detection of the dust plume on 4 May 2017, at daytime after LSE correction, with mineralogical family assignment, is in blue. Tec: tectosilicates; Phy: phyllosilicates; Carb: carbonates.
Remotesensing 14 03422 g012
Figure 13. Simulation of the linear combination of pure mineral coefficients (red) fitted with the IASI dust optical thickness (blue) with the remaining residue from the simulation and experimental spectrum (gray) and the RMS (light gray envelope).
Remotesensing 14 03422 g013
Figure 14. Mineralogical mass weight maps of tectosilicates, phyllosilicates, and carbonates during the 3–6 May 2017 dust storm by day (D) and night (N) from IASI detections.
Remotesensing 14 03422 g014
Figure 15. HYSPLIT 24 h backward trajectory for different dust detections in dust storms on 5 May 2017 by night (https://www.ready.noaa.gov/index.php, accessed on 1 December 2021).
Remotesensing 14 03422 g015
Figure 16. Mineralogical extinction coefficient maps of tectosilicates, phyllosilicates, and carbonates on May 4 during the 2017 dust storm from IASI detection of METOP-A and METOP-B.
Remotesensing 14 03422 g016
Figure 17. Mineralogical mass weight maps of tectosilicates, phyllosilicates, and carbonates during the 14–18 March 2021 dust storm by day (D) and night (N) from IASI detections.
Remotesensing 14 03422 g017
Figure 18. HYSPLIT 24 h backward trajectory for different dust detections in dust storms on 17 March 2021 by day.
Remotesensing 14 03422 g018
Table 1. Molecular assignments of some minerals in TIR.
Mineral
Group
Mineral
Name
Molecular
Assignment
Central
Wavenumber   ( cm 1 )
References
TectosilicatesQuartzSi-O Symmetrical Stretching778, 795[54,55,60]
Si-O Asymmetrical Stretching1080, 1102, 1177
PhyllosilicatesIllite-O-H Bending916[56,57]
Si-O Asymmetrical Stretching1033
CarbonatesCalcite-C-O Asymmetrical Stretching879 to 904[58,59]
Table 2. Mean mineralogical values and STD of the three dust type sources in the dust storm of May 2017 in East Asia.
Mean Mass Weight per Half-Day (%)Mean RMSMean
τ 1072.5 cm 1
DateTecPhyCarb
IIIIIIIIIIIIIIIIIIIIIIIIIIIIII
3D52.023.5-43.070.4-5.06.1-0.0290.018-0.3570.706-
3N46.010.8-48.582.3-5.56.9-0.0170.018-0.4770.631-
4D55.420.2-39.574.3-5.15.5-0.0290.018-0.3680.555-
4N50.812.5-46.181.2-3.16.3-0.0140.015-0.5740.456-
5D37.920.327.555.474.167.36.75.65.20.0130.0210.0330.6670.6030.515
5N43.917.217.250.876.278.65.36.64.50.0150.0140.0080.4060.5390.529
6D57.023.523.438.469.872.94.66.73.70.0450.0150.0160.3250.7020.916
6N45.123.6-51.169.5-3.86.9-0.0140.016-0.4070.516-
Mean48.519.022.746.674.772.94.96.34.40.0220.0170.0190.4480.5890.653
STD6.04.74.25.64.64.61.00.50.60.0110.0020.0110.1110.0830.186
Table 3. The mean mineralogical values and STDs of the three dust type sources in the dust storm of March 2021 in East Asia.
Mean Mass Weight per Half-Day (%)Mean
RMS
Mean
τ 1072.5 cm 1
DateTecPhyCarb
IIIIIIIIIIIIIIIIIIIIIIIIIIIIII
14N-26.6--65.1--8.3--0.014--0.958-
15D-16.1--75.9--8.0--0.016--0.971-
15N-22.444.1-69.350.2-7.15.2-0.0170.010-0.6980.967
16D21.917.040.168.176.454.79.06.86.40.0200.0150.0110.8330.9430.72
16N-26.0--66.9--7.4--0.020--0.731-
17D23.823.6-68.869.9-7.46.4-0.0190.017-0.8920.976-
17N28.826.6-62.066.7-6.86.3-0.0250.016-0.7860.776-
18D26.824.4-67.069.4-6.26.2-0.0160.015-1.0241.002-
Mean25.322.842.166.570.052.57.47.15.80.0200.0160.0110.8840.8820.841
STD2.73.92.02.63.92.21.00.70.60.0040.0020.0110.0890.1170.124
Publisher’s Note: MDPI stays neutral with regard to jurisdictional claims in published maps and institutional affiliations.